
Abstract
Damage detection in a mechanical structure using ultrasonic guided waves becomes even more problematic when the effect of variation in environmental and operating conditions, such as mechanical noise, temperature, flow rate, inner pressure, etc. is taken into account. The variation in these environmental and operating conditions can degrade the accuracy of the damage inspection process. The basic purpose of current research work is to propose a finite element model–based simulation model to identify and estimate the influence of environmental temperature on the measured signal and meanwhile perceive the temperature invariant points to provide an optimal baseline for thermal attenuation in real-time ultrasonic guided wave inspections. This model signifies the variation in material elastic properties, thermal sensitivities, and the abrupt changes in group and phase velocities of S0 wave mode with temperature. A low bandpass filter is used to keep the excitation frequency in a certain range and remove the noise from it. The numerical investigation is achieved in
Keywords
Introduction
Identification and growth estimation of damage in specific mechanical structures have got significant attention in the last few decades to illustrate the structural designs. For this purpose, ultrasonic guided wave inspection is considered the most reliable structural health monitoring (SHM) technique because of its potential to exactly monitor the variation in material’s morphology and perform the inspection of the damaged area in a single test.1,2 In real-time practical inspections, there are still few problems that need to be solved, such as the sensitivity of guided waves to the variation in environmental and operating conditions (EOCs) including internal pressure, mechanical noise, temperature, humidity, flow rate etc. These EOCs not only affect the guided wave velocity and its amplitude during SHM but also cause the minute flaws in the examined structure.3,4
Variation in EOCs is one of the major issues to implement active SHM approach for in-service devices because these changes interrupt the SHM system’s response and degrade the performance of damage diagnosis. 5 In order to identify and localize the damage correctly in practical applications, there is a need to understand the significance of EOCs’ impact on the measured signal. Since temperature is the main environmental condition in an SHM system, analyzing how temperature variation affects the recorded wave signal has attracted many researchers’ interest. 6
Furthermore, data regarding the combined effect of several EOCs have been found to be very less in literature. To reduce the environmental temperature variations while maintaining the mechanical system reliability, three important design assumptions – safe-life, fail-safe, and damage-tolerant – should be ensured. 7 In the case of the damage-tolerant design approach, structures should be modelled to resist the damage up to a specific size and certain limit of operating thermal conditions, and meanwhile pass through the regular inspection process.
Previous research has demonstrated that mostly fluctuations in the measured signal are due to change in environmental temperature that needs to be addressed.8–10 There are several parameters which stimulate this effect, such as variation in thermal expansion and stiffness of the examined material, change in conductivity of bonding materials including transducers, and sensors. The impact of environmental temperature on the measured signal is mainly considered in the change of amplitude, phase, and time shift.11,12 Sharma et al. 13 analytically investigated the thermal effect on guided waves for the first time in that research field and presented an analytical model; however, all the material properties were supposed to be constant in their proposed model. Konstantinidis et al. 14 highlighted the temperature effect on time and frequency shift of response signal through experimental investigation of aluminium plate. Three reasons can be attributed for the fluctuation in time shift, including thermal expansion/contraction of the examined material, change in Young’s modulus, and the temperature-induced variations in transducers and their bonds. Raghavan and Cesnik15,16 utilized surface-bonded piezoelectric wafer transducers and suitable bonding agent for the SHM of internal spacecraft structures operating in a temperature range of 20°C to 150°C. However, it became difficult to identify and characterize the damage above 80°C. This problem highlighted the sensitivity of elastic modulus of a metallic surface to the temperature and weaker sensor sensitivity beyond 130°C. Hence, certain methods are required to improve the sensitivity of sensors at a higher temperature and higher frequencies.
Park and Jun 17 introduced a simple approach to apply guided wave SHM for the damage inspection in the presence of temperature variations. To evaluate the usefulness of the proposed technique, delamination due to low-velocity impact on composite plate sample was identified. However, this approach cannot be adopted to deal with complex scenarios during damage inspection. To minimize the effects of environmental temperature during SHM, some approaches have been presented in Croxford et al. 18 It is possible to minimize the temperature effect on transducers through a precise selection of bonding material; however, it is very difficult to control the variation in the density and elastic properties of the examined specimen. These variations in material properties not only influence the phase of received signal but also alter its amplitude. 19 Dan et al. 20 developed a compensation model named equivalent wave method (EWM) to study the effect of temperature on Lamb waves. It helps to estimate the response of the Lamb wave in the presence of temperature without prior knowledge of the temperature dependencies of the material properties. It has been observed that the modification of the thermally-induced phase distortion in the proposed model only provides the essential level of compensation for an S0–based damage inspection. However, the model needs to be completed with the amplitude adaptation to process the more sensitive A0 mode and to achieve the optimal SHM results.
Effect of thermal load on the dispersion curves was studied by Gandhi and Michaels 21 using perturbation theory. Since most of the analyses were based on numerical evaluation until 2012, Dodson 22 analytically investigated the variation in dispersion curves. The group velocity of S0 mode is extremely affected by the variation in temperature. To overcome the limitation of guided waves in variant environments, several methods have been developed as compensatory approaches to optimize the inspection performance. 23 Optimal baseline selection (OBS) and baseline signal stretch (BSS) are two famous approaches to predict the effect of thermal load on the measured signal by considering the knowledge of signal processing.6,18 The methodology of BSS method consists of stretching the propagating wave signal and varying its amplitude, while OBS utilizes multiple baseline wave signals recorded over a specific range of temperature. Croxford et al. 19 used both methods in their research and recommended that temperature compensation can be achieved in a convincing manner by using the combination of OBS and BSS during inspection process. Park and Jun 24 implemented the BSS approach to identify the changes in a composite structure because of thermal load and considered the linear behaviour for the amplitude variation and stretch factor of wave signal. Lu et al. 25 presented an improved temperature compensation technique by modifying each step of the original method (OBS followed by signal stretching). The results of the measured signals with the new method are more reliable for both the undamaged and damaged cases. All characteristics of modified method contributed to the better performance except the time domain stretch algorithm. In order to anticipate the propagating signal at lower temperatures using the time signal at 25°C, the BSS method has been improved and practically implemented using different stretch factors. Results verify that BSS with mode decomposition (MD) shows slightly better performance than BSS with one stretch factor. 26
Despite numerous methodologies in literature, however, it has been summarized that it is not possible to completely manipulate the effect of temperature in SHM, and there is still need of further improvements and authentic model to identify and estimate the thermal sensitivity of ultrasonic guided waves. Therefore, the interpretation of temperature effect on the guided wave propagation in real-time practical inspections through an authentic model is necessary to achieve optimum results.
In current research work, a simulation model has been developed in
Thermal sensitivity evaluation
The research work presented in this paper is achieved using a mix of finite element analysis (FEA) in ABAQUS/CAE, MATLAB, analytical estimation, and experiment test. A stainless-steel beam of 304-grade with crack is used to evaluate the thermal sensitivity of ultrasonic guided waves during SHM. As grade 304 belongs to the standard “18/8” of the stainless family, it is selected in this research to achieve desired results. Moreover, its availability in several configurations and finishes than any other grade of stainless steel has made it a more significant material. Because of its excellent thermal resistance, high toughness, and balanced austenitic structure, 304-grade stainless steel is usually used in industrial, medical, transportation, and architectural applications.
To evaluate thermal sensitivity, a finite element model (FEM) of a stainless-steel beam with fatigue crack was developed in
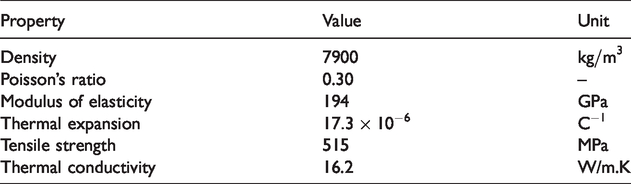
The methodology of our work and elastic properties of the 304-grade stainless steel are illustrated in Figure 1 and Table 1, respectively.
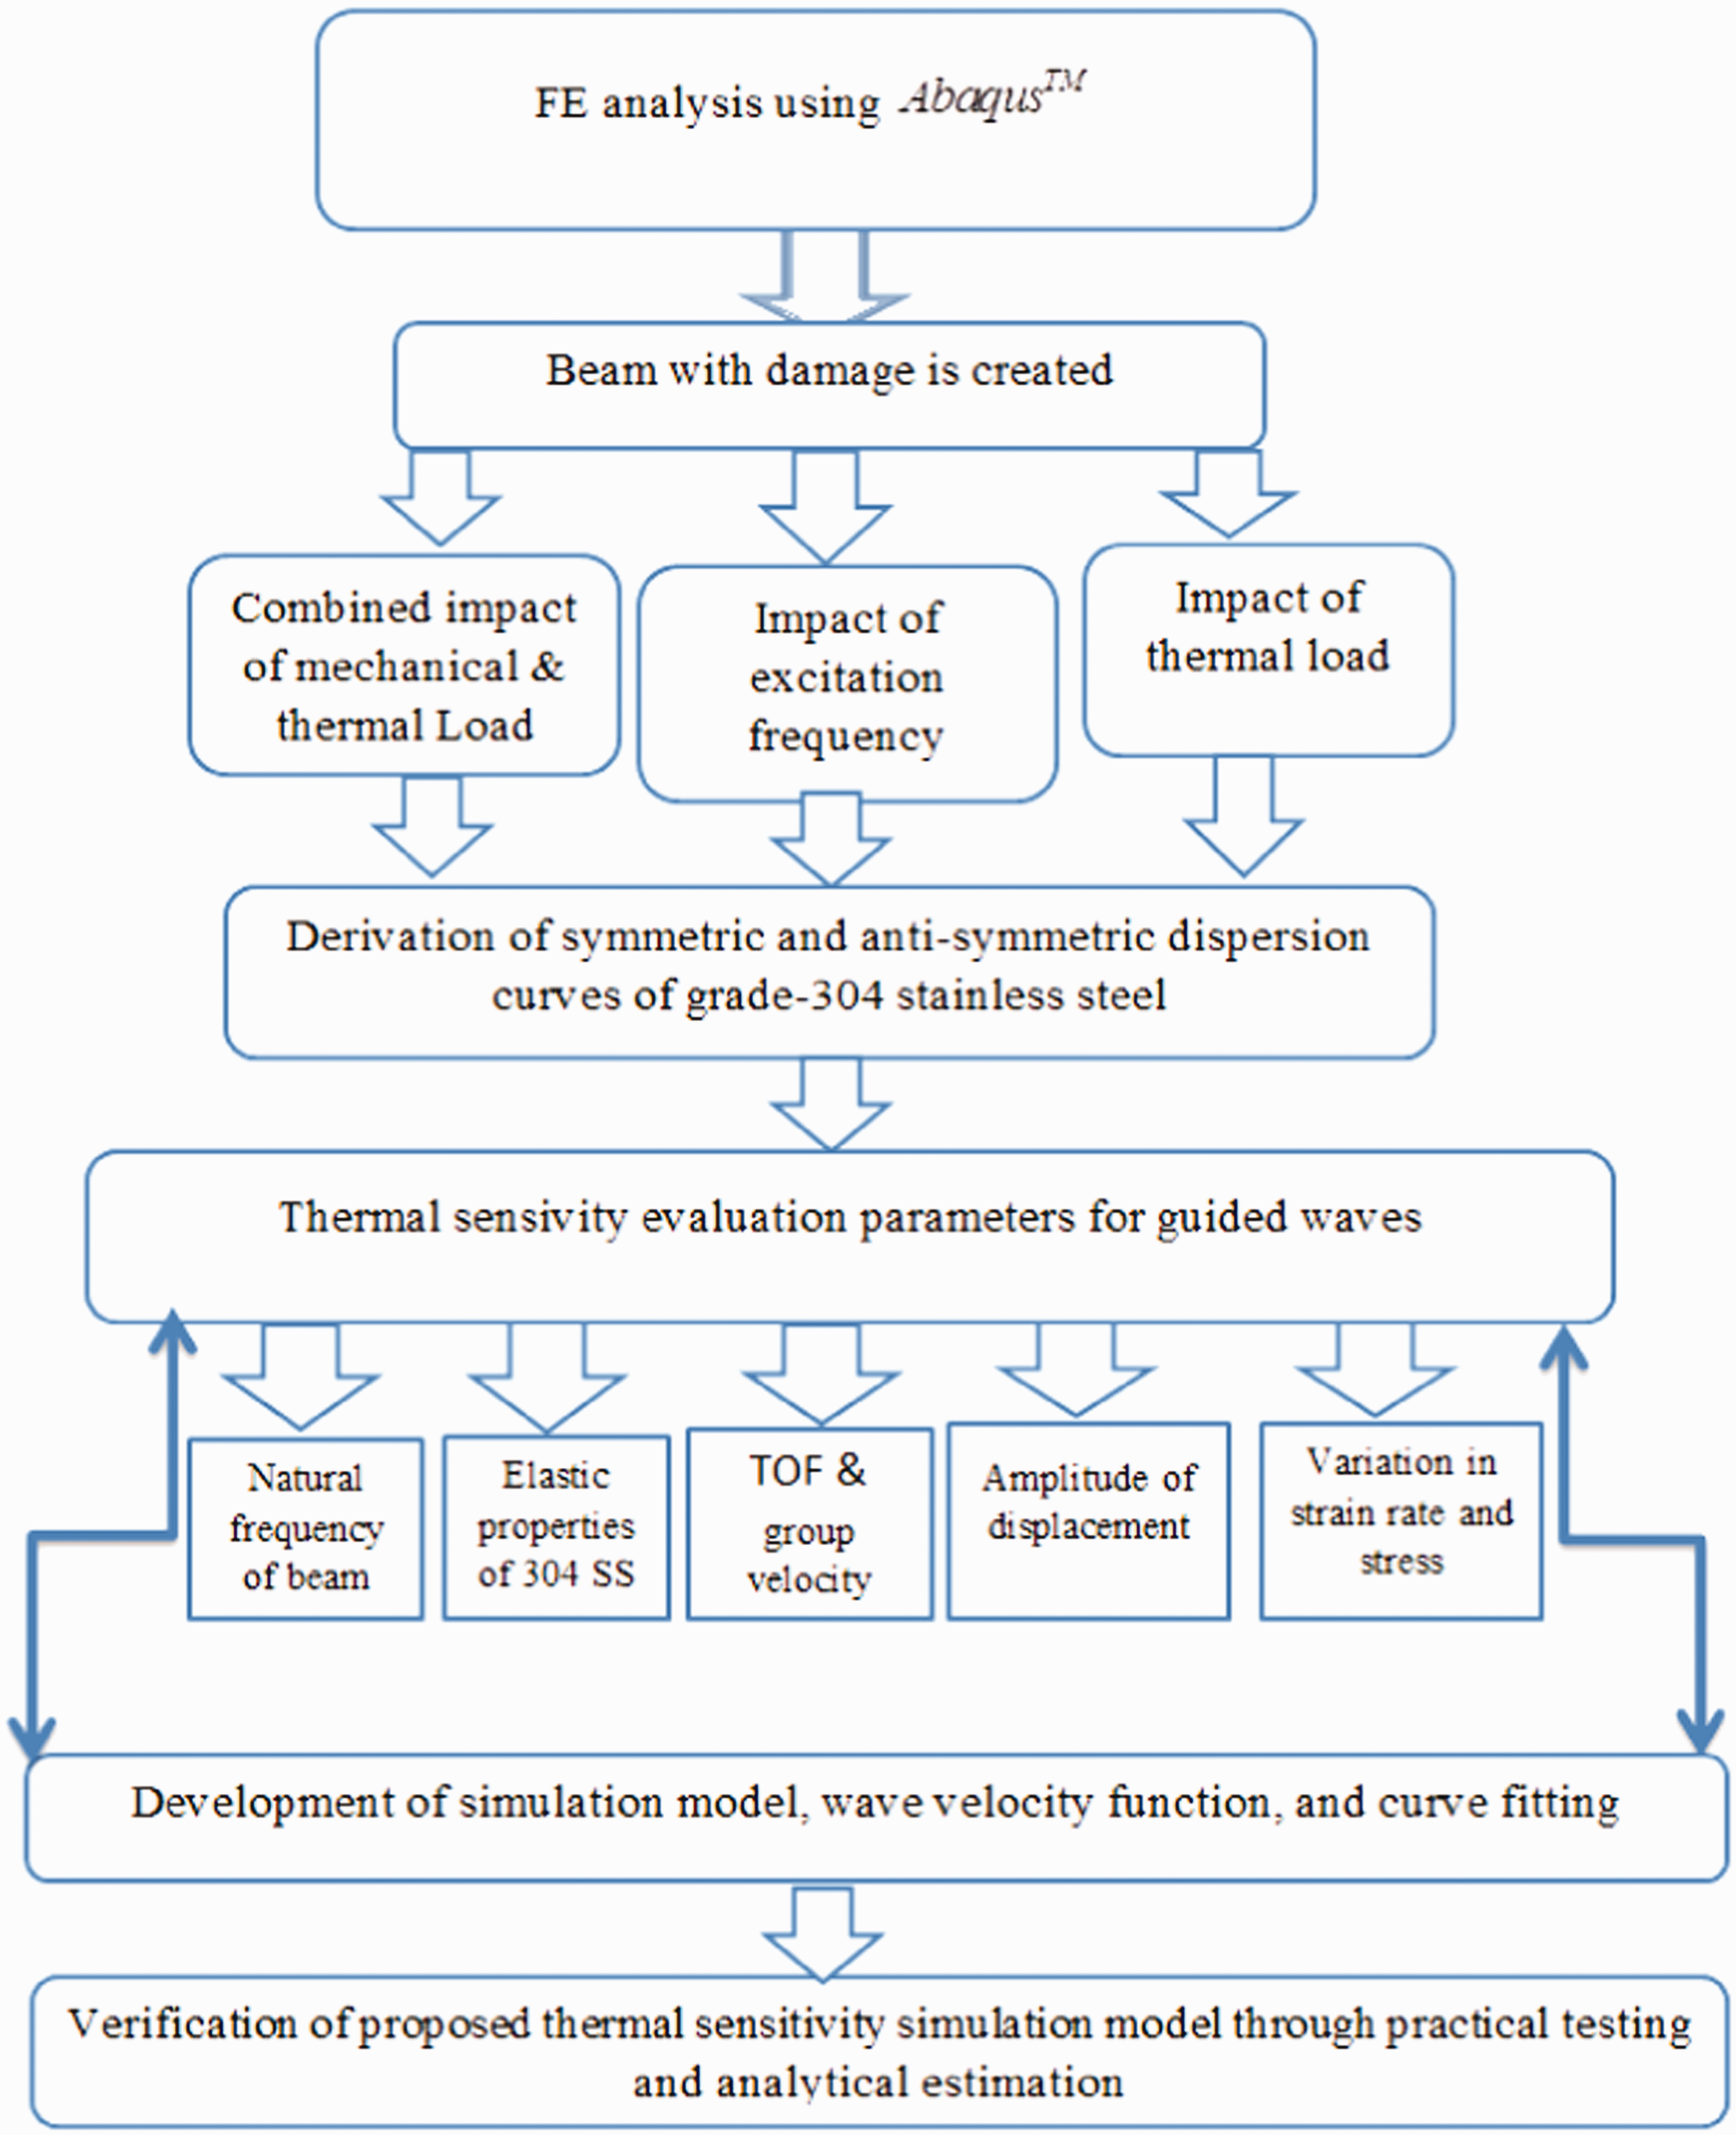
Methodology of the thermal sensitivity simulation model.
Elastic properties of stainless steel-grade 304.
Numerical analysis and analytical estimation
In order to illustrate the precision in the use of sensor and actuator network, numerical simulation model incorporated with accurate material data was developed using ABAQUS/CAE and MATLAB. Analytical estimation was performed to evaluate the impact of thermal load on the stainless-steel beam and verify the proposed thermal sensitivity simulation model. The current section represents the description of the procedure of the numerical analysis and analytical modelling.
Finite element modeling
Finite element modelling is a useful technique to analyze and design a structure. In the recent study, a simulation was carried out in
Process diagram of the simulation model.
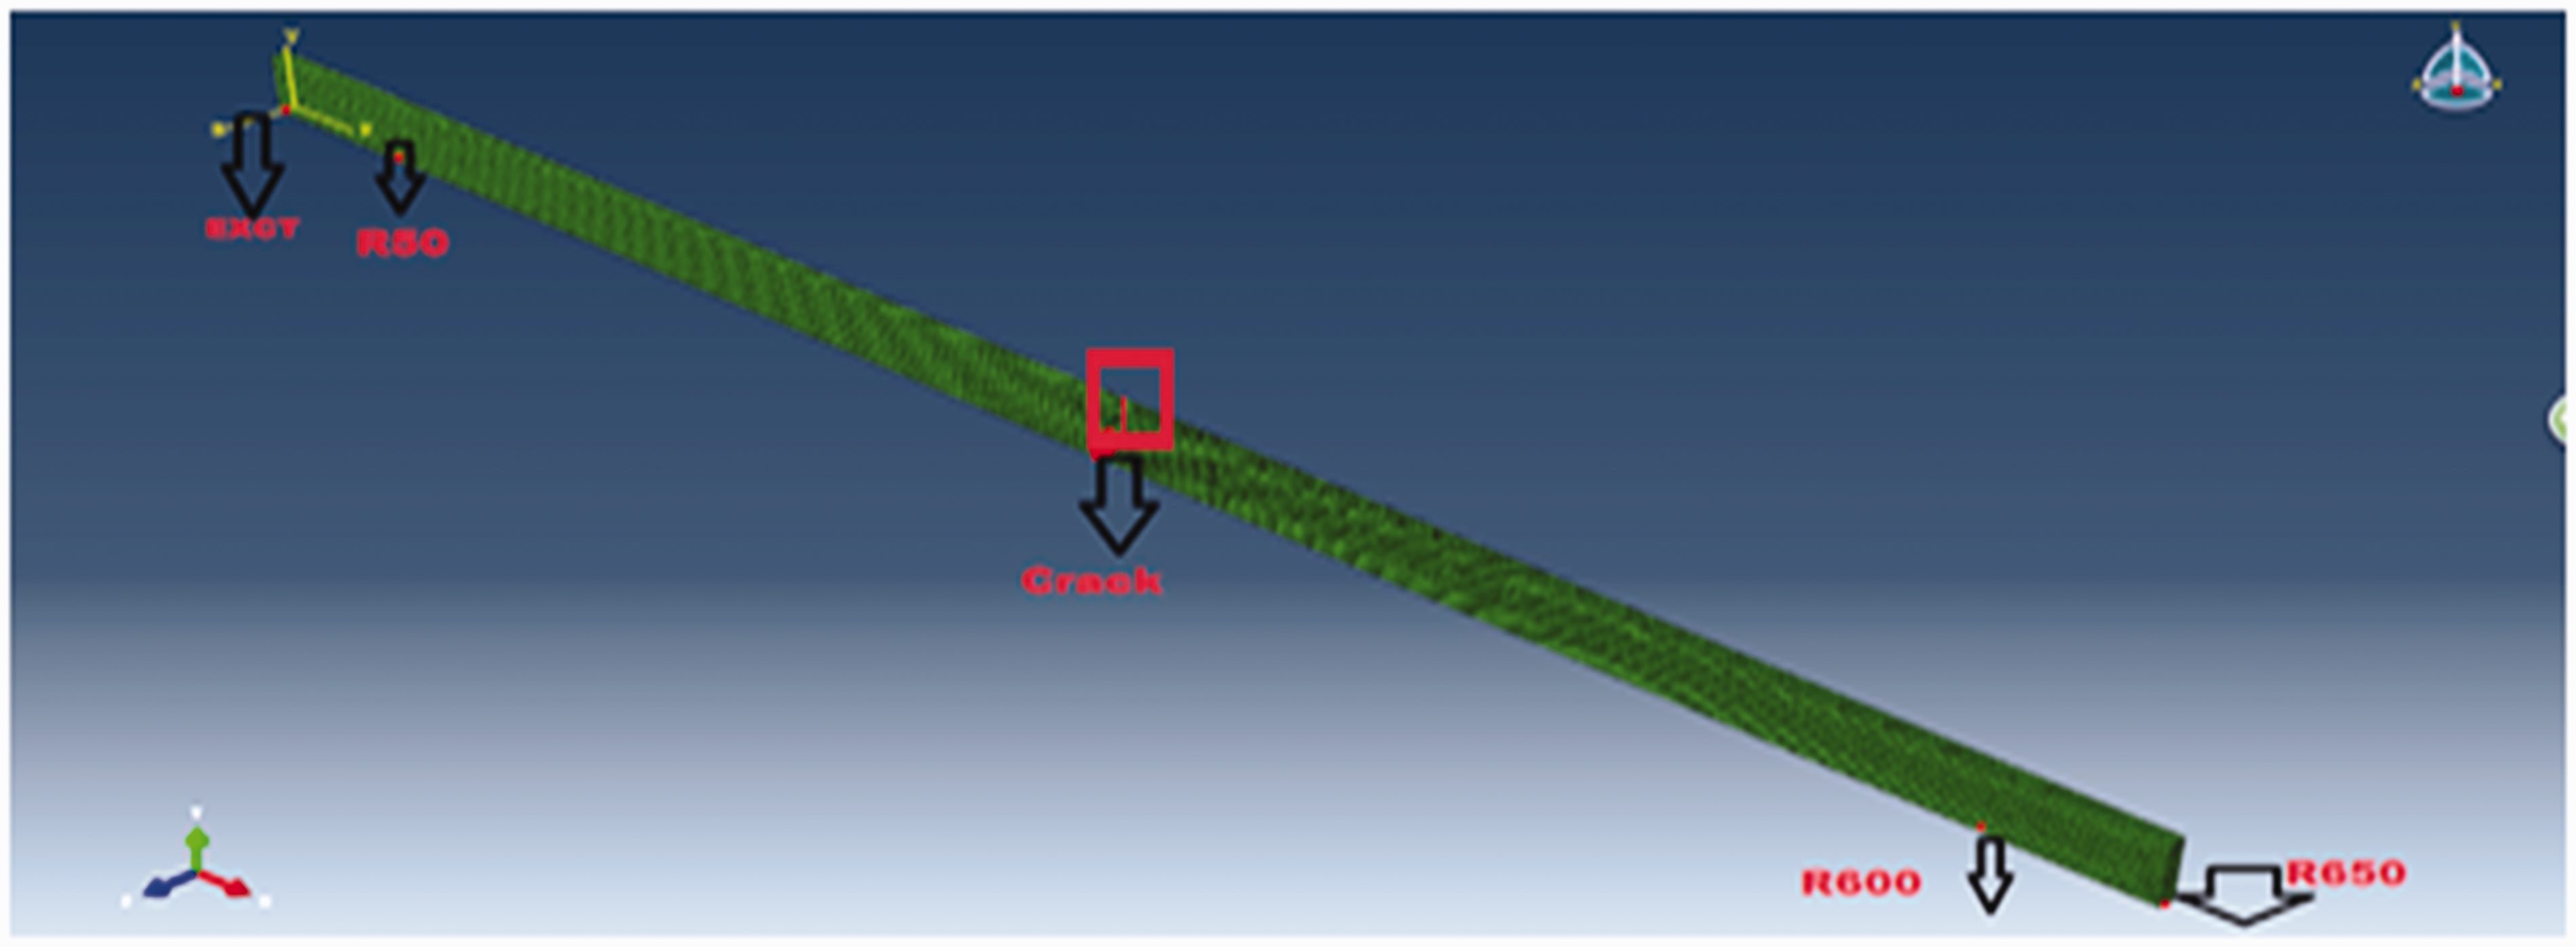
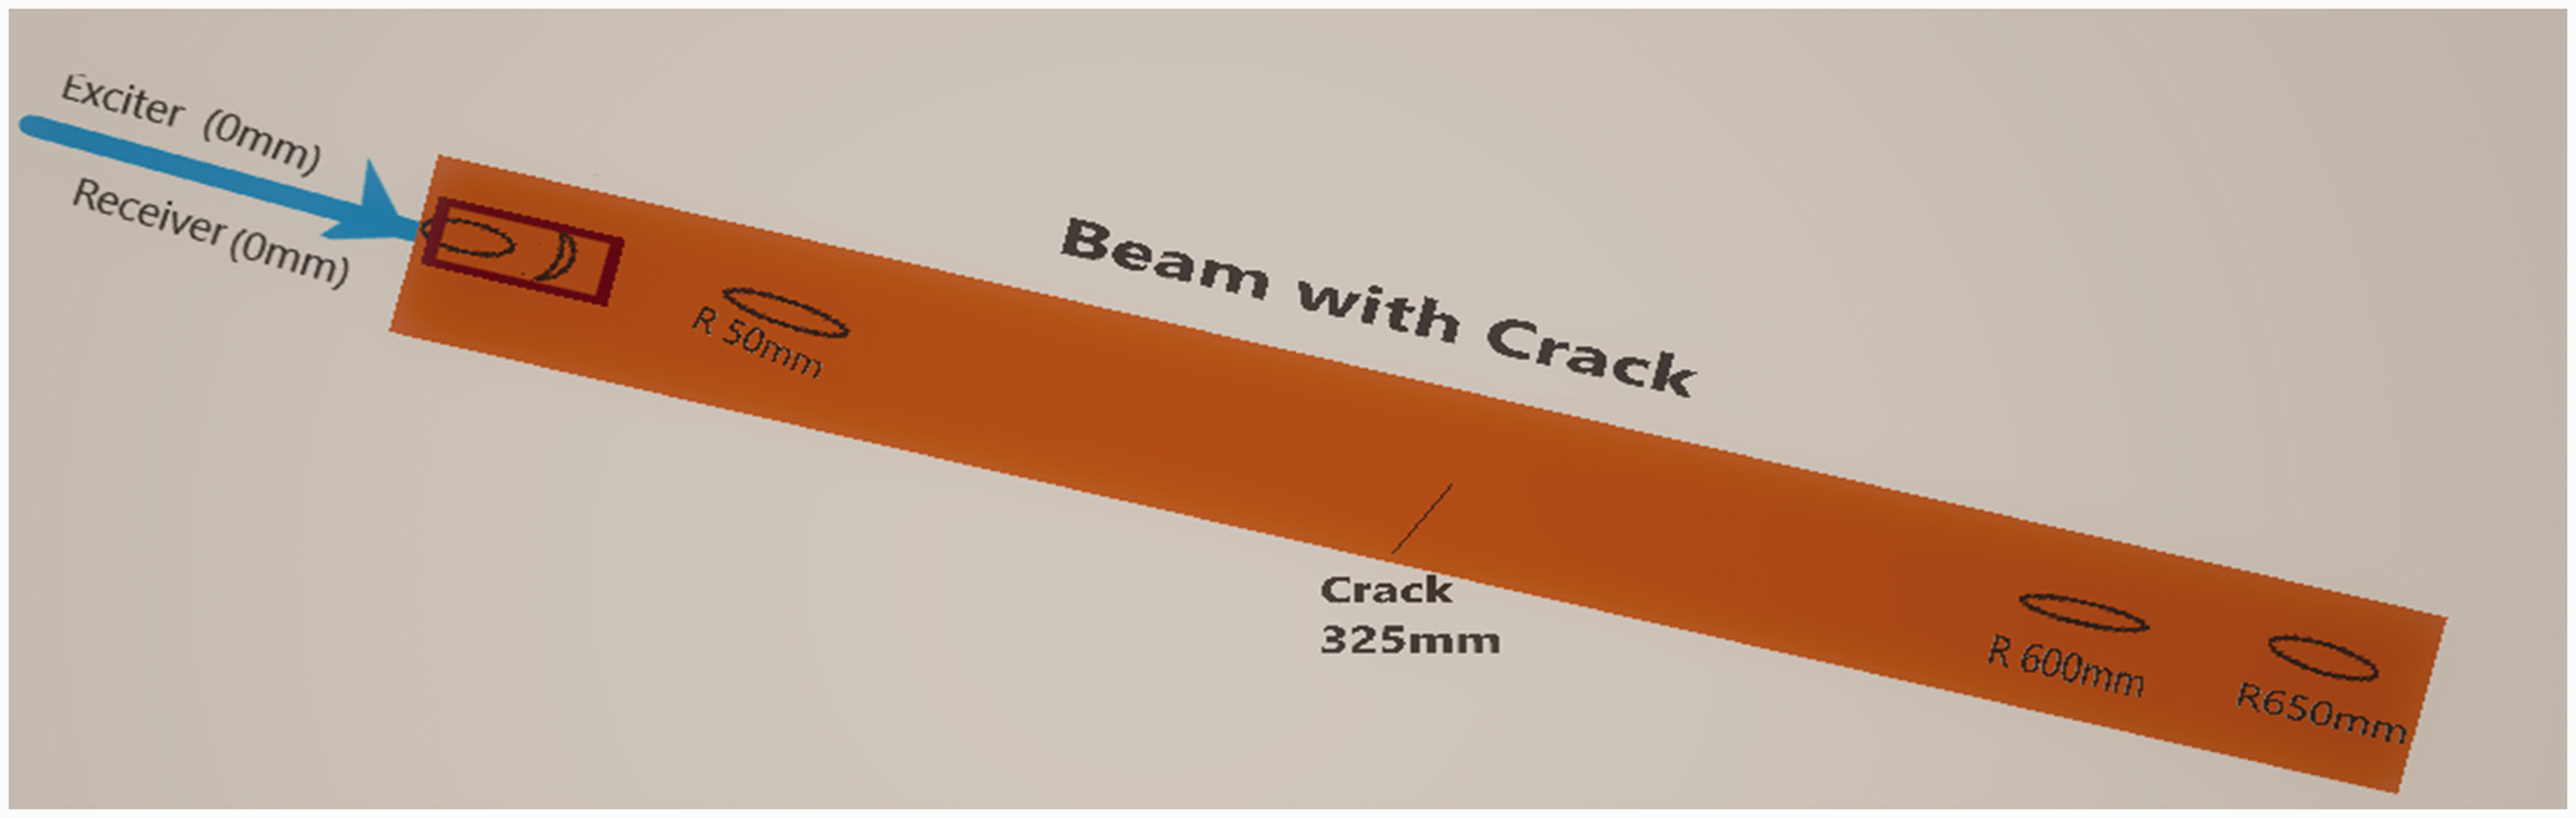
Beam geometry with fatigue crack and sensor-actuator network.
Figure 2 describes the basic phenomenon of guided wave propagation for crack detection through sensor and actuator network in the beam. It highlights the exact location of the sensors. The total length of the beam is 650 mm. A fatigue crack with the length of 10 mm is generated in the middle of the beam at 325 mm. The exciter is located at 0 mm and four receivers are located at 0 mm, 50 mm, 600 mm, and 650 mm, respectively, to record the signal containing the information about the crack presence, dispersion effect, and environmental temperature. In Figure 3, arrows highlight the location of exciter, receivers, and crack in beam geometry. A low bandpass filter was used to keep the excitation frequency in a certain range and remove the noise from it. A filtered signal of 100 kHz is shown in Figure 4.
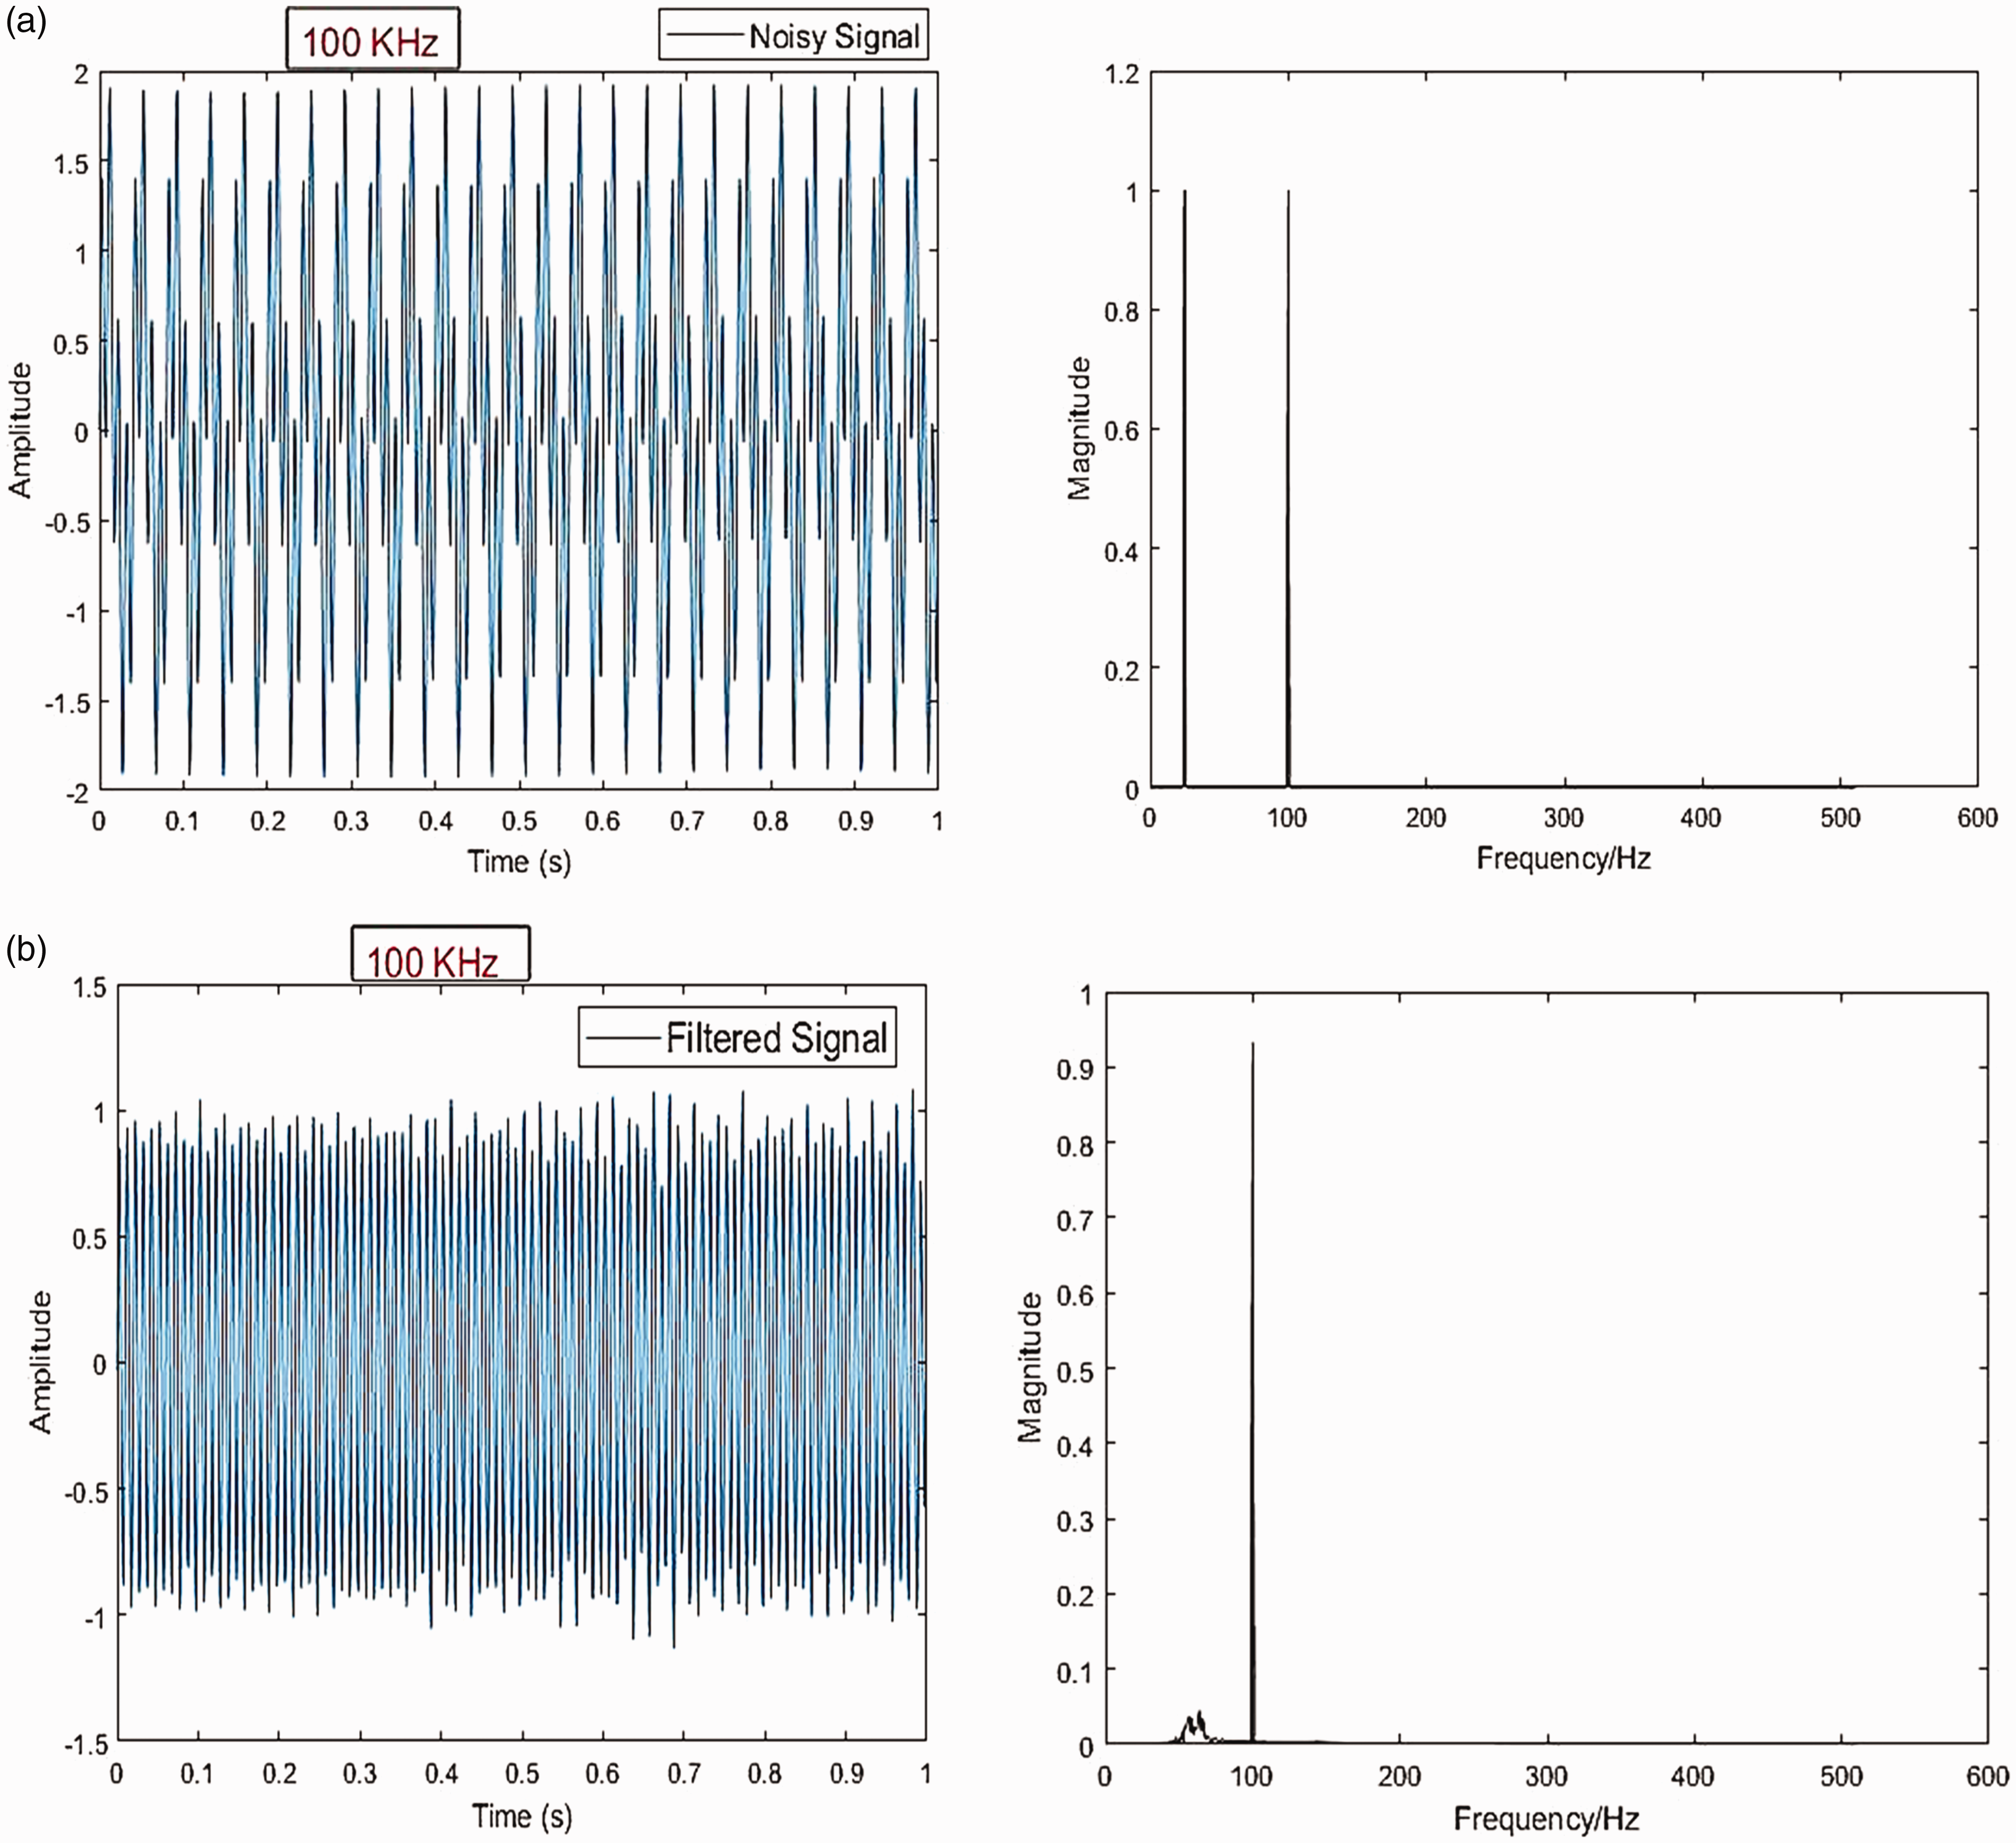
Low bandpass filter to attenuate noise from 100 kHz signal. (a) Noisy signal and (b) Filtered signal.
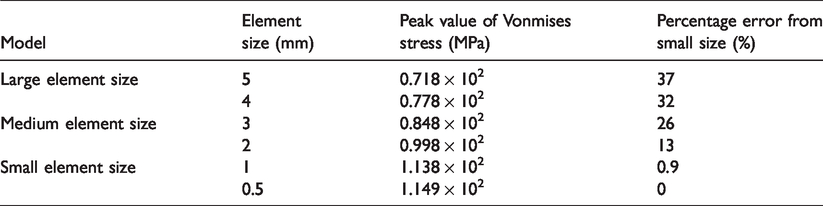
In the proposed simulation model, the thermal load is a load on beam induced by changes in temperature and it is considered one of the varying environmental factors. The whole analysis is based on uniform increment in temperature to obtain more authentic details on how the wave velocity and amplitude of guided wave signals change with temperature. Mechanical load of 50 N is applied in the form of concentrated force and pressure along the longitudinal axis. It is considered a pre-stressed effect which influences the dispersion curves because of the acoustoelastic. It generates the strain along the direction of propagation and changes the initially isotropic medium into a slightly anisotropic one. 27 In FEA, the reliability of the result is determined by the size of the mesh. According to the theory of FEA, a finite model with small element size yields higher accuracy as compared to the model with a large element size. 28 So the optimal value for the mesh size will be obtained by analyzing the effect of mesh sensitivity on the FEM results. To this purpose, several analyses have been performed in the current numerical investigation to set the different mesh size during guided wave propagation and then response of each wave is recorded. To compare the mesh size pattern of different FEA results and ensure the right mesh setting, mesh independence analysis (MIA) is utilized in this study. MIA offers several techniques and mathematics to compare how FEA results vary with mesh size and give us confidence to set the accurate limit of each analysis. It is easy to identify good mesh setting by comparing different mesh sizes. The results are presented in Table 2.
Comparison of peak values of Vonmises stress for different element sizes.
Mesh sensitivity in term of Vonmises stress at different element size is illustrated in Figure 5.
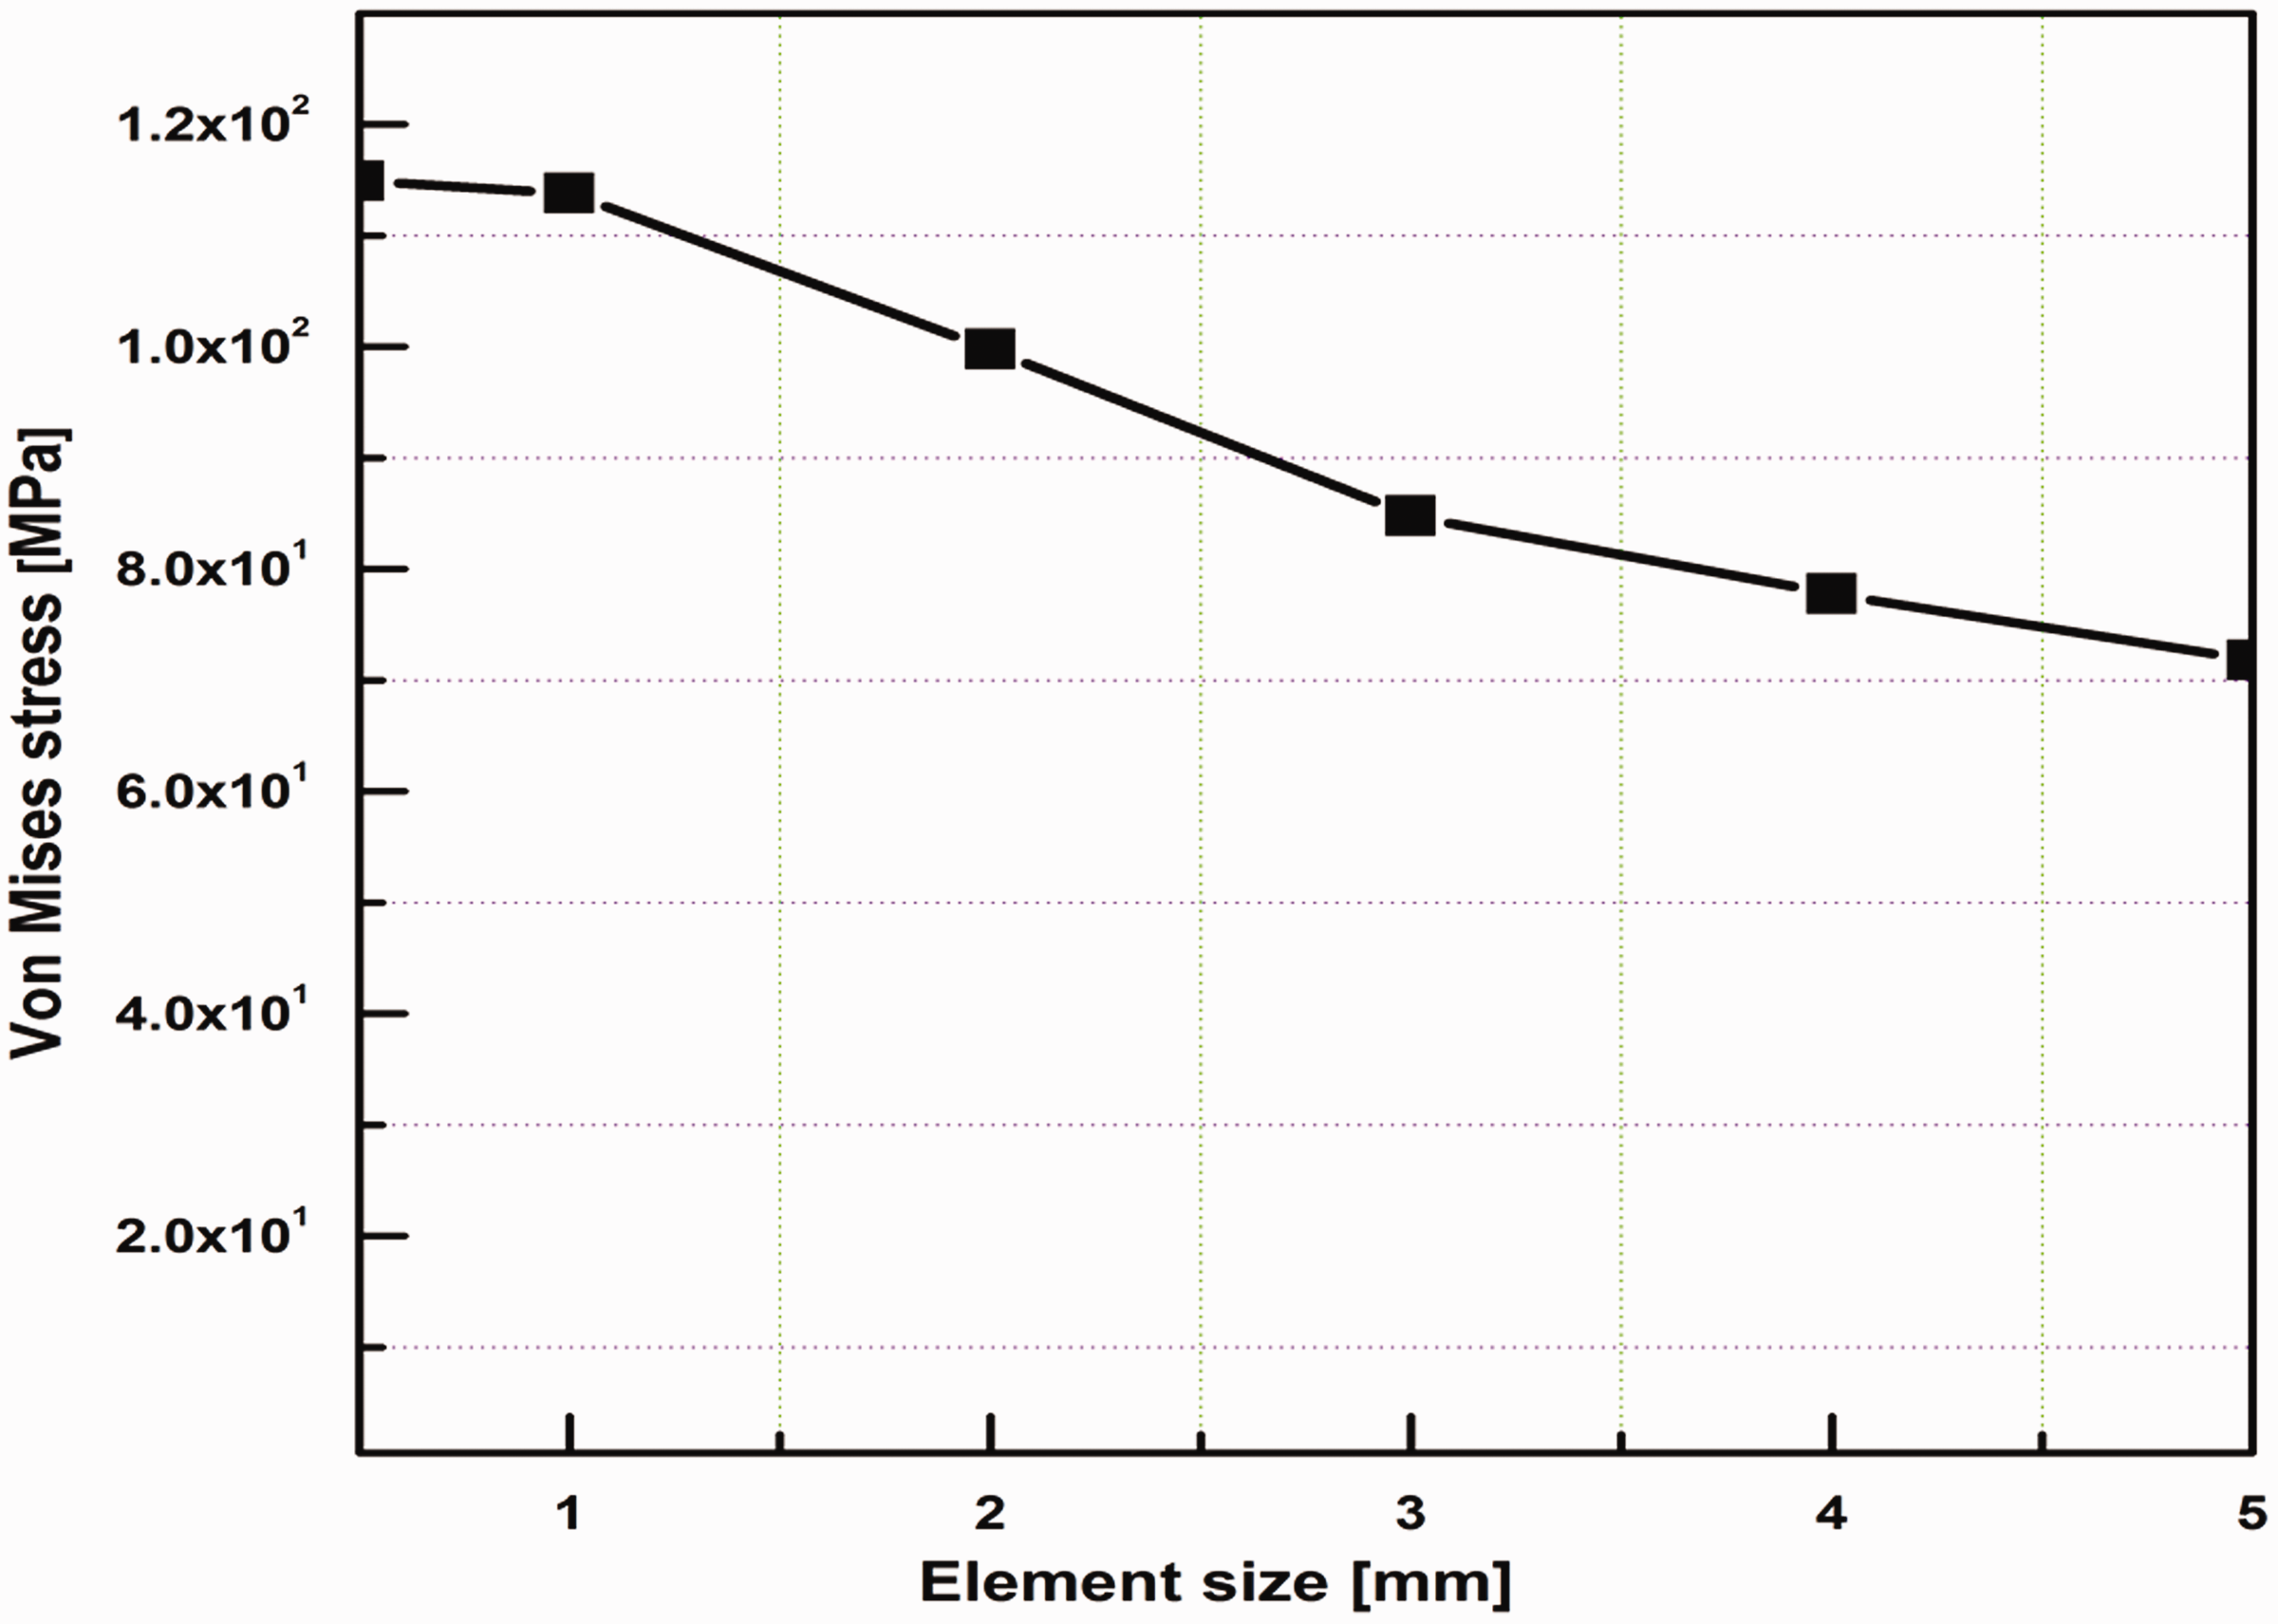
Mesh sensitivity in term of Vonmises stress at different element size.
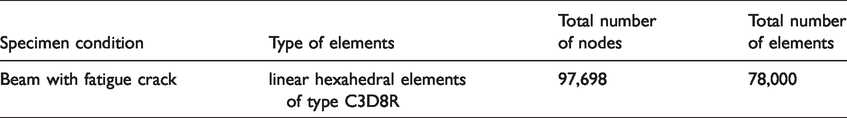
In Figure 5, results demonstrate a definite trend. It is clear that as mesh element size increases, the peak value of Vonmises stress decreases. It can also be noticed that the variation in results is minute when the mesh element size is less than 1 mm. So we can locate this region as a state of mesh independence. Hence this comparison verifies that mesh element size of 0.5 mm or 1 mm will not change current FEA results and further diminution of mesh element below this critical size will affect the accuracy of FEA results. Table 3 characterizes the type of elements, the total number of nodes, and elements that are used in the meshing of the present simulation model.
The type of elements, the total number of nodes, and elements generated in the simulation model.
FE analysis of all three parts (mentioned before) and the difference in crack breathing (opening and closing) are illustrated in Figures 6 to 8, respectively.
Figure 7 reveals the maximum crack width under the combined effect of excitation frequency of 175 kHz with mechanical and thermal load, and meanwhile verifies the impact of thermal load on the material internal structure. The final thermal sensitivity simulation model is proposed based on FE results of different parameters mentioned in Figure 1.
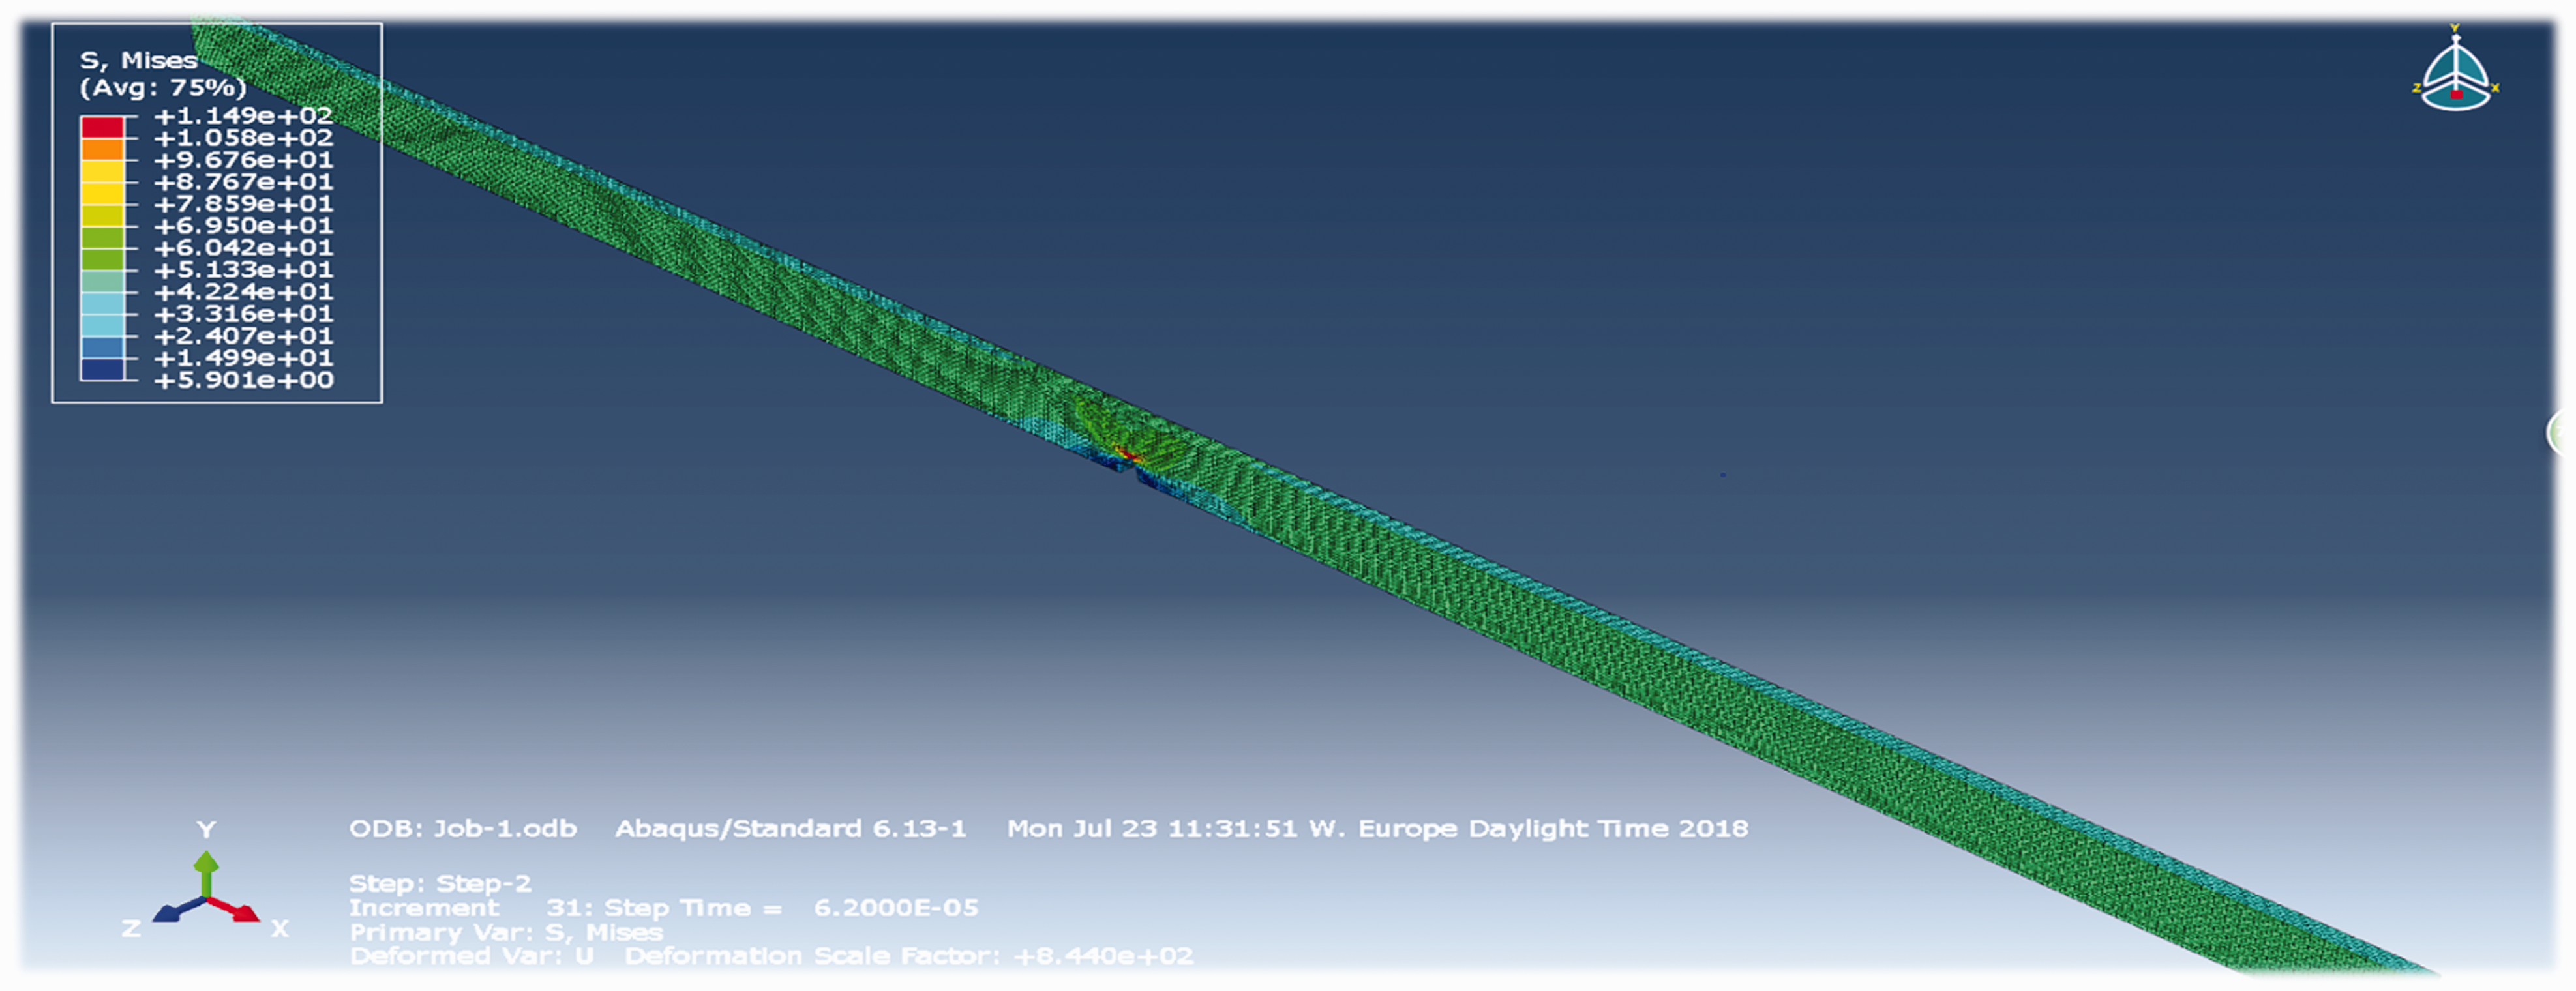
The combined impact of 100 kHz excitation frequency with thermal and mechanical load.
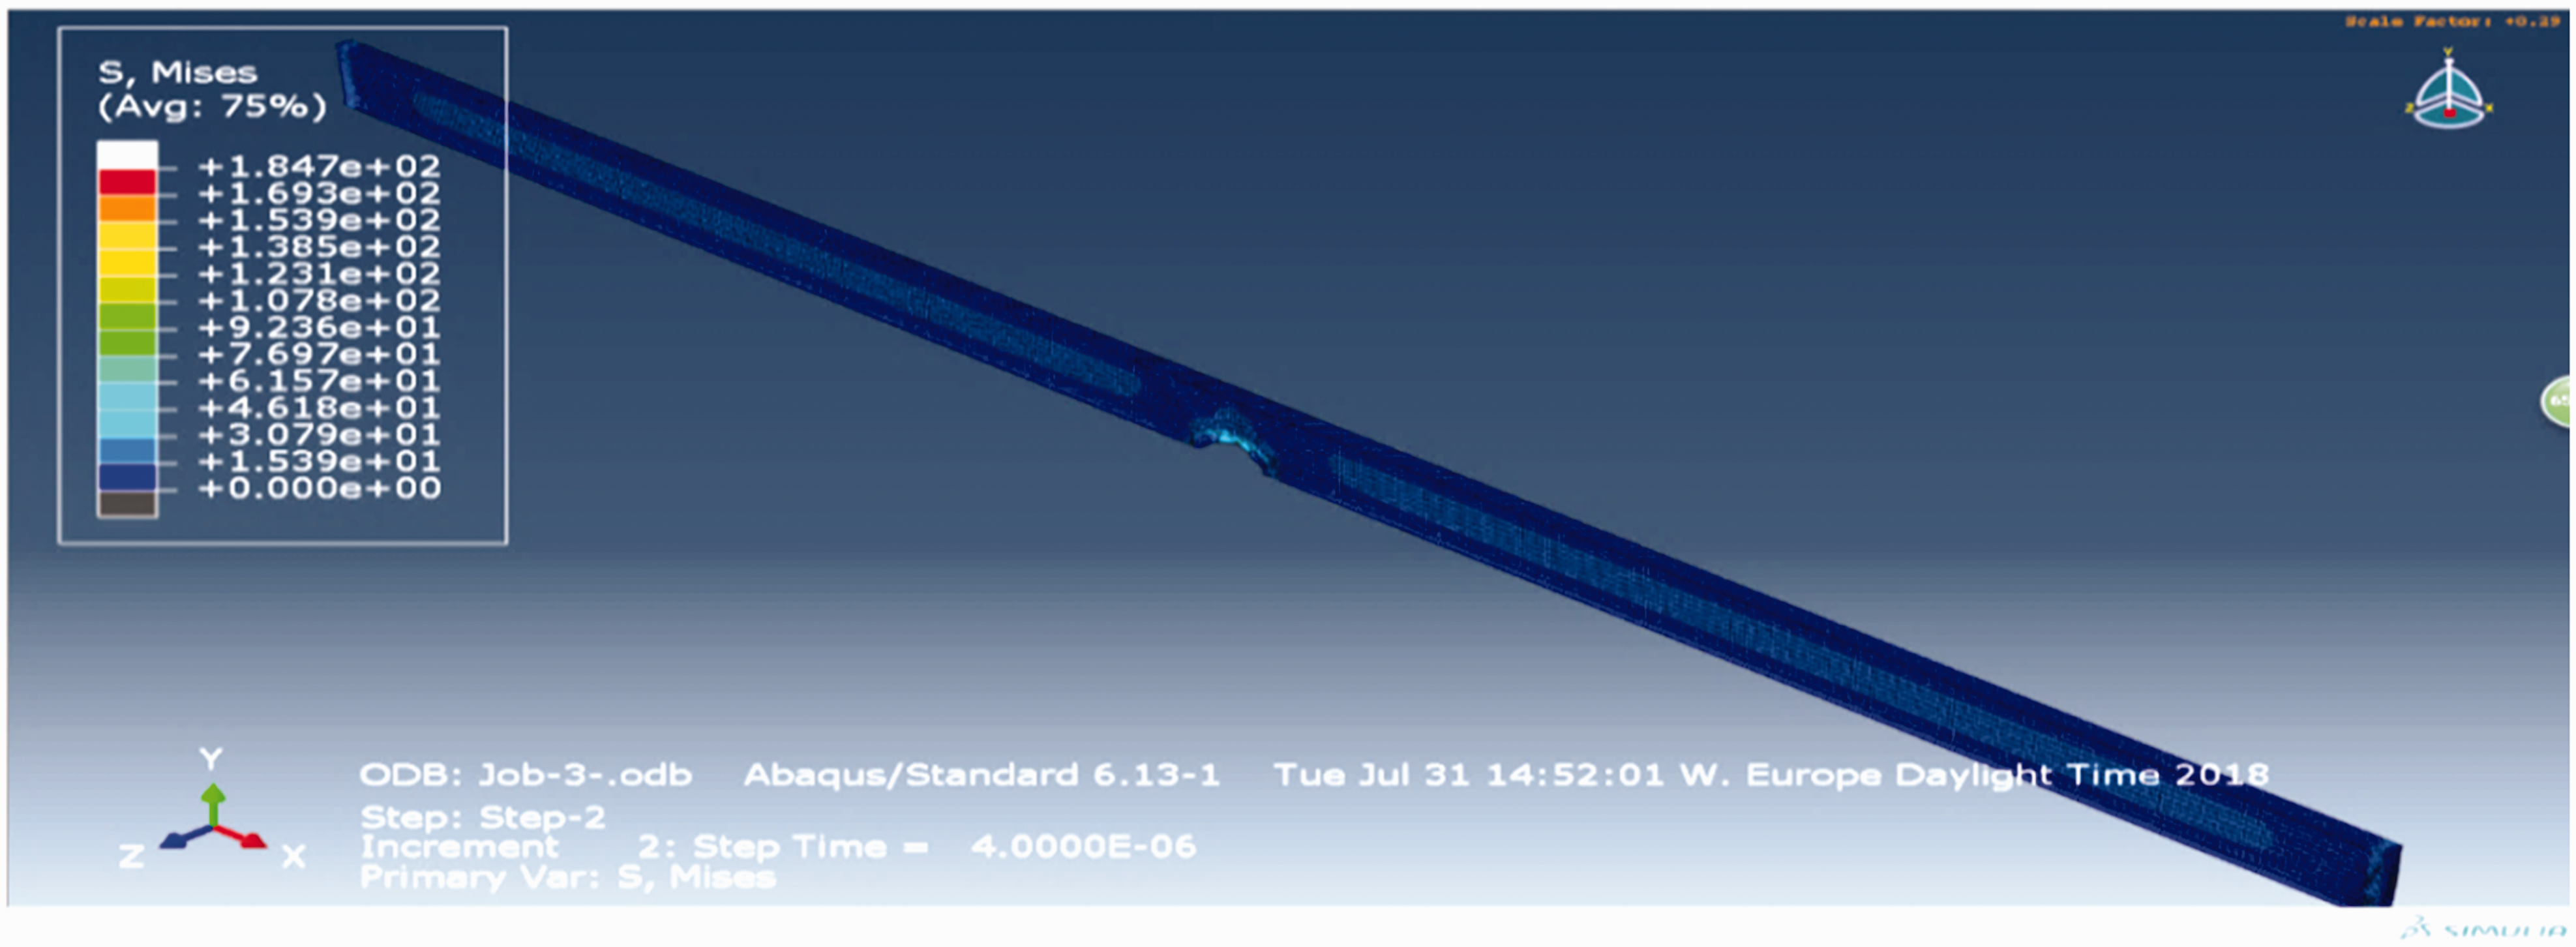
The combined impact of 150 kHz excitation frequency with the thermal and mechanical load.
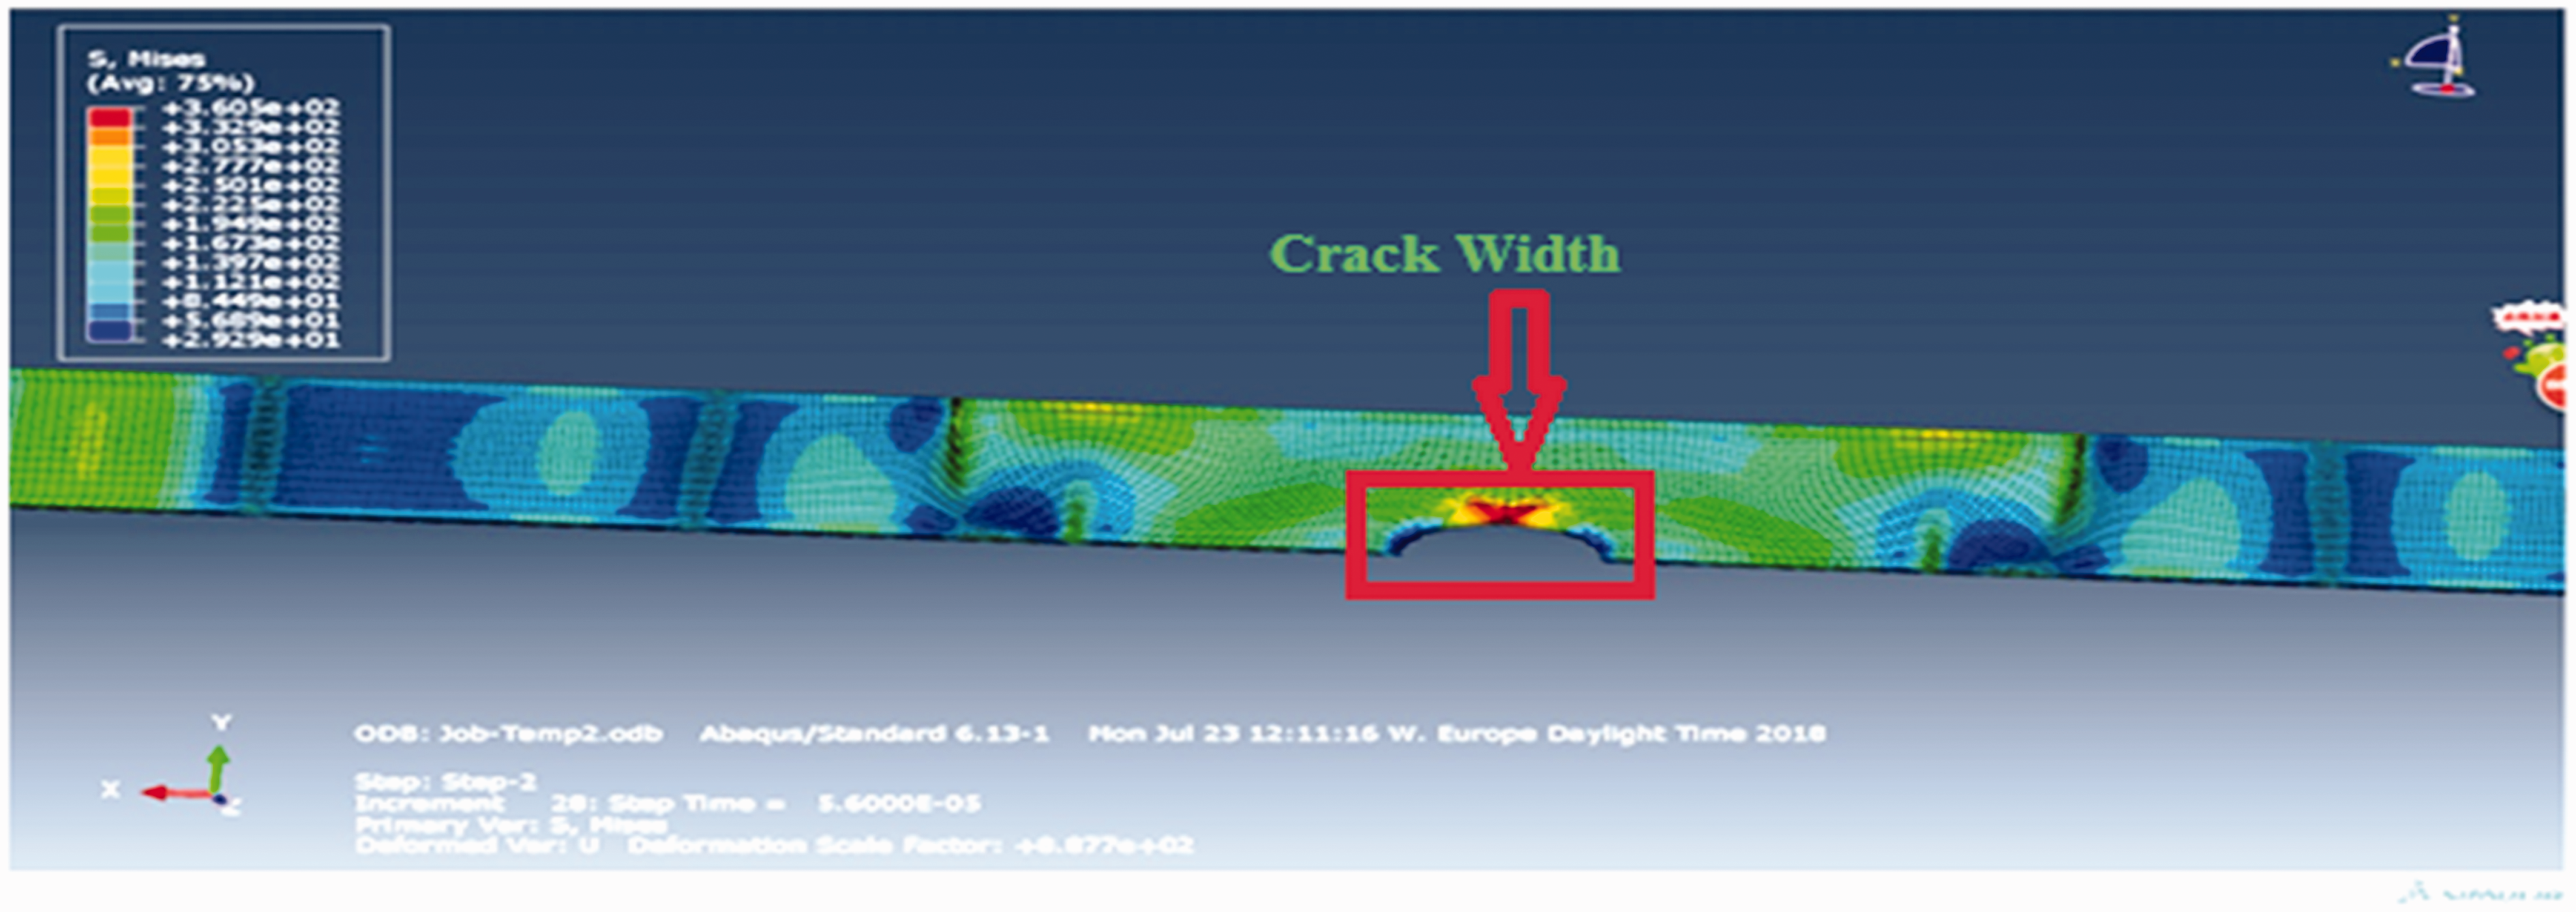
The combined impact of 175 kHz excitation frequency with the thermal and mechanical load.
Analytical estimation
In the current research, the ultimate goal of the analytical estimation is to compare the results of the proposed simulation model with an exact analytical model to ensure the accuracy in work. This evaluation of analytical precision has saved time and money by avoiding performing several experiments. In order to accomplish the analytical modelling of this study, a linear temperature sensitivity dispersion model
29
has been chosen, which helped us to develop a relationship between excitation frequency and wave velocity in a specific range of temperature. This model signifies the variation in material elastic properties, thermal sensitivities, and the abrupt changes in group and phase velocities of S0 mode with temperature. Dispersion curves and their thermal sensitivity are accurately derived through this analytical model. The velocity of the modulating wave is considered as group velocity 
Relation shown in equation (2) is achieved by taking Taylor series expansion of the velocity as a function of temperature 
Results and discussion
Results of numerical analysis, analytical estimation, and experiment test are discussed in the current section.
Simulation
According to FEM performed in
During the SHM of a mechanical structure, besides the mechanical load, the environmental temperature has also a great impact on the strain rate and stresses induced in the mechanical structure. The efficiency of most damage detection methods is not optimal because the effect of environmental temperature is considered insignificant during the usual inspections. According to FE analysis in current research work, an increment in the normalized amplitude of strain rate and stresses was observed by increasing the magnitude of excitation frequency and thermal load. The simulation results of variation in the amplitude of normalized stresses induced in the beam have been illustrated in Figure 9. To illuminate the temperature effect, mechanical load and excitation frequency were kept constant. Figure 9 reveals that the minimum variation in the normalized amplitude can be identified at the condition of 100 kHz, 23°C and 50 N, while the maximum variation can be noticed at 100 kHz, 70°C and 50 N.
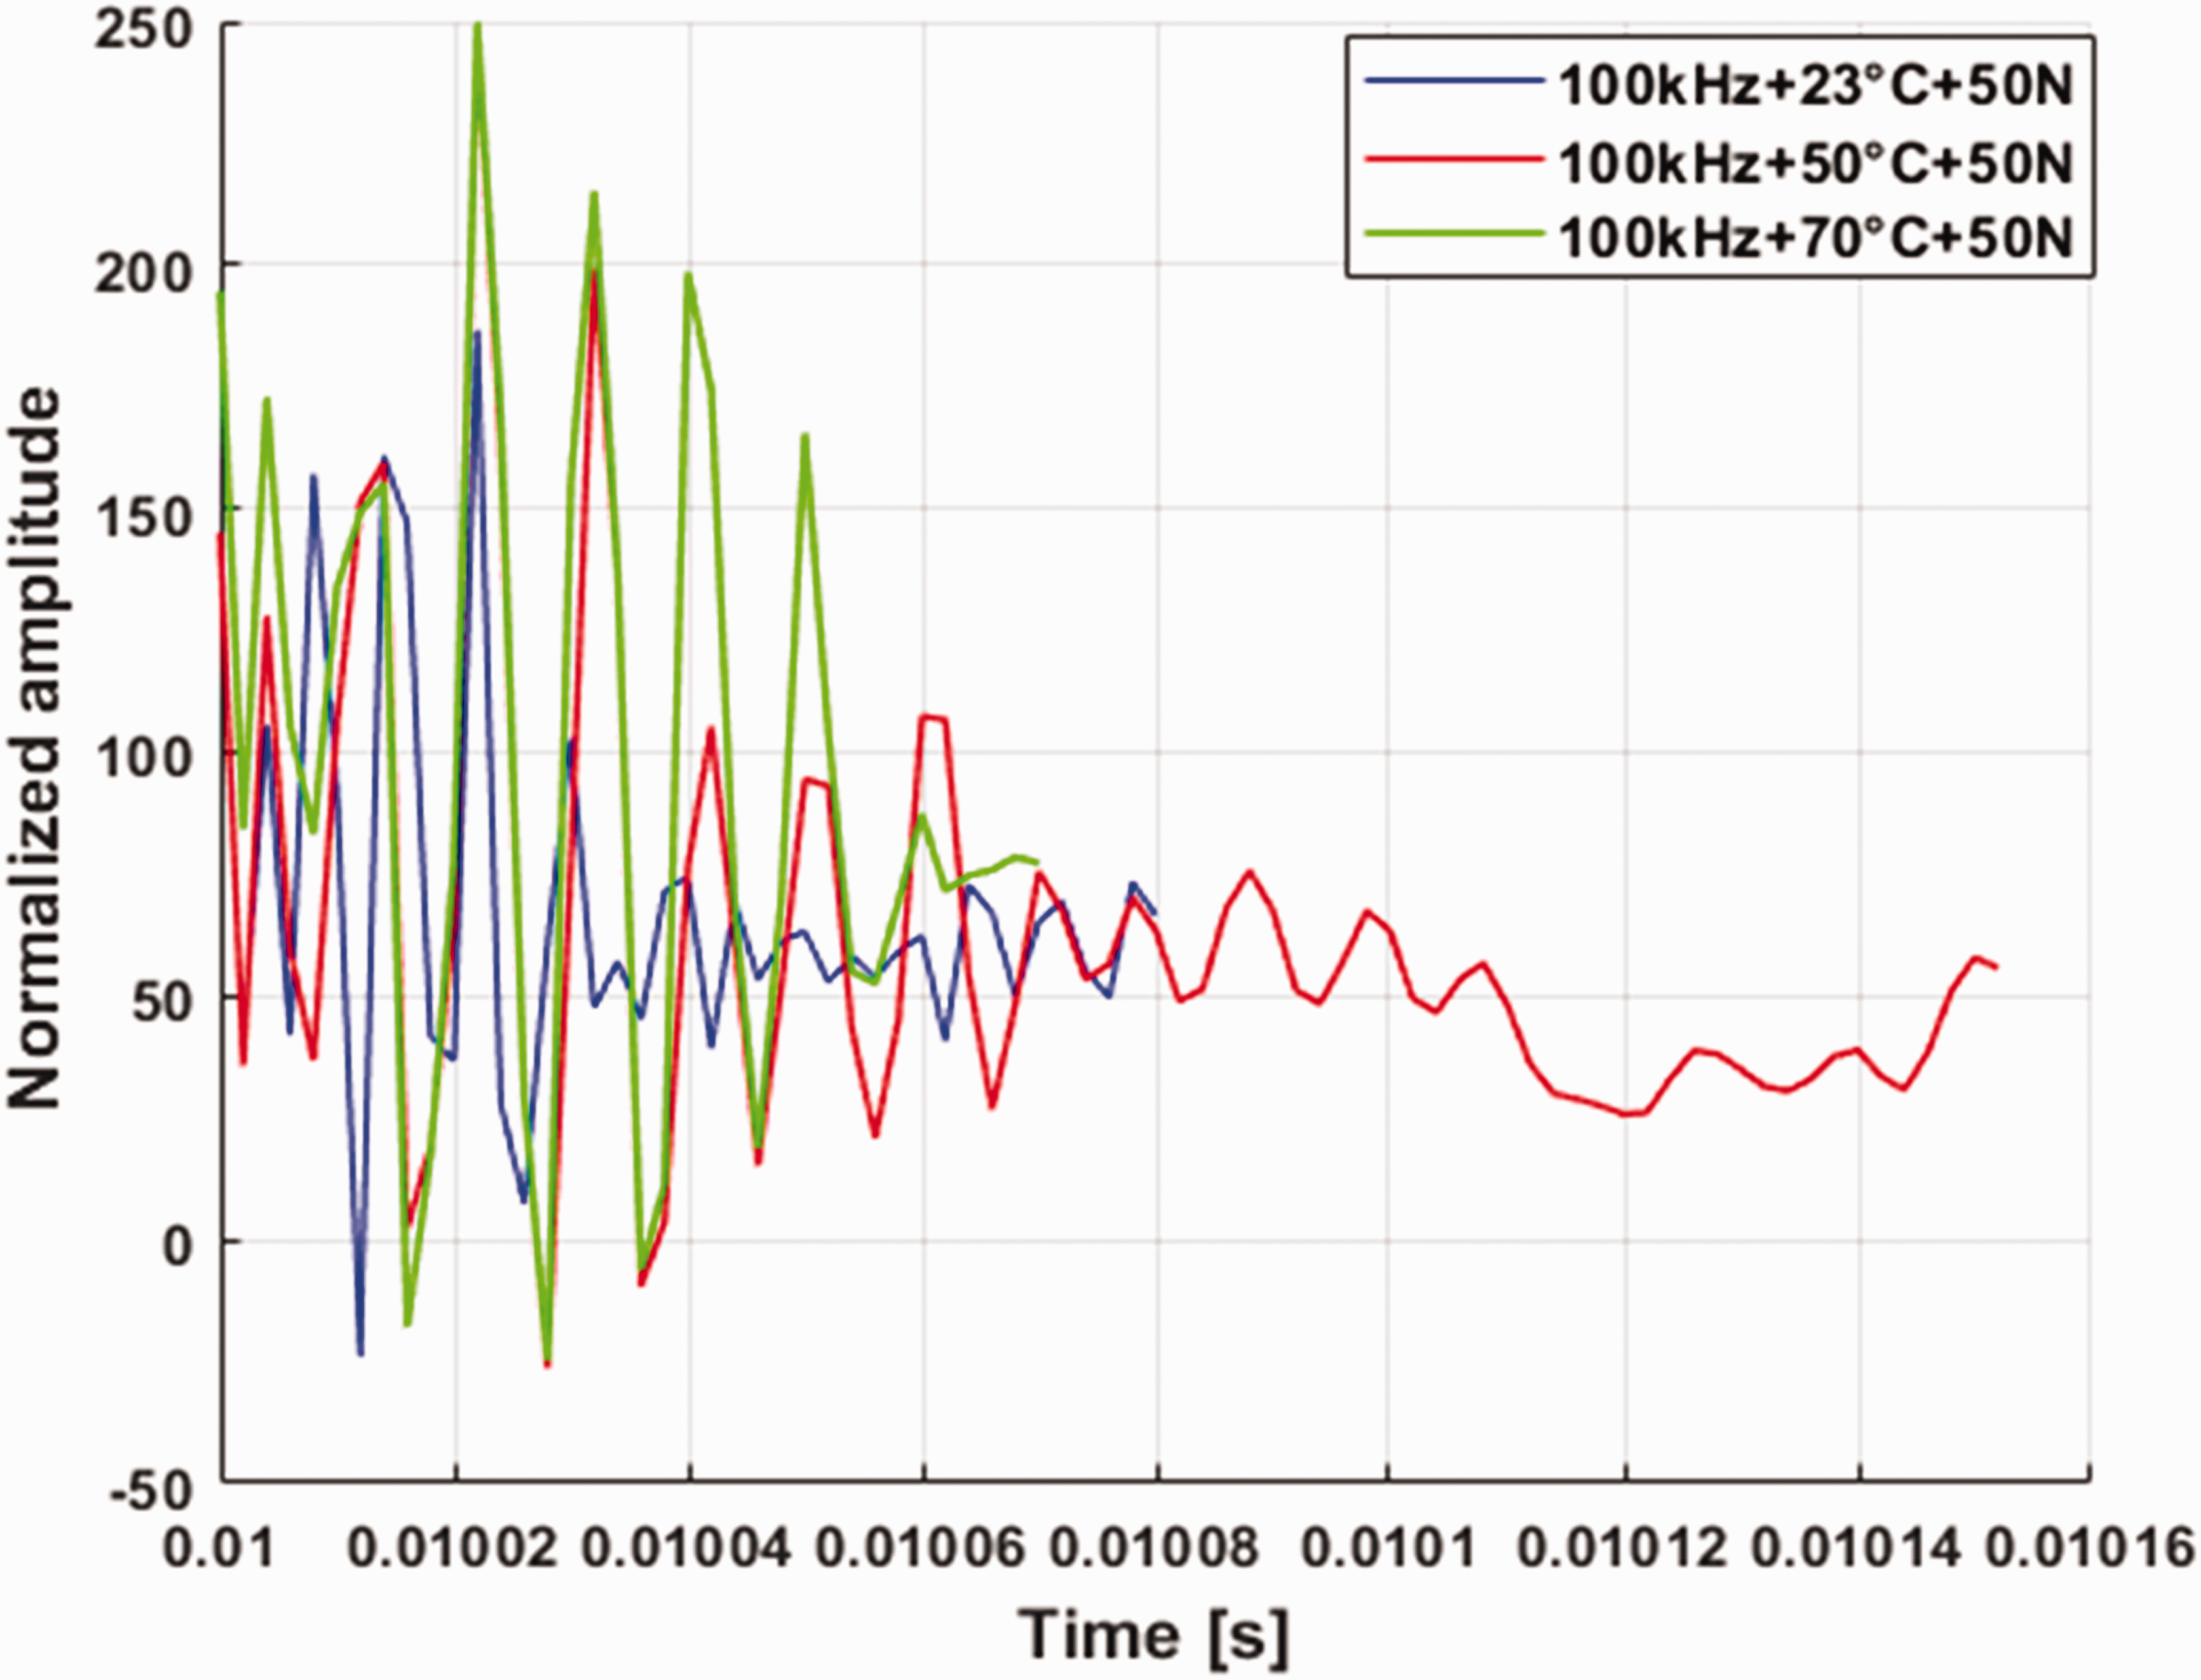
The comparison study of variation in normalized amplitude of induced stresses.
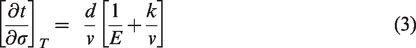
Increment in temperature from 23°C to 70°C affects not only the crack breathing (opening and closing) but also the material elastic properties, which lead to the maximum normalized amplitude of stresses induced in the beam at 70°C. Hence maximum normalized amplitude at 70°C indicates the highest thermal sensitivity of guided waves as compared to 23°C and 50°C, which needs to be controlled to avoid the acoustoelastic effect to achieve desired SHM results. Equation (3) describes how guided wave signals are influenced by stress variation at a different temperature
11
Variation in strain rate in the beam by considering the effect thermal load had also altered the amplitude of propagating guided wave signal. Figure 10 illustrates the comparison in the amplitude of two guided wave signals for crack detection in the beam. The black colour signal represents the crack detection when we do not consider the impact of environmental temperature in our simulation, while the red colour signal represents the presence of thermal load during crack detection.
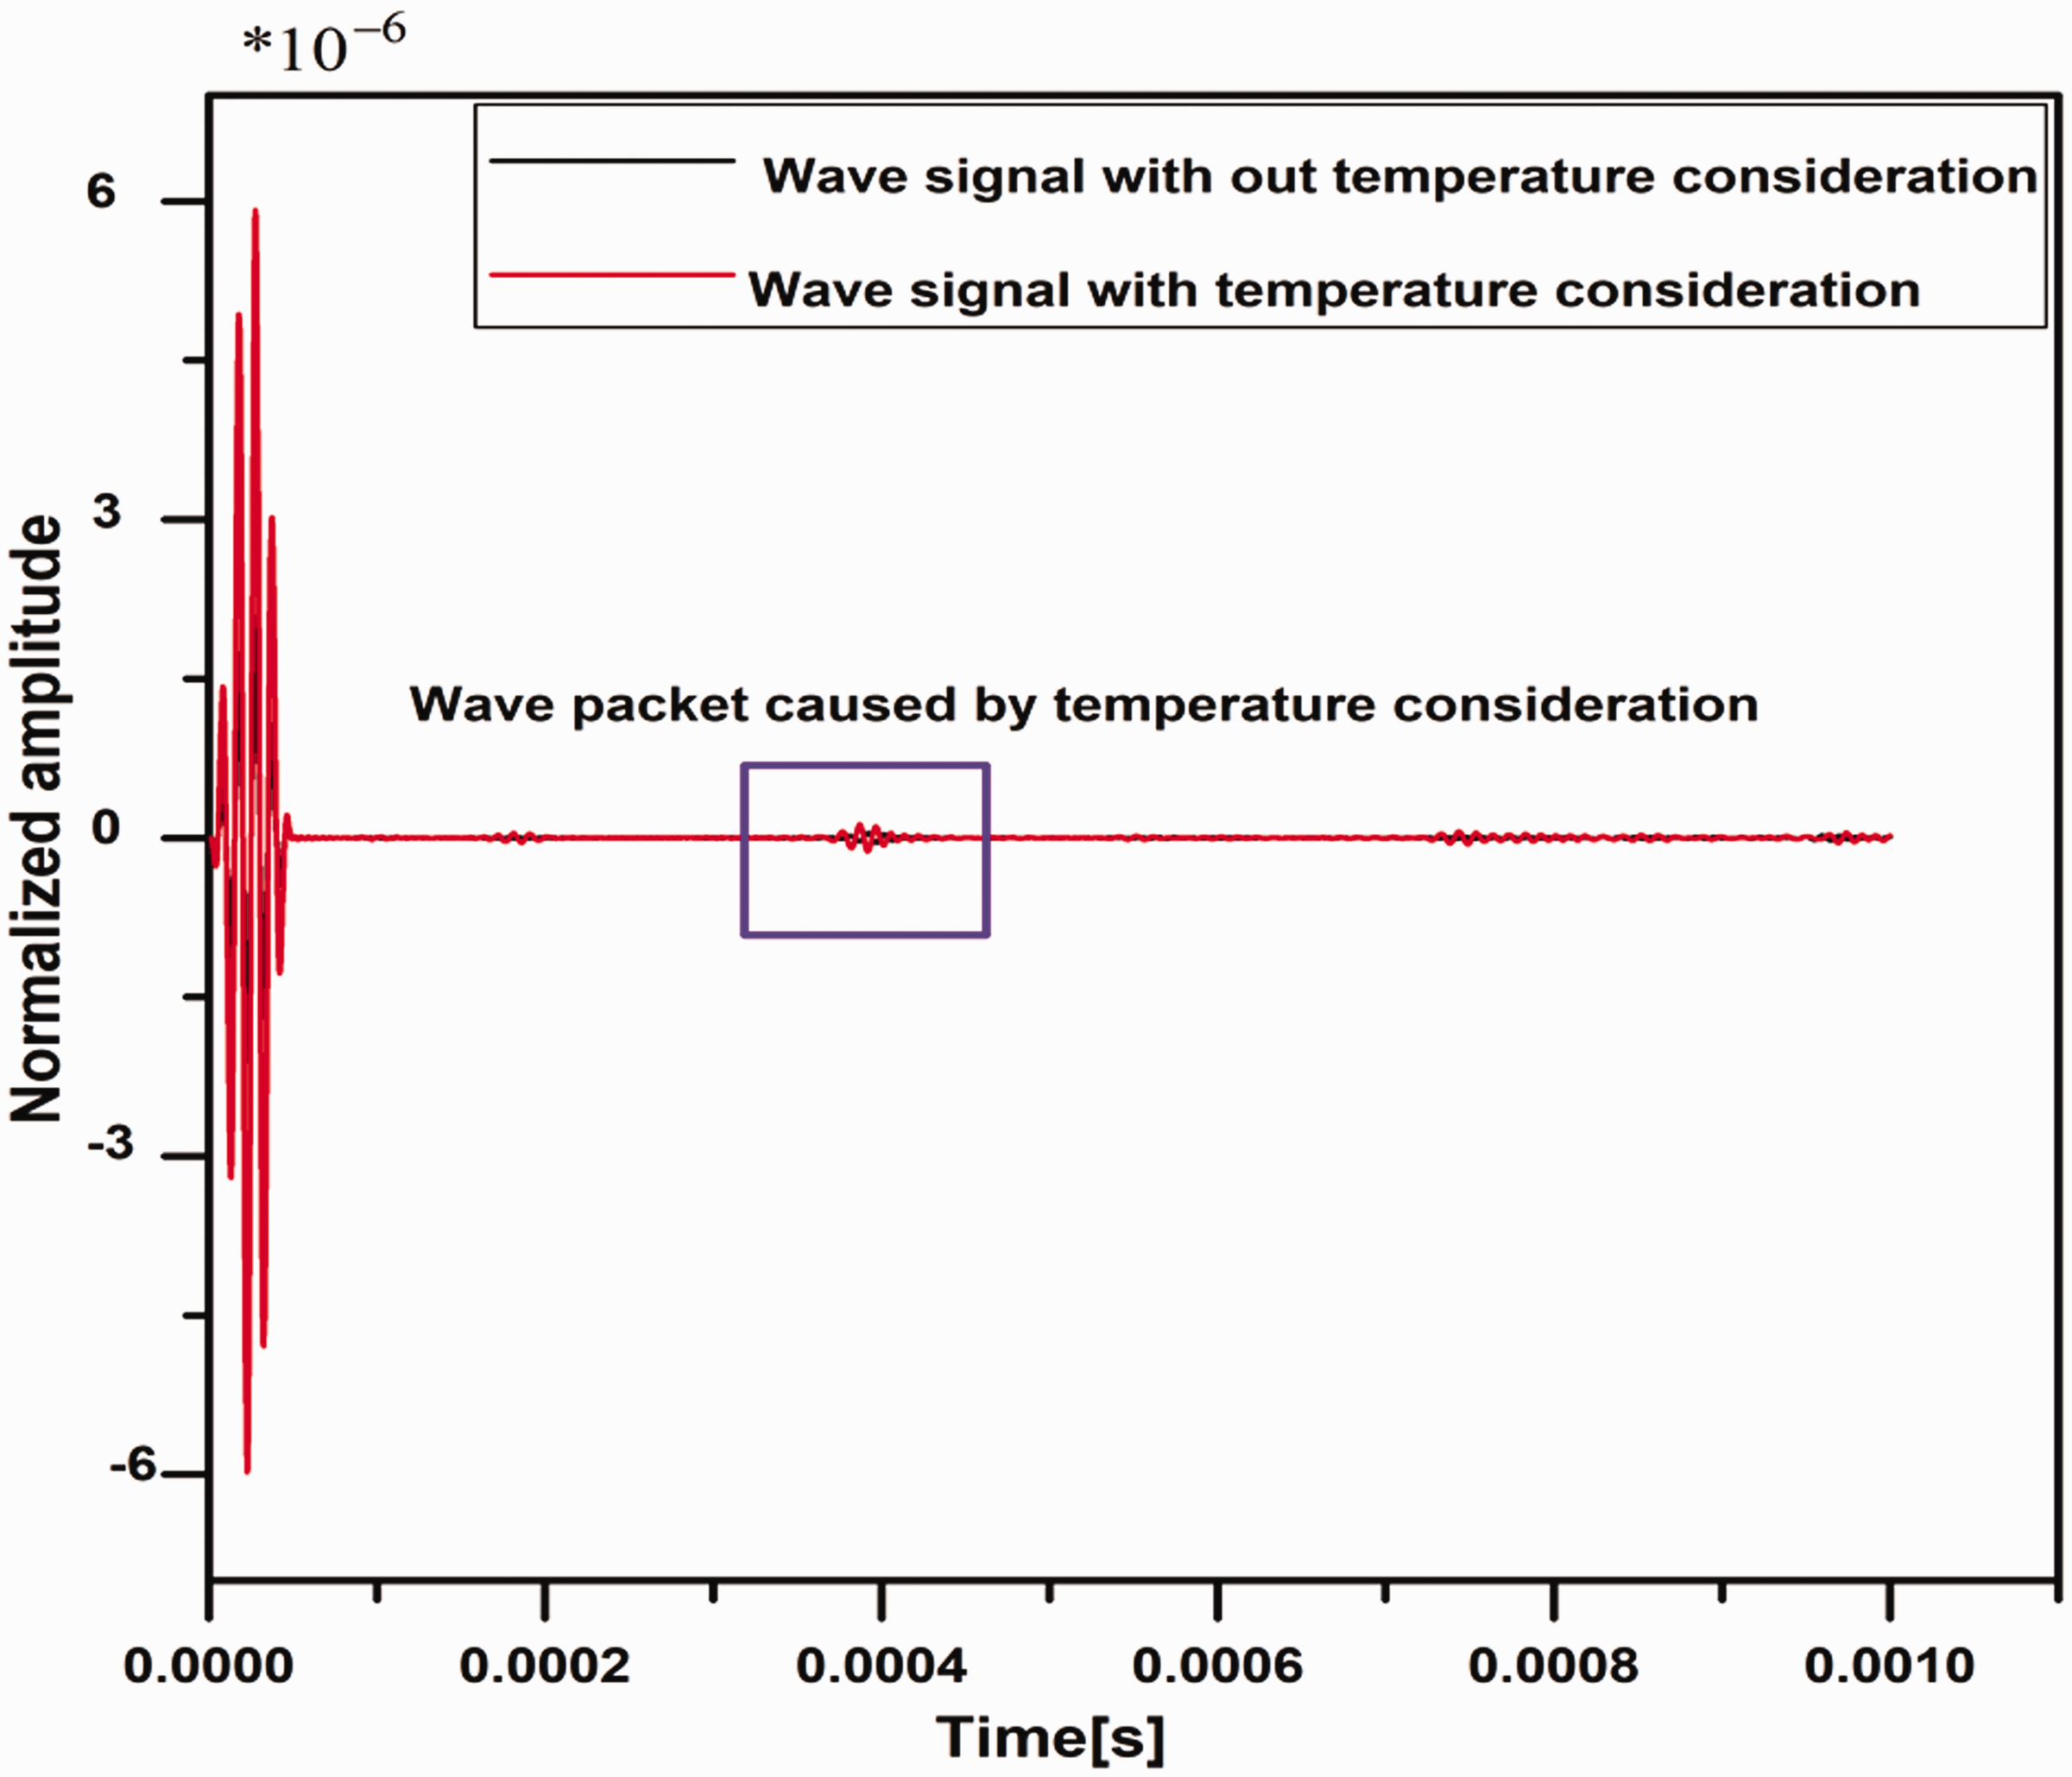
Guided wave signals comparison for crack identification based on variation in strain rate.
The amplitude difference in Figure 10 clearly reveals the thermal sensitivity of red colour guided wave signal. Besides dispersion effect and crack data, the red colour signal also contains the information about environmental temperature, so it causes the formation of a wave packet in comparison of the amplitude of two signals, which shows the presence of a crack in beam identified by both signals. The second parameter for the evaluation of thermal sensitivity of guided waves in our research was the amplitude of displacement. First the beam was excited with broadband sine signals with the frequency band of 100 kHz, and then we also included the effect of thermal load (23°C–70°C) in our simulation. The results of both cases are compared in Figure 11 for spatial displacement in U1 direction along the length of beam. Although it is useful to keep the excitation frequency higher to capture the micro flaws in structure and attain the high damage sensitivity, we restricted our simulation for that part up to 100 kHz to avoid unpredicted dispersion effects which occurred at higher frequencies. Moreover, impact of temperature consideration affects both transmission and reflection signal, but it is more dominant in case of transmission signal.
Guided wave signals comparison for identification of crack location based on variation in amplitude of displacement.
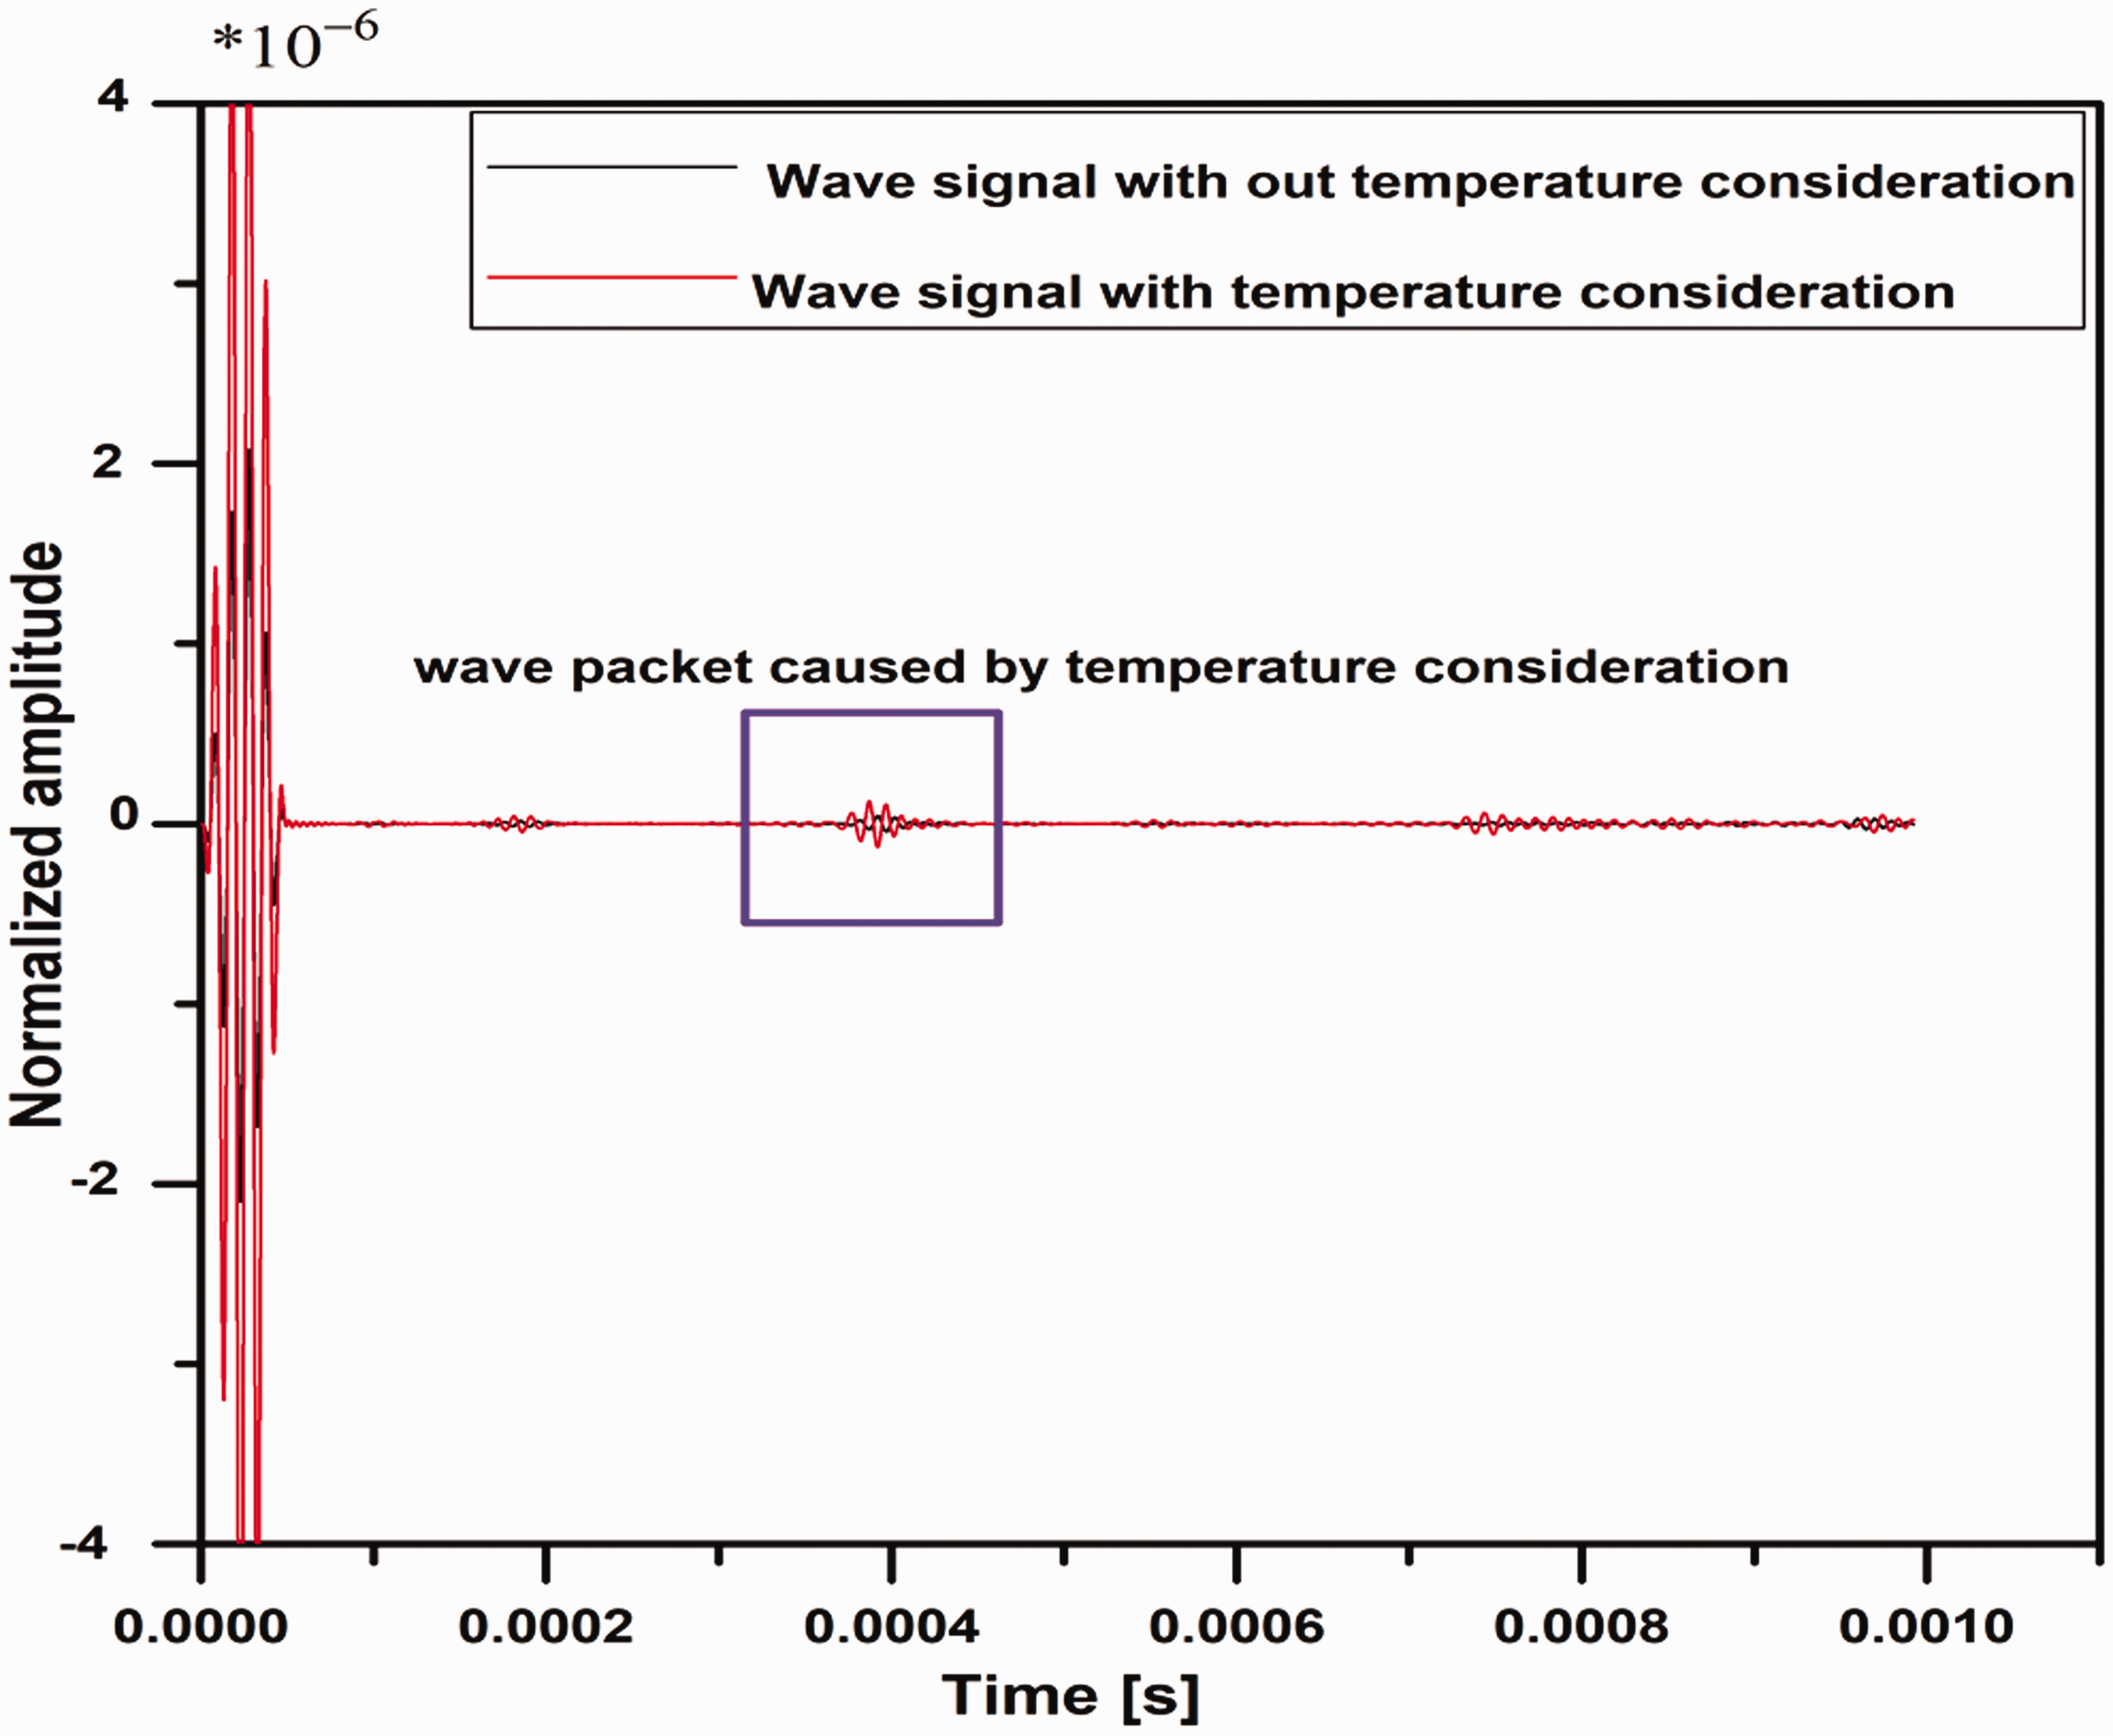
Figure 11 illustrates the comparison in the amplitude of guided wave signals due to variation in spatial displacement at same nodes in the presence of thermal load. This comparison signifies the thermal sensitivity of red colour guided wave signal and identifies the location of a crack in the beam. In order to demonstrate the effect of temperature on defect sensitivity in guided wave inspection, the time domain signals of guided waves at different temperature (23°C–70°C) are shown in Figure 12(a), and meanwhile, Figure 12(b) demonstrates the amplitude of first wave packet with temperature.
Received signals with excitation frequency of 100 kHz at different temperature: (a) The time-domain signal and (b) the amplitude of wave packet at different temperature.
It can be observed that with the increase of temperature, the amplitude of received signals increases and the wave peak gradually shift to the right which represents the reduction of group velocity. Hence, Figures 10 to 12 verify that it is necessary to attenuate the temperature effect to achieve optimal results of ultrasonic guided wave inspection. The third parameter for the evaluation of thermal sensitivity of guided waves in our research was to study the behaviour of symmetric and anti-symmetric dispersion curves. Normally, the dispersive range demonstrates the optimum value of excitation frequency according to dispersion curves. Therefore, the identification of accurate excitation frequency is essential in this work. Determination of temperature invariant points in dispersion curves at a specific value of the frequency-thickness product is also a part of our research. Figure 13 explains the symmetric and anti-symmetric dispersion curves at normal operating temperature 23°C for current FEM results at 100 kHz (0.8 MHz-mm), 125 kHz (1 MHz-mm), 150 kHz (1.2 MHz-mm), 160 kHz (1.28 MHz-mm), and 175 kHz (1.4 MHz-mm).
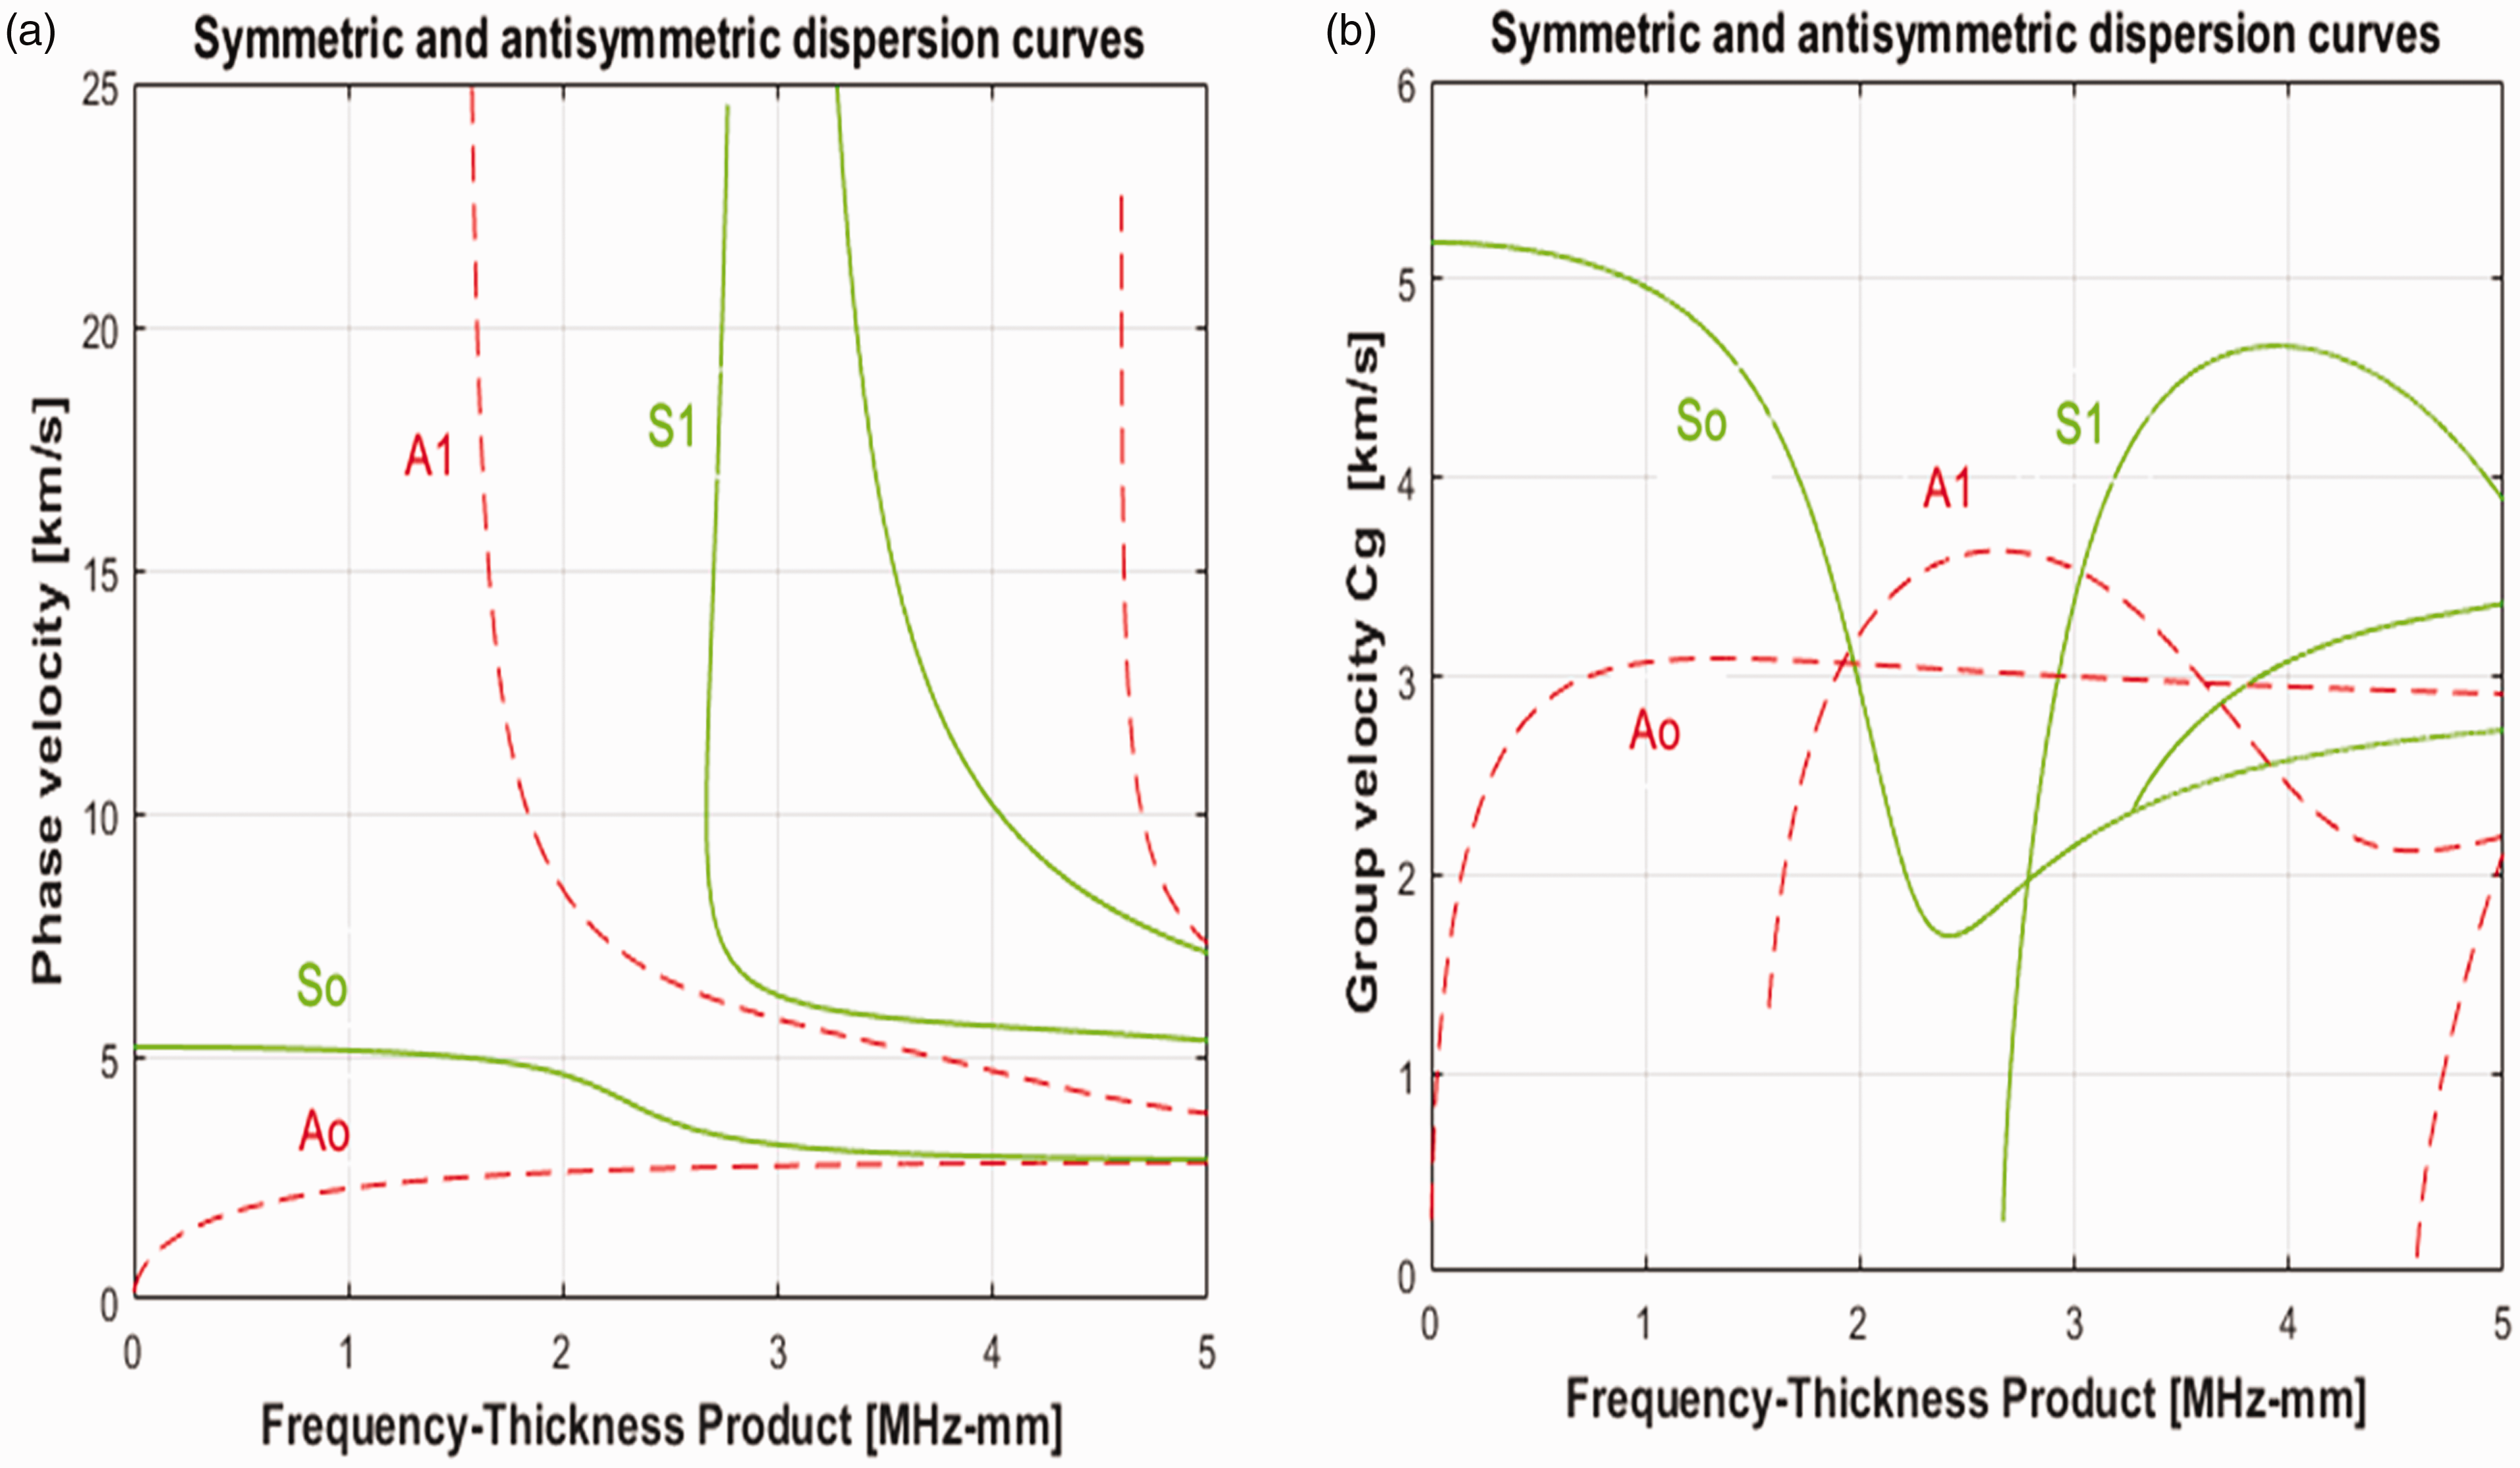
Symmetric and anti-symmetric dispersion curves of stainless-steel beam of grade 304 with crack: (a) Phase velocity and (b) group velocity.
It can be noticed that the phase velocity of the S0 mode shows an abrupt change around 2 [MHz-mm] and later becomes a constant straight line. The main reason for this sudden variation is the approach adopted by the Matlab® program. Hence the unexpected variation in the results around 2 [MHz-mm] is not our area of concern in ultrasonic guided wave inspection for current work because peak frequencies are not favorable due to high dispersion effects. Therefore, it is highly recommended to increase the thickness of the beam to examine this region. Moreover, Figure 13 clearly reveals that the group velocity firstly decreases and then increases with the increment in excitation frequency. To achieve high sensitivity of damage feature, excitation frequency should be kept higher to adapt the micro flaws. 31 But the higher value of excitation frequency can cause high dispersion effect and multiple modes and results in a significant gap between phase velocity and group velocity. In order to reduce the difficulty of signal processing, lower frequency such as below 150 kHz should be adapted. To investigate the effect of temperature on the group velocity and TOF for the S0 wave mode, behaviour of dispersion curves in Figure 13 was analyzed at variable excitation frequency and thermal load. The results are illustrated in Figures 14 and 15, respectively. For ideal condition, S0 wave mode should have high group velocity and low TOF in a certain range of temperature and frequency.
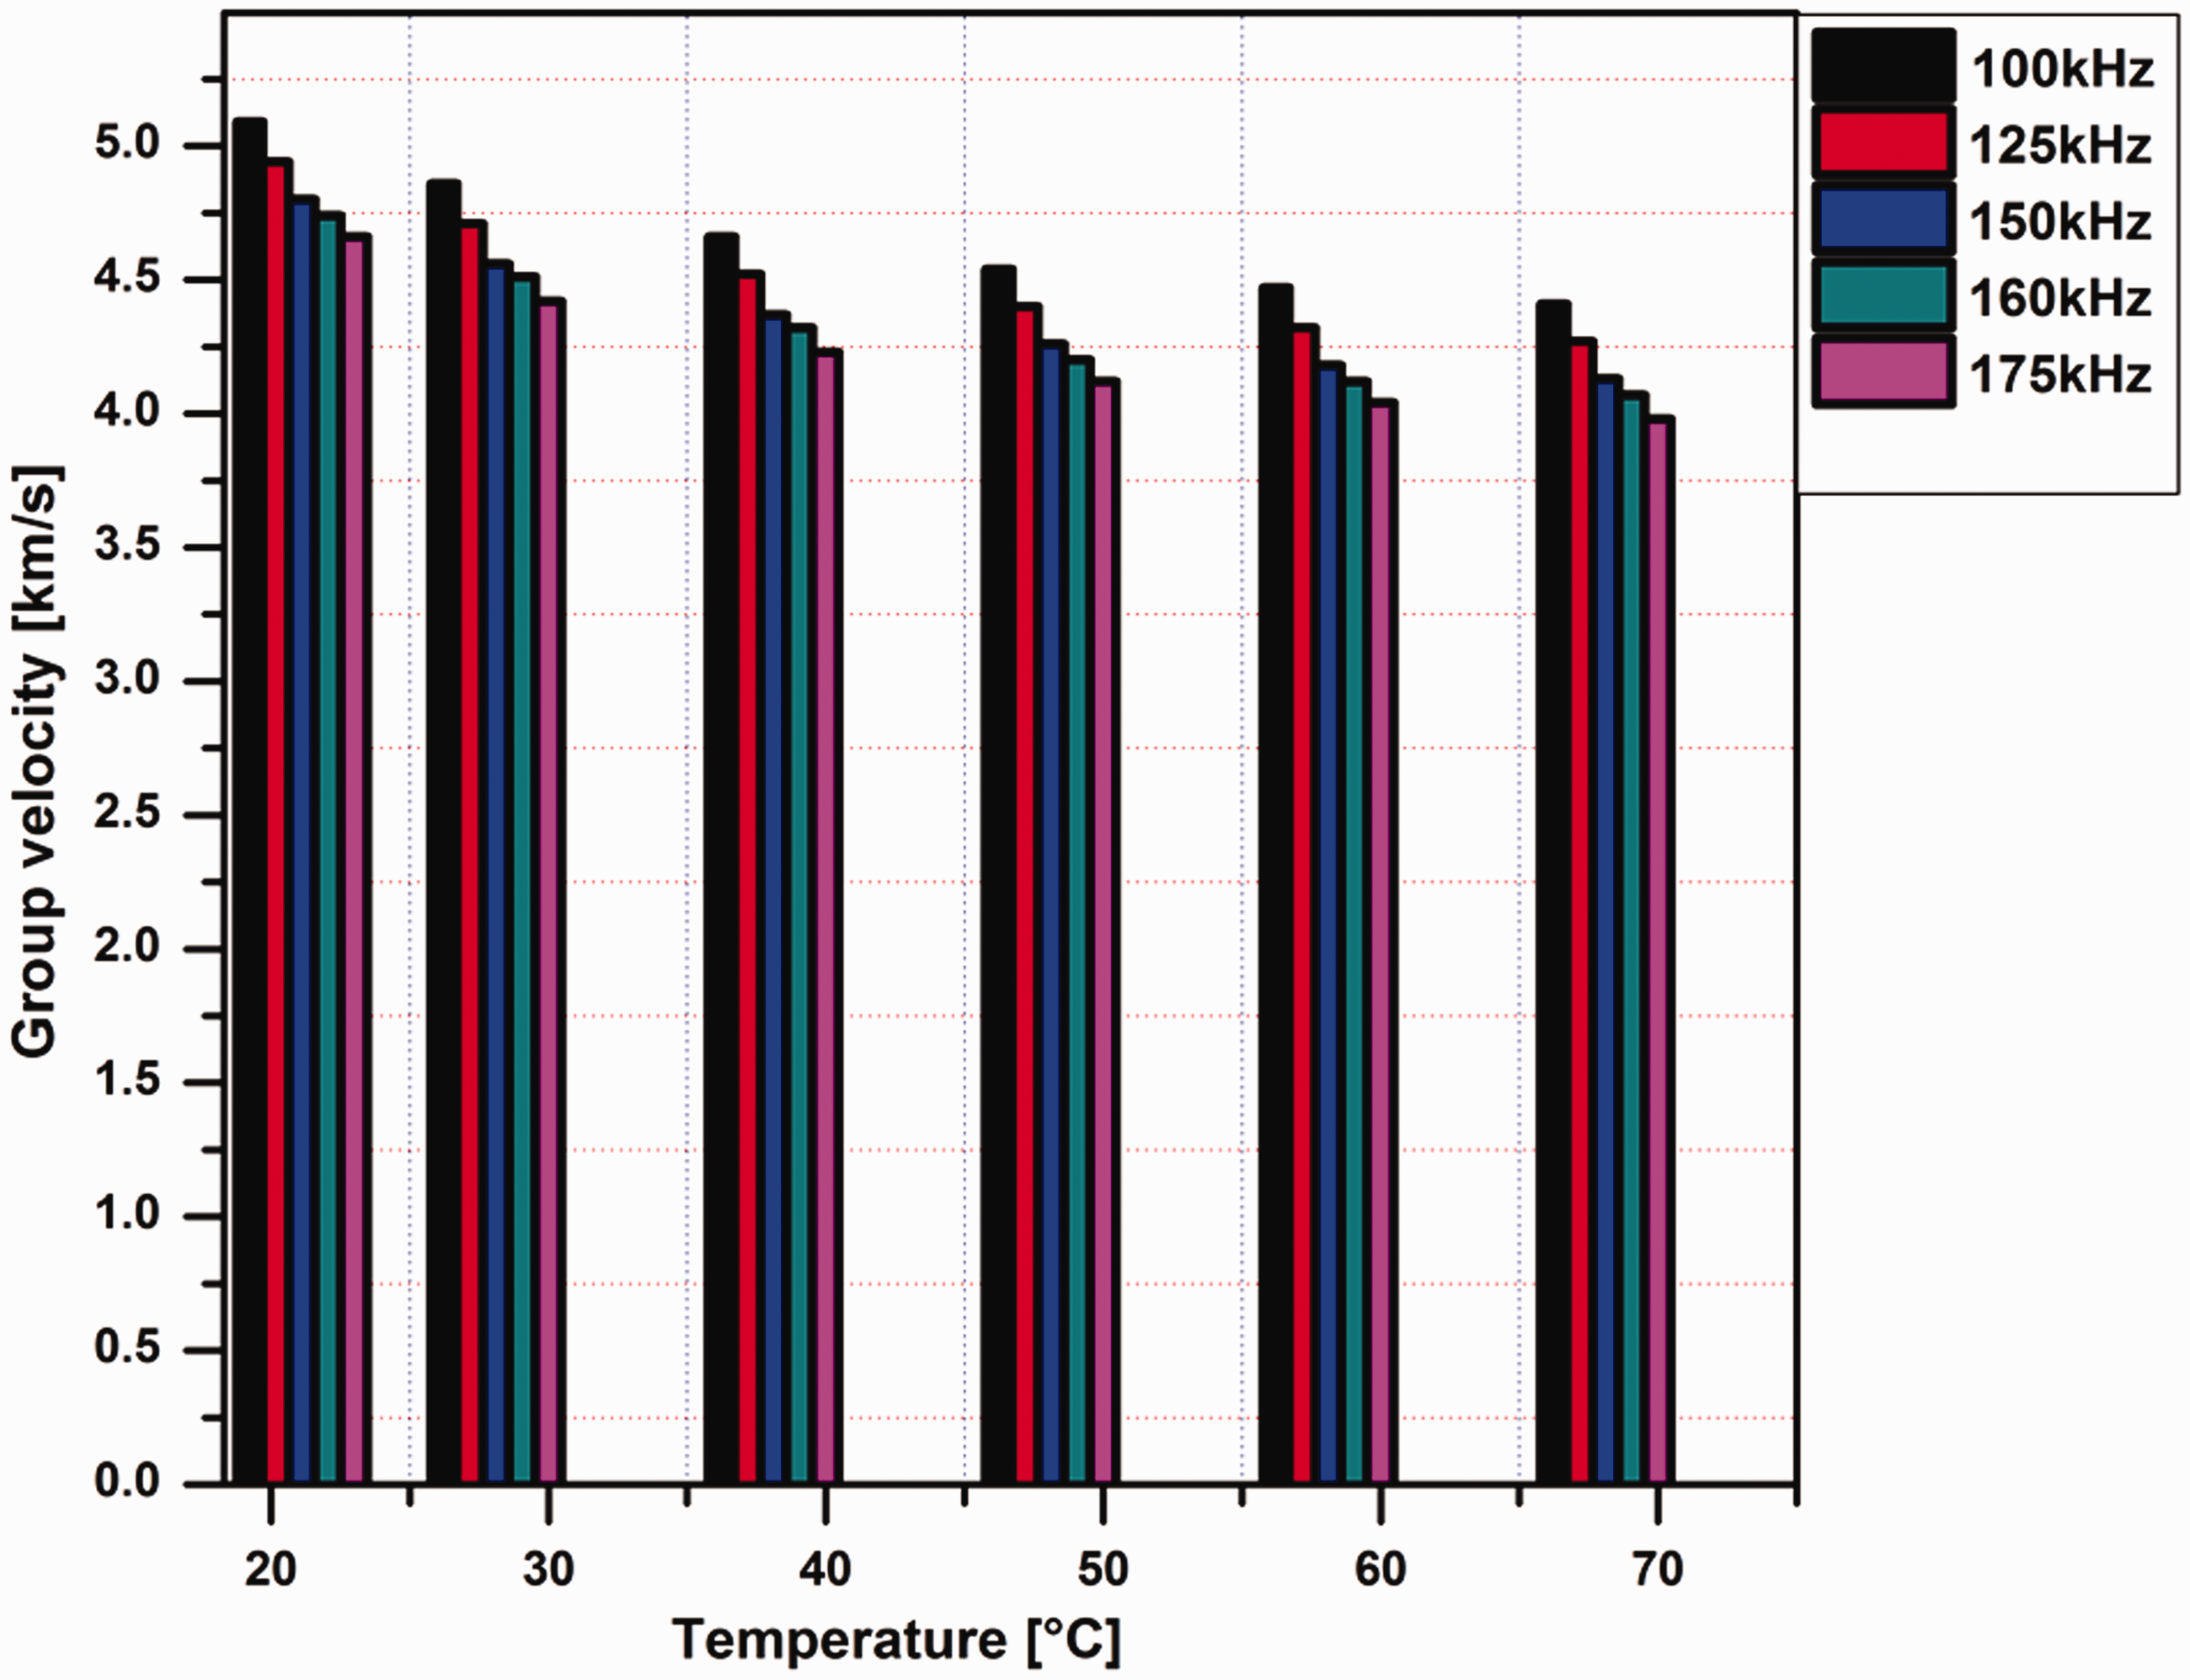
Variation in group velocity with temperature and excitation frequency for S0 mode.
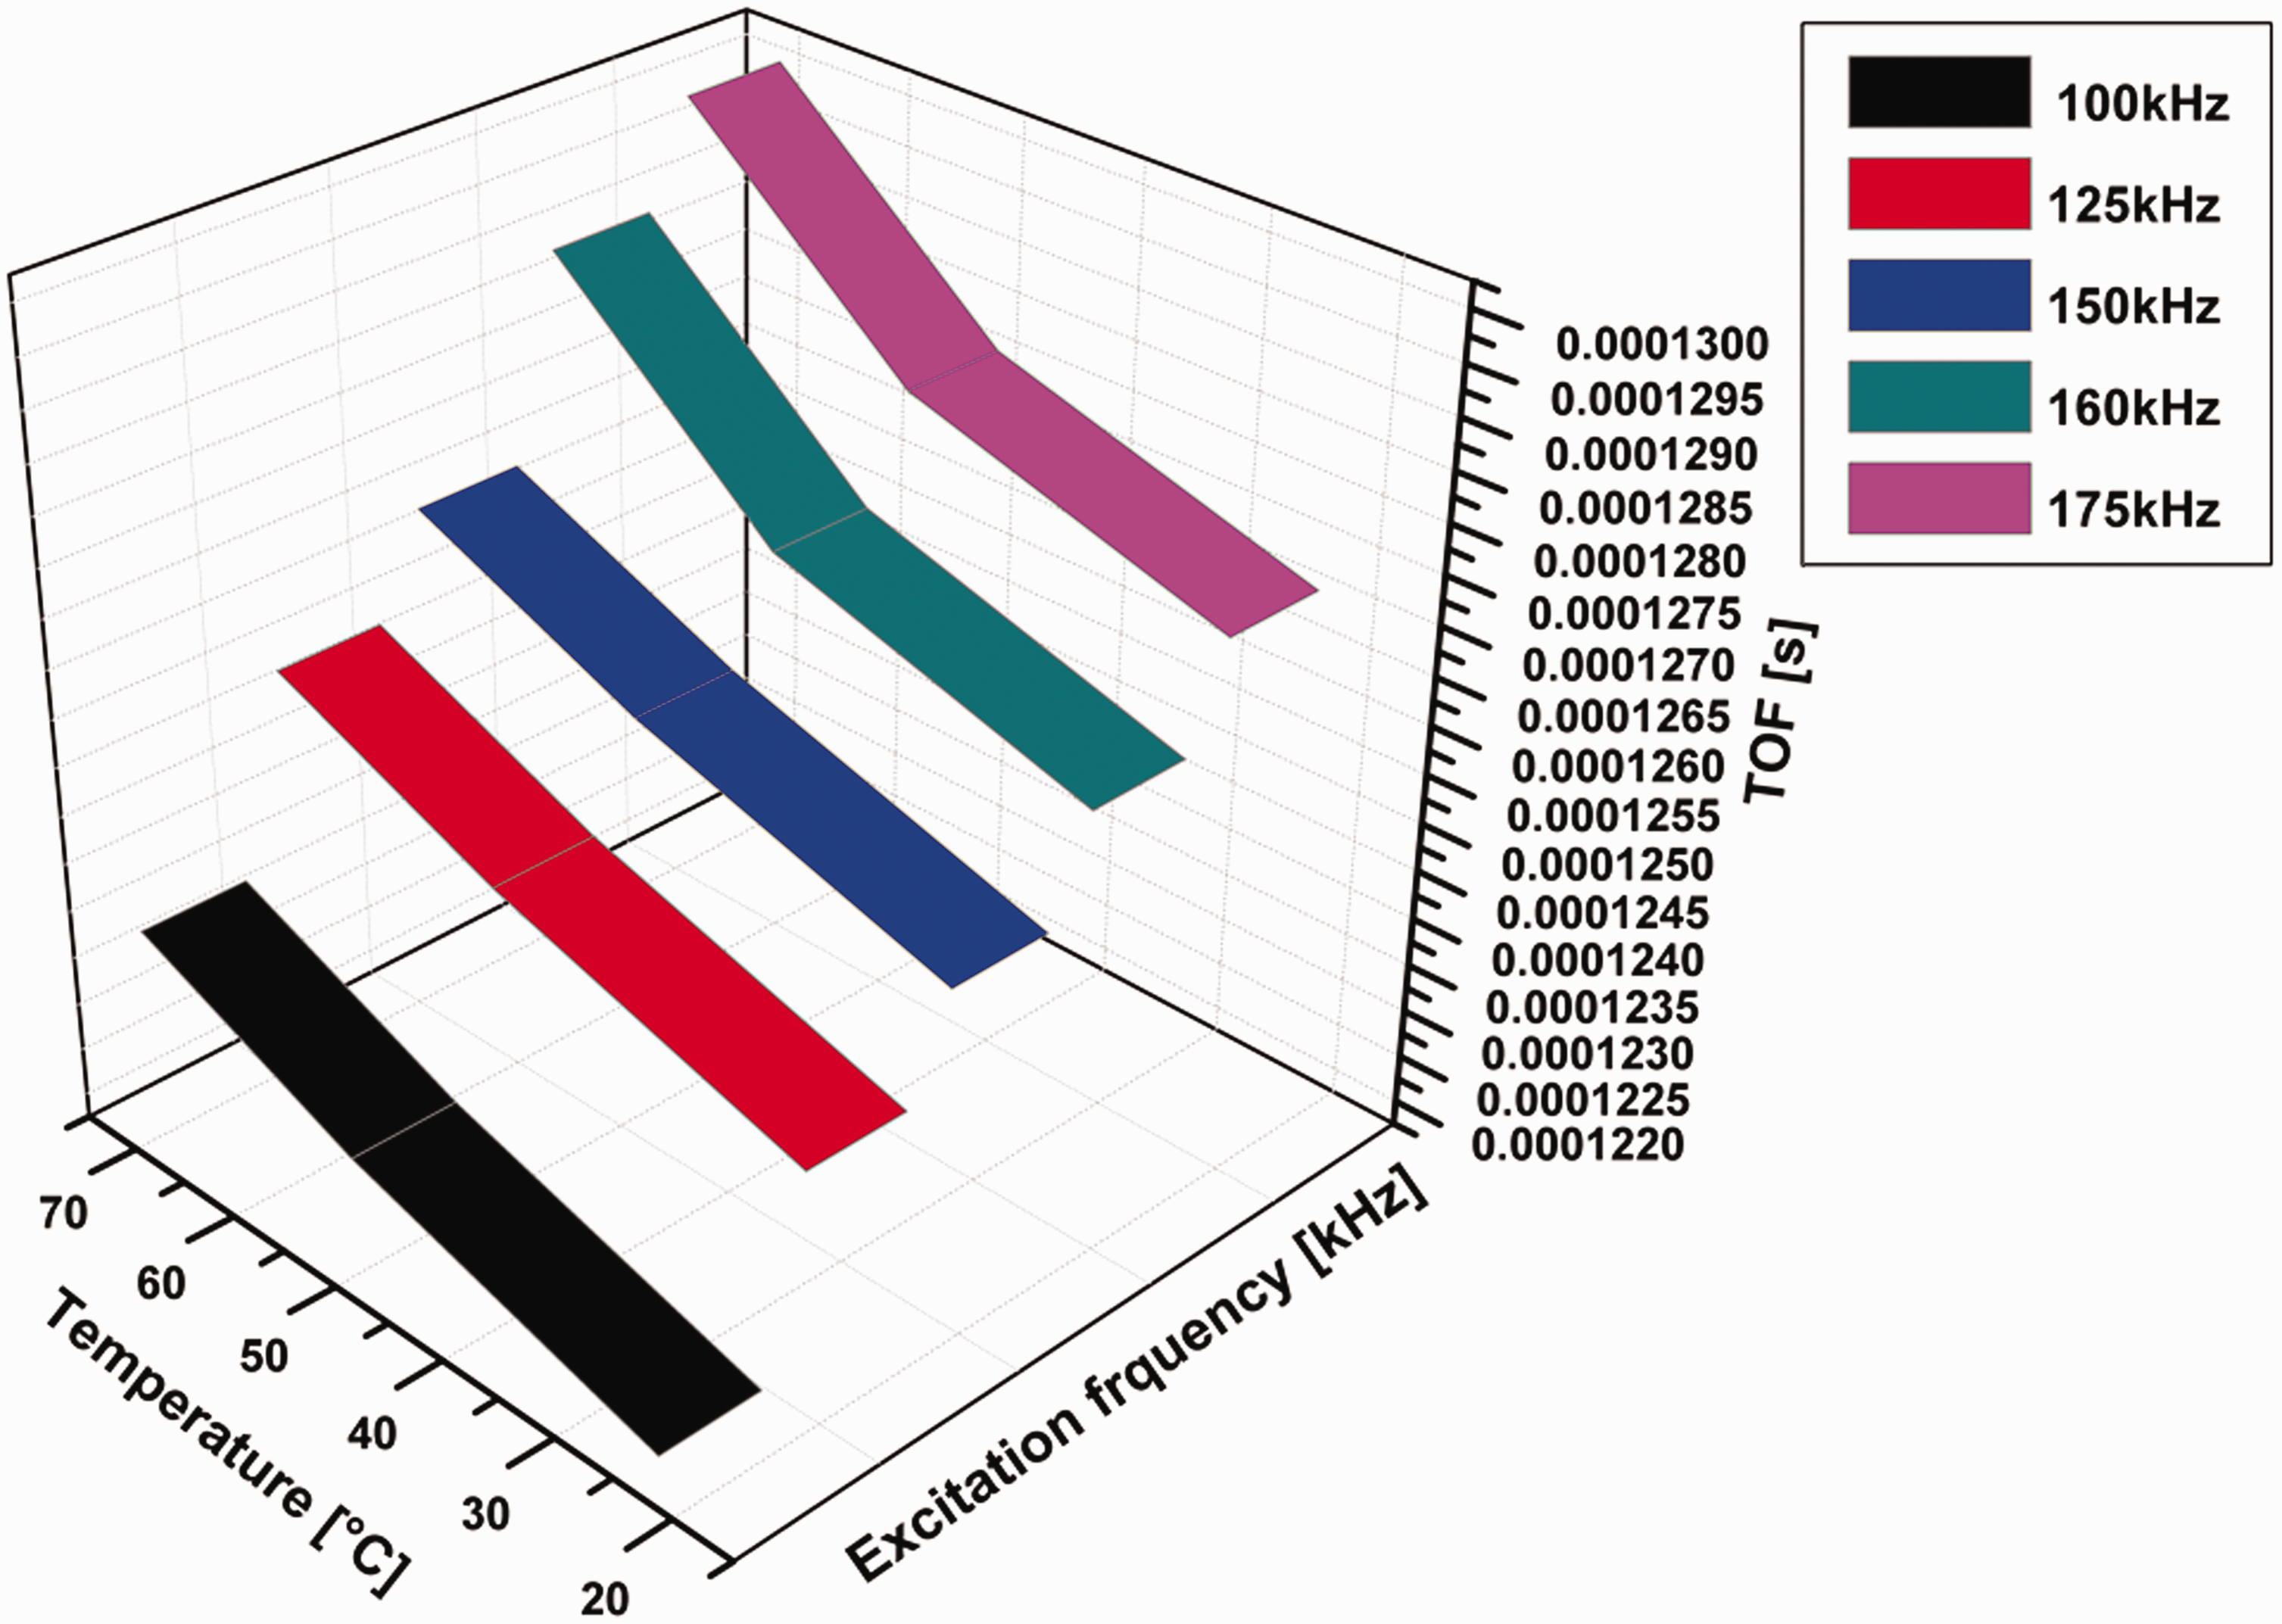
Variation in time of flight (TOF) with temperature and excitation frequency for S0 mode.
Figures 14 and 15 show the variation in group velocity and TOF for S0 mode under the influence of temperature (23°C–70°C) and excitation frequency (100 kHz–175 kHz). The maximum group velocity of 5.09 km/s for S0 mode was observed at 100 kHz in the temperature range of 23°C to 30°C, while minimum group velocity of 3.98 km/s for S0 mode was observed at 175 kHz in the temperature range of 65°C to 70°C. In case of TOF, minimum TOF of 1.22 × 10⁻⁴ s for S0 mode was noticed at 100 kHz and 23°C, while maximum TOF of 1.30 × 10⁻⁴ s for S0 mode was noticed at 175 kHz and 70°C, respectively. There might be three main reasons for this fluctuation in TOF. First, increment in temperature causes the thermal expansion/contraction of the beam, which alters both its thickness and density. Second, variation in Young’s modulus because of temperature disturbs the amplitude and wave velocity of the propagating wave signal. Third, unpredicted changes in transducers and bonding materials cause the delay of S0 wave mode. In current research work, sensor and actuator network consists of PZT transducers, while the thermal load is applied by changing the temperature values from 23°C to 70°C. During the selection stage, Curie temperature Tc (the temperature above which the material loses its piezoelectric characteristics) of PZT transducers was considered. The Tc of PZT is more than 200°C, making it a favorable piezoelectric material.
32
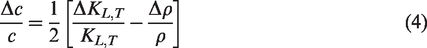
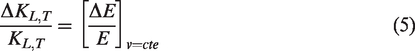
Therefore, the applied thermal load (<200°C) in our analysis did not affect the transducer and bonding material, and we achieved optimal simulation results. Hence it can be analyzed from Figures 14 and 15 that group velocity of guided waves decreases and TOF increases by increasing the temperature and excitation frequency. This result clearly reveals the thermal sensitivity of ultrasonic guided waves during SHM and it is also valid for bulk waves. Bulk waves propagate in the bulk of the material by shearing and longitudinal stresses and correspond to a type of non-dispersive waves. Variations in the ultrasonic bulk velocities, CL (velocity of the longitudinal wave) and CT (velocity of share wave) in presence of stress depends on the stress effect over Young‘s modulus, Poisson ratio and the strain perpendicular to the applied stress (density effect).
33
It has been illustrated in equations (4) to (6)
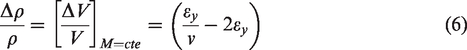
Comparison of ultrasonic bulk waves technique and ultrasonic guided wave inspection. 34
It can be noticed from the comparison illustrated in Table 4 that the rate of change in ultrasonic velocity must be less in ultrasonic guided wave inspection as compared to bulk wave’s technique.
Figure 14 also provides us with sufficient information to predict the temperature invariant points in ultrasonic guided wave dispersion curves. The horizontal trend of lines in the graph indicates that the change in group velocity of S0 mode for this temperature is zero. It can be noticed in Figure 14 that variation in group velocity is not exactly zero but it is minor at 100 kHz in the temperature range of 23°C to 30°C. According to this observation, the temperature invariant points are not insensitive to the entire defined temperature range but exhibit minute variation for normal operating temperatures and low excitation frequency of 100 kHz. The difference in values of group velocity at higher temperatures is because of abrupt change in the phase velocity of the received signal, which has been already described. The minimum frequency considered in the present study is identified as the temperature invariant point because of several reasons, including (i) it lies in non-dispersion region of dispersion curve, (ii) difficulty of signal processing was much reduced at 100 kHz as compared to higher values of excitation frequency, (iii) there was not any significant gap observed at 100 kHz between phase velocity and group velocity, (iv) the desired number of modes was generated at 100 kHz to clearly observe the impact of temperature, (v) the gentle trend of group velocity did avoid the wave packet distortion at 100 kHz. However, it is not necessary that all frequencies below 100 kHz will also show low-temperature sensitivity of guided wave velocity. Lower excitation frequency may affect the accuracy of damage detection because the sensitivity of guided wave to crack in the beam is a function of frequency, 35 it decreases as the frequency is further reduced than 100 kHz and it would become difficult to identify temperature invariant points. Therefore, current research recommends that 100 kHz is the ideal value of excitation frequency to identify the damage accurately and estimate the influence of environmental temperature on the measured signal. In summary, current analysis of dispersion curves has not only revealed the thermal sensitivity of guided waves but also highlights the temperature invariant points for the exact selection of excitation frequency to achieve optimum inspection results.
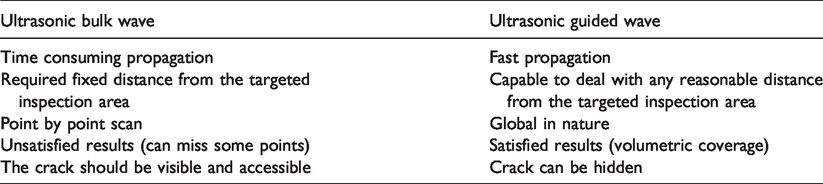
Based on results discussion about Figures 13 to 15, a wave velocity function has been generated in the Matlab® environment to calculate the group velocity of guided waves that takes the effect of temperature and excitation frequency into account. This relation is obtained from the numerical simulation by curve fitting the results of the guided wave signals excited at the frequency band of 100 kHz with a thermal load of 23°C to 70°C. A first-degree polynomial is utilized in this function to analyze the effect of temperature on group velocity, which can be written mathematically as

Temperature and frequency-dependent fitted linear curve.
Hence, this proposed wave velocity function is very useful to determine an accurate value of excitation frequency and temperature invariant points to provide an optimal baseline for thermal attenuation in real-time ultrasonic guided wave inspections. The last numerical parameter for the evaluation of thermal sensitivity of guided waves in the current analysis was the variation in the dynamic characteristics such as natural frequency of beam demonstrated in Figure 17. The changes in environmental temperature have a great effect on the natural frequency of material, 36 and it alters the damage inspection results.
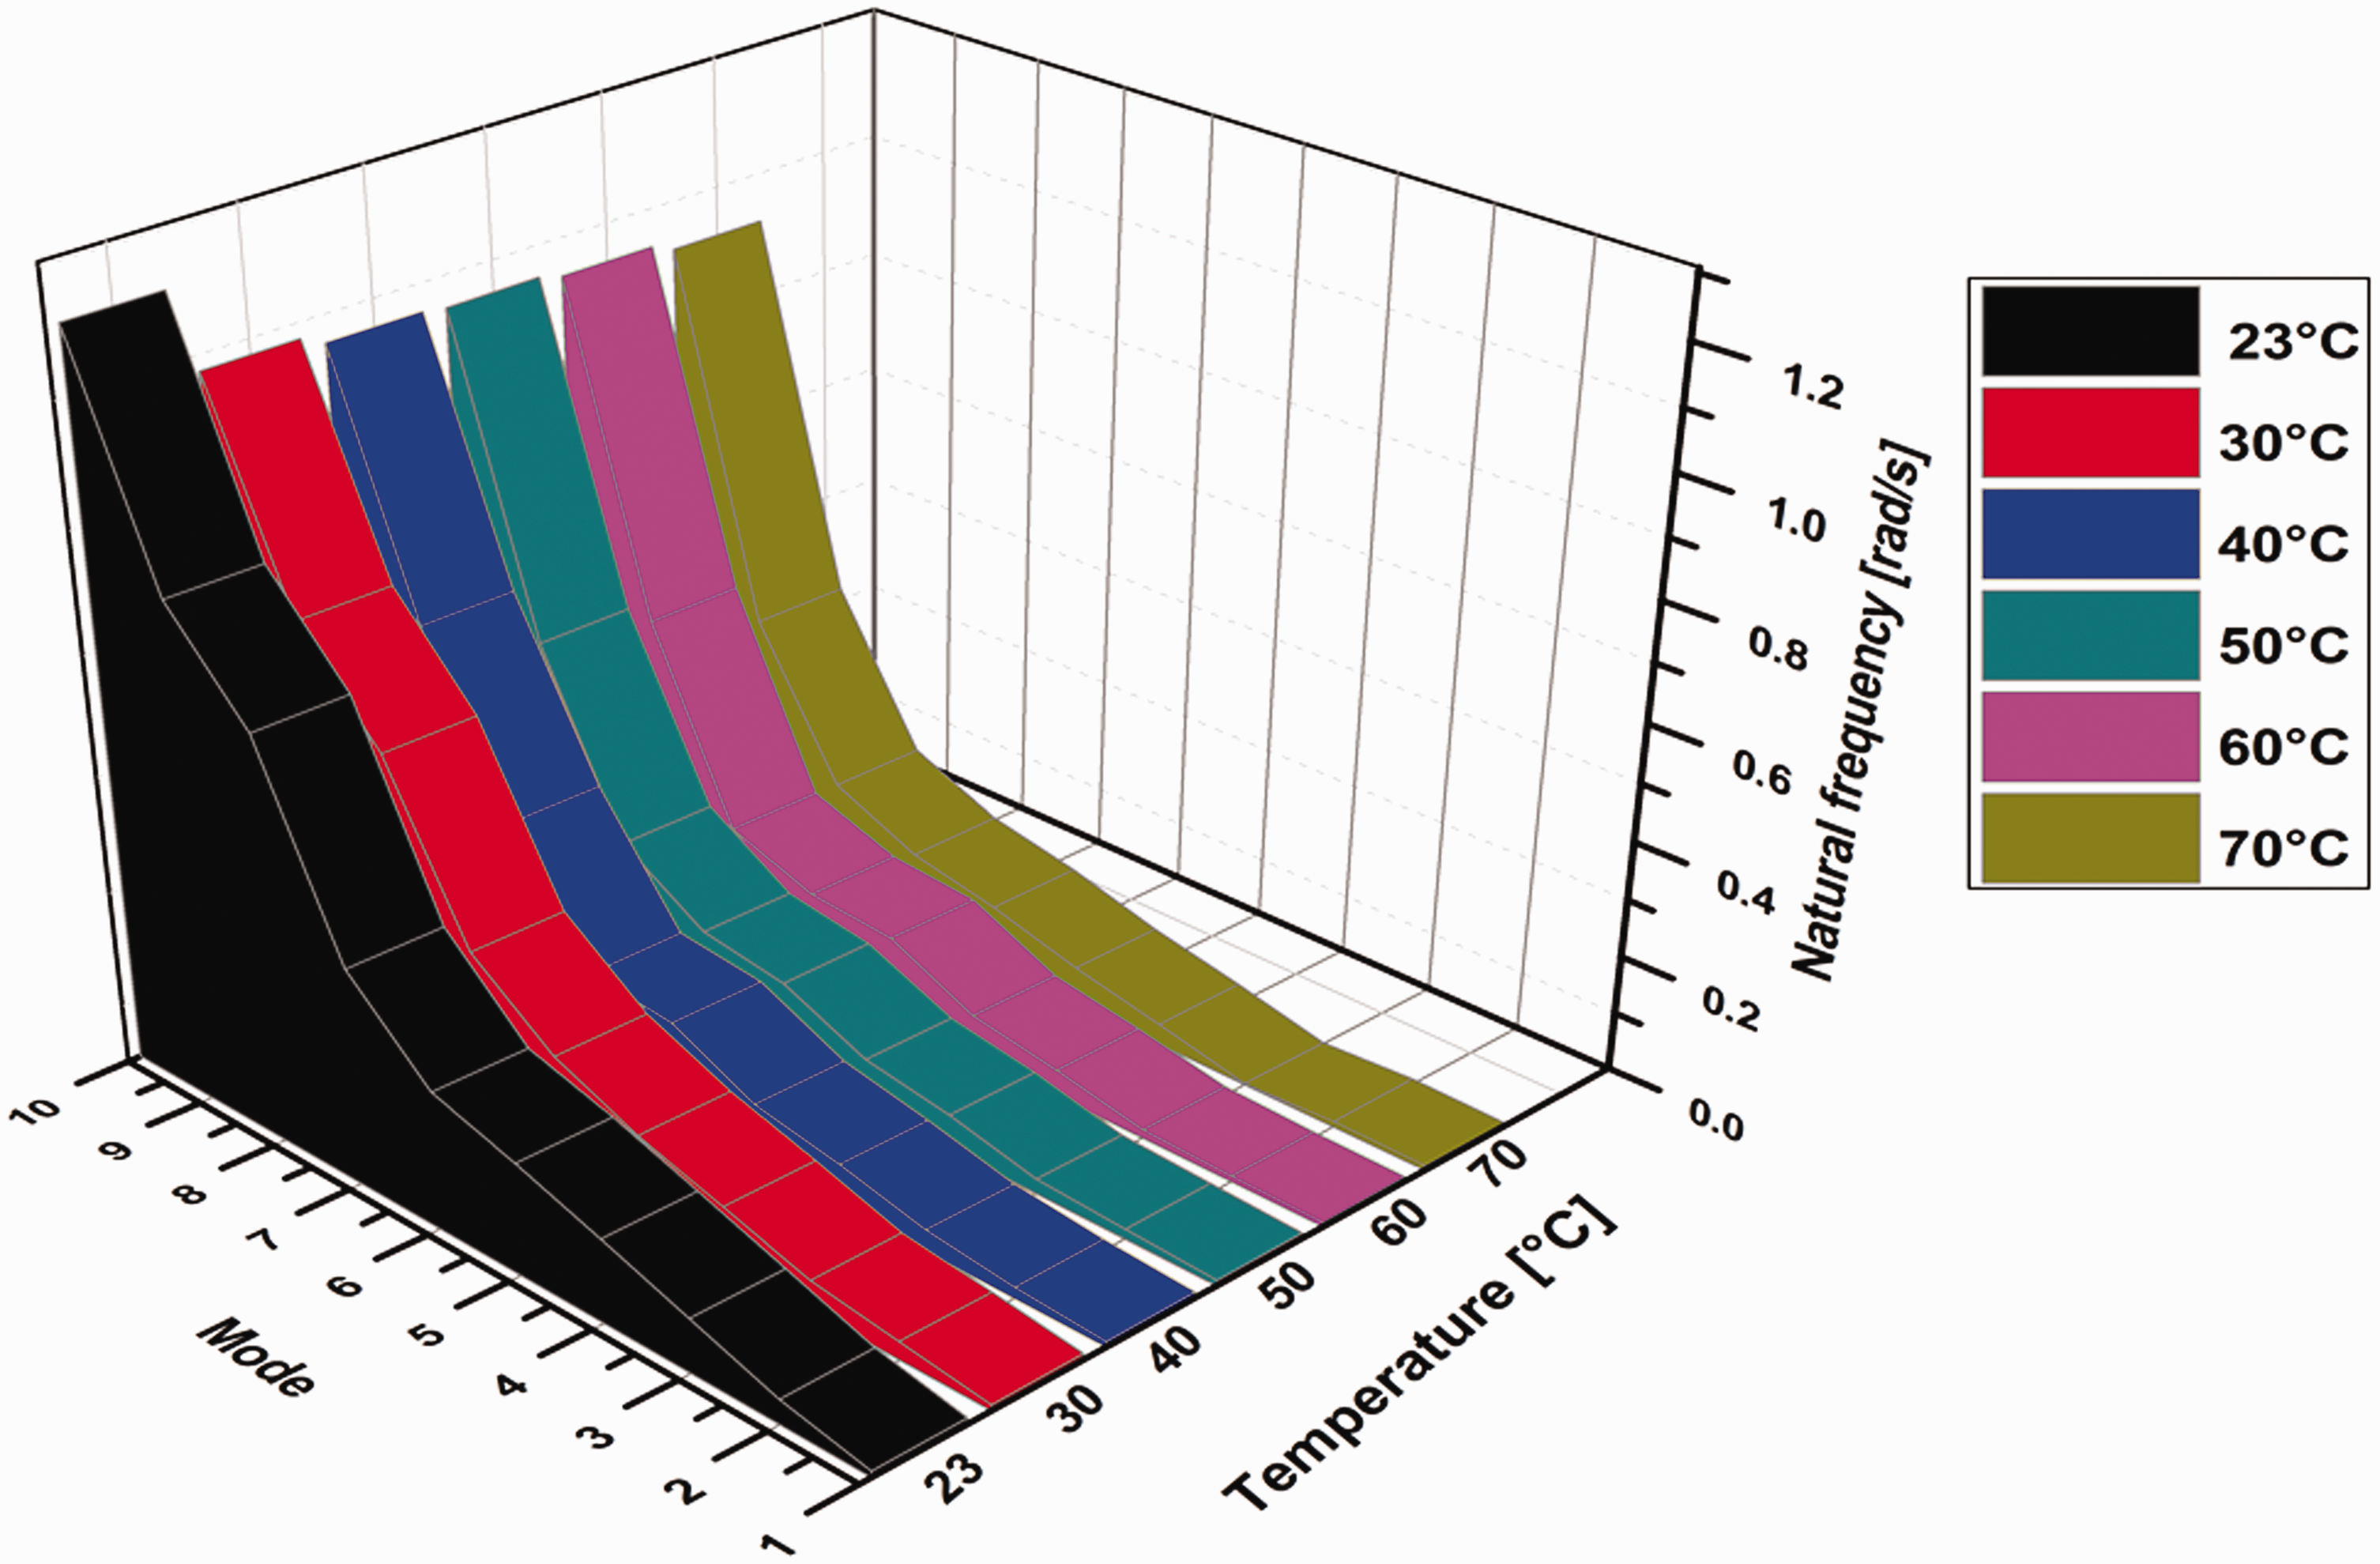
Variation in natural frequency of beam with temperature.
Figure 17 reveals a significant reduction in natural frequency of the beam with temperature due to changes in material properties, in particular, the modulus of elasticity. A phenomenon of crack breathing is directly affected by this variation in natural frequency because of the maximum normalized amplitude of stresses induced in the beam at 70°C. Consequently, it influences the arrival time of the signal due to the elongation or shortening of the path between actuator and sensor. The variation in TOF of acquired signal with temperature is already illustrated in Figure 15. Hence, the variation in natural frequency of beam with temperature has a great impact on the ultrasonic guided wave inspection results which cannot be neglected.
Analytical
Considering the Taylor expansion series described in equation (2), we estimated the phase velocity at 70°C using the S0 phase velocity and change in S0 phase velocity at 23°C. In the next step, based on estimated phase velocity, corresponding group velocity was calculated. The comparison of both the predicted phase and group velocities is presented in Figure 18. The trend of analytical dispersion curves at 23°C matches with the simulation trend shown in Figure 13.
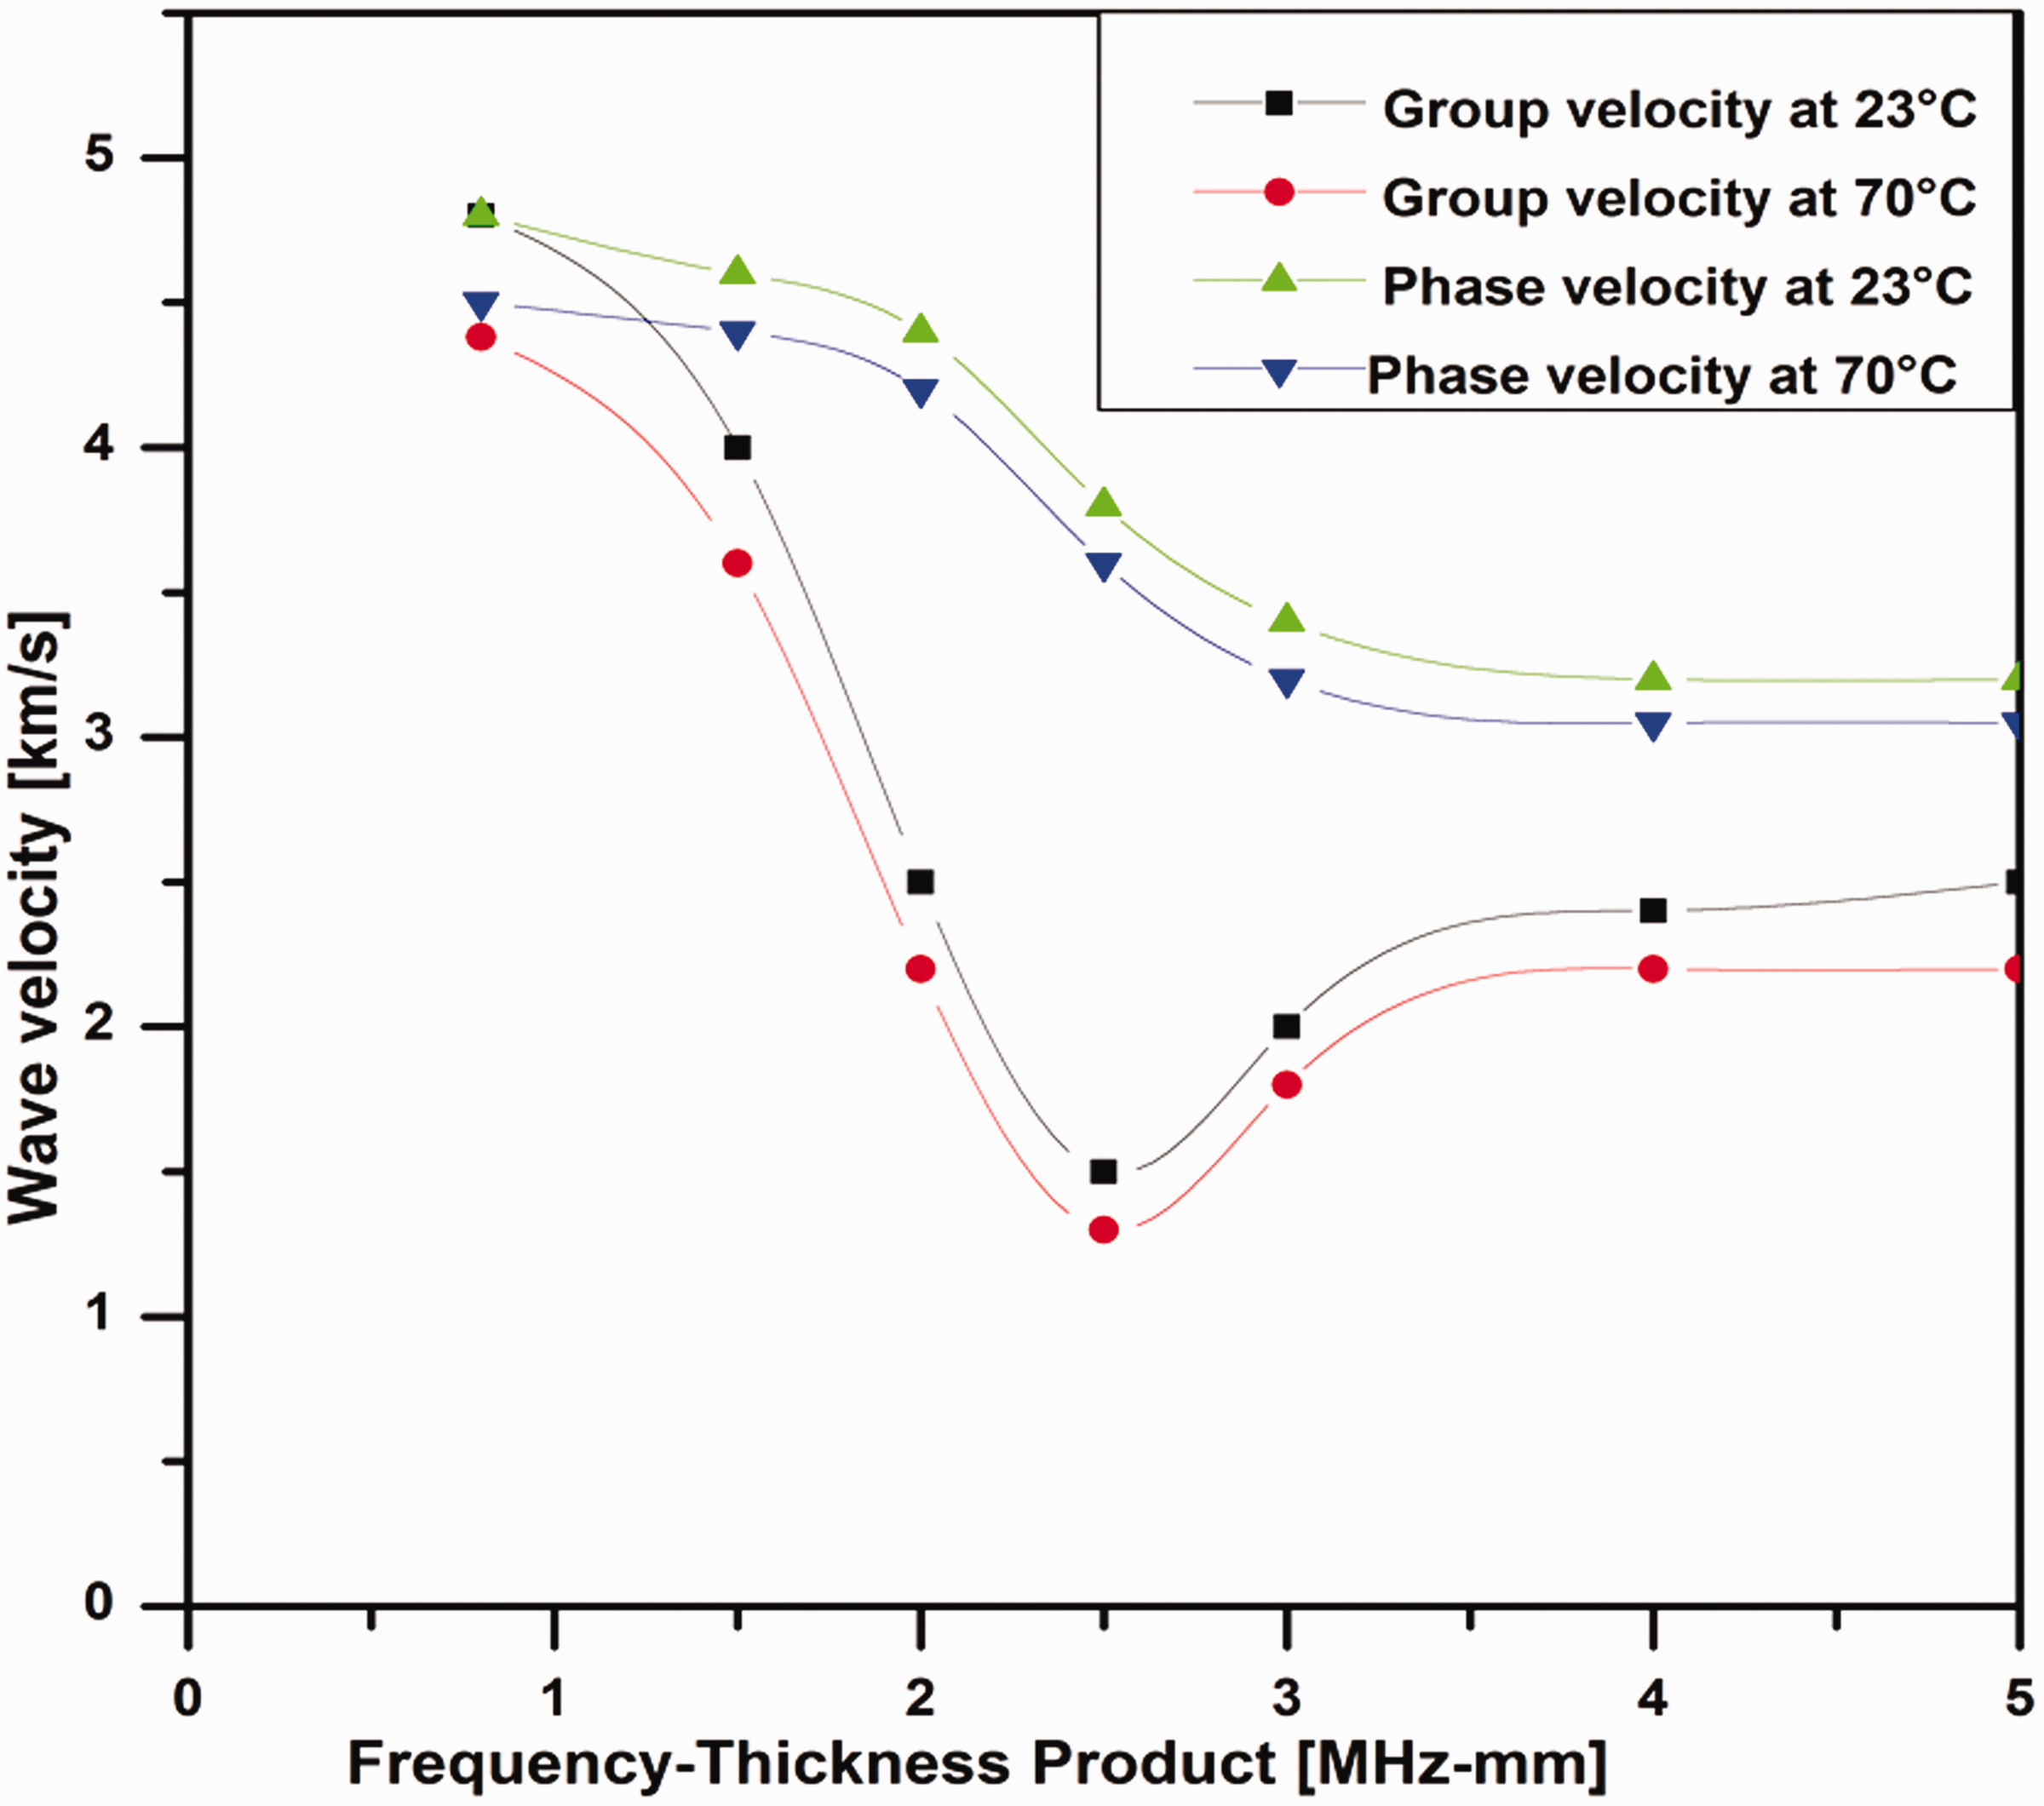
The analytical model of dispersion curves using the velocities calculated at 23°C.
Figure 20 illustrates the dispersion curves for the different values of the analytical group velocity of S0 wave mode. These curves were determined by equation (1) and temperature sensitivity dispersion model 29 utilizing the variation in material elastic properties (shown in Figure 19) with respect to temperature.
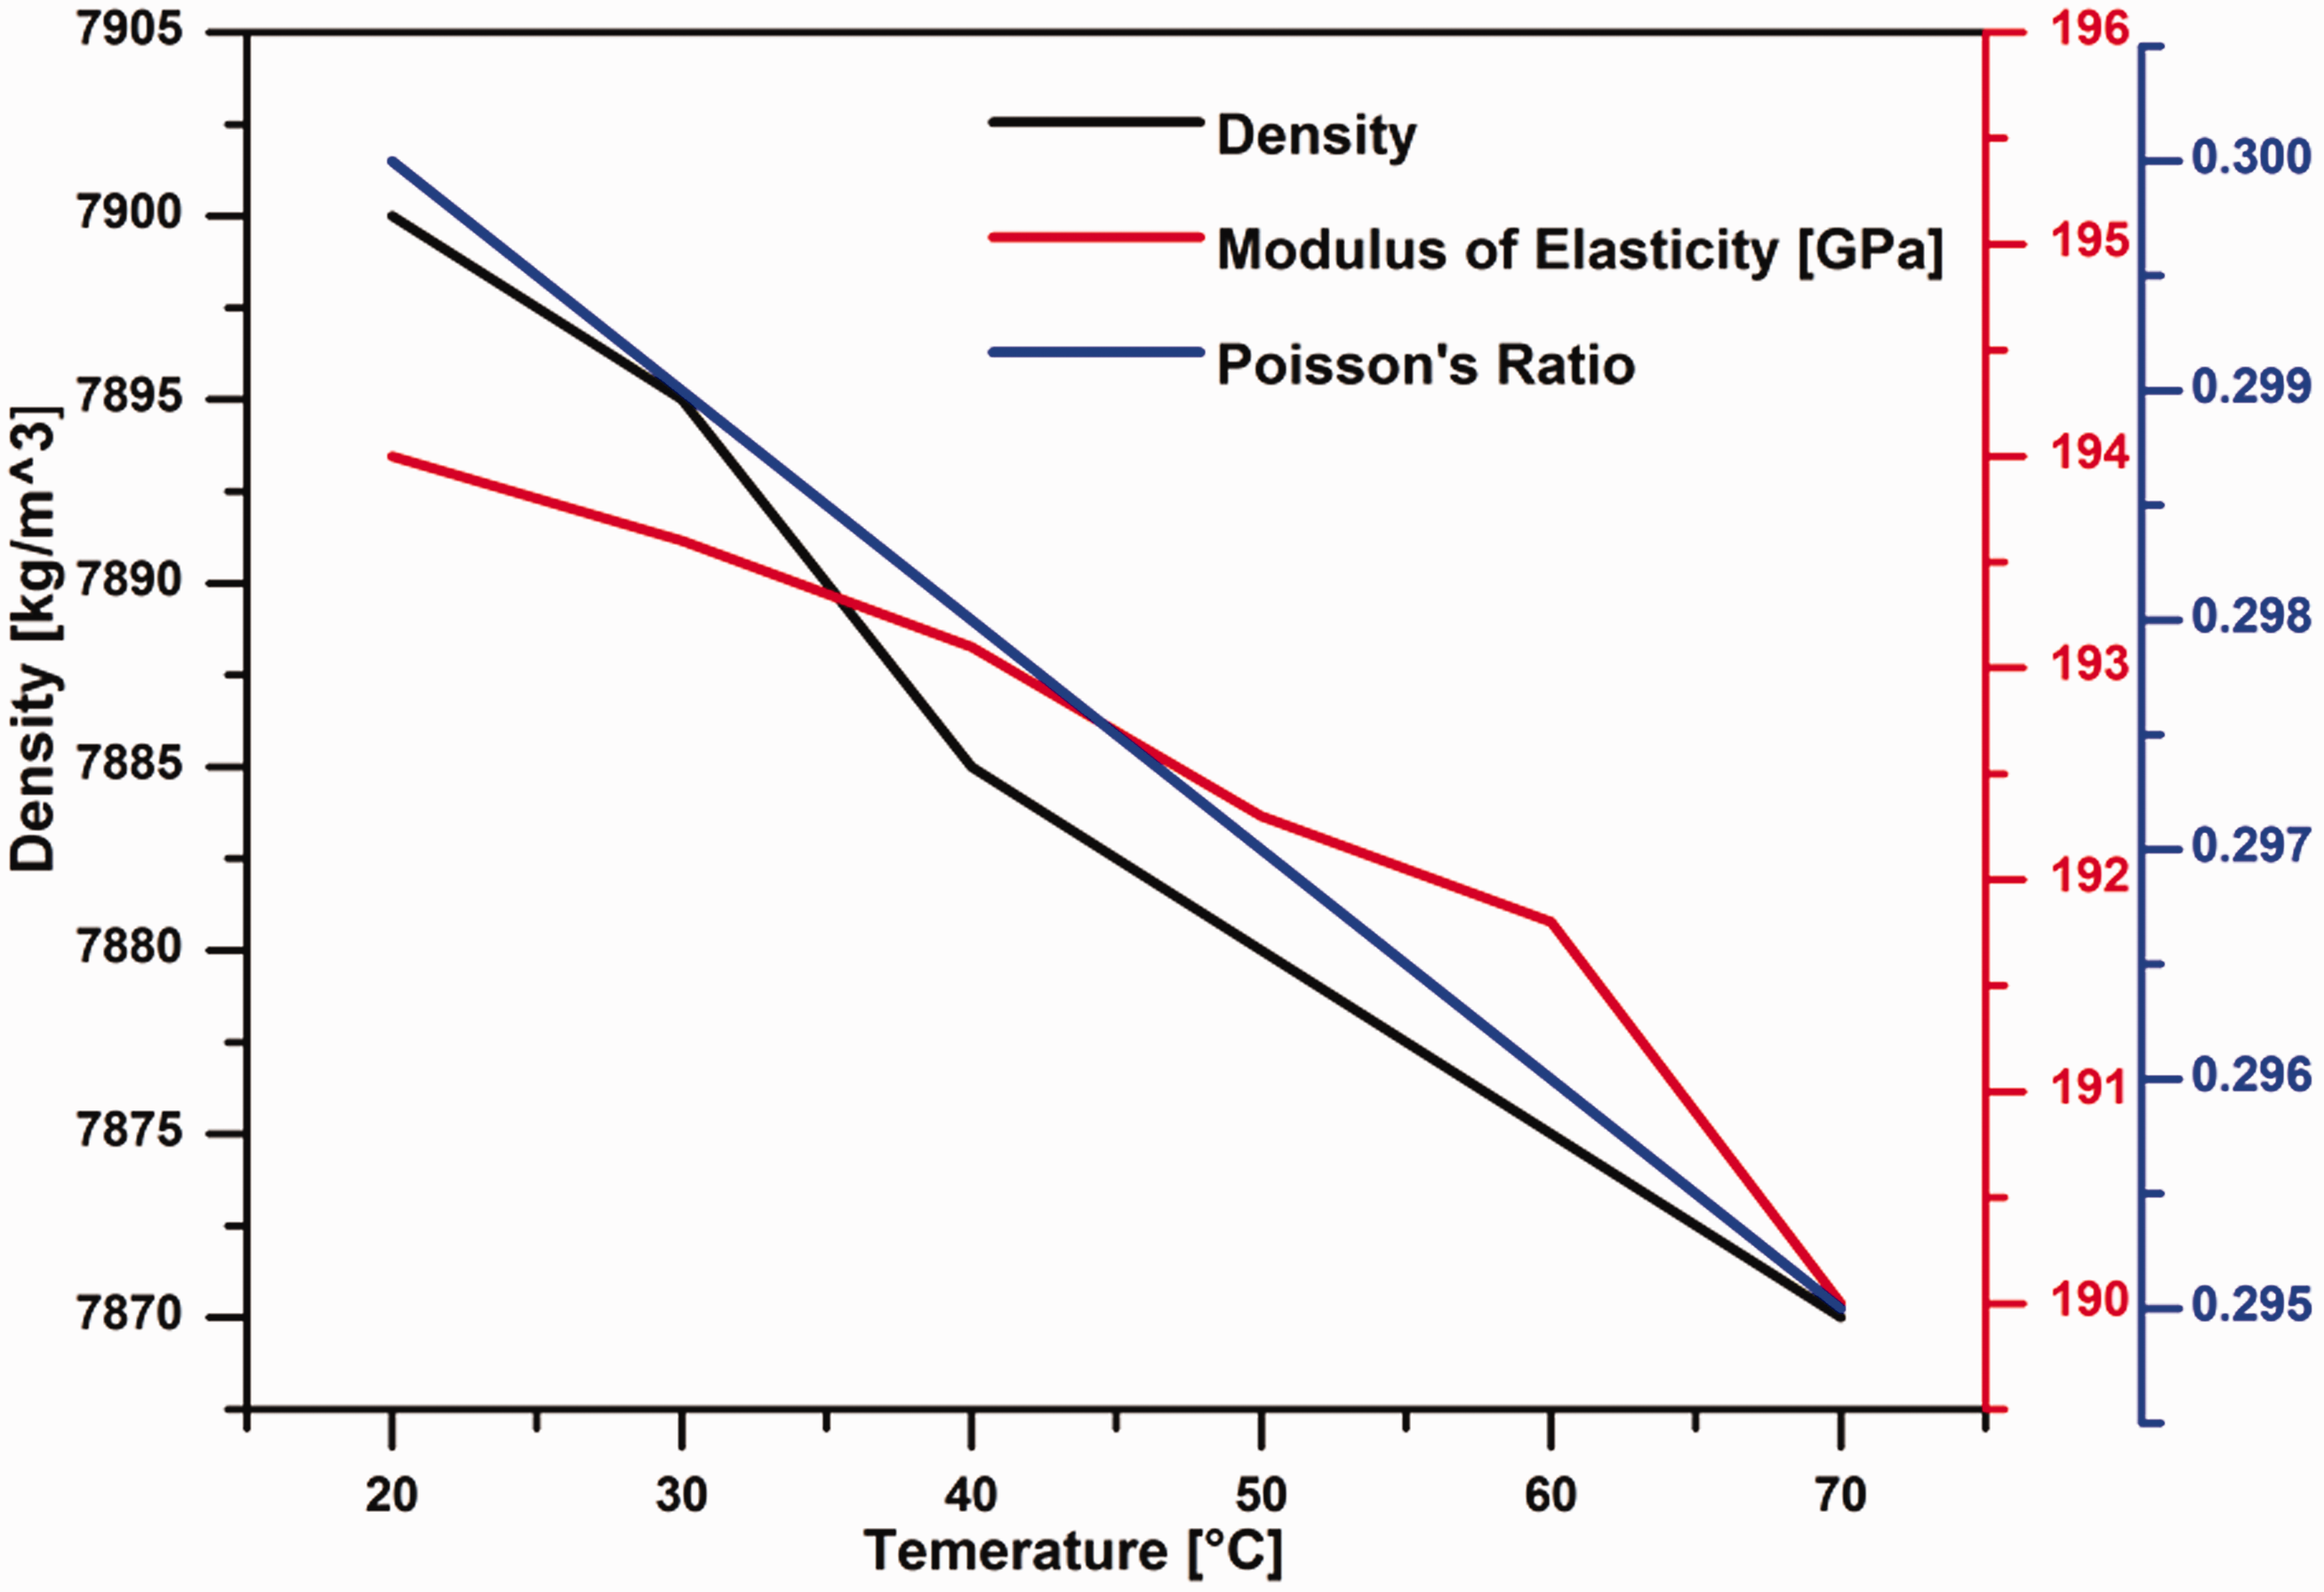
Increment in temperature affects the thermal expansion/contraction of the beam, which alters its density, modulus of elasticity, and Poisson’s ratio. Figure 19 illustrates that value of Poisson’s ratio will decrease with temperature, but this change is relatively small over the given temperature range. Because this change is so small over the normal room temperature, the Poisson’s ratio can be assumed constant in the current scenario and also in real-time ultrasonic guided wave inspections. Moreover, the change in density is also much less as compared to change in modulus of elasticity. So we can deduce a result that the largest effect of change in material properties because of environmental temperature during the guided wave inspection is due to changing the modulus of elasticity. This fluctuation in material properties affects the crack breathing (opening and closing), and its magnitude depends on the applied thermal load. In Figure 20, it is clear that analytical group velocity curves firstly decrease and then increase with frequency accordingly. Further, the variation in analytical group velocities is almost zero at the Frequency-Thickness Product of 0.8 MHz-mm and in the temperature range of 23°C to 30°C, which demonstrates the temperature invariant point for theoretical group velocities of guided waves. Hence, Figure 20 verifies the two simulation assumptions. First, the change in temperature leads to a decrease in the group velocity of S0 mode. Second, the temperature invariant points are not insensitive to the entire defined temperature range, but exhibit minute variation for normal operating temperatures and low excitation frequency of 100 kHz. A convincing manner comparison analysis with minute percentage error is achieved in Figure 21 between Numerical Fitted Linear Curve and analytical values of group velocity curve at 100 kHz in the temperature range of 23°C to 70°C.
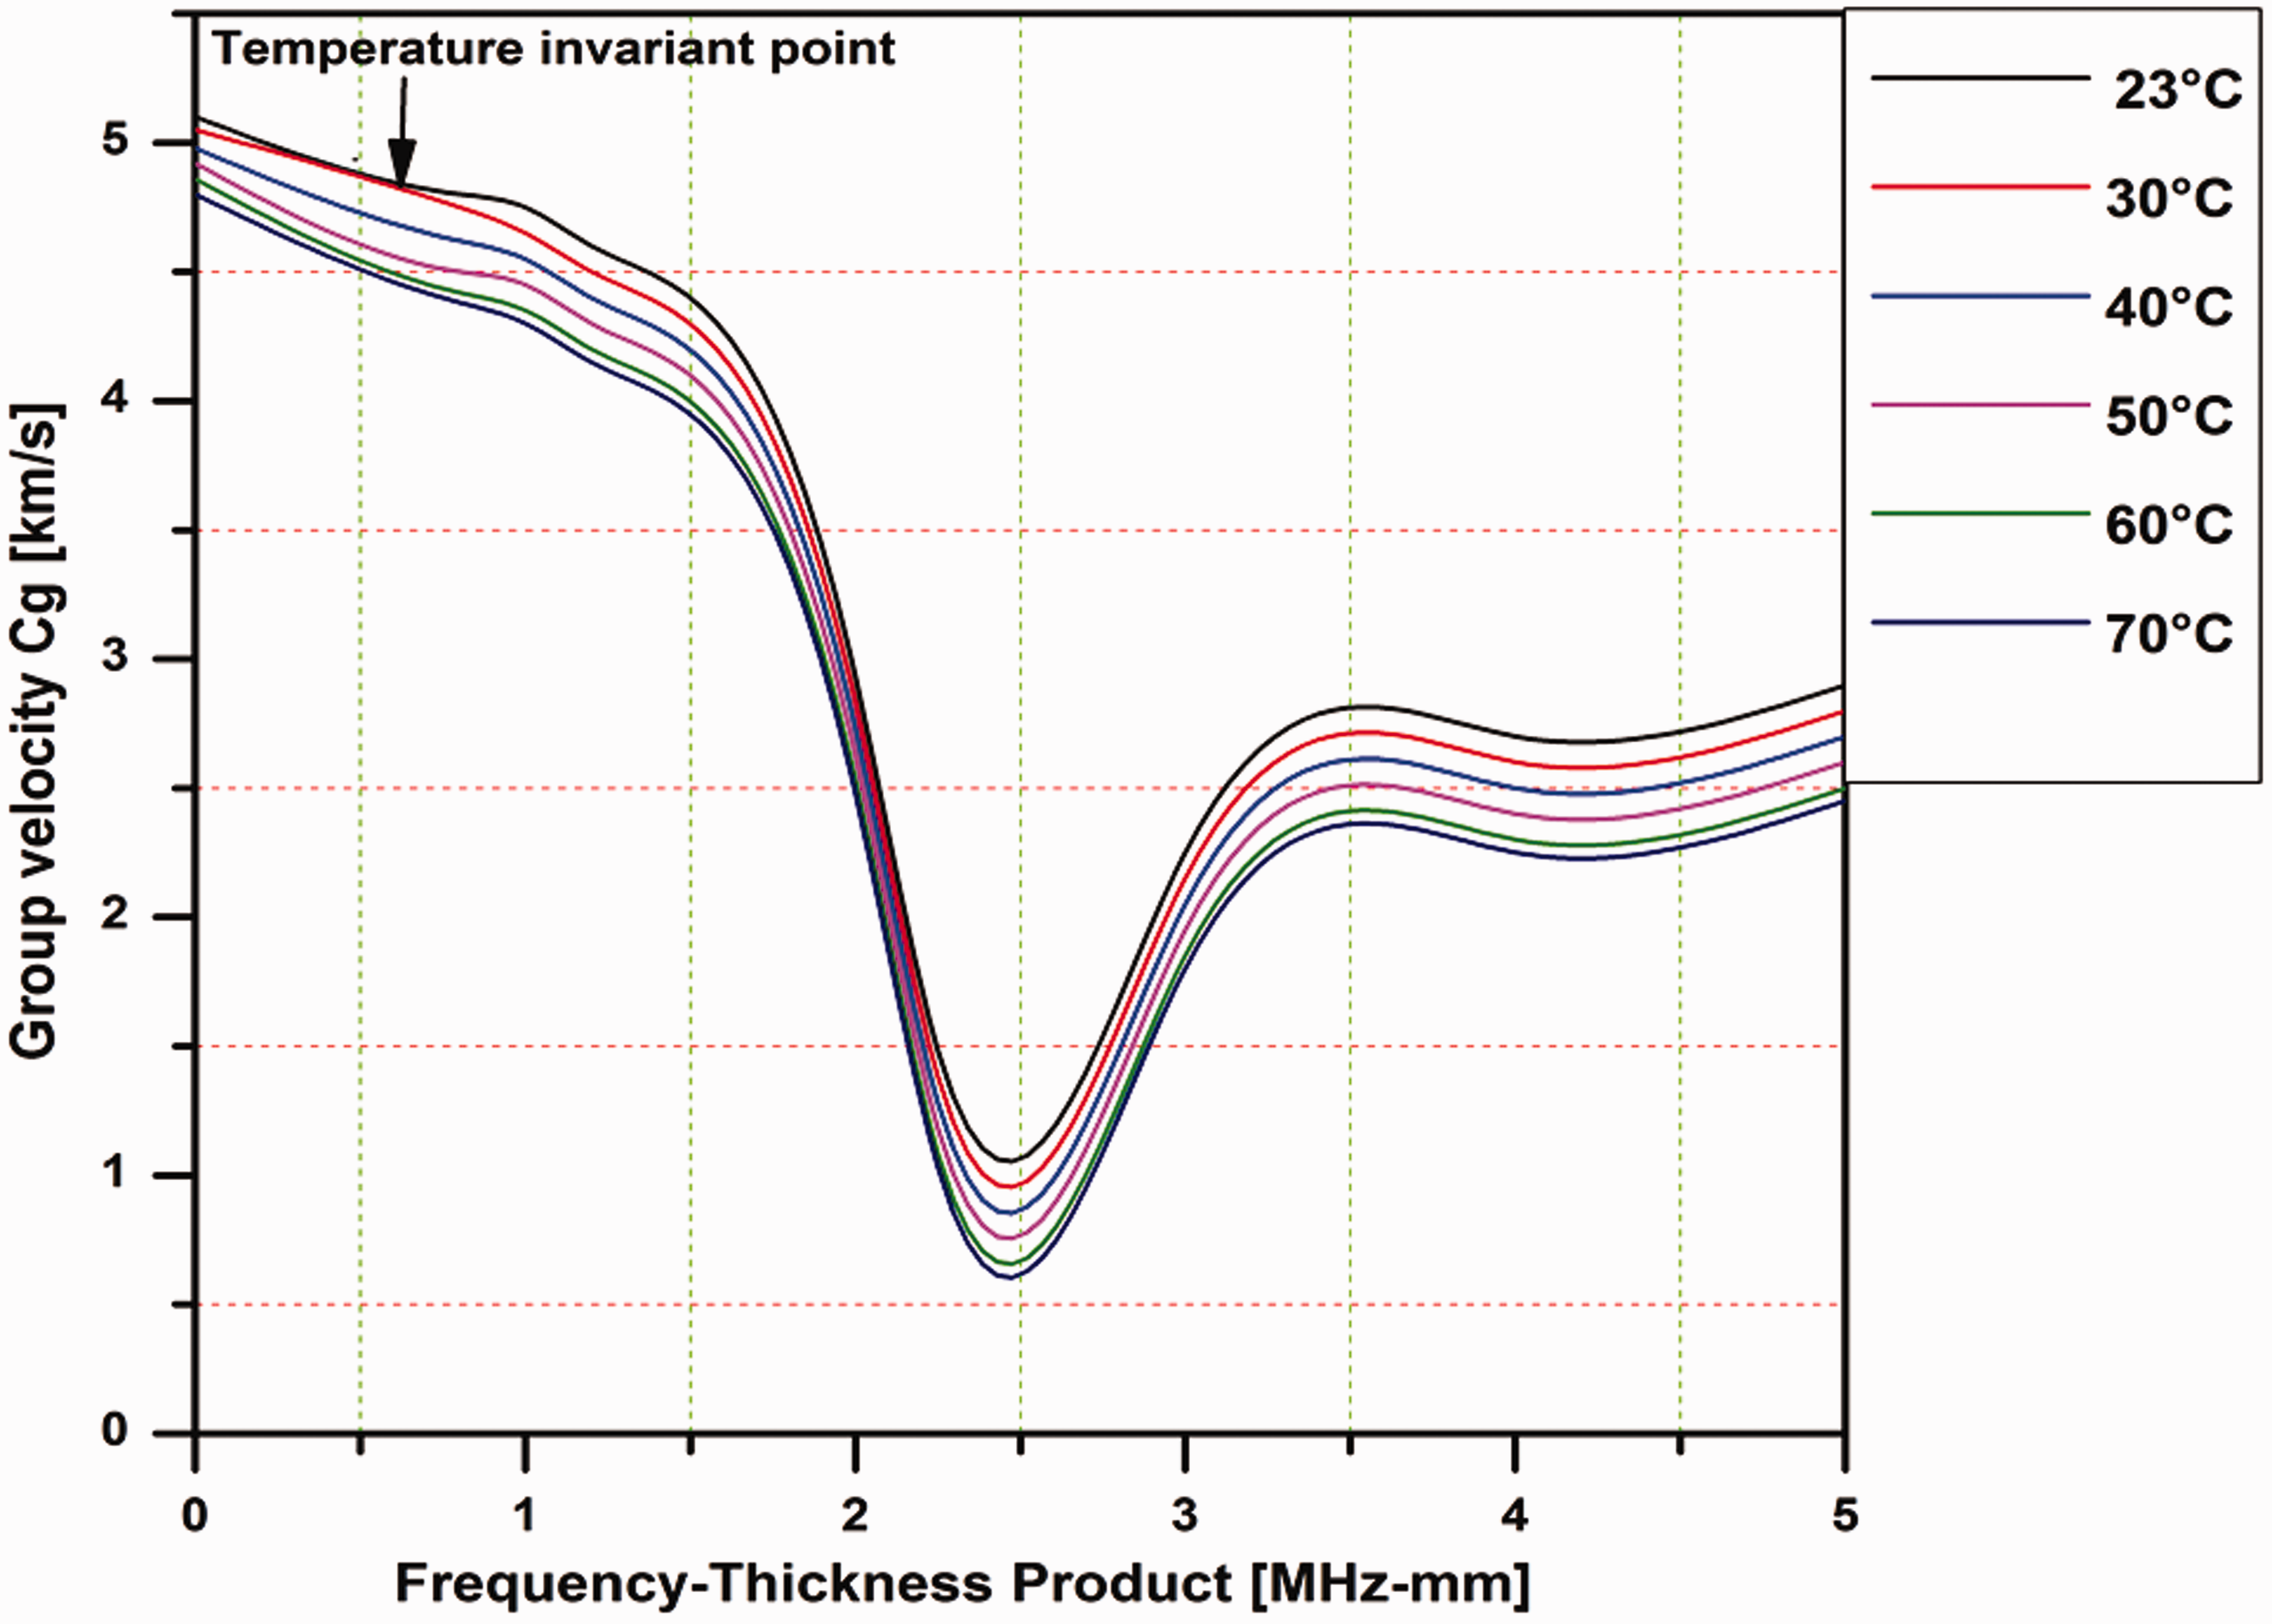
Dispersion curves for the different values of the analytical group velocity of S0 wave mode.
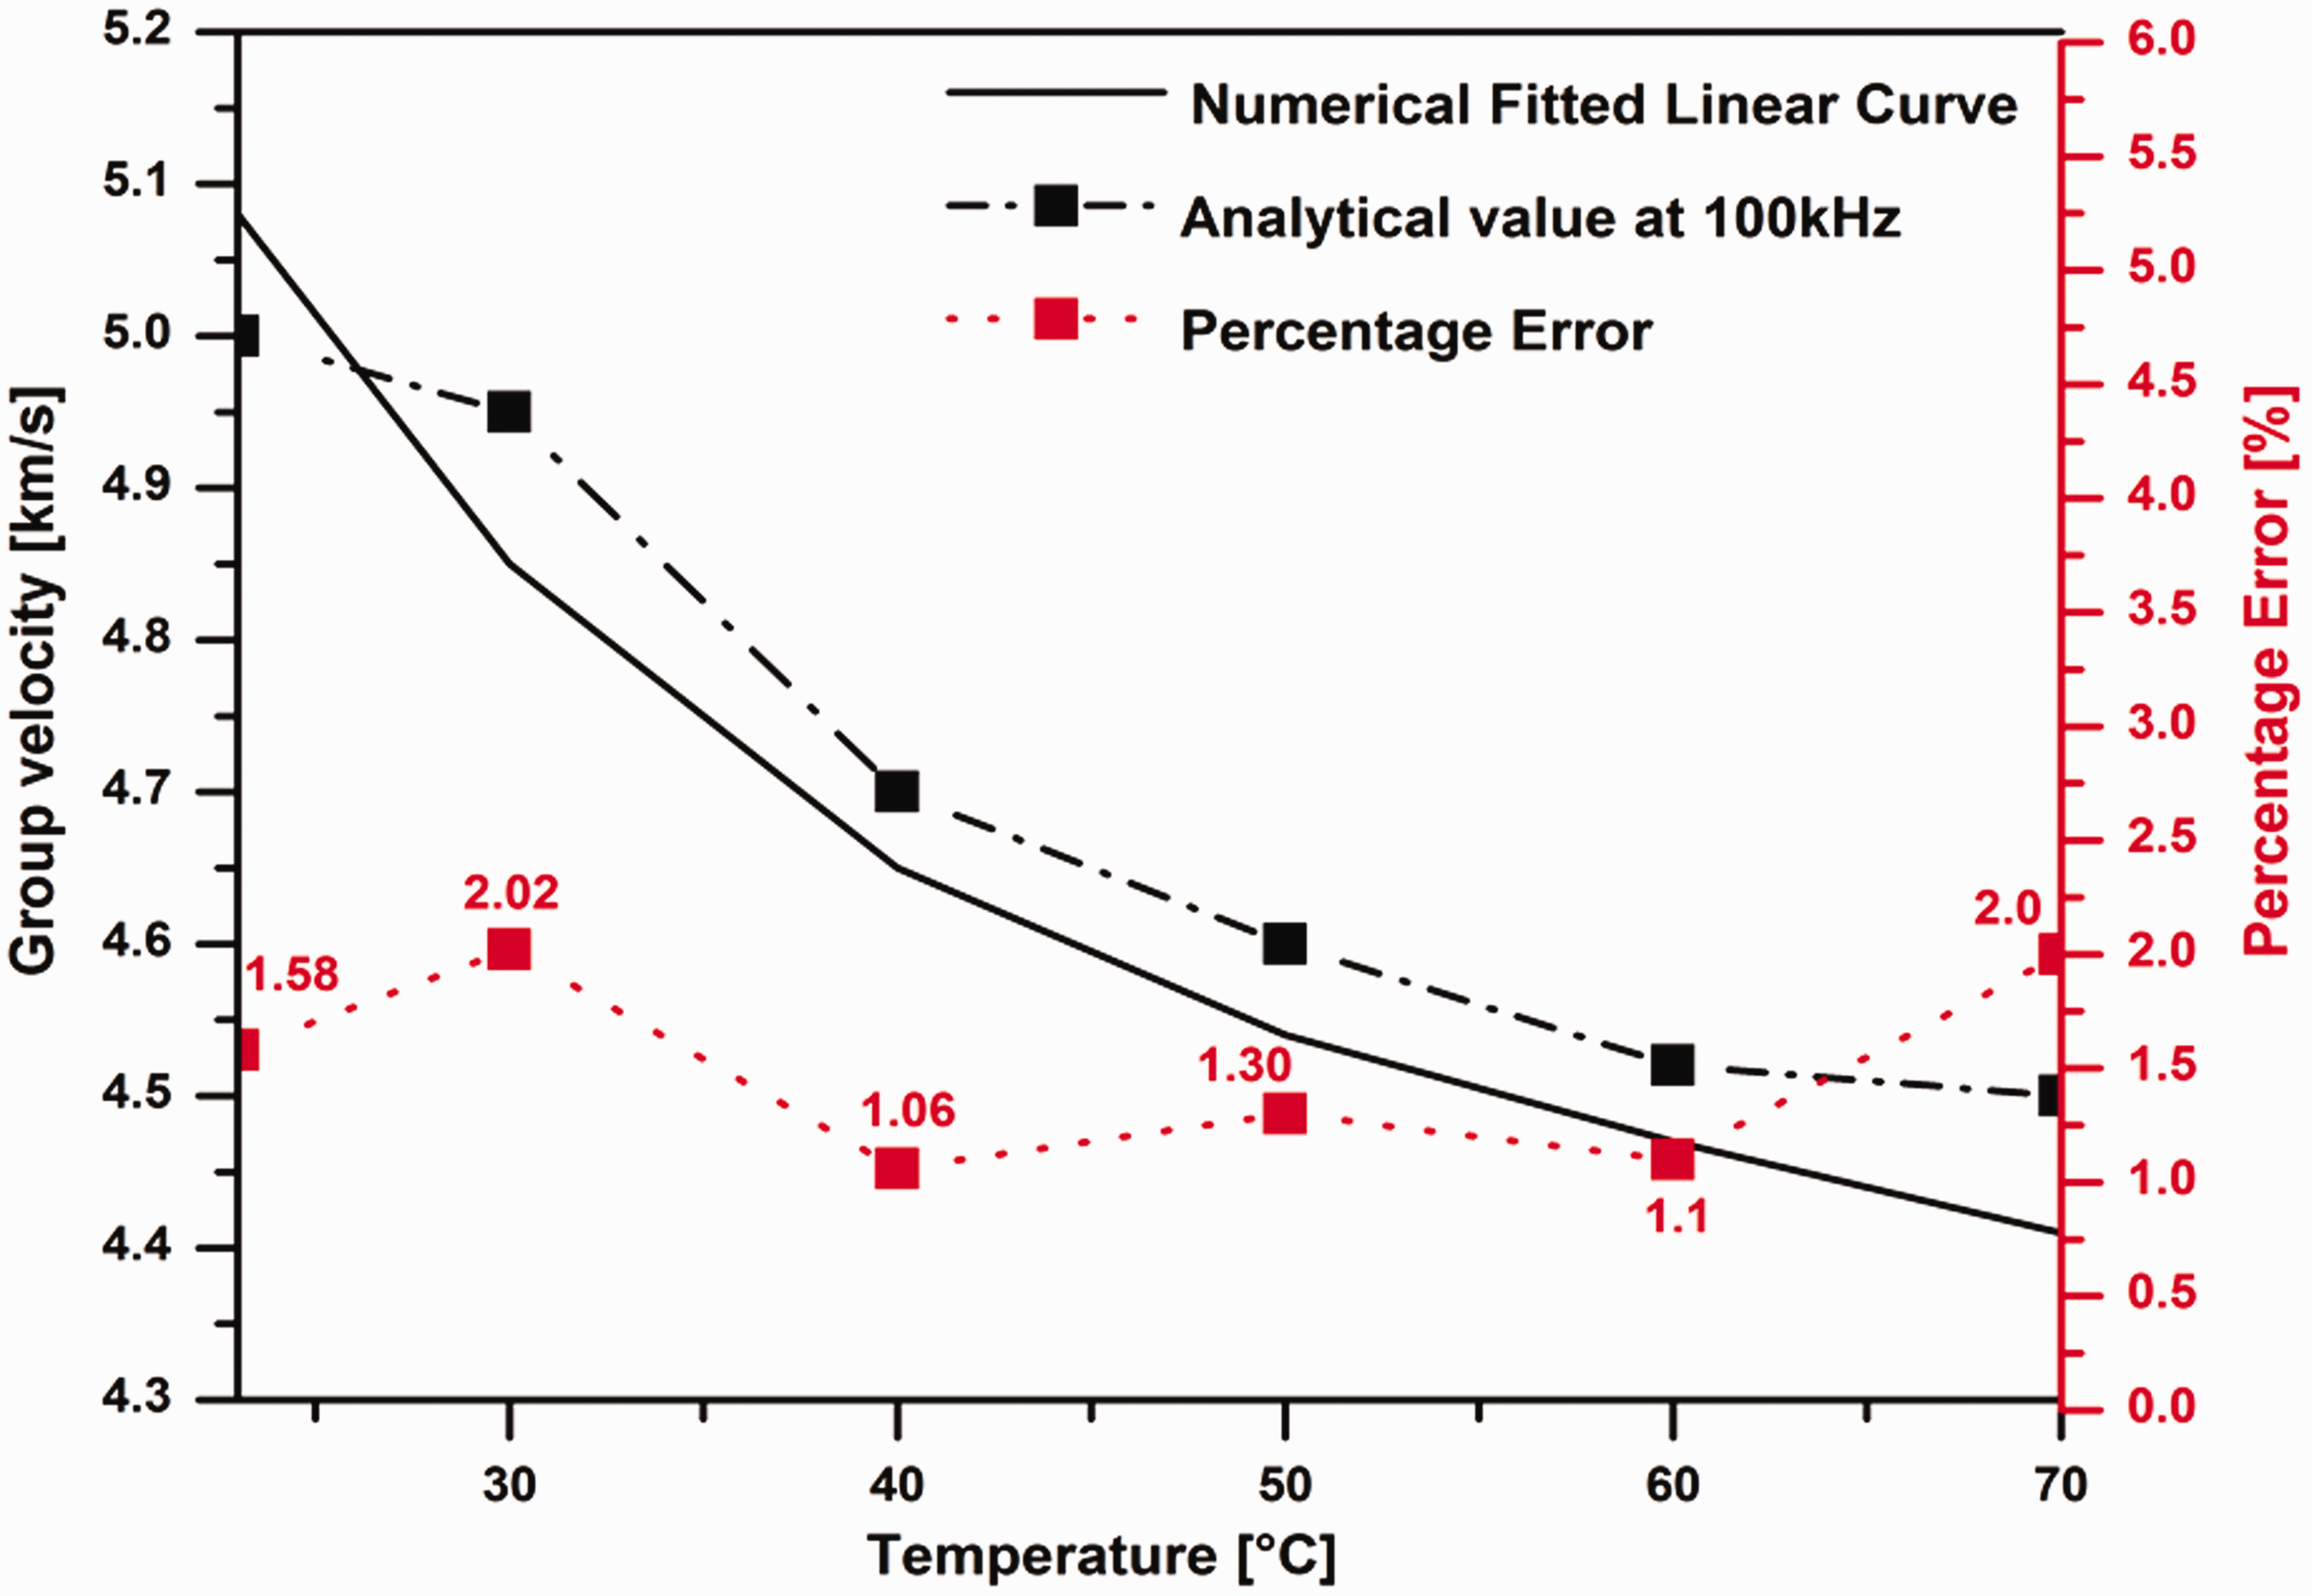
Comparison of temperature and frequency-dependent analytical group velocity curves with a numerical fitted linear curve.
Hence this comparison verifies the proposed wave velocity function in equation (7) and reveals that ultrasonic guided waves have considerable thermal sensitivity during the damage detection in stainless steel beam of 304-grade with crack.
Experiment testing
In order to further verify the simulation model and determine the error rate for comparison, an experiment was carried out in the laboratory. Experiment setup consists of stainless steel (304) beam of dimensions 650 × 24 × 8 mm with a fatigue crack of 10 mm, and 202 V1 constant temperature drying oven chamber to experimentally investigate the effect of temperature on wave amplitude. Four PZT patches with the dimensions of 20 mm × 5mm × 0.8 mm are surface-mounted at both ends of the beam as the actuator and sensor. Five cycles sinusoidal wave modulated by Hanning window is adopted as the excitation signal of guided waves. And the central frequency of excitation signal from 100 kHz to 175 kHz with the step of 25 kHz is respectively investigated under different temperature values (23°C–70°C). The transmission and reflection signals from a cracked beam under applied thermal conditions are acquired by the sensor and saved by the digital phosphor oscilloscope (Tektronix DPO 3014). There are only A0 mode and S0 mode under the selected central frequencies which is convenient to observe the influence of applied temperature. The experiment test setup is shown in Figure 22.
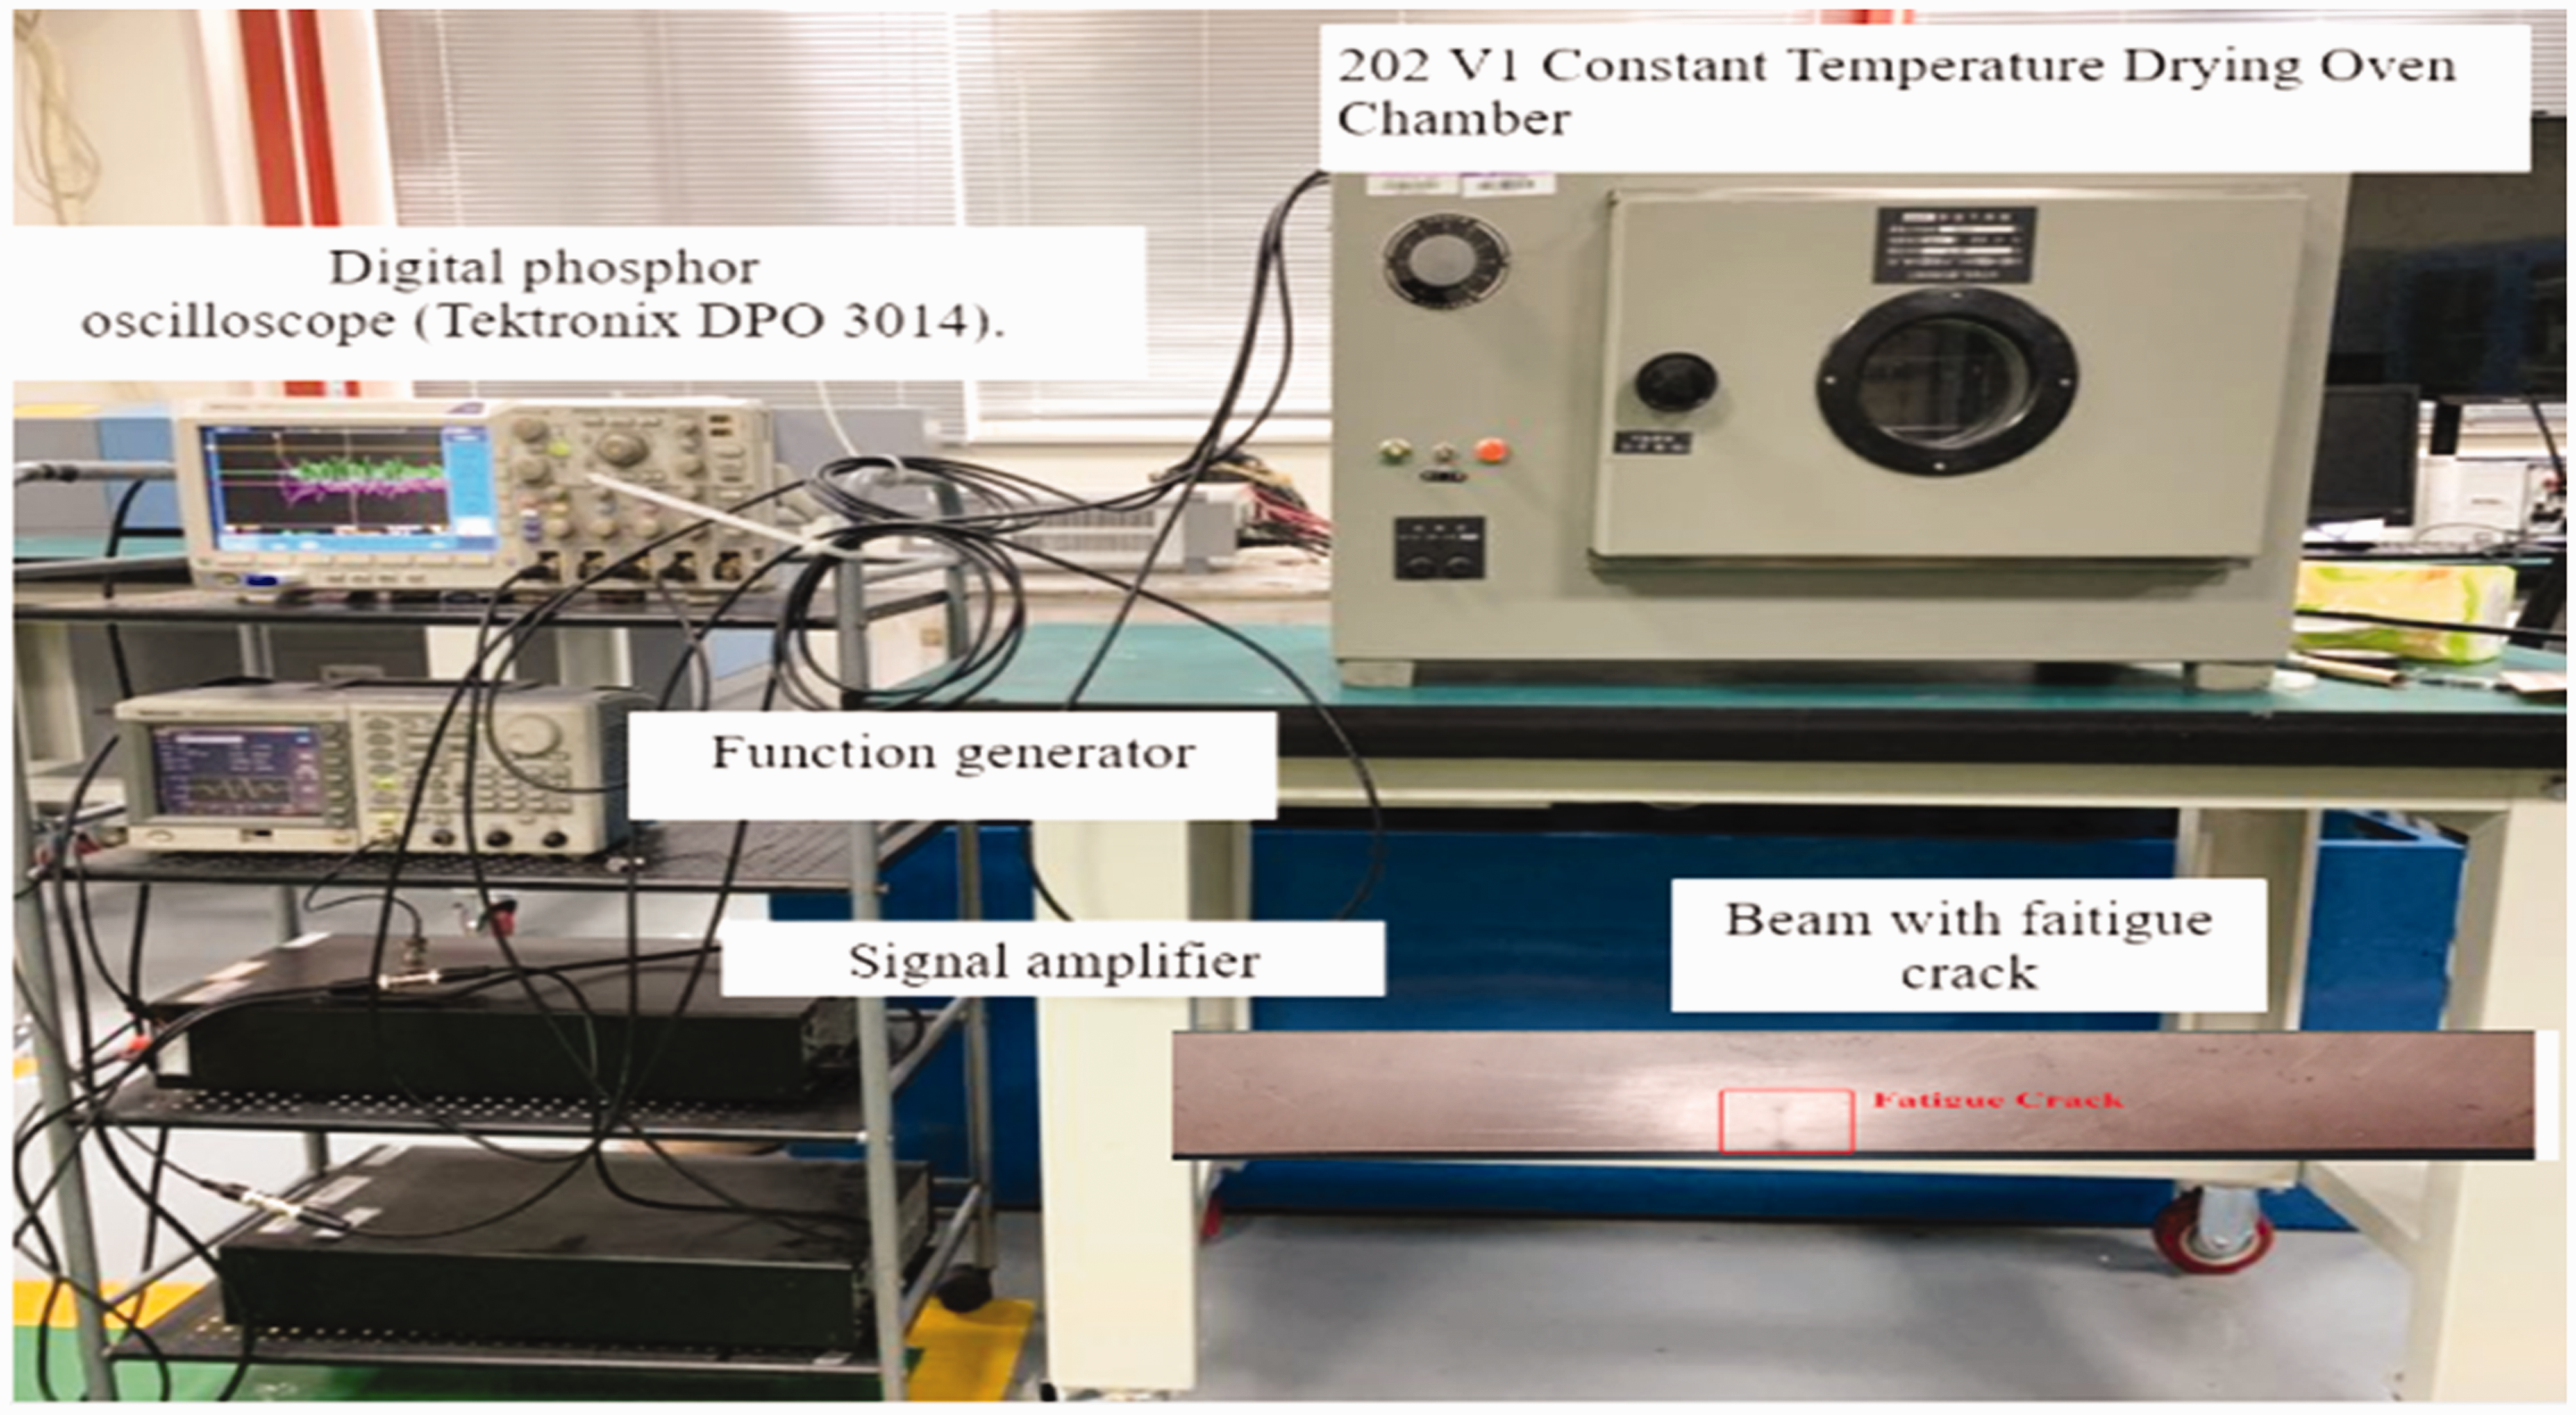
Experiment test setup.
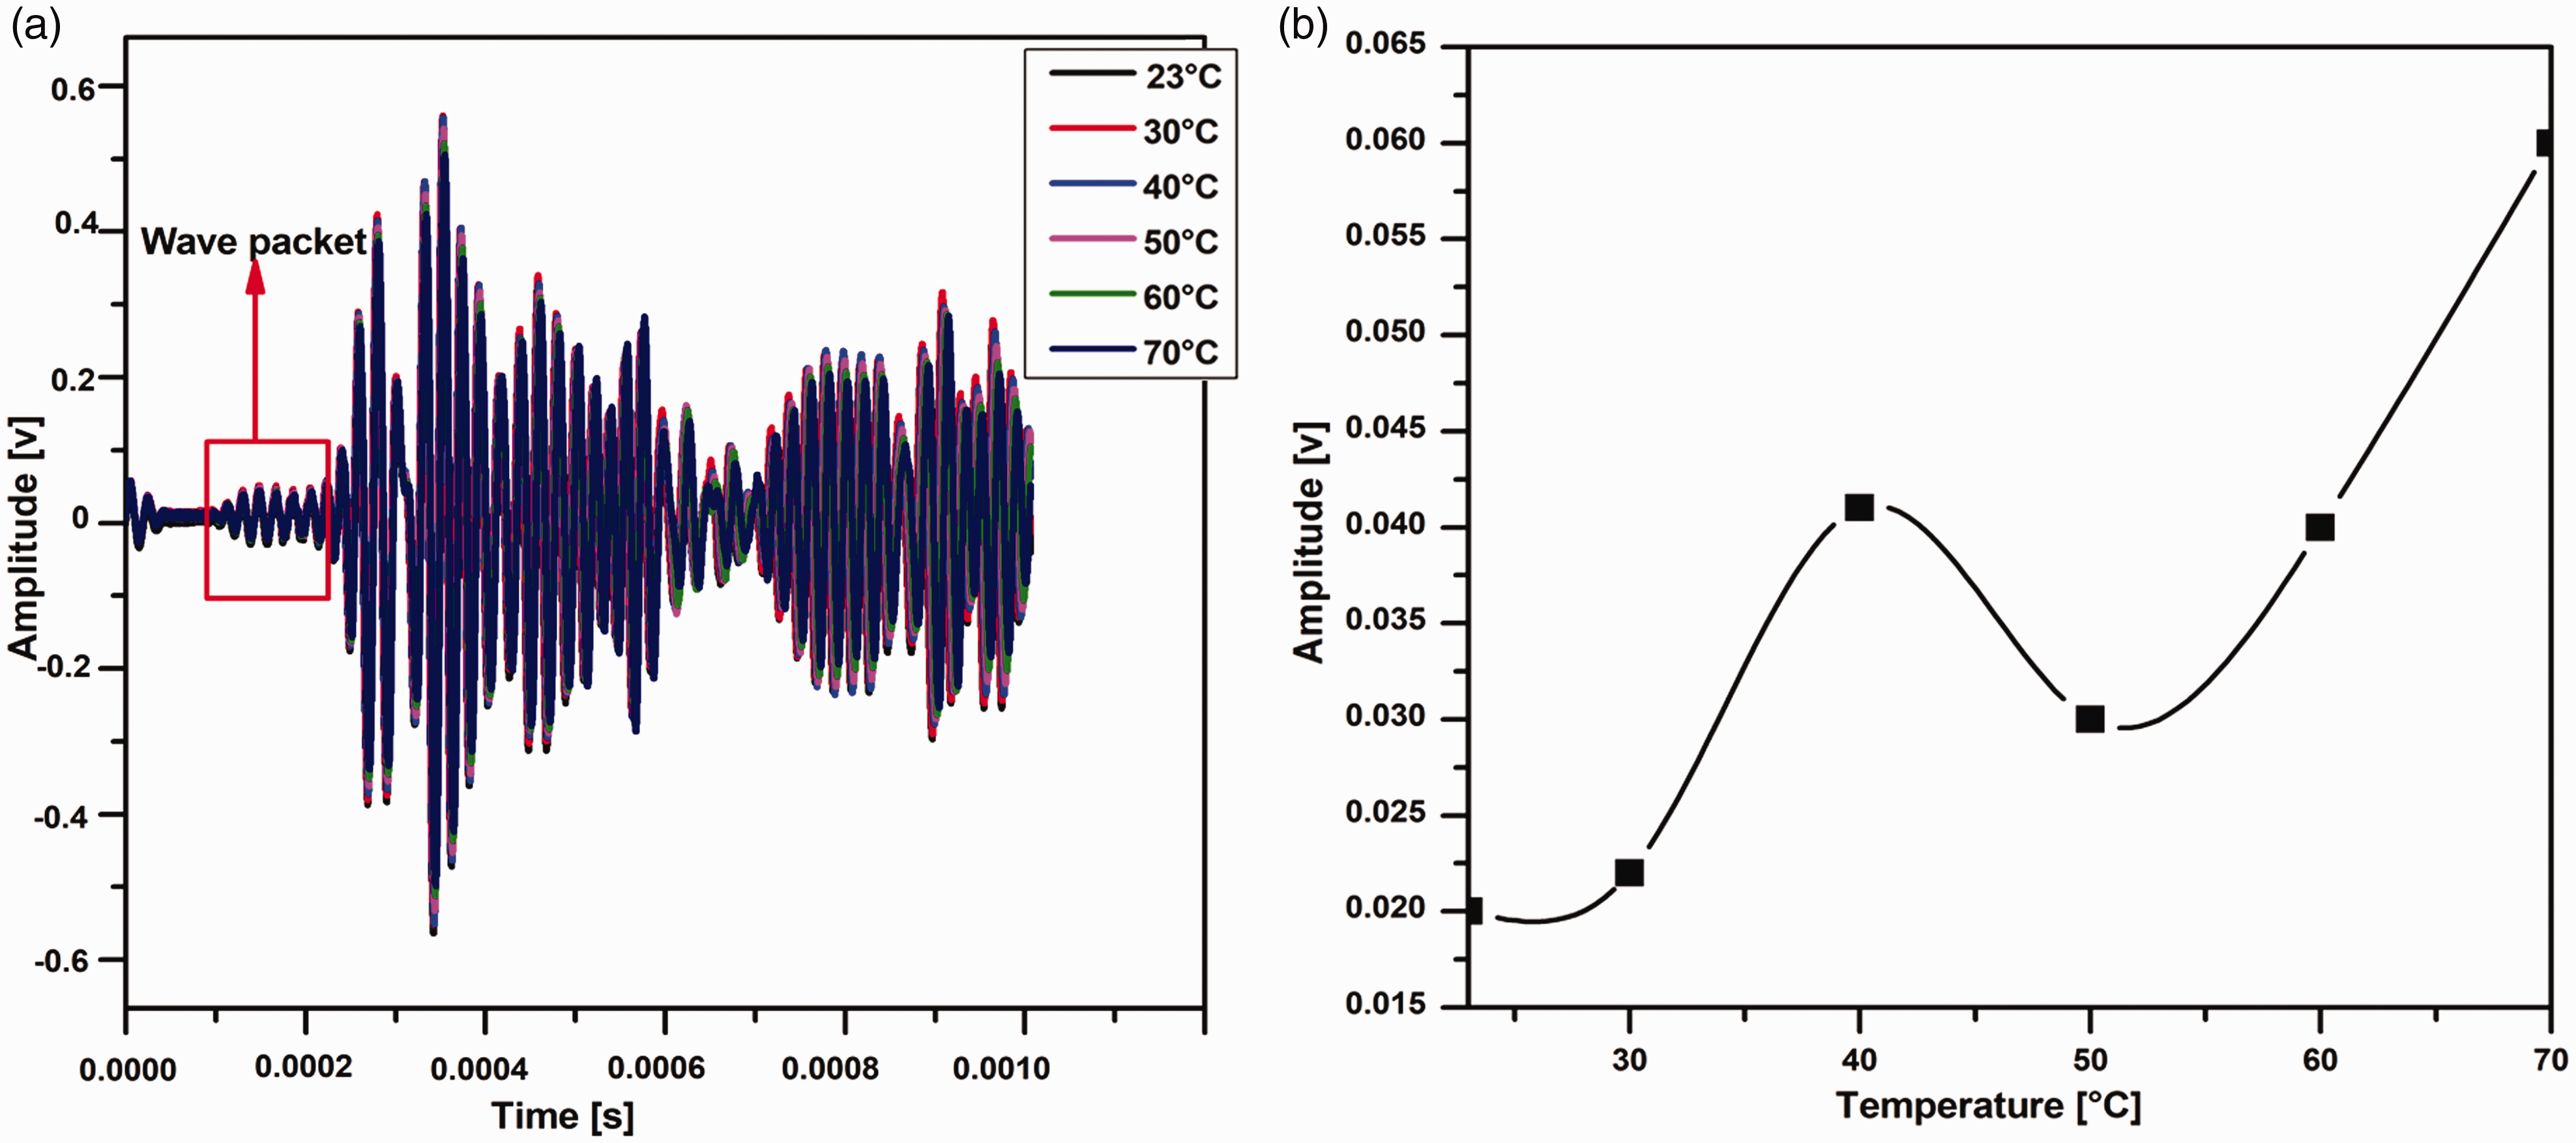
The time-domain signals of guided waves taking the effect of excitation frequency (100 kHz) and temperature (23°C–70°C) into account are shown in Figure 23(a). It is shown that with the increase of temperature, the amplitude of acquired signal increases and the wave peak gradually shift to the right, which represents the reduction of group velocity. Figure 23(b) demonstrates the amplitude of the first wave packet with temperature. It exhibits the same trend which we achieved in numerical analysis and verifies the effect of temperature on defect sensitivity in ultrasonic guided wave inspection.
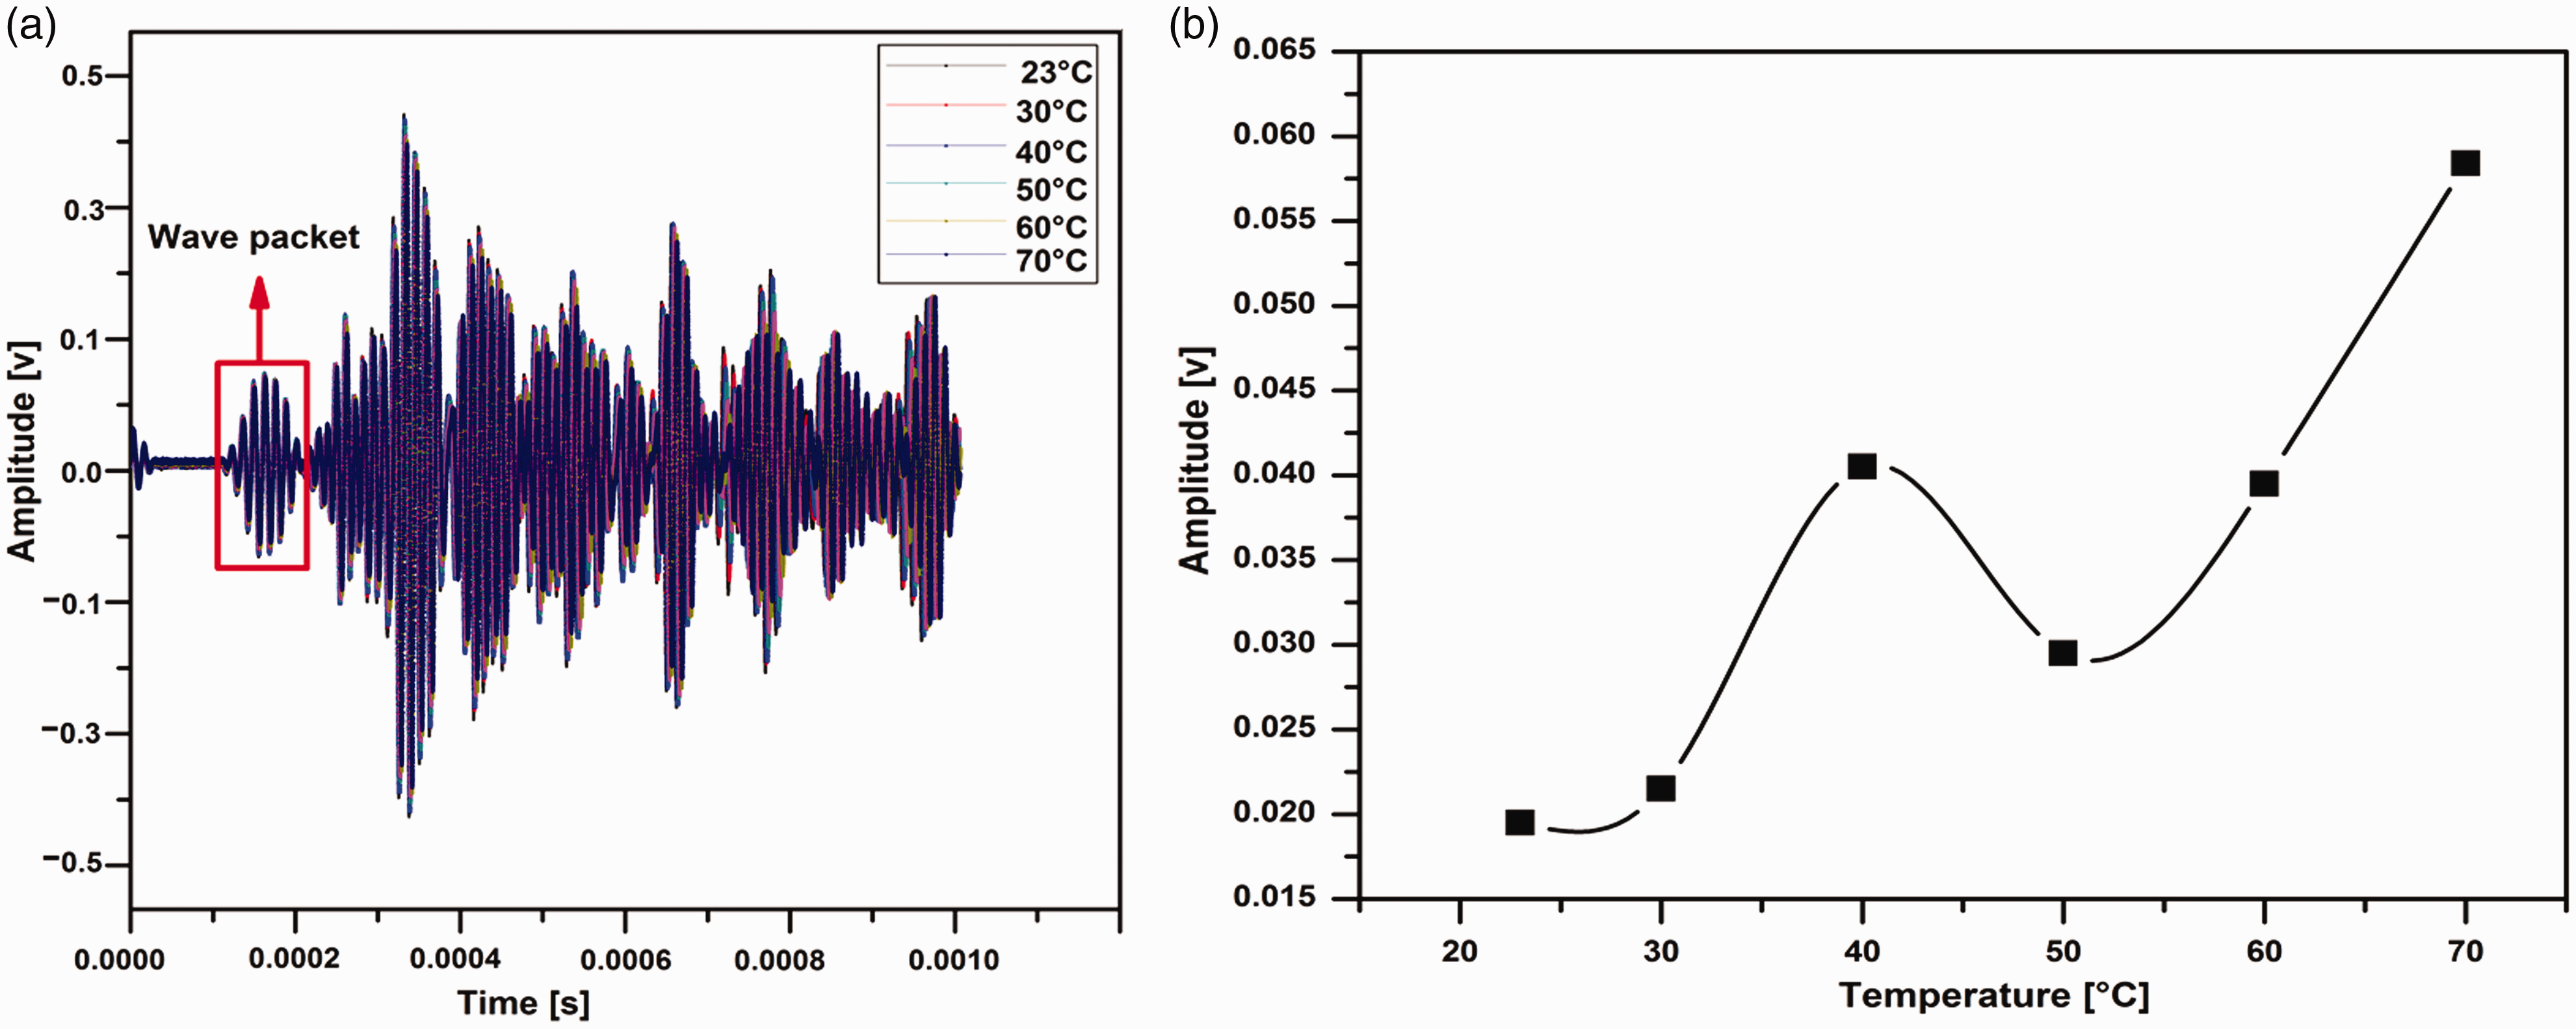
Received signals with excitation frequency of 100 kHz at different temperature: (a) The time-domain signal and (b) the amplitude of wave packet at different temperature.
The comparison between experiment and simulation wave packet amplitudes at different temperature is illustrated in Figure 24 with percentage error. We can observe a good agreement between simulation and experiment results with a minute error.
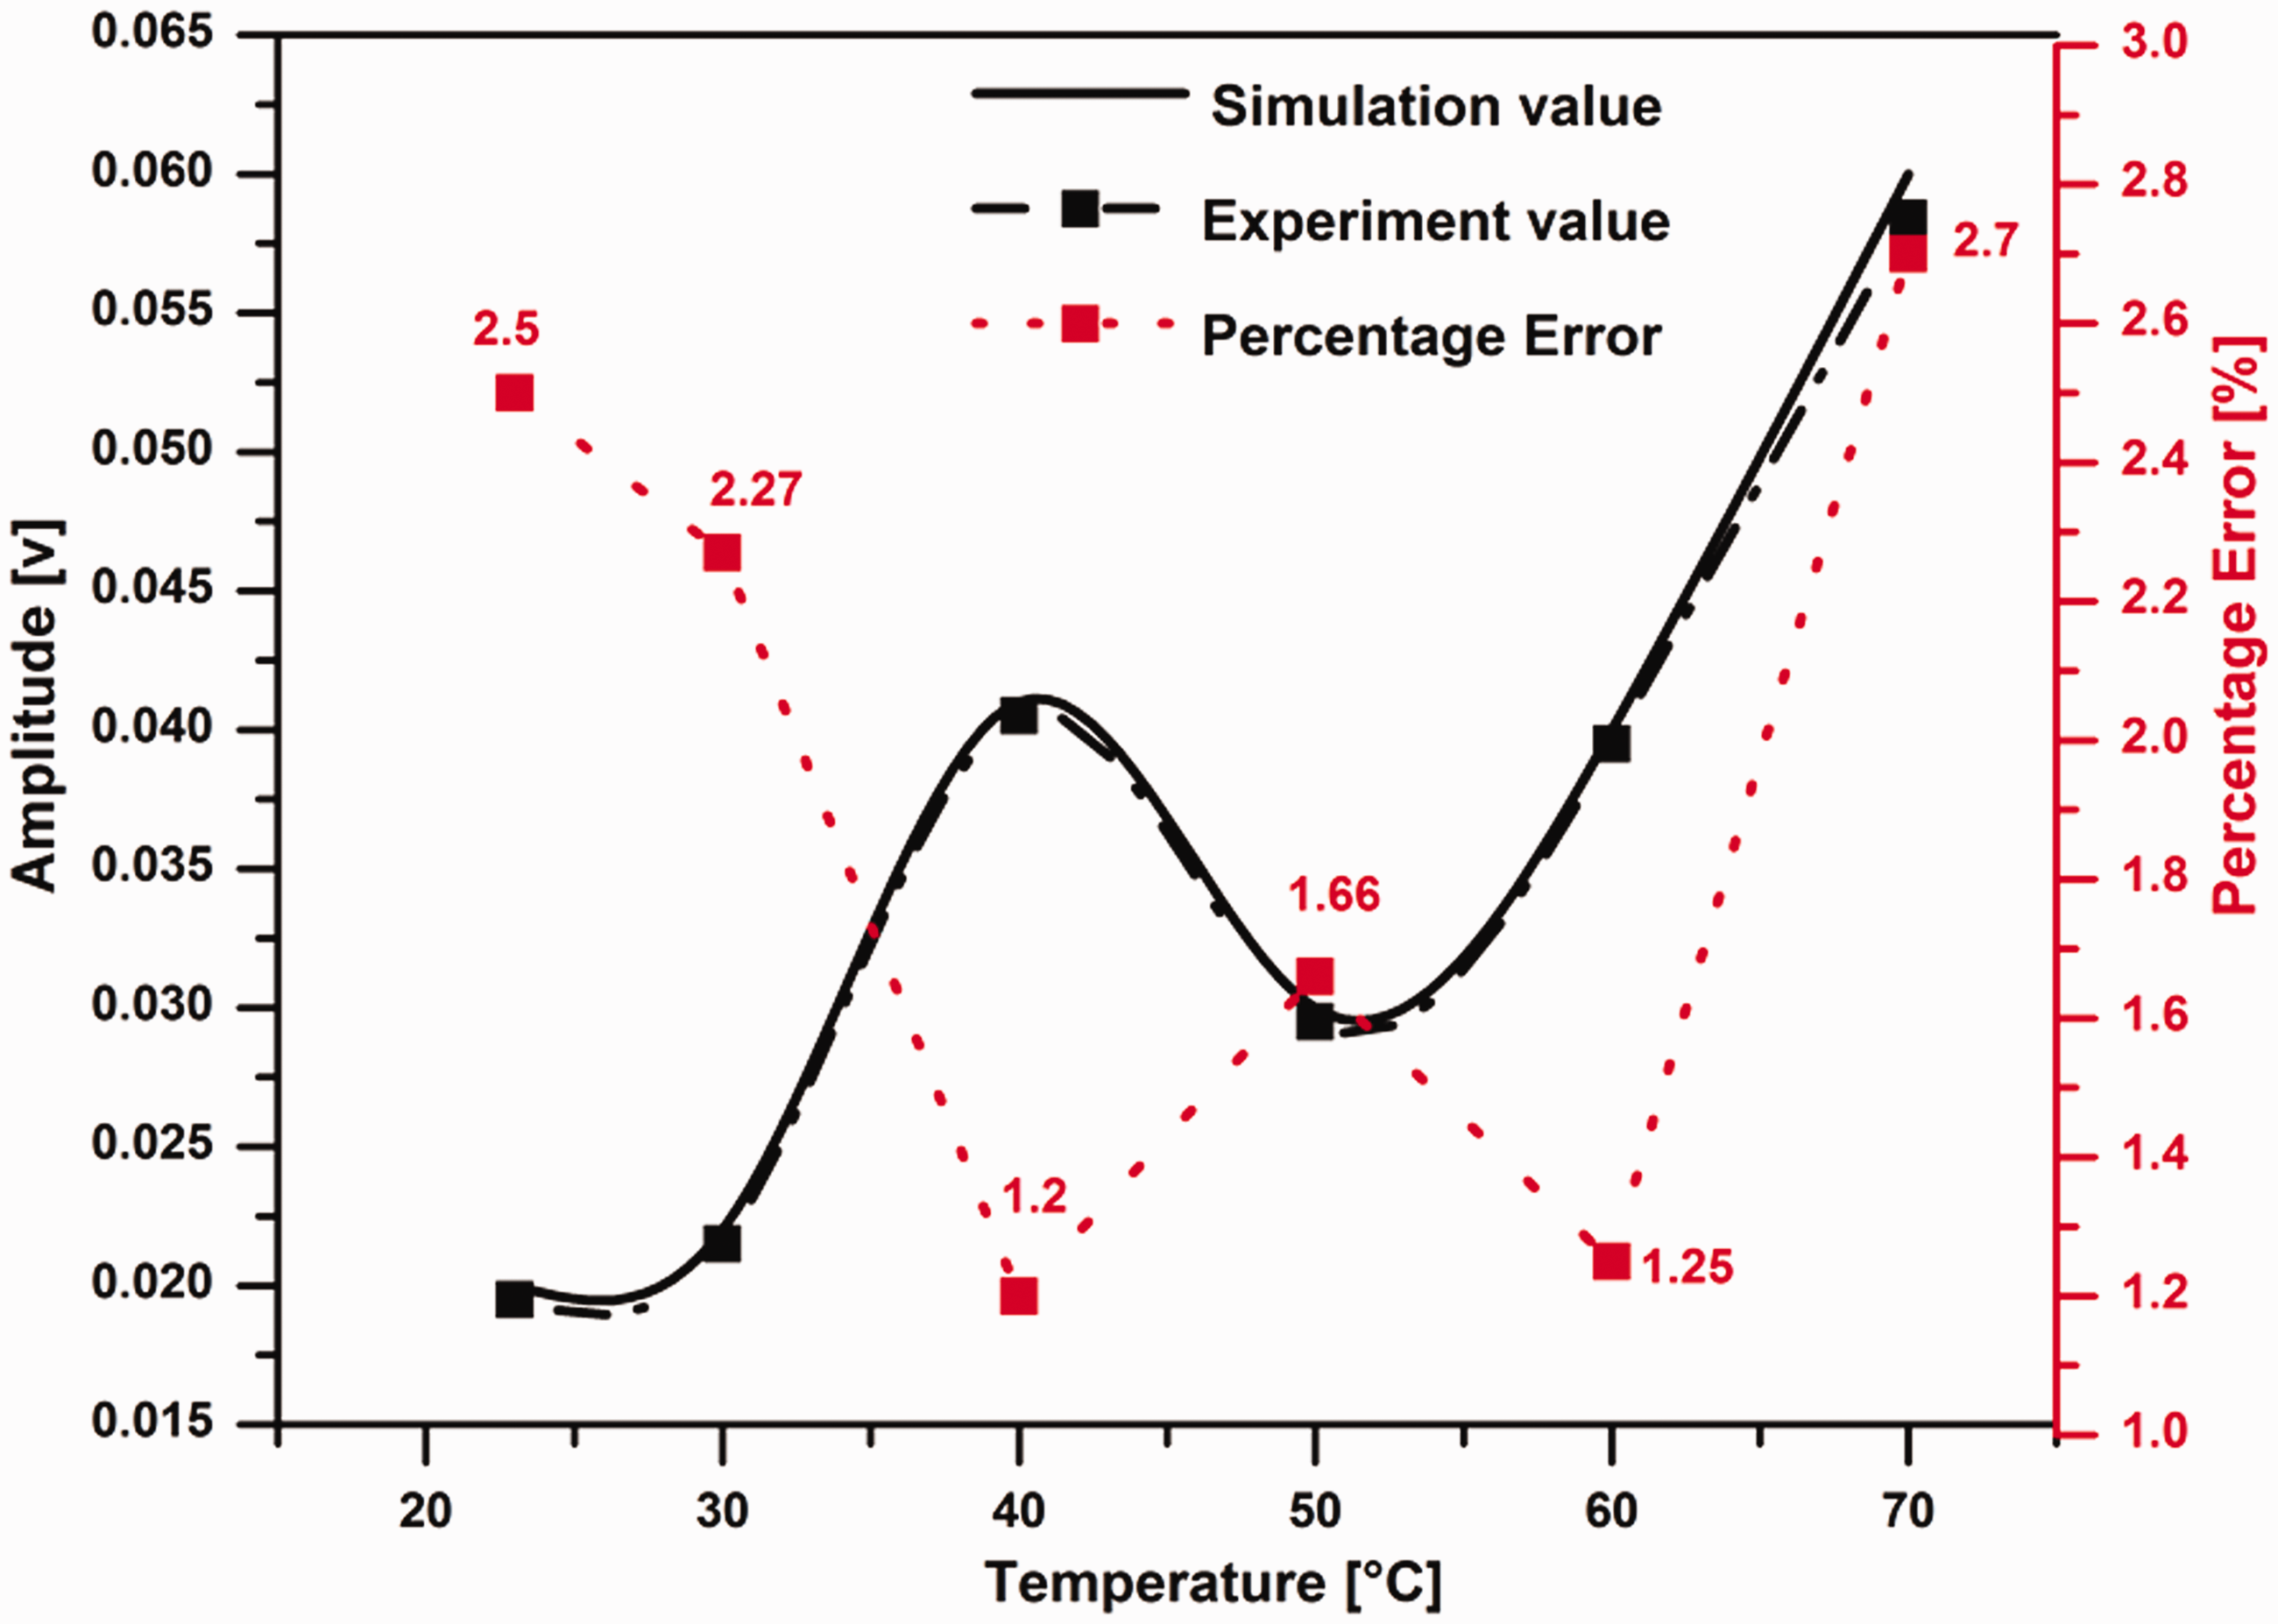
Comparison between experiment and simulation wave packet amplitudes at different temperature.
Conclusion
The thermal sensitivity simulation model is proposed in current research to identify and estimate the influence of EOCs especially temperature on the measured guided wave signal and optimize the ultrasonic damage detection in a real-time operational service environment. Thermal sensitivity of ultrasonic guided waves for SHM of a stainless-steel beam of 304-grade with a crack is predicted numerically, analytically, and practically in this research work. Based on time-domain numerical analysis of a beam in
Footnotes
Declaration of conflicts of interest
The author(s) declared no potential conflicts of interest with respect to the research, authorship, and/or publication of this article.
Funding
The author (s) disclosed receipt of following financial support for the research, authorship, and/or publication of this article. This project is supported by the National Science and Technology Major Project of China (No. 2018ZX04011001).