
Abstract
In this study, vibration control was achieved using macro fiber composite actuators initiated by feedback from polyvinylidene difluoride (PVDF) membrane sensors. First, the structure mode was found using the finite element method after which simulation of the effect of piezoelectric actuators on the structure as well as a feasibility investigation was carried out. The ANSYS Workbench was used for parametric design and to determine the best position for the actuators. Structure vibration in different modes was measured using PVDF membrane sensors for feedback control and to investigate the vibration reduction effect achieved with three individual controllers. The pros and cons of active vibration reduction control were also examined in several different modes. The experimental results obtained with several types of vibration reduction control were compared: Type-1 fuzzy control, Type-1 adaptive fuzzy control, and the vibration reduction effect of an adaptive neuro-fuzzy inference system. The results showed that the adaptive neuro-fuzzy inference system controller was the best choice under the experimental conditions used in this study.
Introduction
In the natural environments, there is vibration everywhere. Natural as well as manmade vibration and noise can be detrimental to most precision manufacturing processes. The advent of micro- and nanotechnology, now widely used in the most precise automatic production lines, has been accompanied by a requirement for the elimination of vibration. Interference from environmental vibration can lead to unpredictable impact on the quality and yield rate of high precision products, with subsequent financial loss. Most high precision production lines have stringent controls and norms established specifically for vibrations to avoid adverse impact on production. The reduction of the impact of vibration, both structural and from noise, can be achieved by three main methods: passive, active, and semi-active control. In most cases, control is achieved passively by the use of anti-vibration devices and mounts or by a material that has a damping effect or has shock absorbing properties. The stiffness of parts can be increased or material with less flexibility can be used for the structure. In recent years, a range of smart materials has been developed. These include piezoelectric, electrostriction, magnetic contraction materials, etc. These advances have led to serious improvements in vibration reduction, which has allowed active methods to become easier and more effective than passive means. Piezoelectric materials have the advantages of lightweight and wide bandwidth as well as high stability and sensitivity and a fast response. Piezoelectric materials are widely used in the research field for active vibration control. 1 The nonlinear behavior of piezoelectric material is lower than that of other smart materials and their product specifications are now complete. The result is that they now occupy the mainstream of active vibration control.2,3
The aim of this study was an investigation of active vibration reduction control using piezoelectric actuators (PEAs) and sensors. The vibrations present in a production environment come from everywhere, outside the facility, from the machinery inside, from transport vehicles, and even from the feet of people walking on the factory floor. However, the extent to which these vibrations can interfere with precision machinery and equipment has a close relationship to the sensitivity of the devices themselves. Along with the miniaturization and super precision now an intrinsic part of manufacturing and measuring processes in each high-tech industry, has come an increase in the sensitivity to vibration. These vibrations cannot be eliminated and vibration control technology has become the best way of resolving the problem. Active vibration control technology is not new and has been in use for some time in many different fields. 4 The market demand for vibration control in high-tech instrument equipment is expanding, and this highlights the increasing importance of the technology for precision machinery and instrumentation. 5
Azzouz et al. 6 established torsion and bending modes for square and triangular cantilever plates and composite actuators, and also analyzed the anisotropic strain and similar characteristics of active fiber composites (AFC)/macro fibro composite (MFC) actuators using the MIN6 thin element method. Using these results, variations of the actuator’s displacement and frequency at different adhesive inclination angles of AFC/MFC actuators were investigated. Kim et al. 7 analyzed the area stress distribution between an epoxy resin substrate and piezoelectric fibers directly using numerical simulation. Hwang and Park 8 achieved vibration suppression using the finite element and negative feedback methods and discussed the number, size, and relative position of the piezoelectric sheet. Ducarne et al. 9 investigated how the adhesive position and size of the piezoelectric sheet affected vibration suppression in a cantilever beam. The results showed that the length and thickness of the piezoelectric sheet has a great impact on the vibration reduction performance. Optimization of the piezoelectric sheet thickness, as well as the adhesive position, effectively increased the vibration reduction performance of the system.
McCulloch and Pitts 10 proposed a neural network type of mathematical model to prove that a neuron can be simulated as a simple threshold operation for logical functions. White 11 proposed the perceptron algorithm that has the ability to classify and learn. It was the earliest type of neural network. Rumelhart et al. 12 published the back-propagation algorithm which allows the parallel processing of large amounts of data by artificial neurons, is fault tolerant, and also has the ability to learn. Sin-Chun et al. 13 achieved faster convergent generalized back propagation by the addition of a weight evolution method. Zadeh 14 proposed fuzzy theory mainly to solve uncertainties in everyday life and fuzzy problems. An element is expressed with any real number set from 0 to 1 as a degree of membership to replace the Type 1 binary value (0 or 1). There are successful cases of its application in image processing, system control, data classification, and many others. However, the membership function of this Type-1 fuzzy set is too accurate. It requires a corresponding degree of membership for each element, and this causes uncertainty and makes expression difficult. Mamdani and Assilian 15 successfully applied fuzzy inference to the control of steam engines. Now fuzzy control is widely used in manufacturing processes, in the chemical industry, for control of robotic arms, and in many other devices and appliances in daily use. Lin and Lee 16 successfully combined fuzzy theory with a neural network by integrating a traditional fuzzy controller and neural network with backup distributed learning into the same framework. The ability of the neural network to learn gave proper nonlinear planning to the controlled system as well as improper planning according to the output and input relationship to form a rule set with corresponding memberships. Bouchard et al. 17 investigated the train improvement condition by using a neural network for the nonlinear active control of sound and vibration. Jang and Sun 18 and Jang 19 developed an adaptive network-based fuzzy inference system (ANFIS) using the ability of the neural network to learn as the target. This was combined with fuzzy inference that allowed a Sugeno fuzzy model to have self-learning ability and produced the best fuzzy rule by self-adaption. Lin and Lee 16 and Hao et al. 20 proposed a fuzzy adaptive learning control network (FALCON), which integrated the basic elements and functions of a fuzzy logic controller into a multilayer linkage framework that had distributed learning ability. Wang et al. 21 tested the hysteresis characteristic of a proposed PEA which was modeled and based on the ANFIS. Some articles have also discussed about the hybrid numerical method and fuzzy control method.22–24
The first method used in a Brennan et al.’s study, 25 which proposed three active control methods, used wave transmission to suppress vibrations, and the other two methods used energy to suppress vibration. Ortel and Balachandran 26 showed that when wave vibrations were transmitted to an object using active control, a simulation can be made, by feed-forward and feed-back, that uses single or multiple sheets of PEAs to suppress vibration. These simulations showed that feedback control was more efficient than feed-forward. Maruani et al. 27 did simulations of dynamic active vibration control using a linear quadratic regulator method with an observer. Jha and Rower 28 used a neural network to study and identify smart materials and experimental control. They used PEAs to suppress vibration in a cantilever beam, using separate input of impact force, sine wave signals, bandwidth, and the bandwidth limiting signal to the cantilever beam to observe the control effect and included a multilayer perceptron as the network frame. Raja and Narayanan 29 considered the optimum placement of the actuator for vibration control to a tensegrity structure by using different control strategies.
The aim of this study was to achieve active vibration reduction and control by the use of sensors and PEAs. A description of the equipment used as well as the sensor names and specifications are described in the following subsection. Then, the experiments carried out using piezoelectric smart structures, the vibration experiments, dynamic characteristic measurement and position optimization, and the investigation of vibration reduction controller design as well as the issue of control strategy for dual-sheet actuators are detailed. Next, the principles involved in the use of three controllers are introduced, and the control strategy used for dual-sheet actuators is detailed. The three control methods for a Type-1 fuzzy controller, a self-adaptive controller, and an ANFIS controller are elucidated in “Experimental results and discussion” section. The final section concludes the study findings.
Methods
Experimental equipment
In these experiments, a Hewlett Packard dynamic signal analyzer (HP35665A) was used to output the waveforms of appointed frequencies as a signal source. This instrument can be used to measure signals and convert them from time-domain to frequency-domain signals for analysis. It can also be used as a signal source fed to a power amplifier (LDS PA500L) to raise the strength of a signal to push the exciter, a magnetic inducer (LDS v406), to produce a vibration interference source. The measured signals can be fed to an eddy current displacement sensor (KD2306-6UI) with a range of 0 mm to 6 mm. For this purpose, a Keyence laser displacement meter (LC-2440) was also used. These two displacement meters can be used to send amplified signals to the dynamic signal analyzer for signal processing. The laser displacement meter was used to verify that the dynamic characteristics of an object were consistent with those measured by the eddy current displacement meter. The voltage amplifier used in this study was a Trek model 601 C. Amplification was 100 and the output current was 0.2 A. The input voltage range was –5 V to +5 V, and the signal filter used was a Model 3362.
The controller was a Single Board RIO 9631, which when integrated with the instant processor can reset the FPGA interface. It is suitable for embedded control, monitoring, and data acquisition. To meet the requirements of vibration reduction, we used piezoelectric components such as PEAs and macro fibro composite (MFC) to conduct quick displacement control. There are two kinds of MFC, 0° (M8557-P1) and 45° (M8557-F1). These arrange the PZT and epoxy at between 0° and 45° to produce two different directions of strain.
Experiments using a piezoelectric smart structure
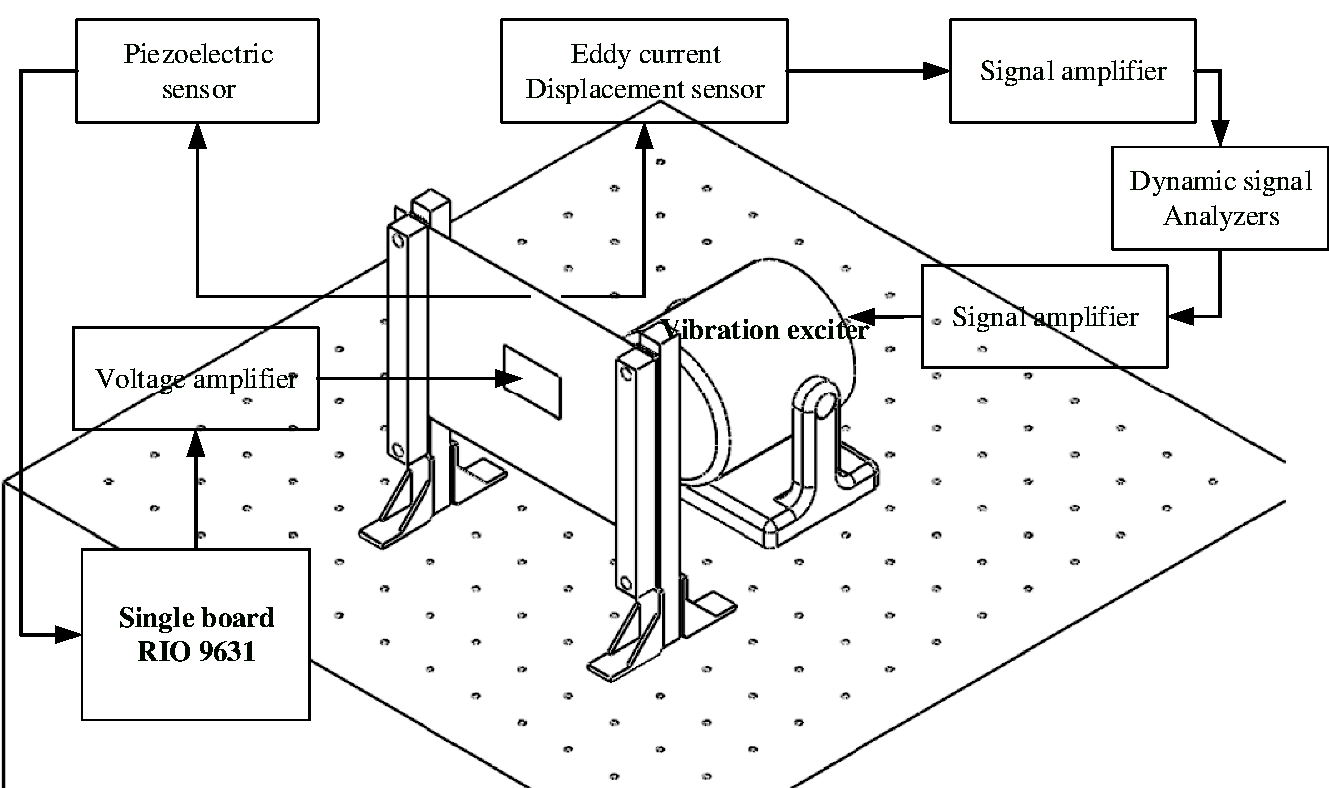
The vibration control experimental framework for the piezoelectric smart structure used in this study is shown in Figure 1, which includes the PEAs and sensors and a main structural plate. For structural vibration, the dynamic signal analyzer was used to produce the vibration signal. After amplification, the signal was sent to the exciter and measured by a piezoelectric sensor which was pasted onto the structure. The measured structural vibration was used as a reference for vibration reduction. The vibration signal measured by the piezoelectric sensor was amplified and sent to the single board controller (RIO 9631). The phase difference between the feedback signal and the gained parameter was modulated by the controller and input to the voltage amplifier for control of the PEAs. The external displacement meter (eddy current sensor) measured the variations in vibration in the piezoelectric smart structure to allow a determination of the vibration reduction effect of the PEAs.

Experimental framework showing vibration control in the piezoelectric smart structure.
Vibration experiments
To start with the vibration modes of the experimental setup were investigated. Mode analysis, static analysis, and simple harmonic analysis were done using the finite element software ANSYS Workbench. The material used for the experiments, aluminum alloy 6061, was chosen to suit the experimental environment and limits. The material was 320 mm long, 250 mm wide, and 0.5 mm thick. Young’s modulus was 70 GPa, the Poisson’s ratio 0.35, and two ends were fixed as the main plate structure for the vibration experiments. M8557-P1 and M8557-F1 Smart Materials Corp PEA patches were used to control vibration. The MFC specifications were: Young’s modulus: 30.336 GPa, Poisson’s ratio: 0.31, density: 5.44 g/cm3; L × W × T = 85 × 57 × 0.3 mm. Piezoelectric LDT-Series and SDT-series sensors with a PVD material substrate (Measurement Specialties Inc.) were used to collect vibration signals. Simulations were used to decide the position of the plate structure and to determine the positions of the sensors and activators. If an MFC (P1 types, 0° fiberorientation) is equipped on a plate structure, the MFC is available in d33 operation mode: the arrows in Figure 2(a) show the stress direction resulting from a positive applied voltage, and the arrows in Figure 2(b) show the negative voltage stress direction.
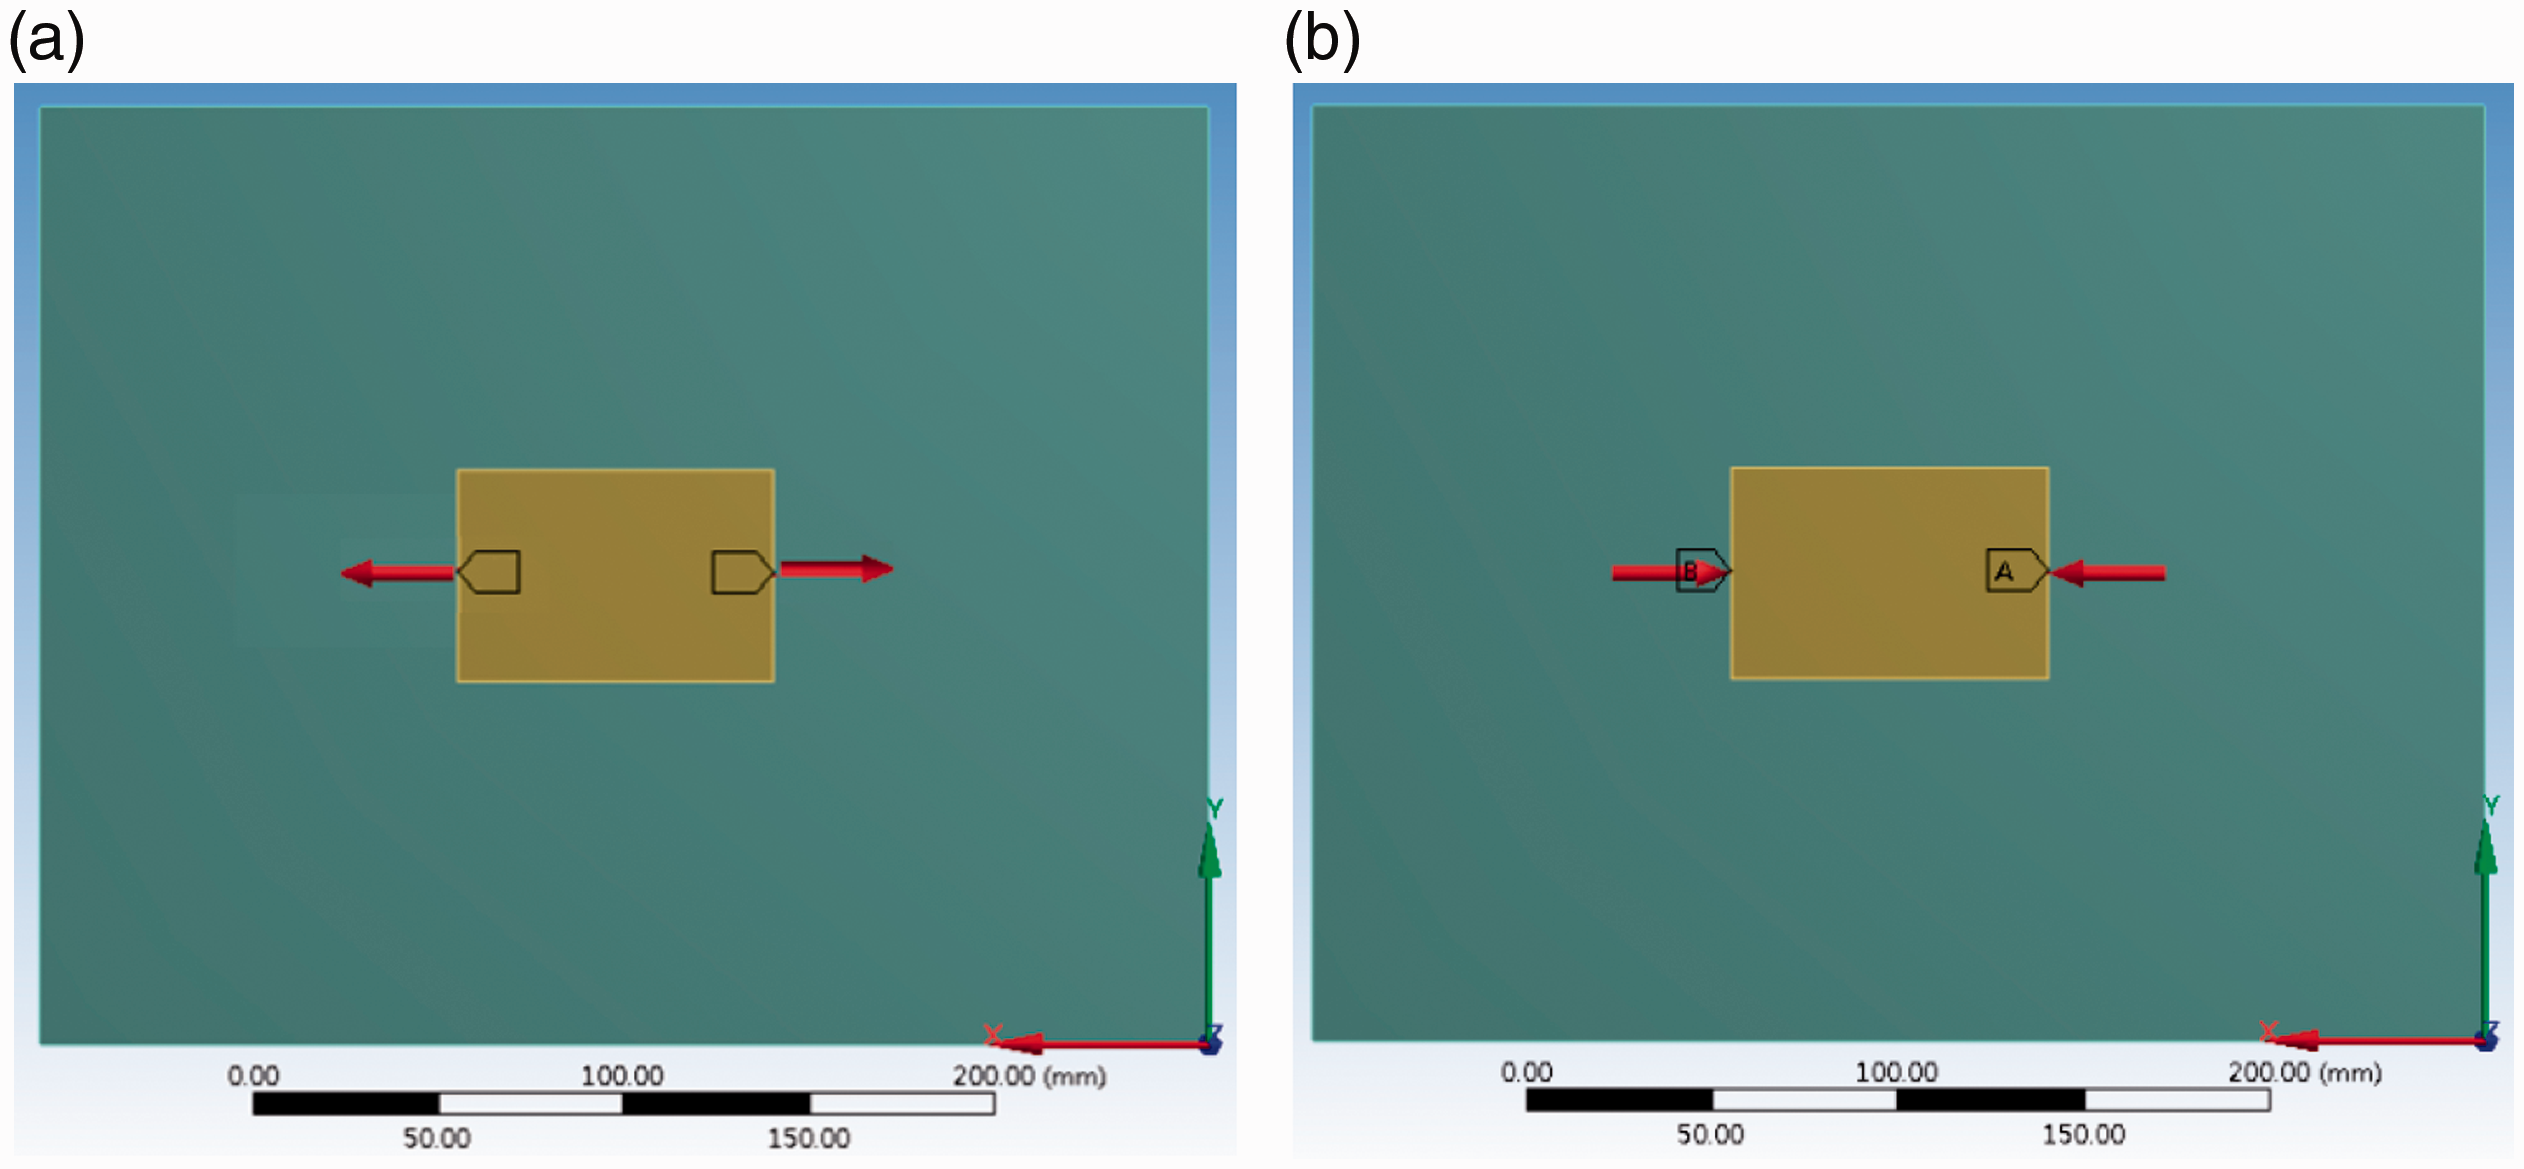
MFC applied voltage. (a) Positive voltage. (b) Negative voltage.
The MFC material specifications show a constant relationship between voltage and pressure of 0.024 N/mm2V and a relationship between voltage and strain of 0.75–0.9 ppm/V. Therefore, it is easy to determine the pressure and strain per unit voltage. Figure 3 shows simulations at three modes as actuated and analyzed by the ANSYS Workbench. The left and right sides of the structure shown in this figure are the fixed ends. Red represents the highest sensitivity. The middle sensor was used as for input during the first mode control; for the second and the third mode controls, the right, middle, and upper sensors were used for input.
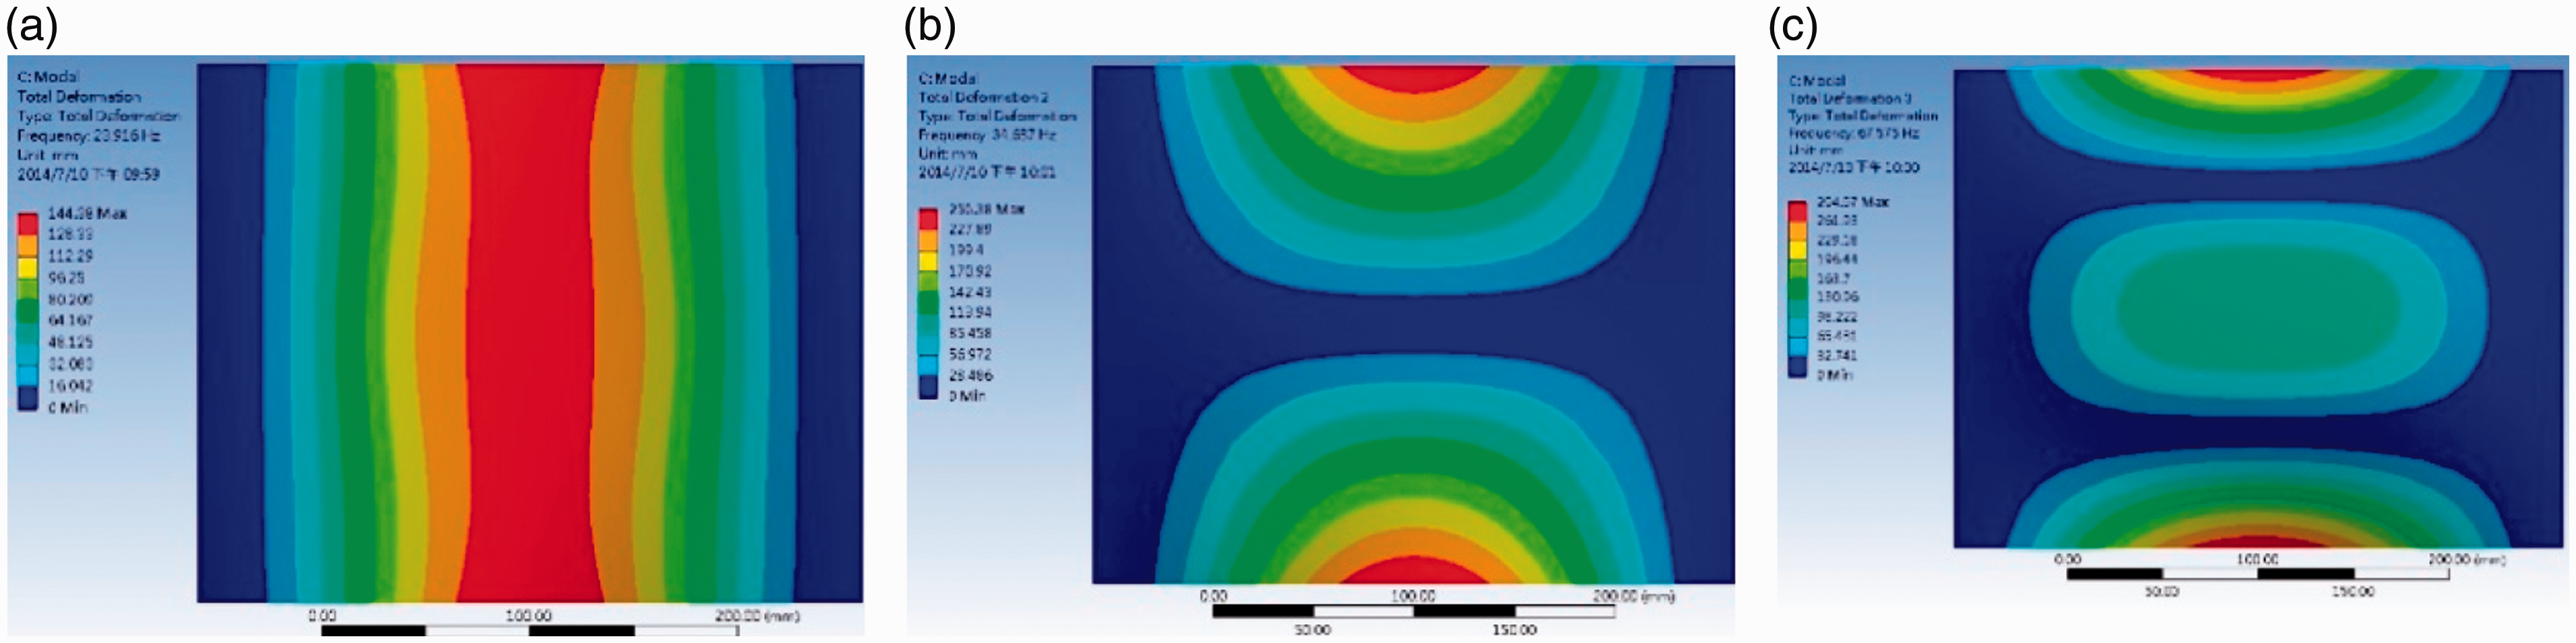
Simulations of actuated piezoelectric smart structure. (a) First mode. (b) Second mode. (c) Third mode.
The results of the three modes experiments are shown in Table 1. The analyses of the simulations show the relationship between frequency and amplitude and the rate of change. The data sheet for the SDT- and LDT-Series sensors shows the Mechano-Electrical Conversion to be

Frequency and amplitude simulation table.
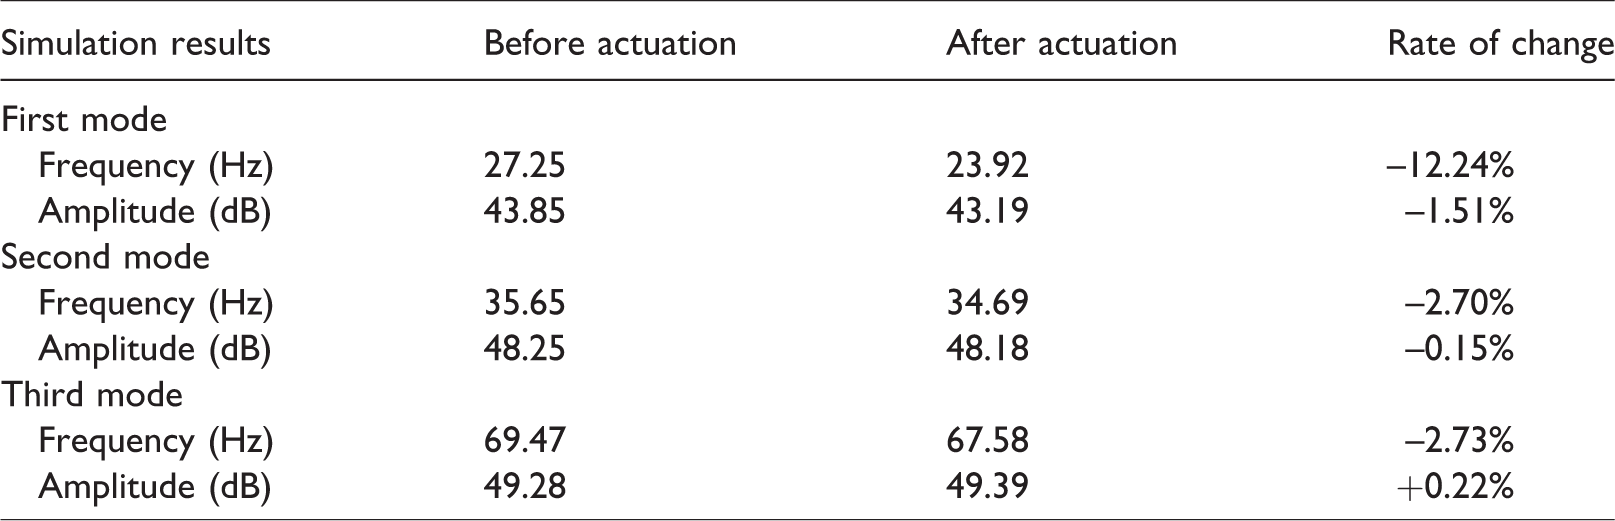
These experiments allowed a clear determination of the frequency response of the piezoelectric smart structure. The results showed that the natural vibration frequency of the first and second modes before actuation were near 27.252 Hz and 35.649 Hz. Actuation resulted in a frequency change where the lower limit was no less than 20 Hz and the upper no greater than 40 Hz. The range for the frequencies to be used in the experiments were therefore set between 20 Hz and 40 Hz. Observations were made of the changes caused by the modulation of each parameter in the piezoelectric smart structure as well as the vibration reduction effect within this frequency range. Fourier transform theory which concerns the time delay relationship between two different frequencies was used to analyze the strength position of vibration frequency from the spectrum and also to analyze the vibration source. Qin et al. 30 pointed out that the phase difference between input and output is closely related to vibration control. In our study, vibration reduction was conducted by an inverse force generated in response to feedback signals received from the PEAs. In fact, the output signal was actually the input signal from the piezoelectric sensors after processing. The middle piezoelectric sensor (Mid Sensor) (see Figure 4) provides the feedback regarded as being from the 0° PEA and that from the upper middle piezoelectric sensor (Top Sensor) as that from the 45° PEA. The controller is primarily used to offset the phase difference and adjust feedback gain to control vibration reduction for the main structure. The purpose of modulating the phase difference being to correct phase differences often due differences in response and phase between different phase sensors during signal acquisition. This can have serious impact on vibration reduction control. When it is not possible to accurately calculate the phase difference, it is necessary to carry out experimental observations on piezoelectric smart structure at fixed frequency and with identical feedback gain and adjust the phase difference to determine the resulting vibration characteristics.
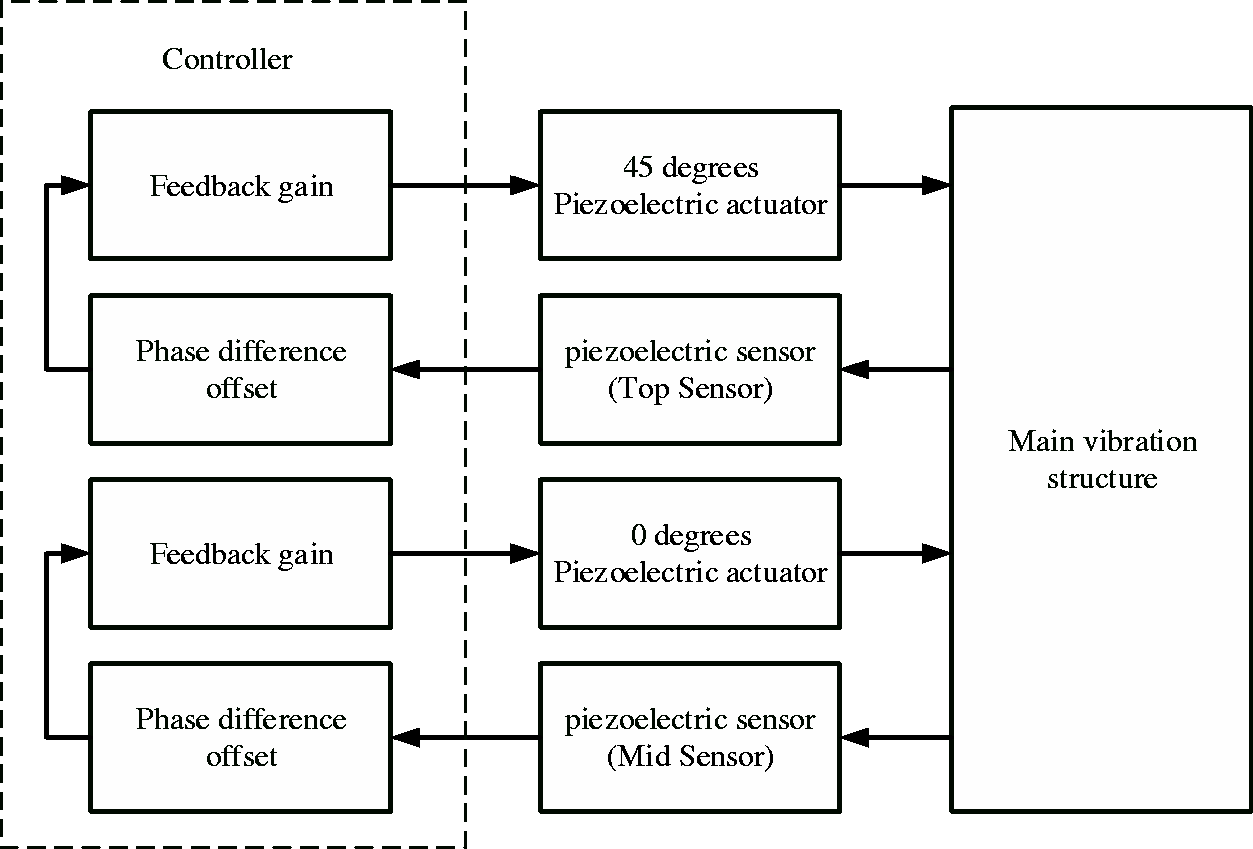
Schematics of the active vibration feedback control process.
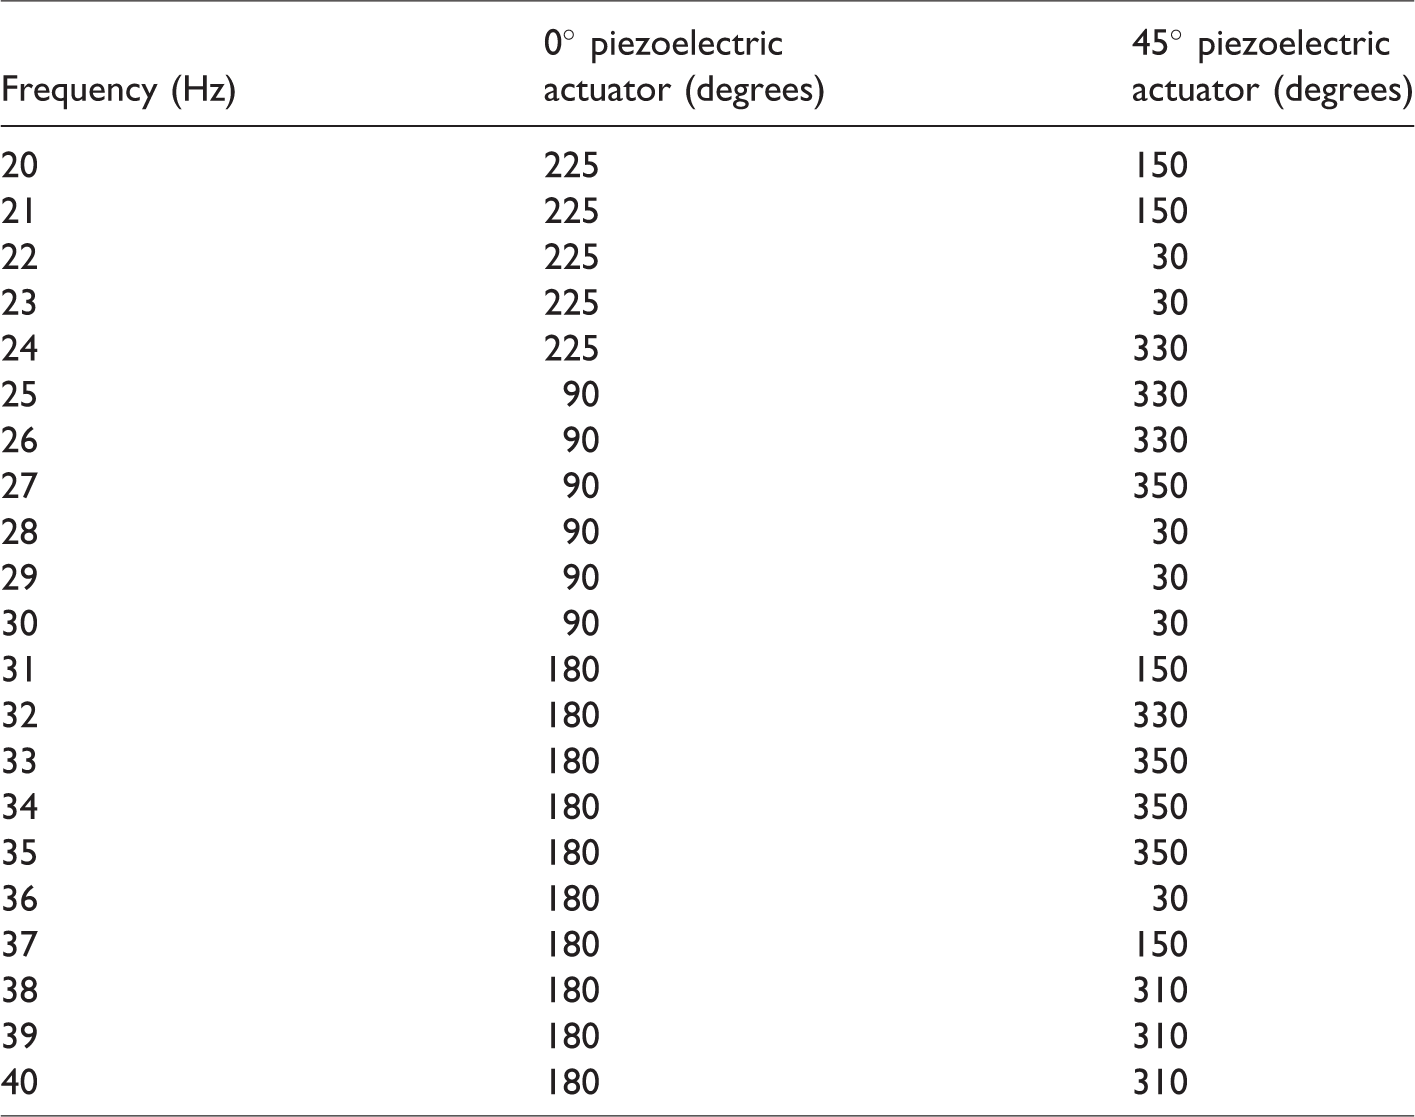
Phase difference values were gathered by experiment from the 0° and 45° PEAs to determine the best values for the most effective vibration reduction effect and a controller database was created. The best phase difference can then be selected from Table 2.
Phase difference values of the output signal for each frequency.
Dynamic characteristics measurements
Before the multimode control of the piezoelectric smart structure could be designed, it was necessary to measure the dynamic characteristics to determine if it could meet the frequency variations and vibration suppression that were expected. Vibration signals produced by the spectrum analyzer were amplified before being fed into the exciter. The laser displacement meter was used on system input and measurements were made at a position where the vibrations were most intense, at the middle of the upper part of the structure. The Eddy current displacement meter was used on system output. The input signal from the dynamic spectrum analyzer was random noise, and the continuous signals measured by the sensor were sent back to the dynamic spectrum analyzer analysis. The actual dynamic measurement setup is shown in Figure 5.
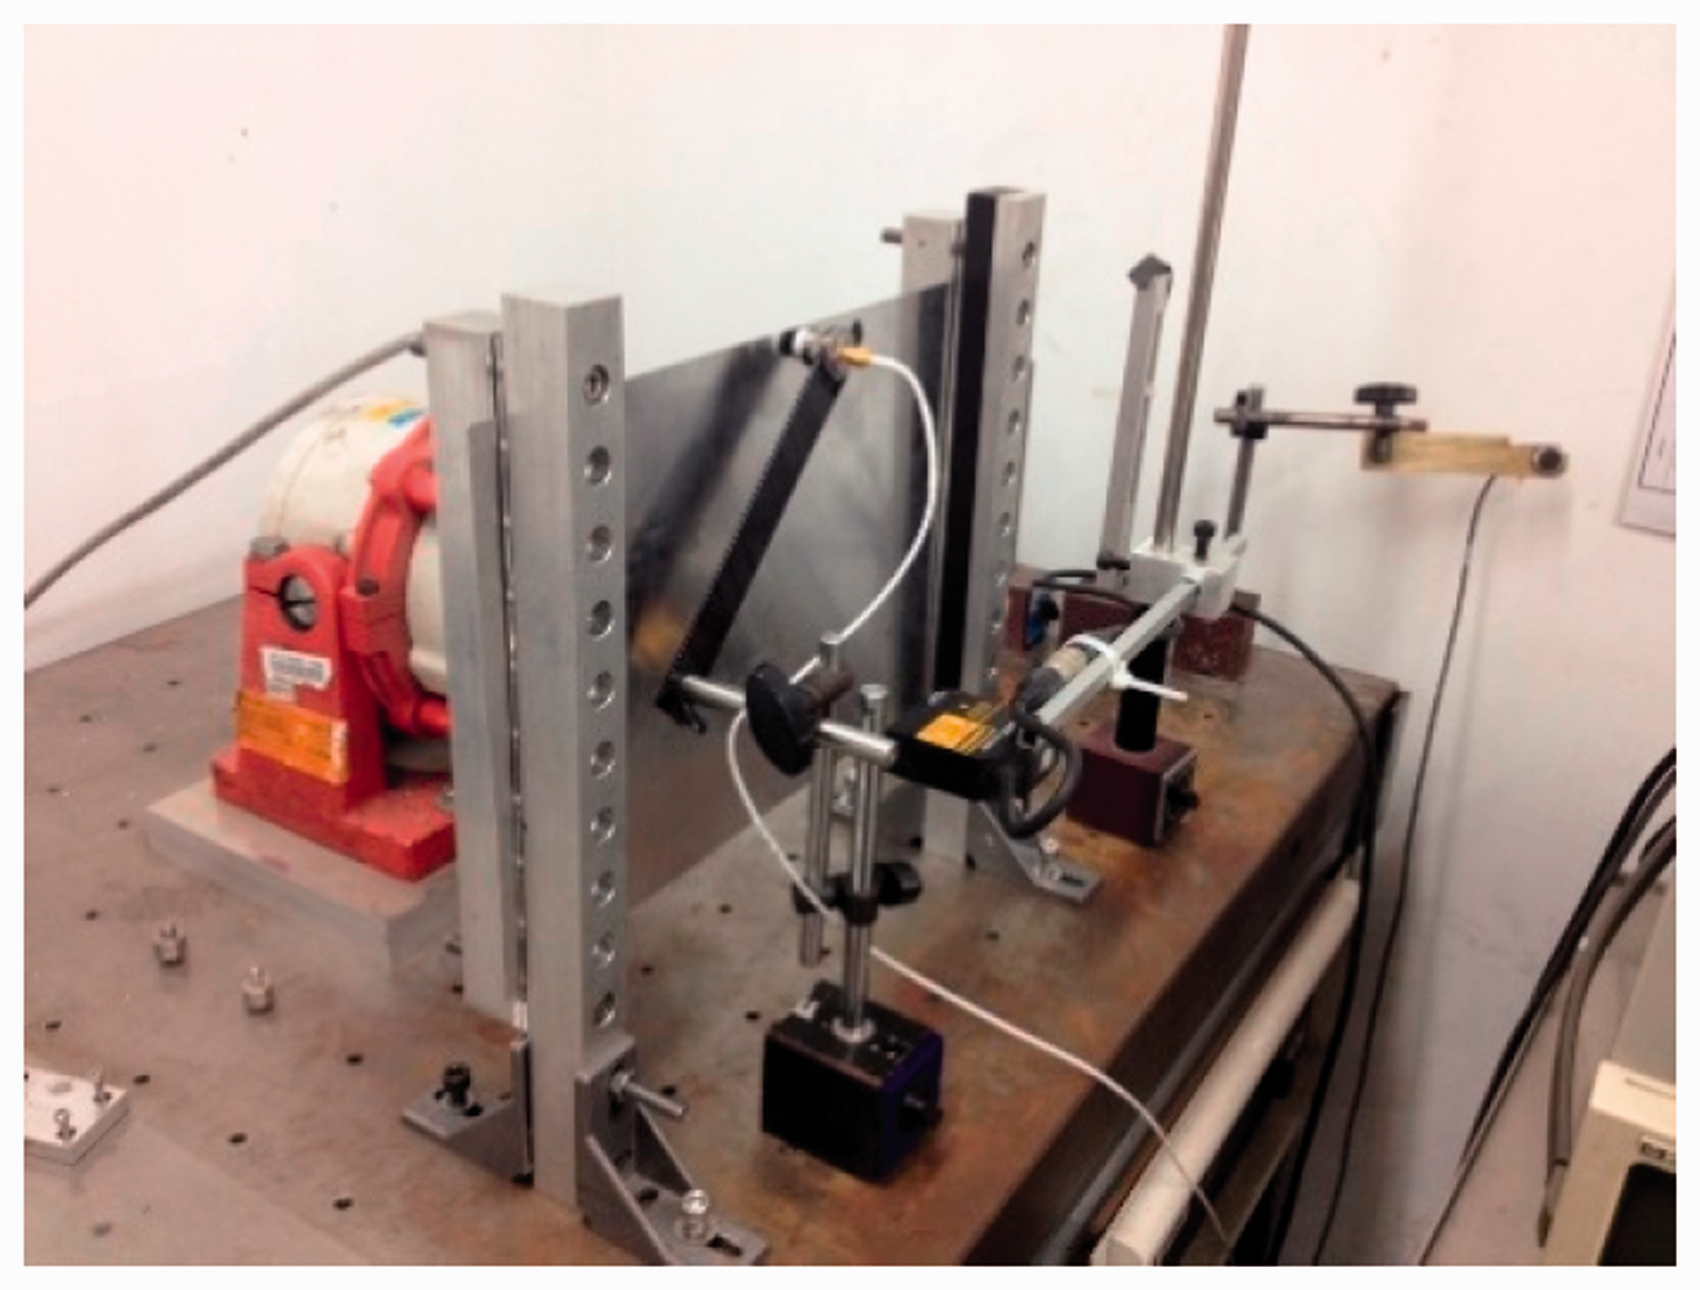
The dynamic measurement experimental setup.
The bandwidth range for analysis by the dynamic spectrum analyzer was set at 0–100 Hz, random noise exciter signals were generated, and the frequency response of the PEAs was measured. Among the measurement taken before actuation, some of the more obvious wave peaks were at 27 Hz, 37 Hz, and 72.5 Hz with errors of 0.93%, 3.79%, and 4.36%, respectively, between each mode when compared to the ANSYS Workbench simulation results of 27.252 Hz, 35.649 Hz, and 72.5 Hz. Measurements taken after actuation showed wave peaks at 25.5 Hz, 34 Hz, and 67.75 Hz with errors of 6.62%, 1.98%, and 0.26%, respectively, between each mode when compared to the ANSYS Workbench simulation results of 23.916 Hz, 34.687 Hz, and 67.575 Hz. The experimental results were in reasonable agreement with those of the numerical analysis simulations.
Optimization of the PEA positions
Different forms of PEAs (0° and 45°) have different impact in different positions on the plate structure. Optimization of the position of the PEA on the structure is very important to ensure proper multimode vibration control. Therefore, the position of the PEAs used in this study was parameterized using the ANSYS Workbench to perform static and mode analysis. The natural frequency impact in different modes of different forms of PEAs was observed and ANSYS Workbench simulation was then used to determine the best positions, as shown in Figure 6.
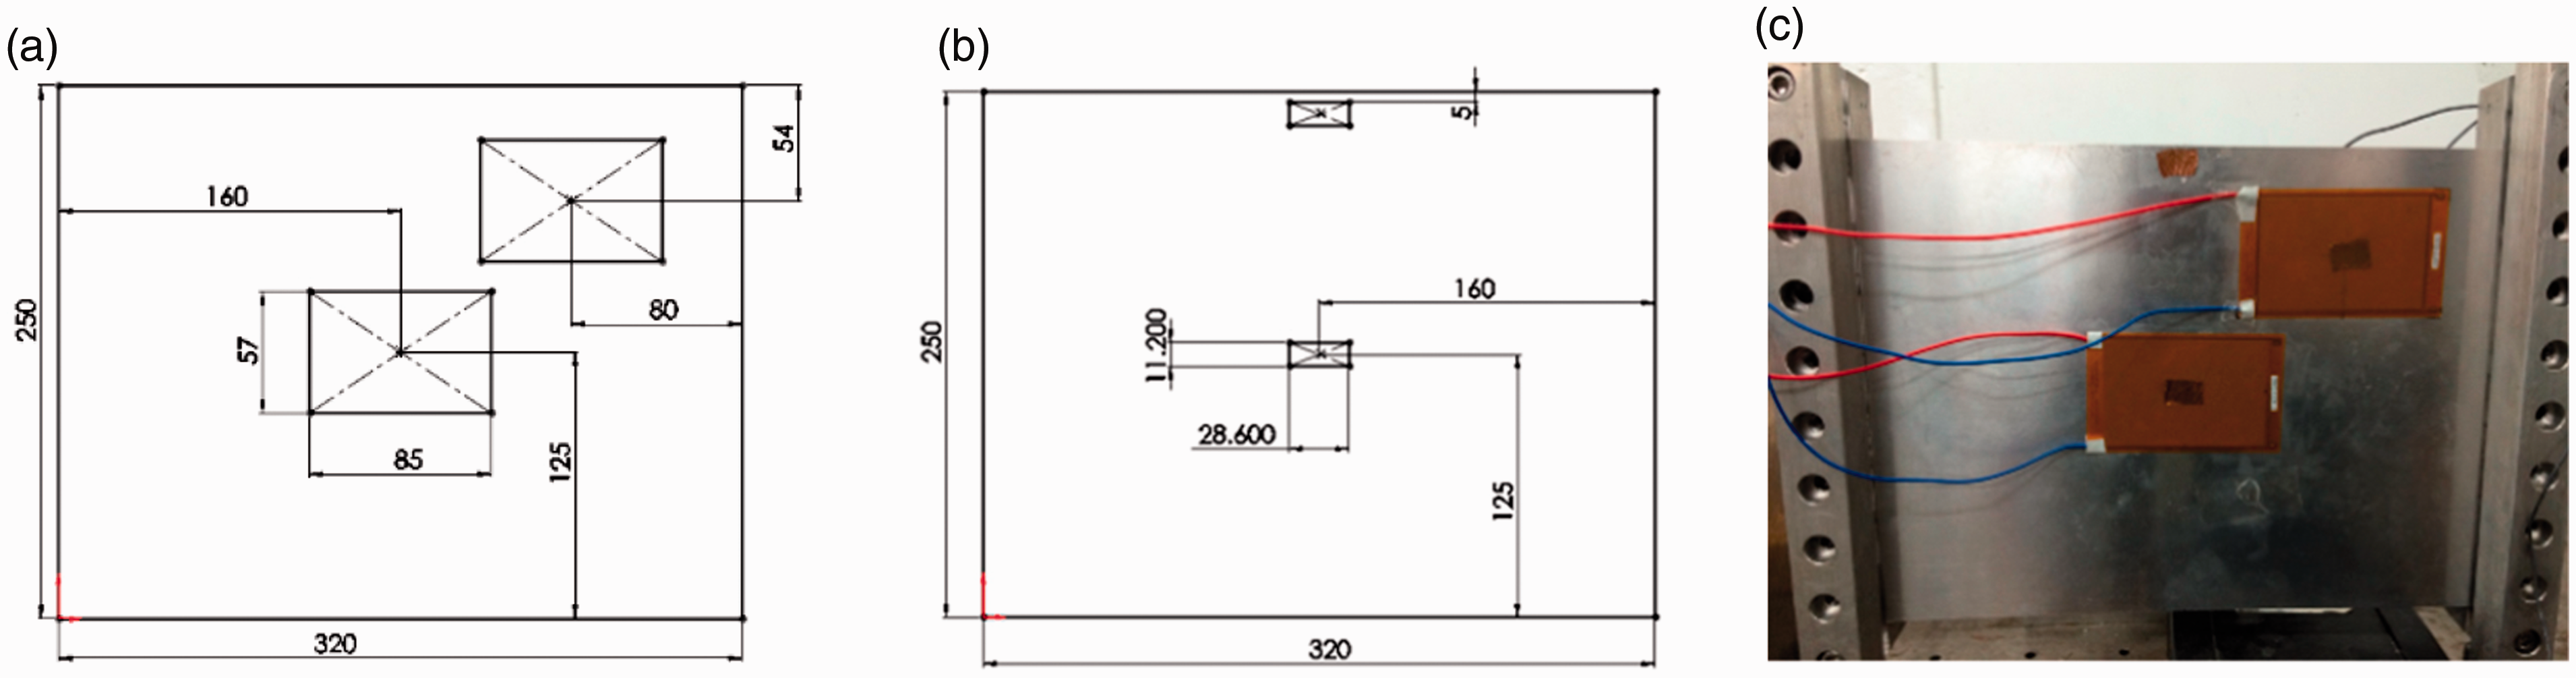
Position of the Piezoelectric actuators and sensor on the smart structure found by ANSYS simulation. (a) Best position (front). (b) Best position (rear). (c) Actual plate structure.
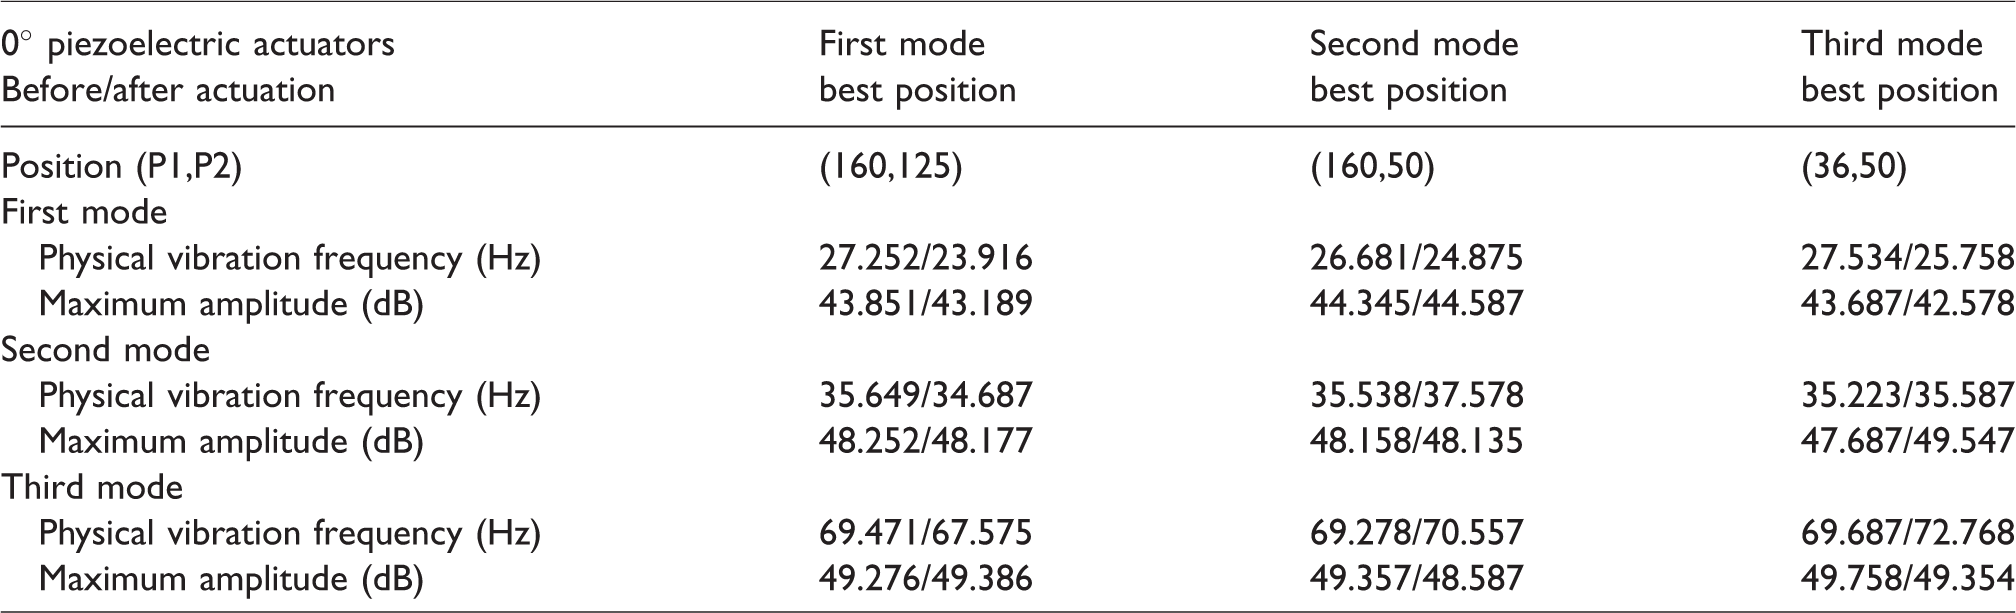
The dynamic characteristic method described in the previous subsection was used to confirm that ANSYS Workbench simulations of the PEAs were consistent with actual measured values. Therefore, the 0° PEA process was used to simulate the 45° PEA and its structural vibration impact. Comparisons were then made in simulations of the impact at different positions of the PEAs and evaluations were also made to determine the mode under which vibration suppression by each PEA was the most efficient. Observations were made to determine if the amplitudes of natural vibration frequencies at the three modes became smaller after actuation. Also harmonic analysis was used to simulate the natural vibration frequencies of three modes before actuation to determine if the amplitudes after actuation, in different positions of the PEAs, were smaller than before actuation. These results made it possible to select the best position for the PEA. Tables 3 and 4 show the simulated natural vibration frequencies before and after actuation of the PEA and also a comparison of the greatest amplitudes.
Comparison of simulated results for the 0° piezoelectric actuators before and after actuation.
Comparison of simulated results for the 45° piezoelectric actuators before and after actuation.
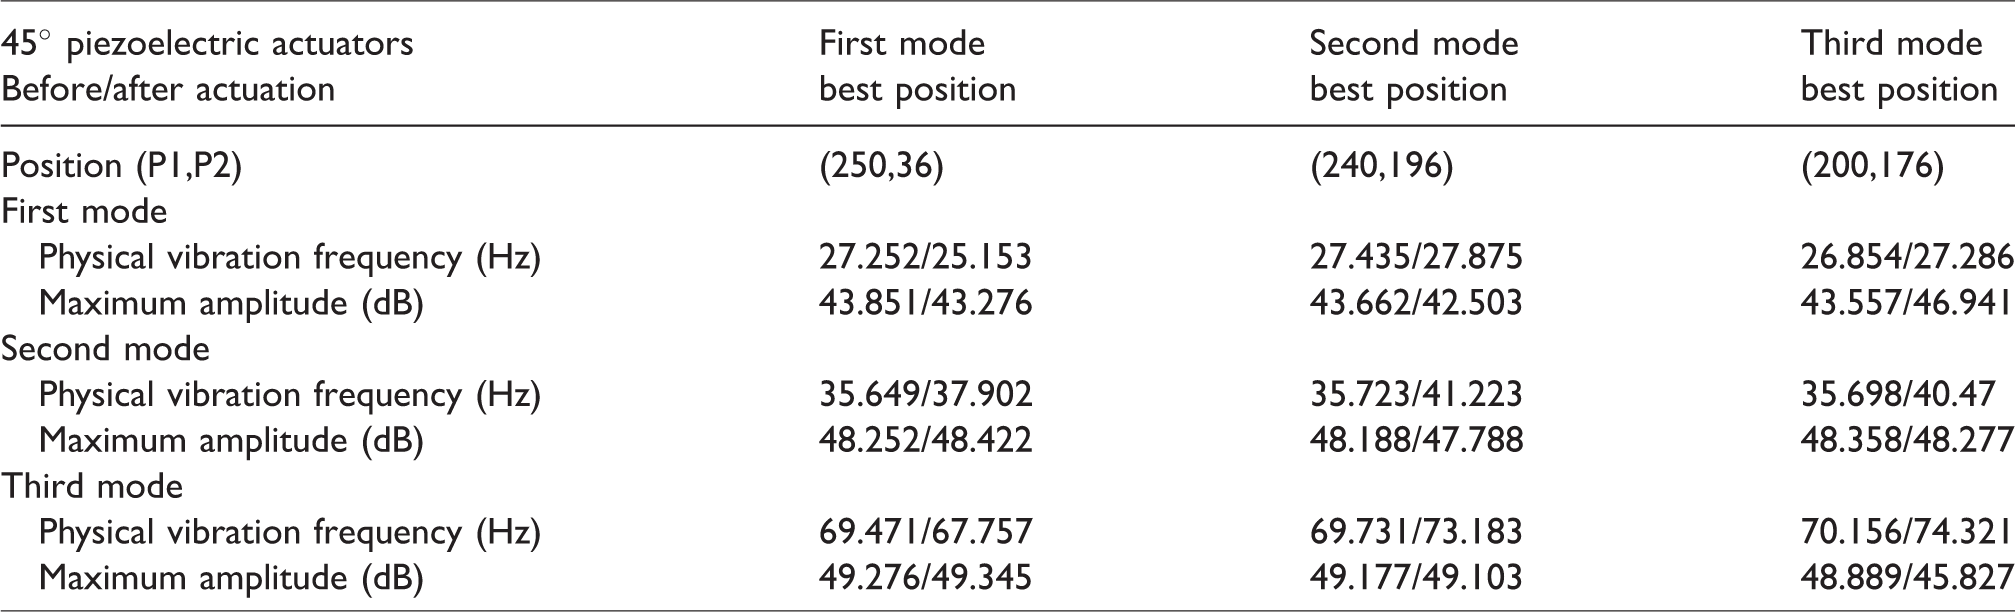
The amplitude variation in Tables 3 and 4 shows that the 0° PEA has more obvious vibration suppression in the first mode while the 45° PEA has an effect in both first and second modes. However, it increases vibration in the third mode. Therefore, for the 0° PEA the best position for the first mode is selected. To suppress vibrations for the second mode, the best position of the second mode for the 45° PEA was selected.
Vibration reduction controller
Controls for active vibration exist that use state, position, velocity, or acceleration as feedback signals. However, when the velocity state is used, it is generally necessary to use the full state for feedback and to do this several sensors are needed. When position is used for feedback, the bandwidth of a general displacement meter will be from 0 to 10 Hz and will only be useful within that range. White 11 held that when the velocity feedback was related to the control rule, the parameters of the system such as frequency and damping are closely related to the stability of the closed loop system. Therefore, when system parameters are not known for certain, it is very likely that the closed loop system will not be stable. Therefore, the vibration reduction controller designed in this study used fuzzy theory and adaptive fuzzy neural. Figure 7 shows the vibration reduction experimental control framework. The controller was designed around the Single Board RIO 9631, and a piezoelectric sensor was used to measure the vibration signal and send feedback from the main structure. The signal received by the controller is computed and the result is fed to the amplifier. This signal, after amplification by 100×, is used to control the PEAs. The characteristics of the actuation signal is determined by the controller program and depends on the feedback signals received from the sensor. Different vibrations, required different actuation, to provide dynamic vibration reduction.
Framework of the vibration reduction experiment.
Three types of controllers
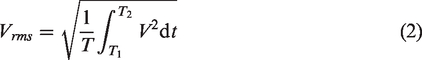
The results of the dynamic characteristic measurements (see “Dynamic characteristics measurements” subsection) show that the first and second modes were near 25 to 27 Hz and 35 to 38 Hz. Therefore, in this study, the vibration reduction control experiments were conducted at between 20 and 40 Hz. From Newton’s second law (F = ma), we know that force and acceleration are coupled. So, when an unchanged mass is accelerated, the force increases, as does the vibration. Conversely, when acceleration decreases, so does force and vibration. In this study, the force signal, measured by the piezoelectric sensor, was the basis used to determine changes in the level of vibration. In the experiment, a fast Fourier transform (FFT) was carried out using the vibration signal measured by the piezoelectric sensor and the spectrum of the frequency domain was calculated. The resulting main vibration frequency of the structure with the spectrum was used as the input signal for fuzzy control. In addition, since the vibration signal had no fixed value with respect to time, to obtain a valid value for a certain period of time, the root mean square value of the vibration signal was calculated as in equation (2).
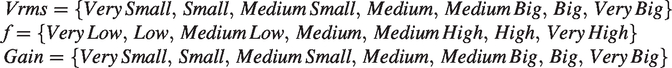
Type-1 fuzzy, Type-1 fuzzy adaptive, and ANFIS controllers were all investigated in this study. In the design of the Type-1 fuzzy controller, the trapezoid membership function used was first defined for the frequency and vibration signal root mean square value and the bell-type membership function for the output voltage. The database was used to divide the PVDF vibration signal root mean square values into seven levels. The frequency ( f ) and output feedback gain were each divided into seven levels with syntax sets as follows:
The rule database shows that after 30 Hz, when the vibration mode approaches the second mode, the 0° PEAs have no vibration reduction effect and could actually increase the vibration. Therefore, in the design rule for the 0° PEAs, the frequency range was set at 20–30Hz and the frequency ( f ) set to five levels:

As mentioned above, the fuzzy rule was used to establish the database for control purposes. However, this method needed a substantial database otherwise control would not have been so good. Therefore, to establish a solid control basis, a study of adaptive vibration reduction control using a Type-1 fuzzy controller was done and a modulation method was combined with fuzzy control. The root mean square value of the vibration signal variation and control were used as fuzzy input and the increase or decrease of vibration signal variation as the fuzzy output. Again, the variations were divided into five levels:

The adaptive method uses the vibration signal root mean square value variation as the main basis for modulation, which is done by controlling the signal vibration. When the control signal increases, the vibration signal root mean square decreases, and the vibrations become smaller. The fuzzy controller raises the control signal value, this causes vibration to decrease until the control signal again increases which allows an increase in the signal root mean square value. The output voltage is again decreased and the process is repeated until control has been achieved.
Design of the active vibration controller was investigated with respect to the adaptive fuzzy neural network and a back-propagation algorithm was also used. Figure 8 is a schematic of the ANFIS controller in the vibration control framework. Disturbance is the external interference excitation signal; Vibration Signal y(k) is the vibration signal measurement made by the piezoelectric sensor in the piezoelectric smart structure; d is the target value and is often set as 0 for vibration control, meaning that the expected vibration is 0; e(k) is the error signal which is used to correct the ANFIS internal parameter using the back-propagation algorithm; ANFIS input is the vibration frequency ( f ) and vibration variation Δy(k). The frequency is calculated from a FFT of the vibration signal. Output is the control signal u. The feedback gain and phase of the piezoelectric sensor signal are used to determine modulation of the piezoelectric smart structure and are input to the PEAs to achieve vibration reduction control.
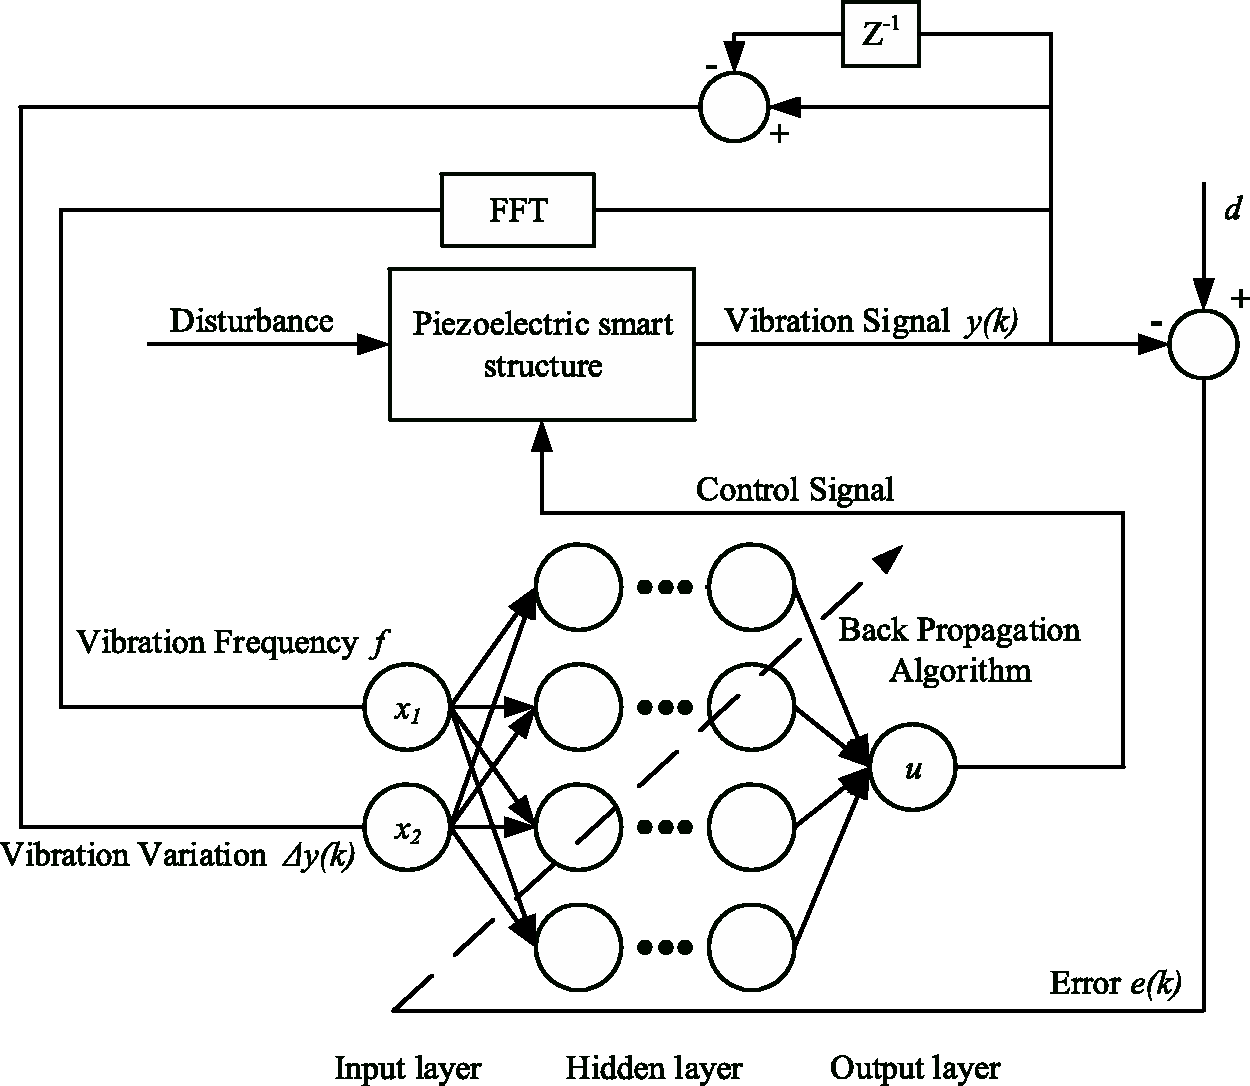
ANFIS controller in the vibration control framework. FFT: fast Fourier transform.
The database created earlier was used to train ANFIS as a first step. The frequency and vibration signal were used as input and output feedback gain. The target value d is the most obvious feedback gain for vibration reduction of each input. Proper database training gives ANFIS good preliminary control of the system and shortens the time it takes to find an optimal parameter. The ANFIS training parameter used in this study has an input number of 2, output number of 1 and the sampling frequency is 200 Hz, the training rate was (η) 0.01, rule layer number was 25, input layer number was 10, and the weighted (w) initial value was 0.5. The activated function was Gaussian. Figure 9 shows the ANDIS training 3000-generation convergence curve. From the last convergence value, it can be seen that error between ANFIS and the data in the database was 0.4568.
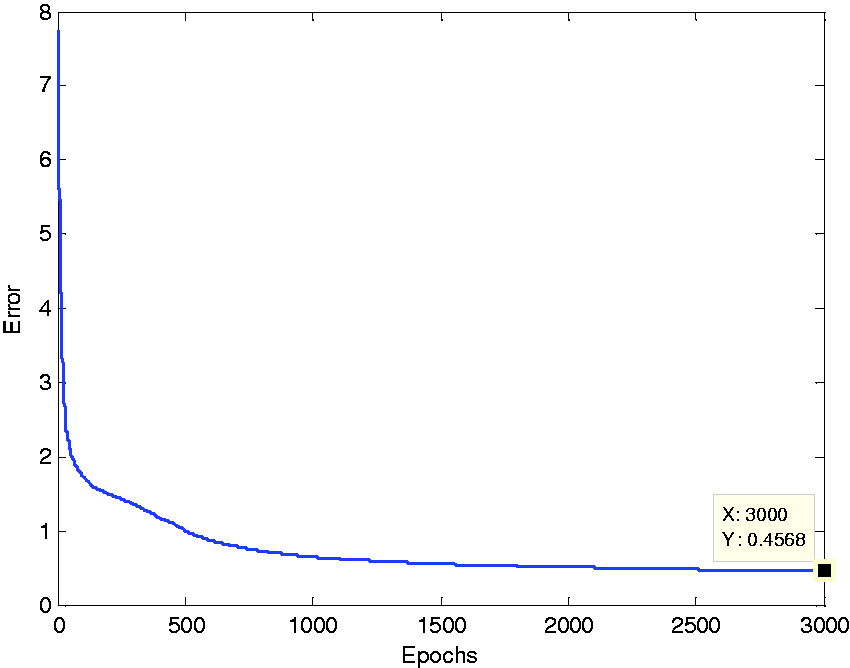
ANFIS training convergence curve, generation 3000.
Dual-sheet actuator control design
The ANFIS vibration reduction controller is suitable for use with a single-sheet activator; when two actuators are needed at the same time, another controller is required and has to become a part of the system. This affects vibration of the structure and the related function of the single-sheet actuator controller. A dual-sheet actuator controller was designed and a control database was created (see the flowchart in Figure 10).
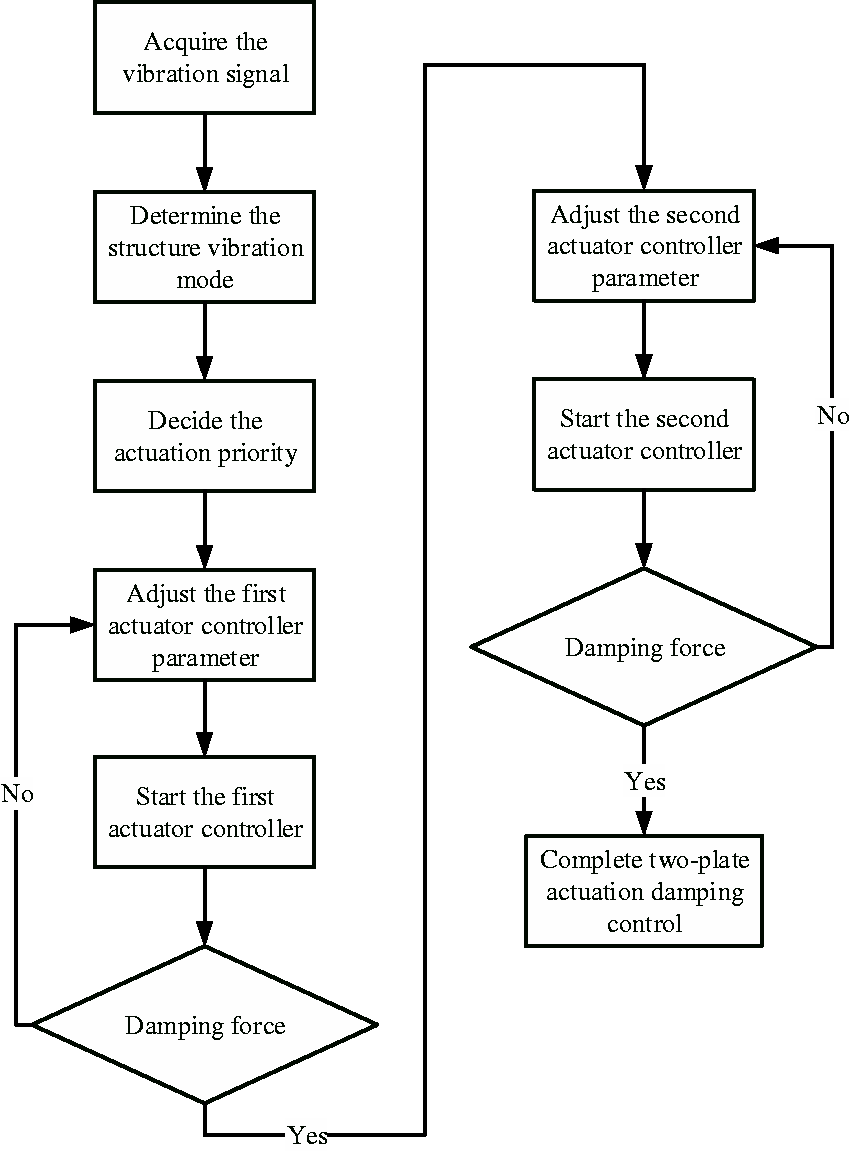
Control strategy flowchart for a dual-sheet actuator.
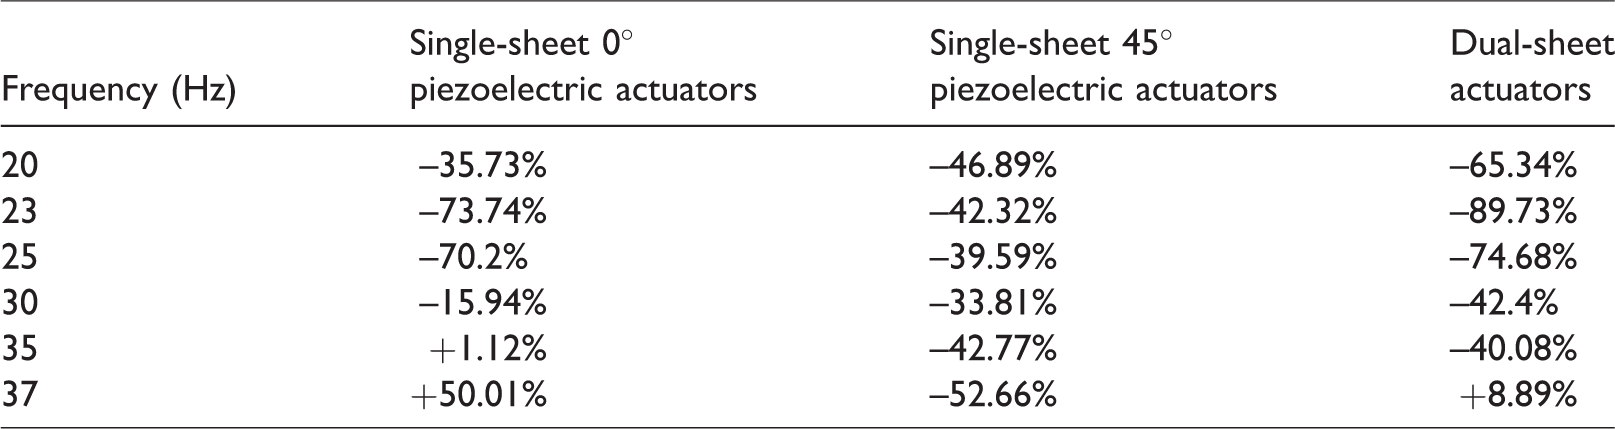
A fixed frequency database was created to give better vibration reduction control. This allowed the controller to make a decision about selecting either the dual-sheet or the single-sheet actuator at different frequencies. Allowance was made for a comparison between the single-sheet actuator and the dual-sheet actuator with a time domain spectrum response after FFT. The results of a comparison of the frequency response rate of change for the single-sheet and dual-sheet actuators are shown in Table 5.
Frequency response and rate of change for single-sheet and dual-sheet actuators at different frequencies.
To reduce random vibration, the first vibration signal was acquired by the piezoelectric sensor and passed through the first mode filter:
Experimental results and discussion
In this study, experiments were conducted using three different control methods: a Type-1 fuzzy controller, an adaptive controller, and an ANFIS controller. A dynamic signal analyzer provided exciter signals from which excitation in the form of a 500 mVpk sine wave signal was produced to carry out dynamic vibration reduction at a fixed frequency. Each experiment with the Type-1 Fuzzy and the ANFIS controllers was conducted over 8 s. But by 4 s, in both cases, control had been achieved. The adaptive method needed more time to reach a steady state, and the experiments were carried out over 20 s. However, after about 2 s, a clear difference was observed between controlled and uncontrolled conditions and some control had been achieved. A burst random signal produced by the dynamic analyzer from a random vibration signal (between 12.5 Hz and 25 Hz) was then applied to the exciter. The initial frequency was 20 Hz. The output results of the single-sheet actuator and the dual-sheet actuators of the 0° PEAs and the 45° PEAs were then compared. The results achieved with the Type-1 fuzzy controller are shown in Figure 11, those from the Type-1 fuzzy adaptive controller in Figure 12, and those from the ANFIS controller in Figure 13.
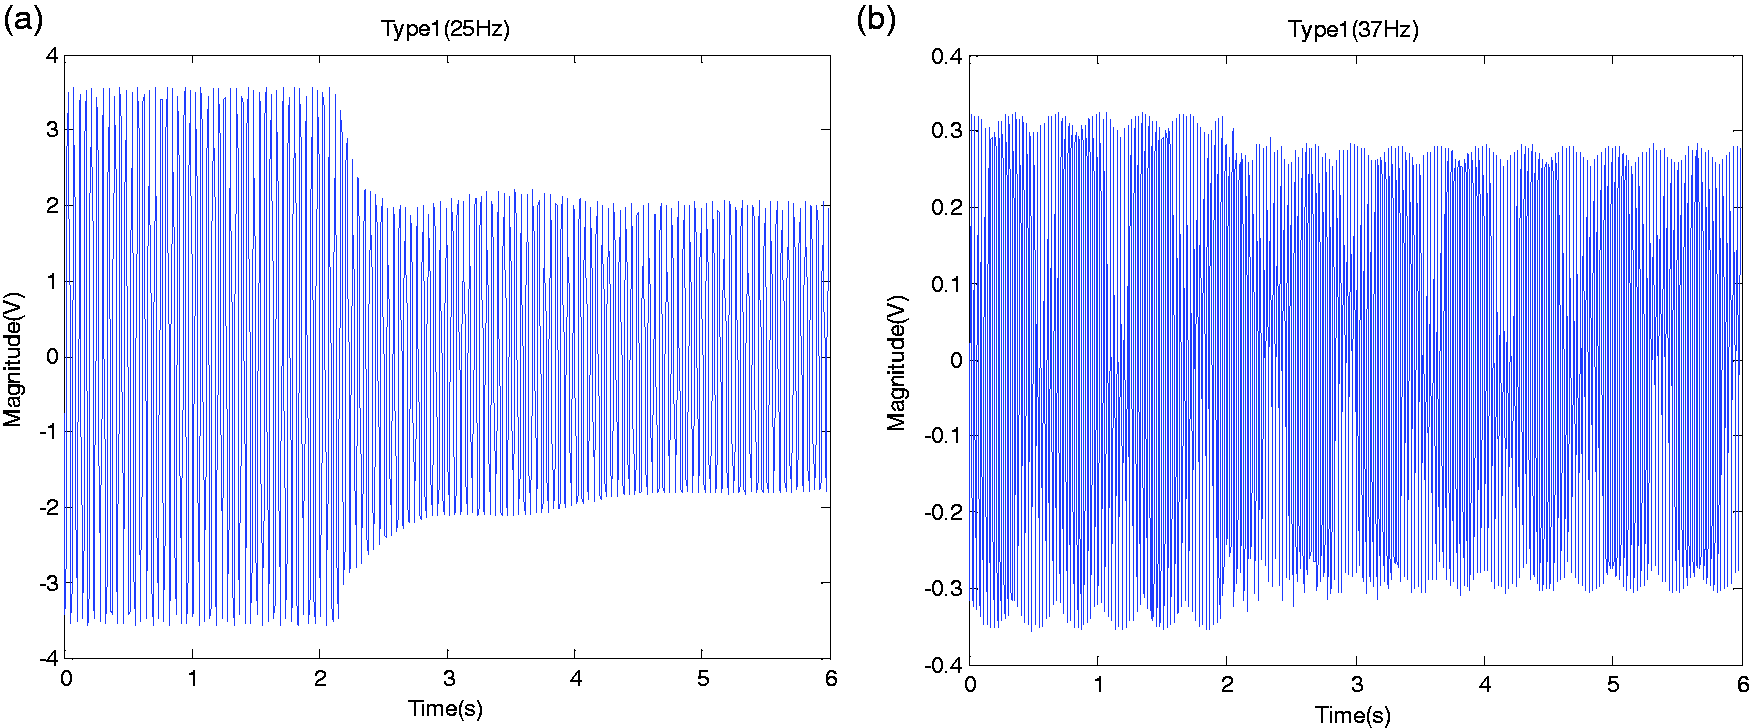
Type-1 fuzzy controller time domain response. (a) Time-domain control response, exciter signal at 25 Hz 500 mVpk. (b) Time-domain control response, exciter signal at 37 Hz 500 mVpk.
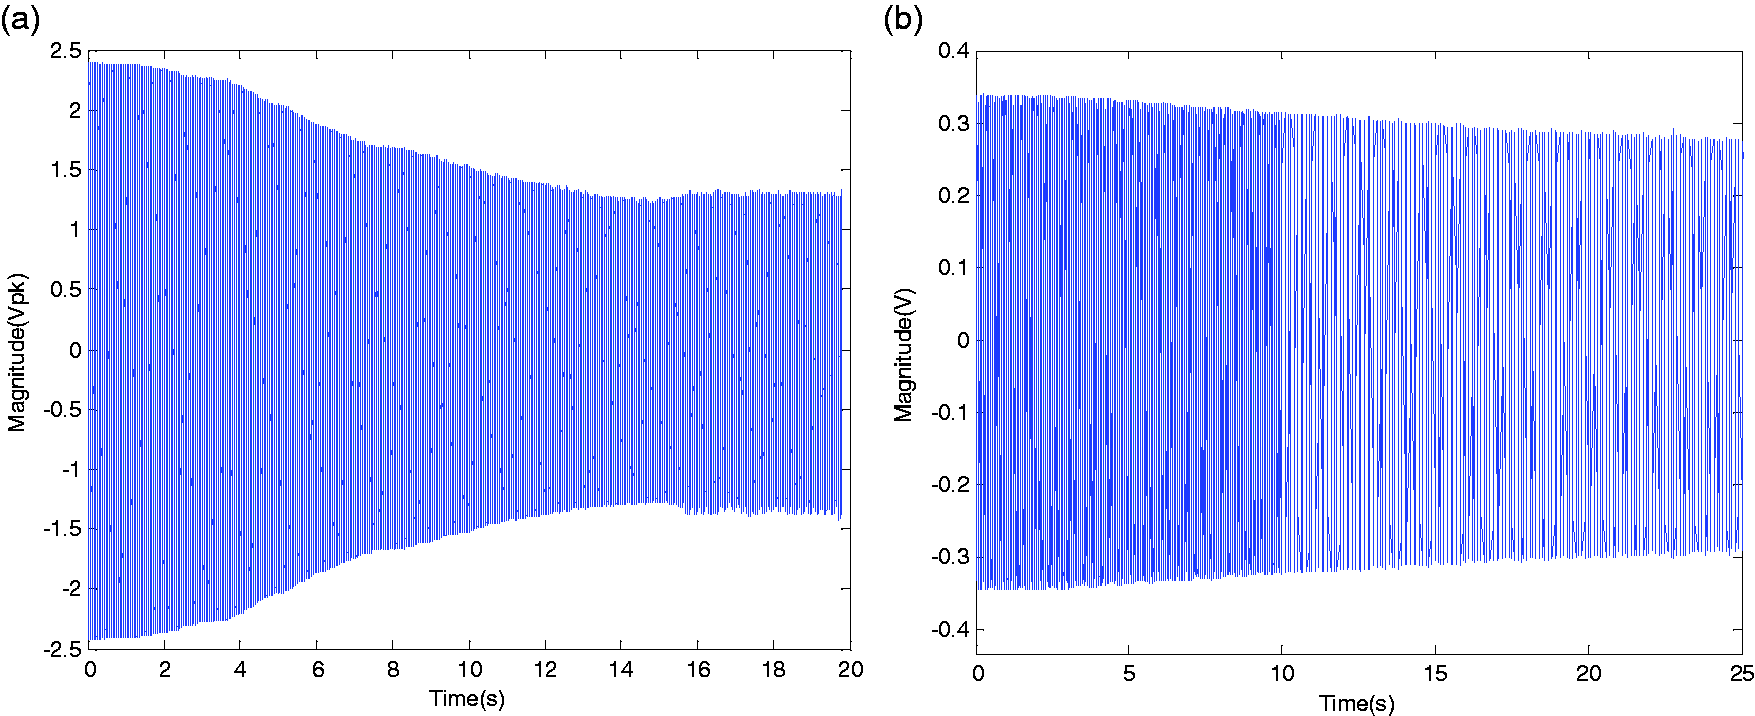
Type-1 adaptive fuzzy controller time domain response. (a) Time-domain control response, exciter signal at 25 Hz 500 mVpk. (b) Time-domain control response, exciter signal at 37 Hz 500 mVpk.
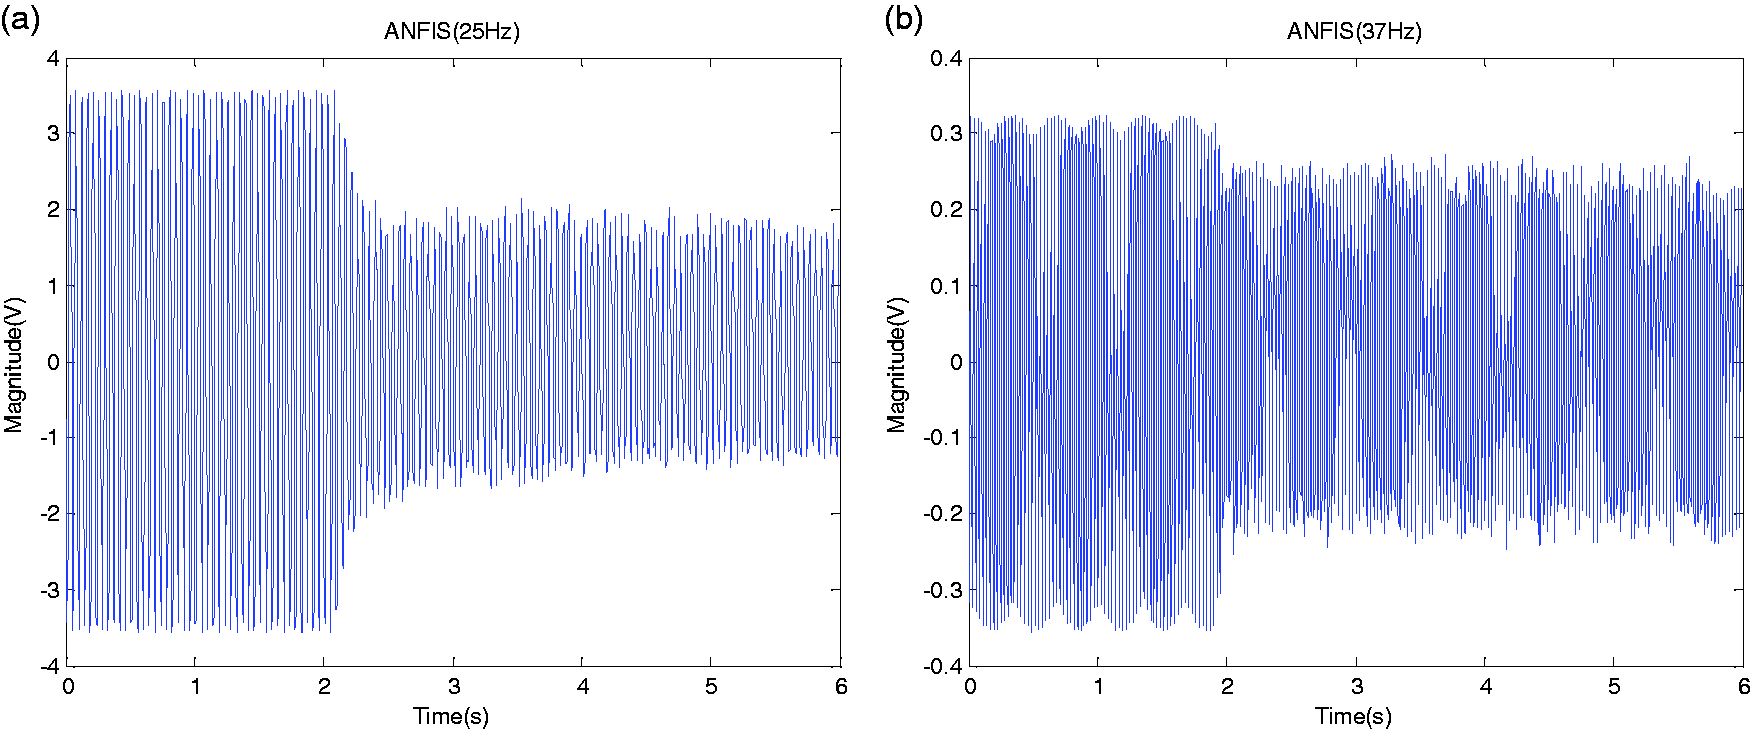
ANFIS controller time domain response. (a) Time-domain control response, exciter signal at 25 Hz 500 mVpk. (b) Time-domain control response, exciter signal at 37 Hz 500 mVpk.
In second mode vibrations, the 0° PEA has an amplification effect. Therefore, a simple vibration frequency judgment is made using the acquired vibration signal. When the frequency in the second mode is 31 Hz to 40 Hz, the 0° PEA is turned off. Otherwise, it remains on. The control results are shown in the diagram for the ANFIS controller, after the dual-sheet actuator strategy has been used at the first mode vibration frequency. The varying frequency used in the experiment was 500 mVpk sine wave signal excitation and switching was done between mode frequencies of 20 Hz to 25 Hz and 27 Hz to 30 Hz (see Figures 14 and 15).
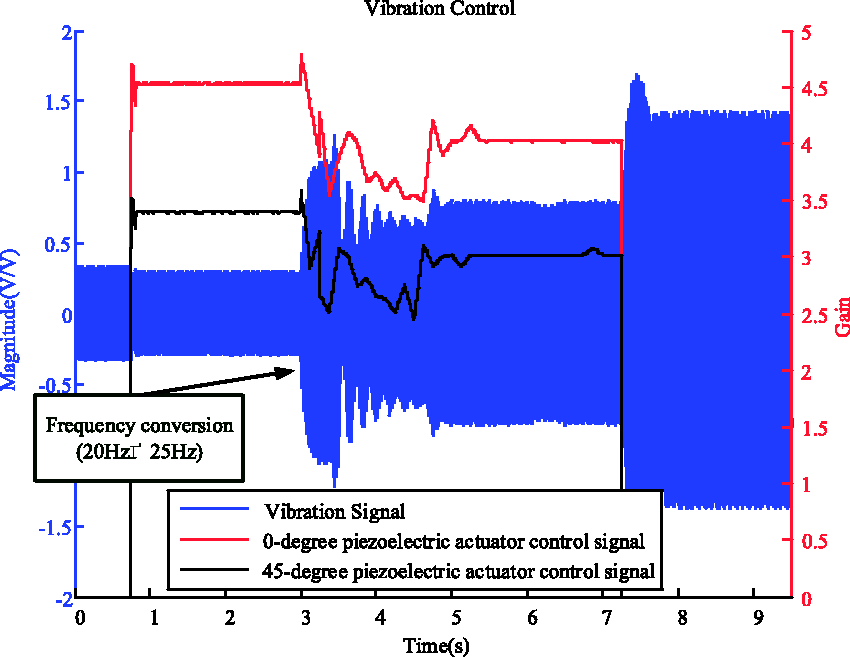
20 Hz–25 Hz varying frequency control.
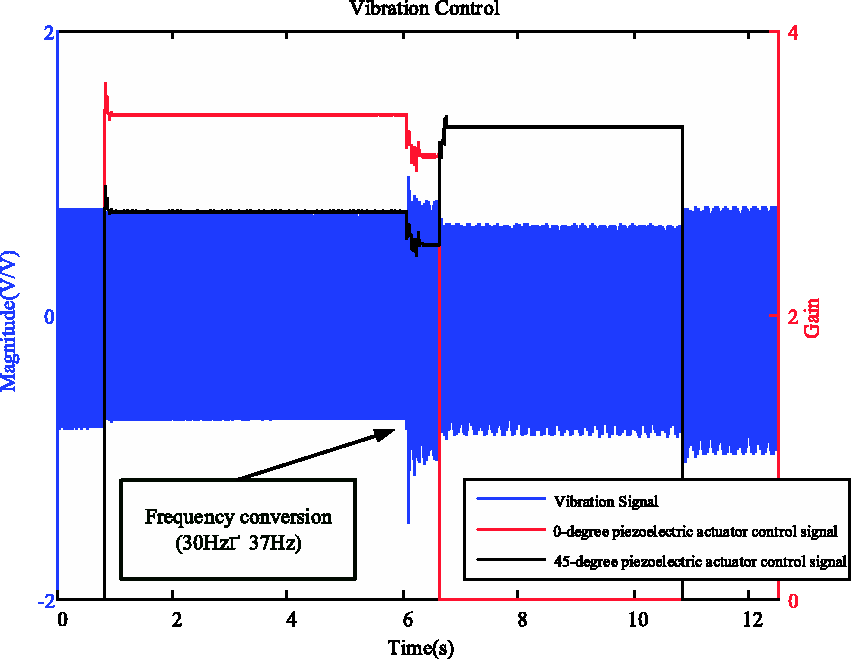
30 Hz–37 Hz varying frequency control.
The results obtained with the Type-1 fuzzy controller, the adaptive controller, and the ANFIS controller were compared at one single frequency. The results are shown in Table 6. At 25 Hz in the first mode, the vibration reduction effect of the ANFIS controller can reach at 55.6%, and in the second mode at 37 Hz, the vibration reduction effect can reach at 32.7%. It is clear that the best vibration reduction response time for the ANFIS controller was inferior to that of the traditional Type-1 fuzzy controller, but better than that of the traditional adaptive fuzzy controller. However, its vibration reduction rate was superior to that of both the Type-1 fuzzy and the adaptive fuzzy controllers.
Comparison of first and second mode vibration controllers.
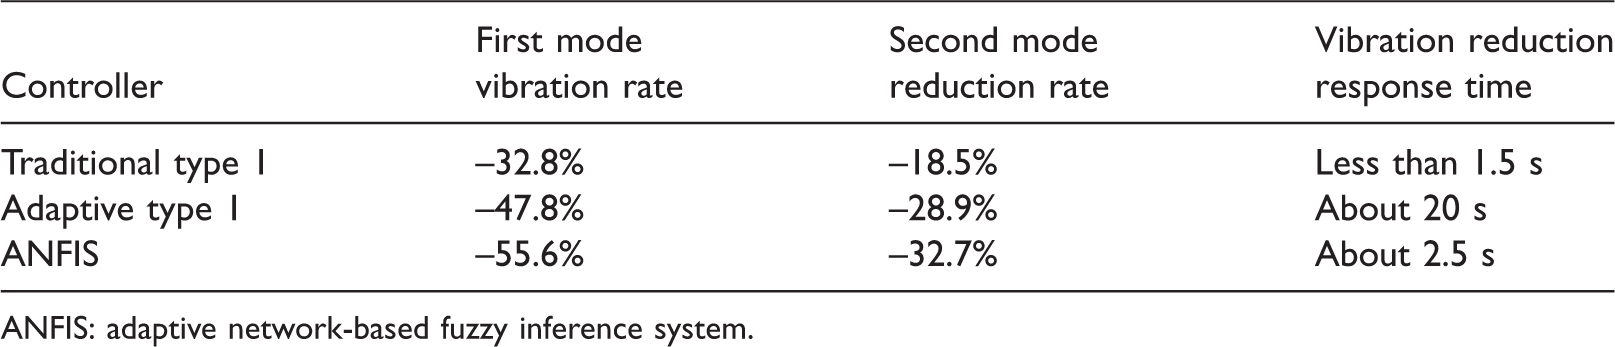
ANFIS: adaptive network-based fuzzy inference system.
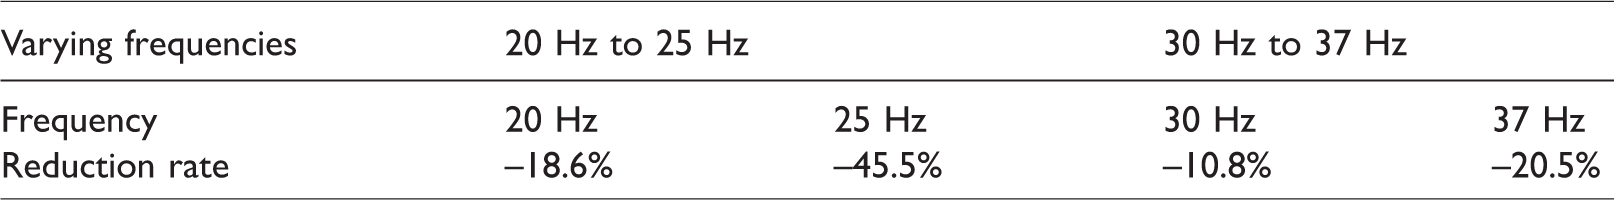
The instance of control can be clearly seen with a varying frequency state. FFT analysis allows the calculation of the prevailing frequency to be done and control established in about 2 s. The vibration reduction achieved at different frequencies is shown in Table 7. The 500 mVpk sine wave signal excitation can perform varying frequency control in different modes, all of which have vibration reduction effect.
Vibration reduction rate at different frequencies.
The effects of a single-sheet actuator were compared with those of a dual-sheet actuator under random vibration control. It is clear from Figure 16 that vibration in the first mode is more obvious and there is a peak in the first mode at a vibration frequency of 25 Hz. The vibration reduction effect of the dual-sheet actuator is clearly superior to that of the single-sheet actuator.
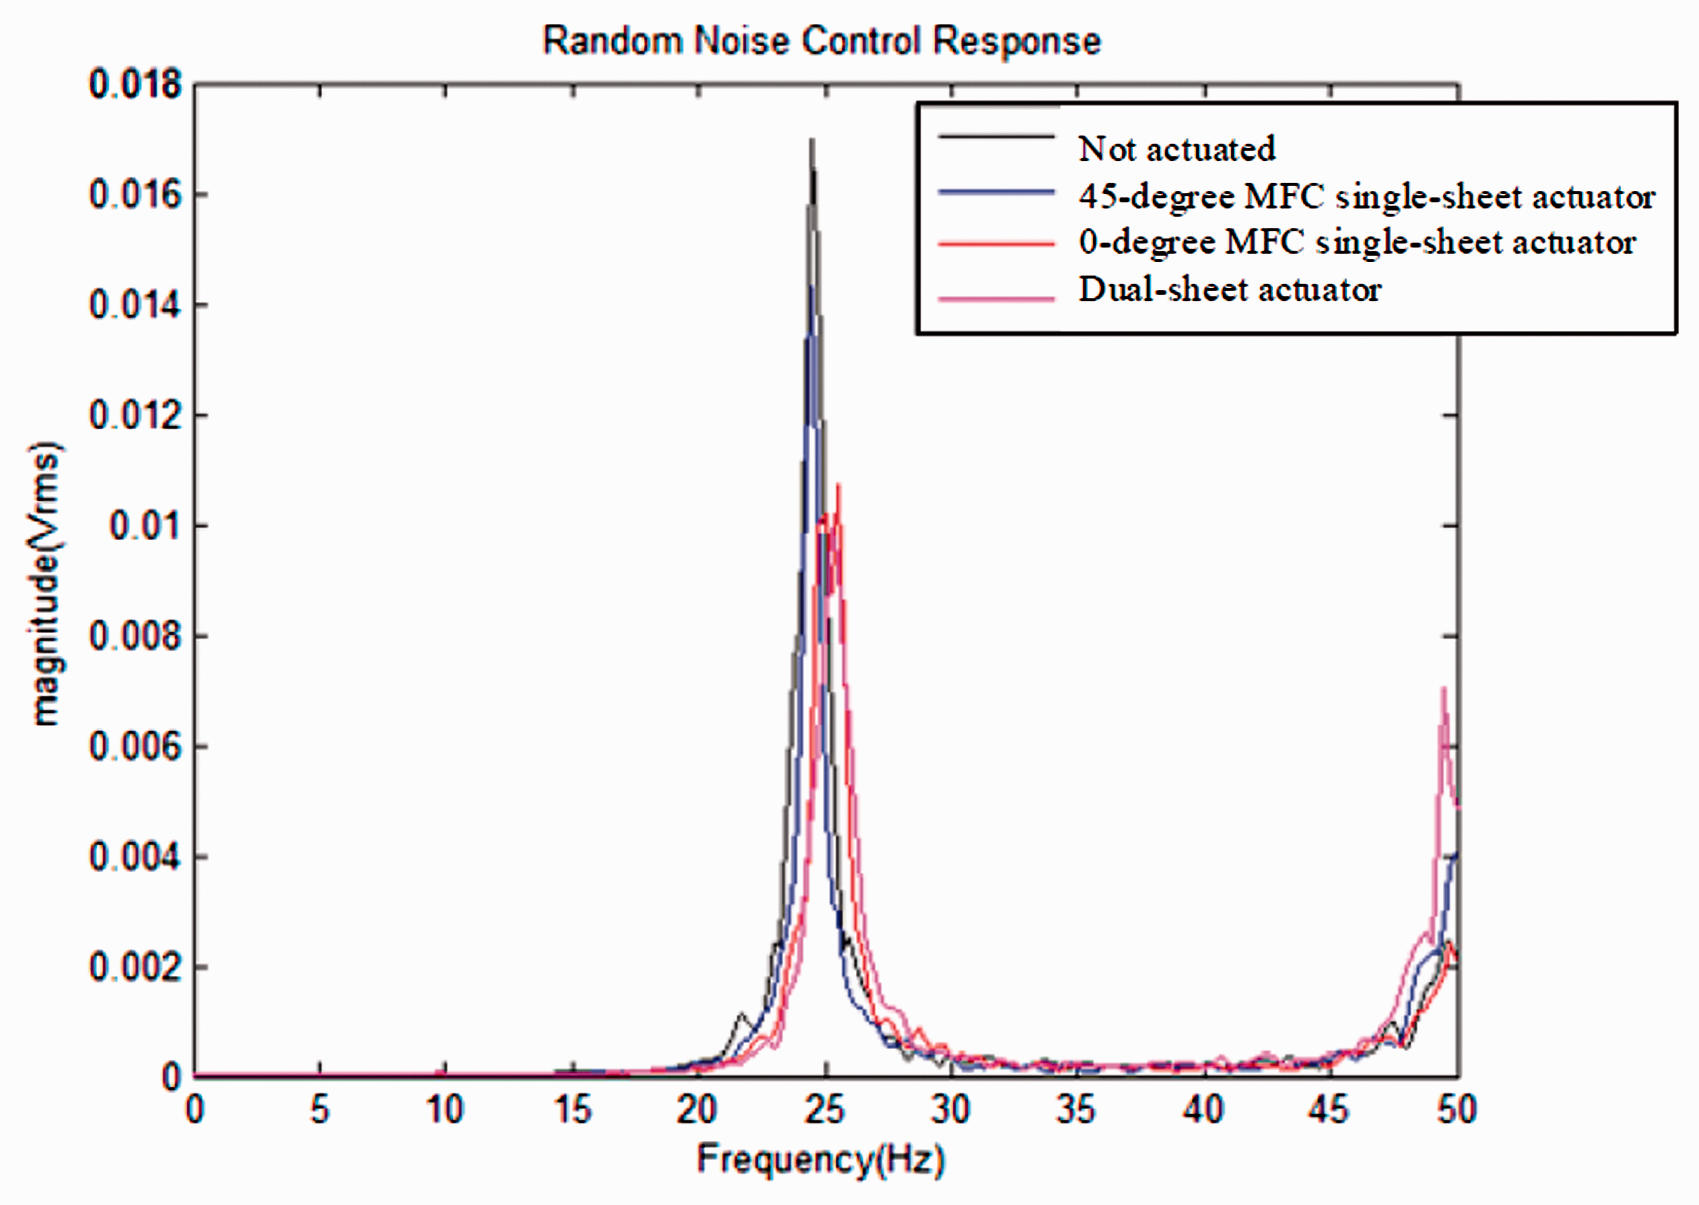
The response of single-sheet and dual-sheet actuators to a 500 mVpk random burst exciter signal.
Conclusion
In this study, active vibration control exerted by PEAs initiated by signals from piezoelectric vibration sensors mounted on a test plate was investigated. The experimental results showed that active control mediated by a feedback control framework can really suppress vibration and achieve vibration reduction. ANFIS was found to be clearly superior to the traditional Type-1 fuzzy controller for vibration reduction control. In the first mode, an ANFIS controller can reach a reduction of 50% or more and also reach a stage of stable vibration reduction response in less time than that taken by a Type-1 adaptive fuzzy controller. An investigation of the location in which the PEA should be pasted showed that the position where the 0° PEA was located had good vibration reduction effect in the first mode, but would actually amplify vibration in the second mode. The 45° PEA suppressed vibrations in both modes in different locations. In the first mode, the 0° and 45° PEAs both had vibration reduction effect in the first mode and experiments showed that a dual-sheet actuator provided better vibration reduction than a single sheet. The 0° PEA increased vibration in the second mode and the dual-sheet actuator had inferior vibration reduction effect at vibration frequency compared to the single-sheet control of the 45° PEA. Since the frequency response of random vibration in the first mode was more obvious, a band pass filter was used to process the random vibration signal. The 0° PEA had a better vibration reduction effect than that of the single-sheet actuation of the 45° PEA. The vibration frequency was more obvious in the first mode and the dual-sheet actuator was found to exert substantial vibration reduction effect.
Footnotes
Declaration of conflicting interests
The author(s) declared no potential conflicts of interest with respect to the research, authorship, and/or publication of this article.
Funding
The author(s) received no financial support for the research, authorship, and/or publication of this article.