
Abstract
Wavelength or light intensity demodulation method for a polarization maintaining fiber loop mirror (PM-FLM) sensor is not only expensive but also unsuitable for vibration monitoring. This paper studies the voltage demodulation principle and explores theoretically the influence of light source on the sensitivity. Then a PM-FLM sensor is applied to vibration monitoring. A low-power narrow-band light source reflected from FBG and a high-power laser light source are used respectively as input. The time domain voltage signals of vibration from a photo-detector are collected by a data acquisition card and converted via a fast Fourier transform algorithm. The experimental result shows that a PM-FLM sensor using a high-power narrow-band light source as input has a higher sensitivity to vibration than the one using a low-power narrow-band light source. In practical application, we can choose a high-power narrow-band light source as input to improve the sensitivity to vibration.
Introduction
Polarization maintaining fiber (PMF) loop mirror (PM-FLM) sensors have many advantages, such as lightweight, corrosion resistance, anti-electromagnetic interference, easy fabrication, low cost, polarization independence to input light and great flexibility.1,2 They have been widely used in measuring strain,3,4 temperature, 5 torsion, 6 curvature,7,8 twist, 9 pressure 10 and liquid level. 11
A PM-FLM sensor is usually demodulated by a wavelength12–17 or light intensity 18 monitored by an optical spectrum analyzer (OSA) or optical power meter. Compared with the measuring voltage devices, these devices are expensive. The demodulation methods restrict the practical application of a PM-FLM sensor. Moreover, the methods are only applicable to static voltage devices, and these devices are expensive. The demodulation methods restrict the engineering and needed to be measured. The sensitivity of a vibration sensor is an important performance. A PM-FLM has also been applied to acoustic vibration measurement 19 and vibration measurement of composite 20 by the voltage demodulation, but the research on the influence of light source on the sensitivity of a PM-FLM vibration sensor is seldom reported.
To solve the above problems, in this work, the voltage demodulation principle was studied and the influence of light source on the sensitivity was explored. Subsequently, the demodulation principle was applied to vibration measurements and the comparison about the sensitivity of two types of different light source systems was made.
Voltage demodulation principle
Figure 1 shows the schematic diagram of a PM-FLM sensor. An isolator is used to prevent optical feedback instabilities. The PM-FLM is made of a conventional single mode 3 dB coupler and a section of PMF, which is glued to the test section and used as the sensing element. Input light from port 1 is split by the 3 dB coupler equally into two counter-propagating waves. Subsequently, as a result of PMF birefringence, interference occurs when the counter-propagating waves recombine at output 2, which is connected to an OSA. The output interference spectrum of a PM-FLM varies with the applied strain on the PMF.
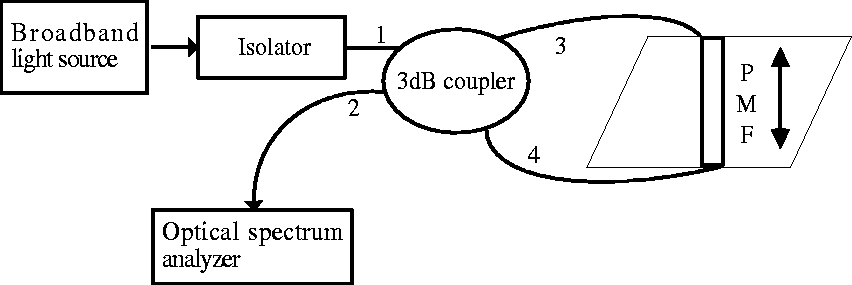
The schematic diagram of a PM-FLM sensor.
Figure 2 shows the demodulation principle. The curves marked with “0 με” and “202 με” represent the output interference spectra of a PM-FLM when the applied strain on the PMF was 0 με and 202 με using a broadband light source as input. In Figure 2, the light intensity of the output interference spectrum at 1549.7 nm varies with increasing strain. From this, it is possible to monitor the variations in the strains using the light intensity values at 1549.7 nm. However, the method of determining the variations in the light intensity depends on the OSA or optical power meter. So the light intensity signals are needed to convert into voltage signals using a photo-detector, as shown in Figure 3, which depicts the schematic of voltage demodulation.
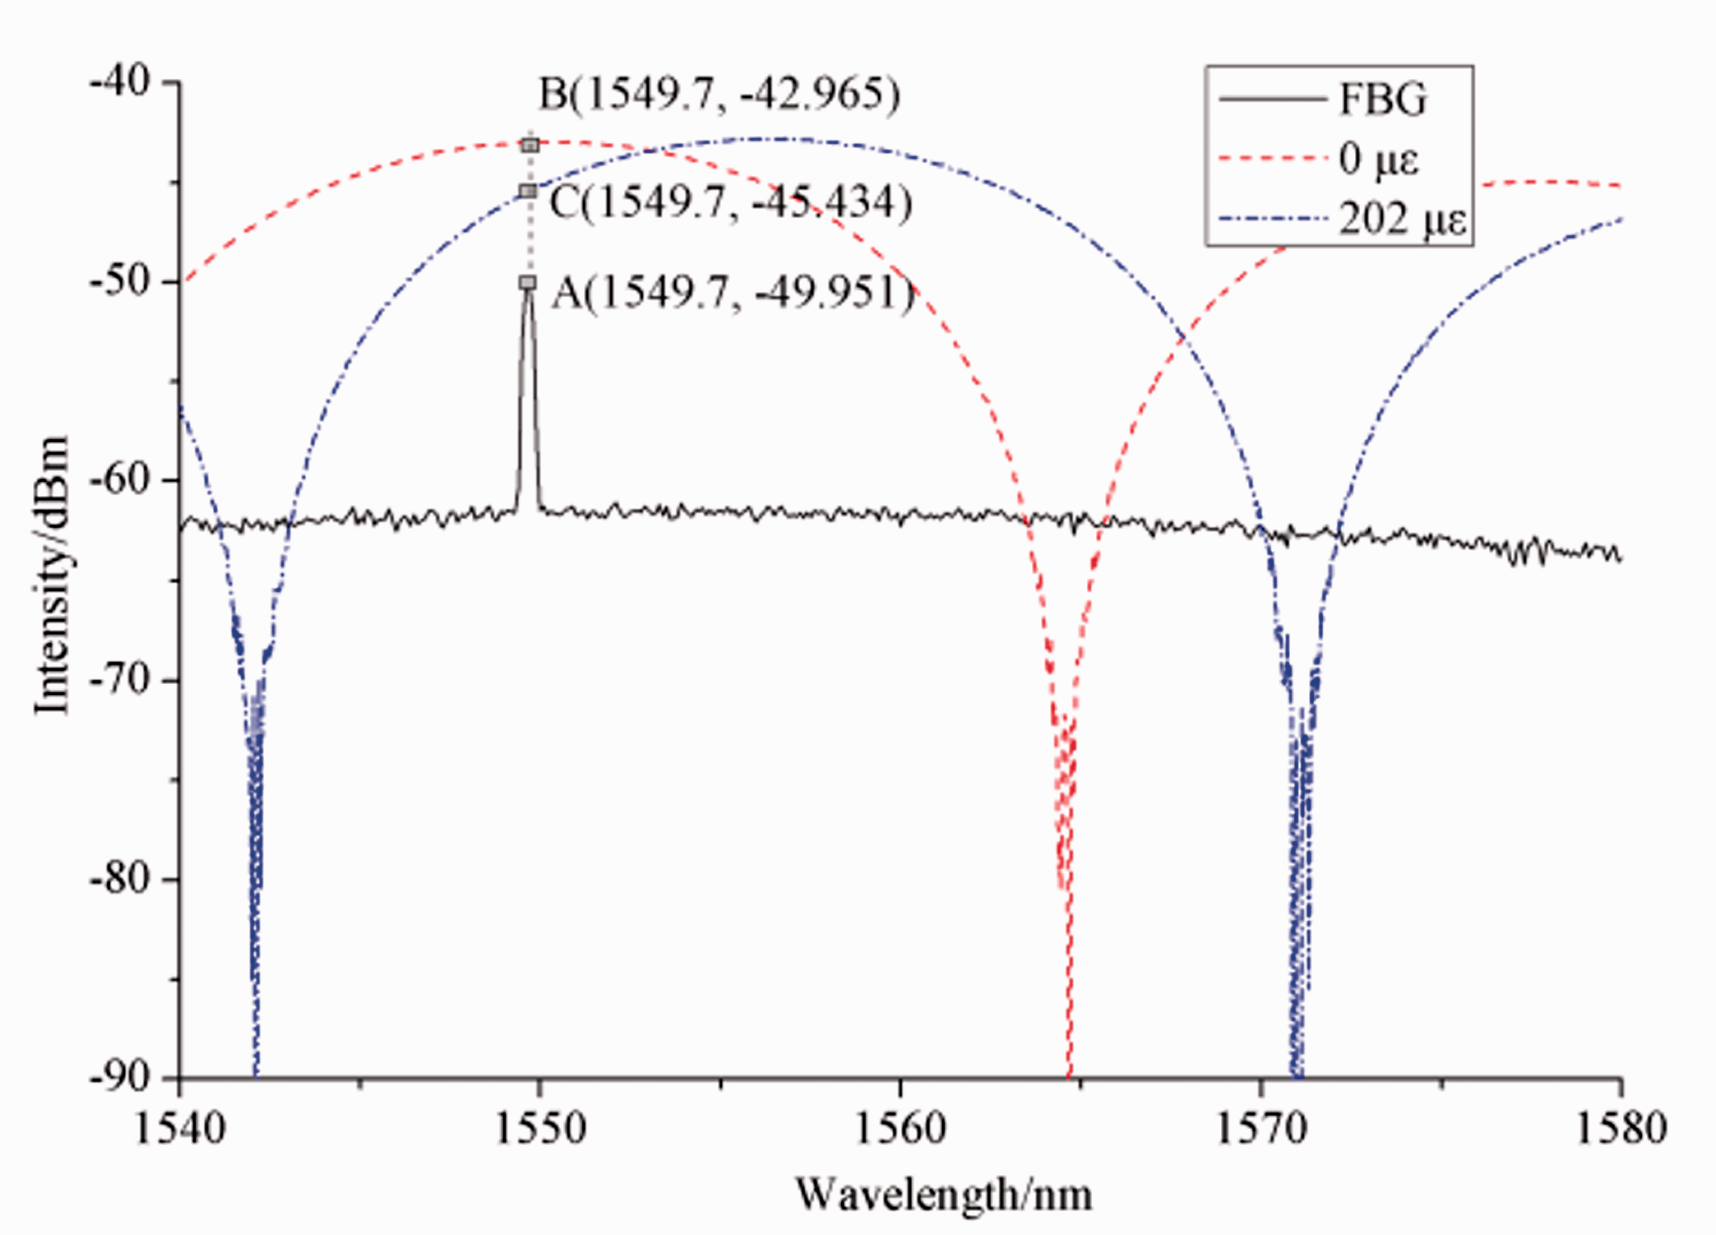
Demodulation principle.
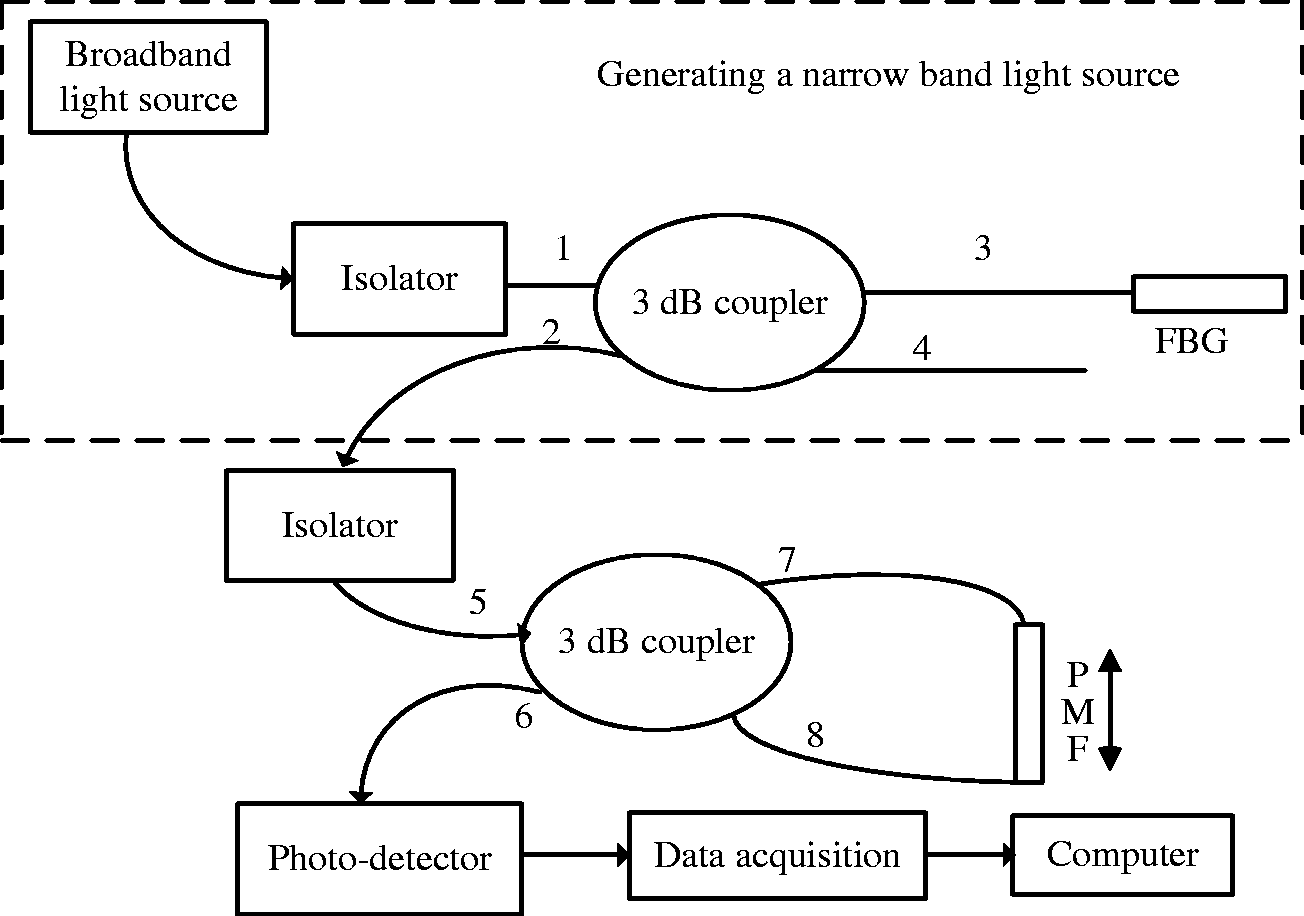
Schematic of voltage demodulation.
A photo-detector usually has a fixed operating wavelength. When a photo-detector was used to convert light intensity signals into voltage signals, a narrow-band light source is usually used as the input of a PM-FLM instead of a broadband light source. The operating wavelength of a photo-detector approximates the central wavelength of the narrow-band light source. In Figure 3, the part in the dotted box is used to generate a narrow-band light source. The broadband light source is launched into a 3 dB coupler and split equally by the 3 dB coupler into two counter-propagating waves. The wave at port 3 is reflected back by FBG with a central wavelength of 1549.7 nm and then output from port 2. The narrow-band light source reflected from FBG is shown in Figure 2, which was marked with “FBG”, and it is used as the input of a PM-FLM at port 5. The output interference spectra of the PM-FLM from port 6 are collected by a photo-detector and the voltage signals from the photo-detector are measured by a data acquisition card (DAC) and then processed by a computer.
Assume that
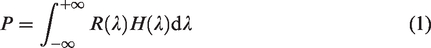
Since the bandwidth of a narrow-band light source is very small, the effective wavelength range is very small, as shown in Figure 2. The light power mainly focuses at the central wavelength of the narrow-band light source. According to equation (1), the output light power of the modulated spectrum by a PM-FLM is expressed as

In equation (2), the output light power
Once a PM-FLM is chosen, the light intensity corresponding to a certain strain is a certain value at the wavelength of
Vibration experimental results and discussions
We applied a PM-FLM to vibration monitoring. The experimental setup is shown in Figure 4(a). The test object was an aircraft wing specimen made of aluminum alloy plate. The shape of the aircraft wing specimen was designed according to typical aircraft structure. The dimensions of the aircraft wing specimen were shown in Figure 4(b). Its thickness is 2 mm, and the cantilever beam was used to support the test object as shown in the shaded part of Figure 4(b). The vibration exciter, driven by a power amplifier and a function generator, was attached underneath the specimen as the vibration source to produce vibration. It is known that the strain along x direction is larger than the one along y direction by Ansys analysis. The PMF, which was 19 cm long and possessed a group birefringence of 6.43 × 10⁻⁴ at 1550 nm, was glued to the surface of the test section along x direction as the sensing element using AB glue. When vibration is produced on the test object, the strain will be produced on the PMF. The voltage of the photo-detector will vary with vibration. Finally, the time domain voltage signals from a photo-detector which operates at ∼1550 nm were collected by the DAC, which was programmed using LabVIEW software, and converted via a fast Fourier transform (FFT) algorithm.
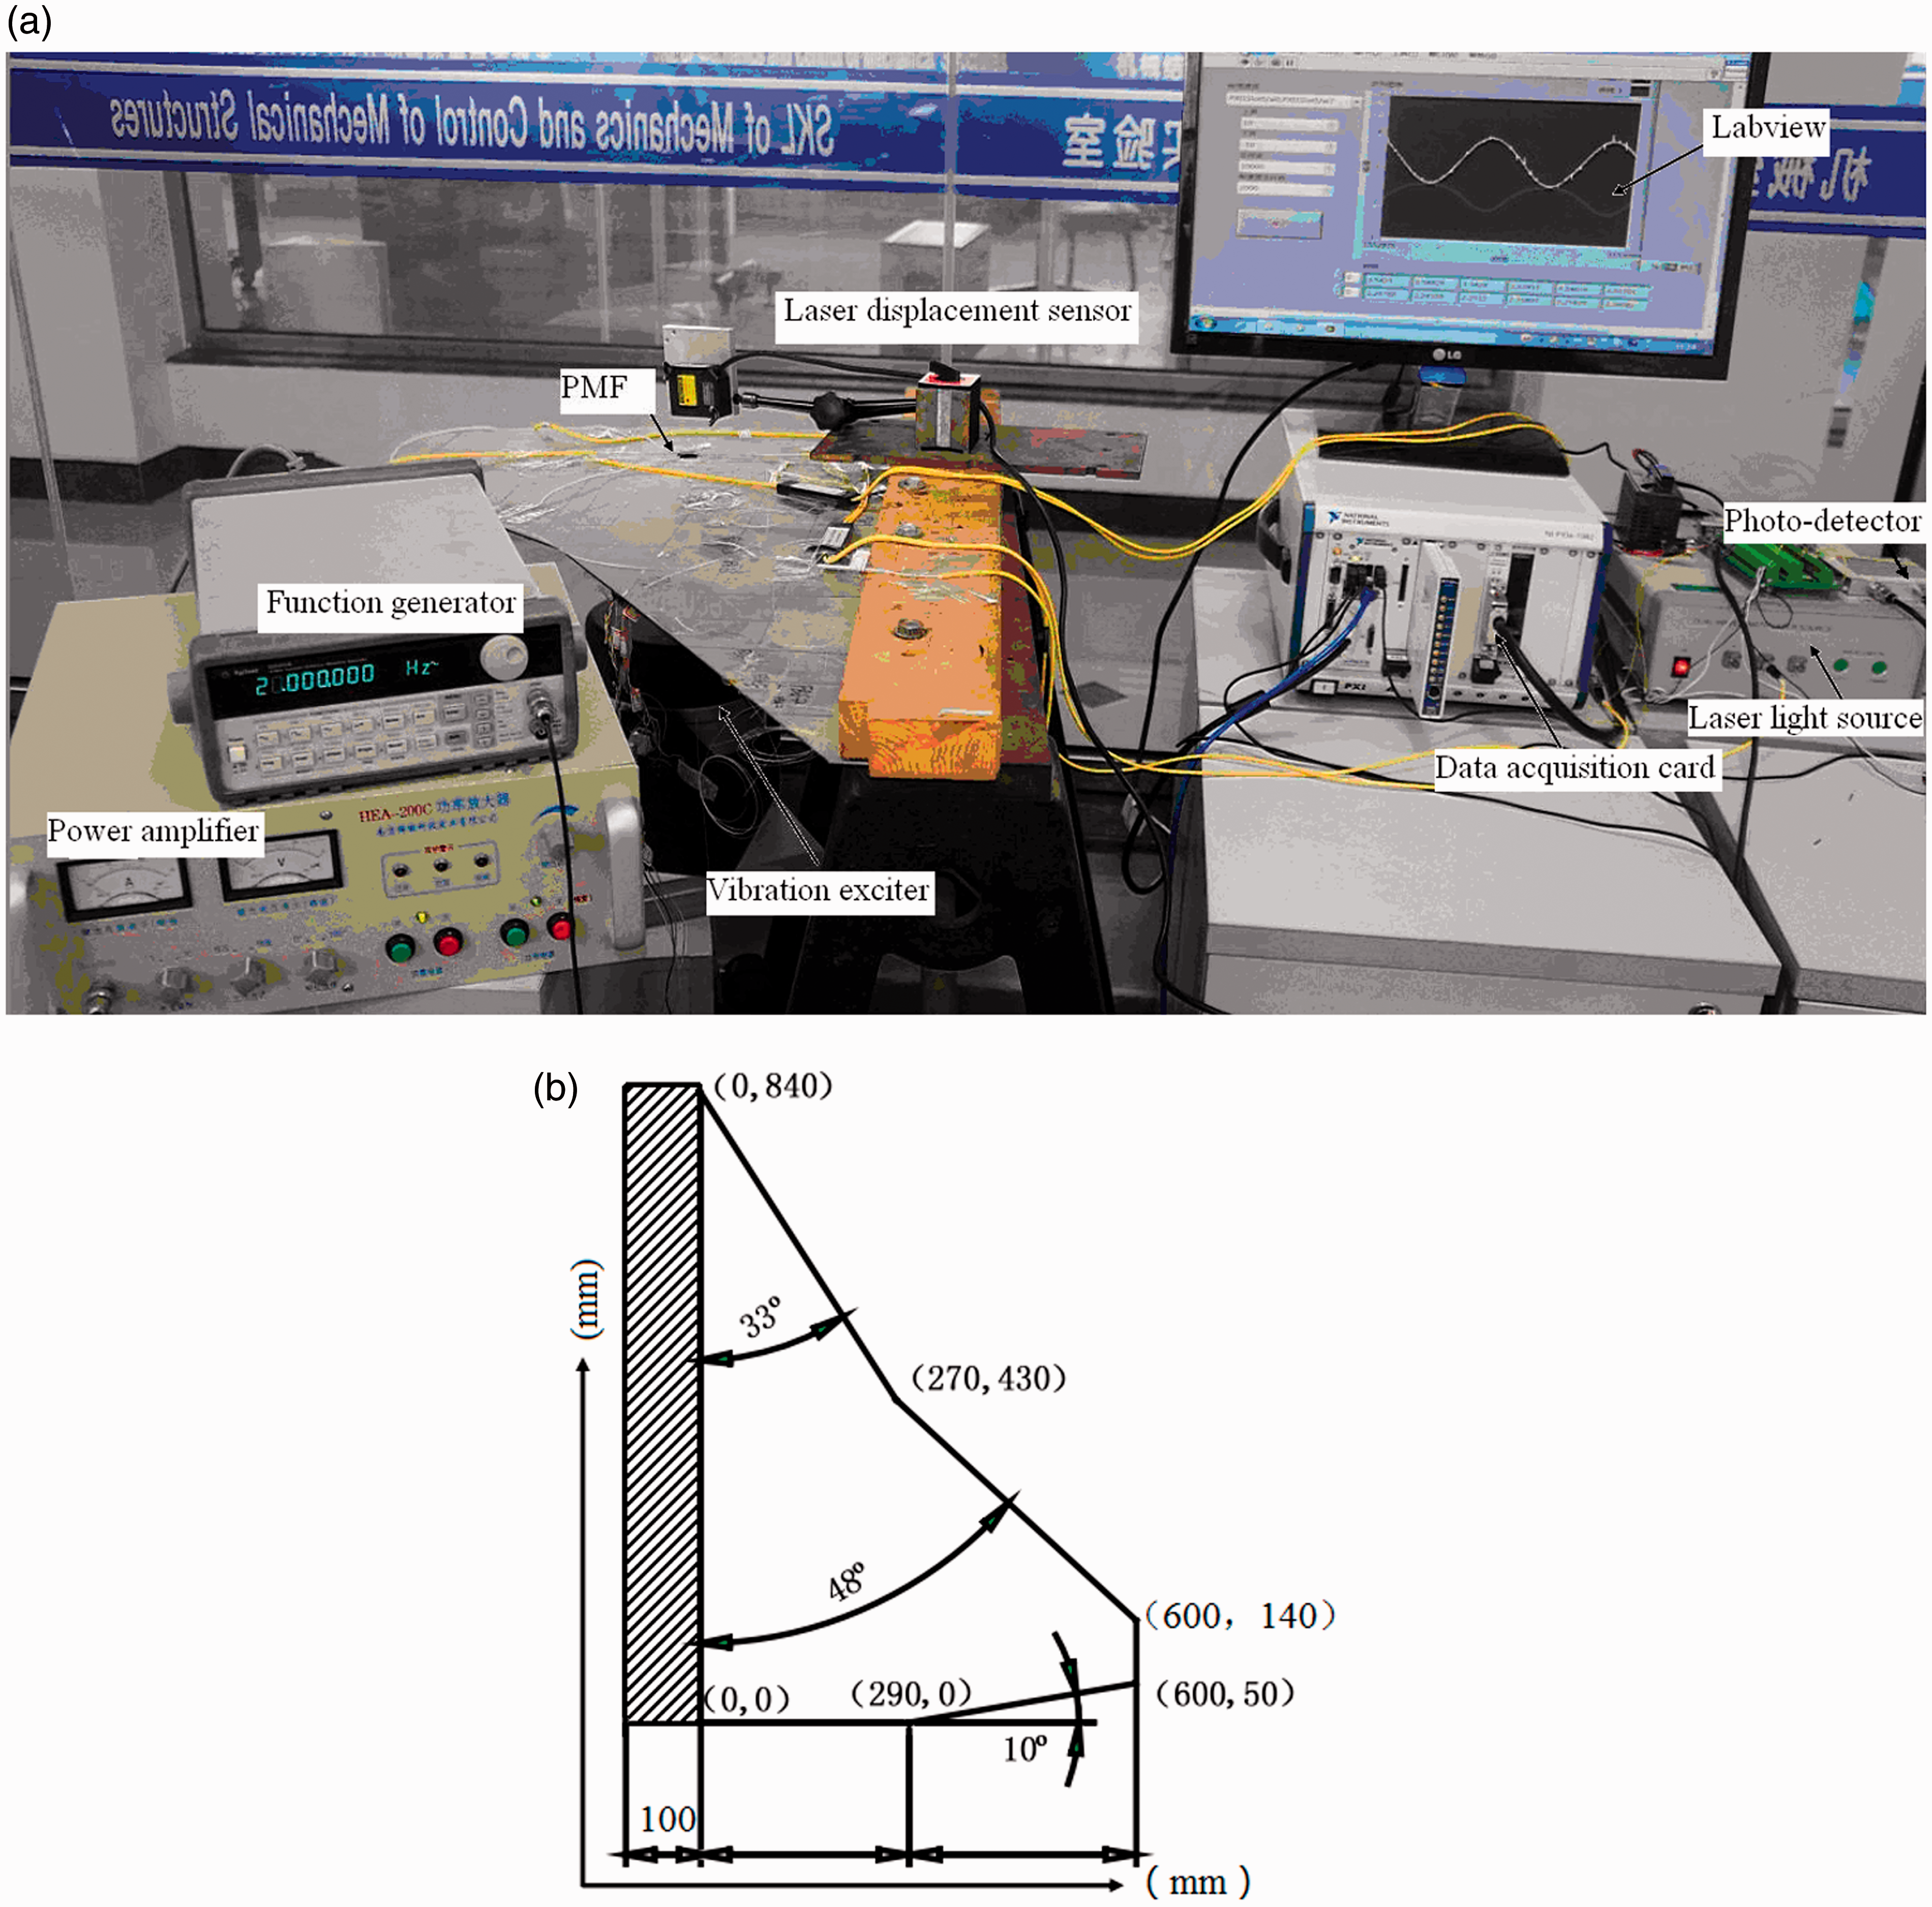
Vibration monitoring: (a) Experimental setup; (b) the dimensions of the aircraft wing specimen.
Results of using a narrow-band light source reflected from FBG as input
The narrow-band light source reflected from FBG with a central wavelength of 1549.7 nm is used as the input of a PM-FLM, as shown in Figure 3. Figure 5(a) shows the time domain signal by FFT filter when the vibration exciter produced a 20 Hz sinusoidal signal. Then the frequency domain signal was converted from Figure 5(a) via a FFT algorithm, as shown in Figure 5(b). Although the time domain signal in Figure 5(a) contained large noises, the shape of a sinusoidal wave can be observed. The frequency of a PM-FLM in Figure 5(b) is 20 Hz, which agrees well with the vibration source frequency. The voltage amplitude of a PM-FLM in Figure 5(b), which indicates the magnitude of vibration, is 0.00598 V. In the same way, the time and frequency domain signals by FFT filter at 2 kHz are obtained, as shown in Figure 5(c) and (d). However, from Figure 5(c) and (d), we observe that the PM-FLM cannot correctly measure the vibration signal.
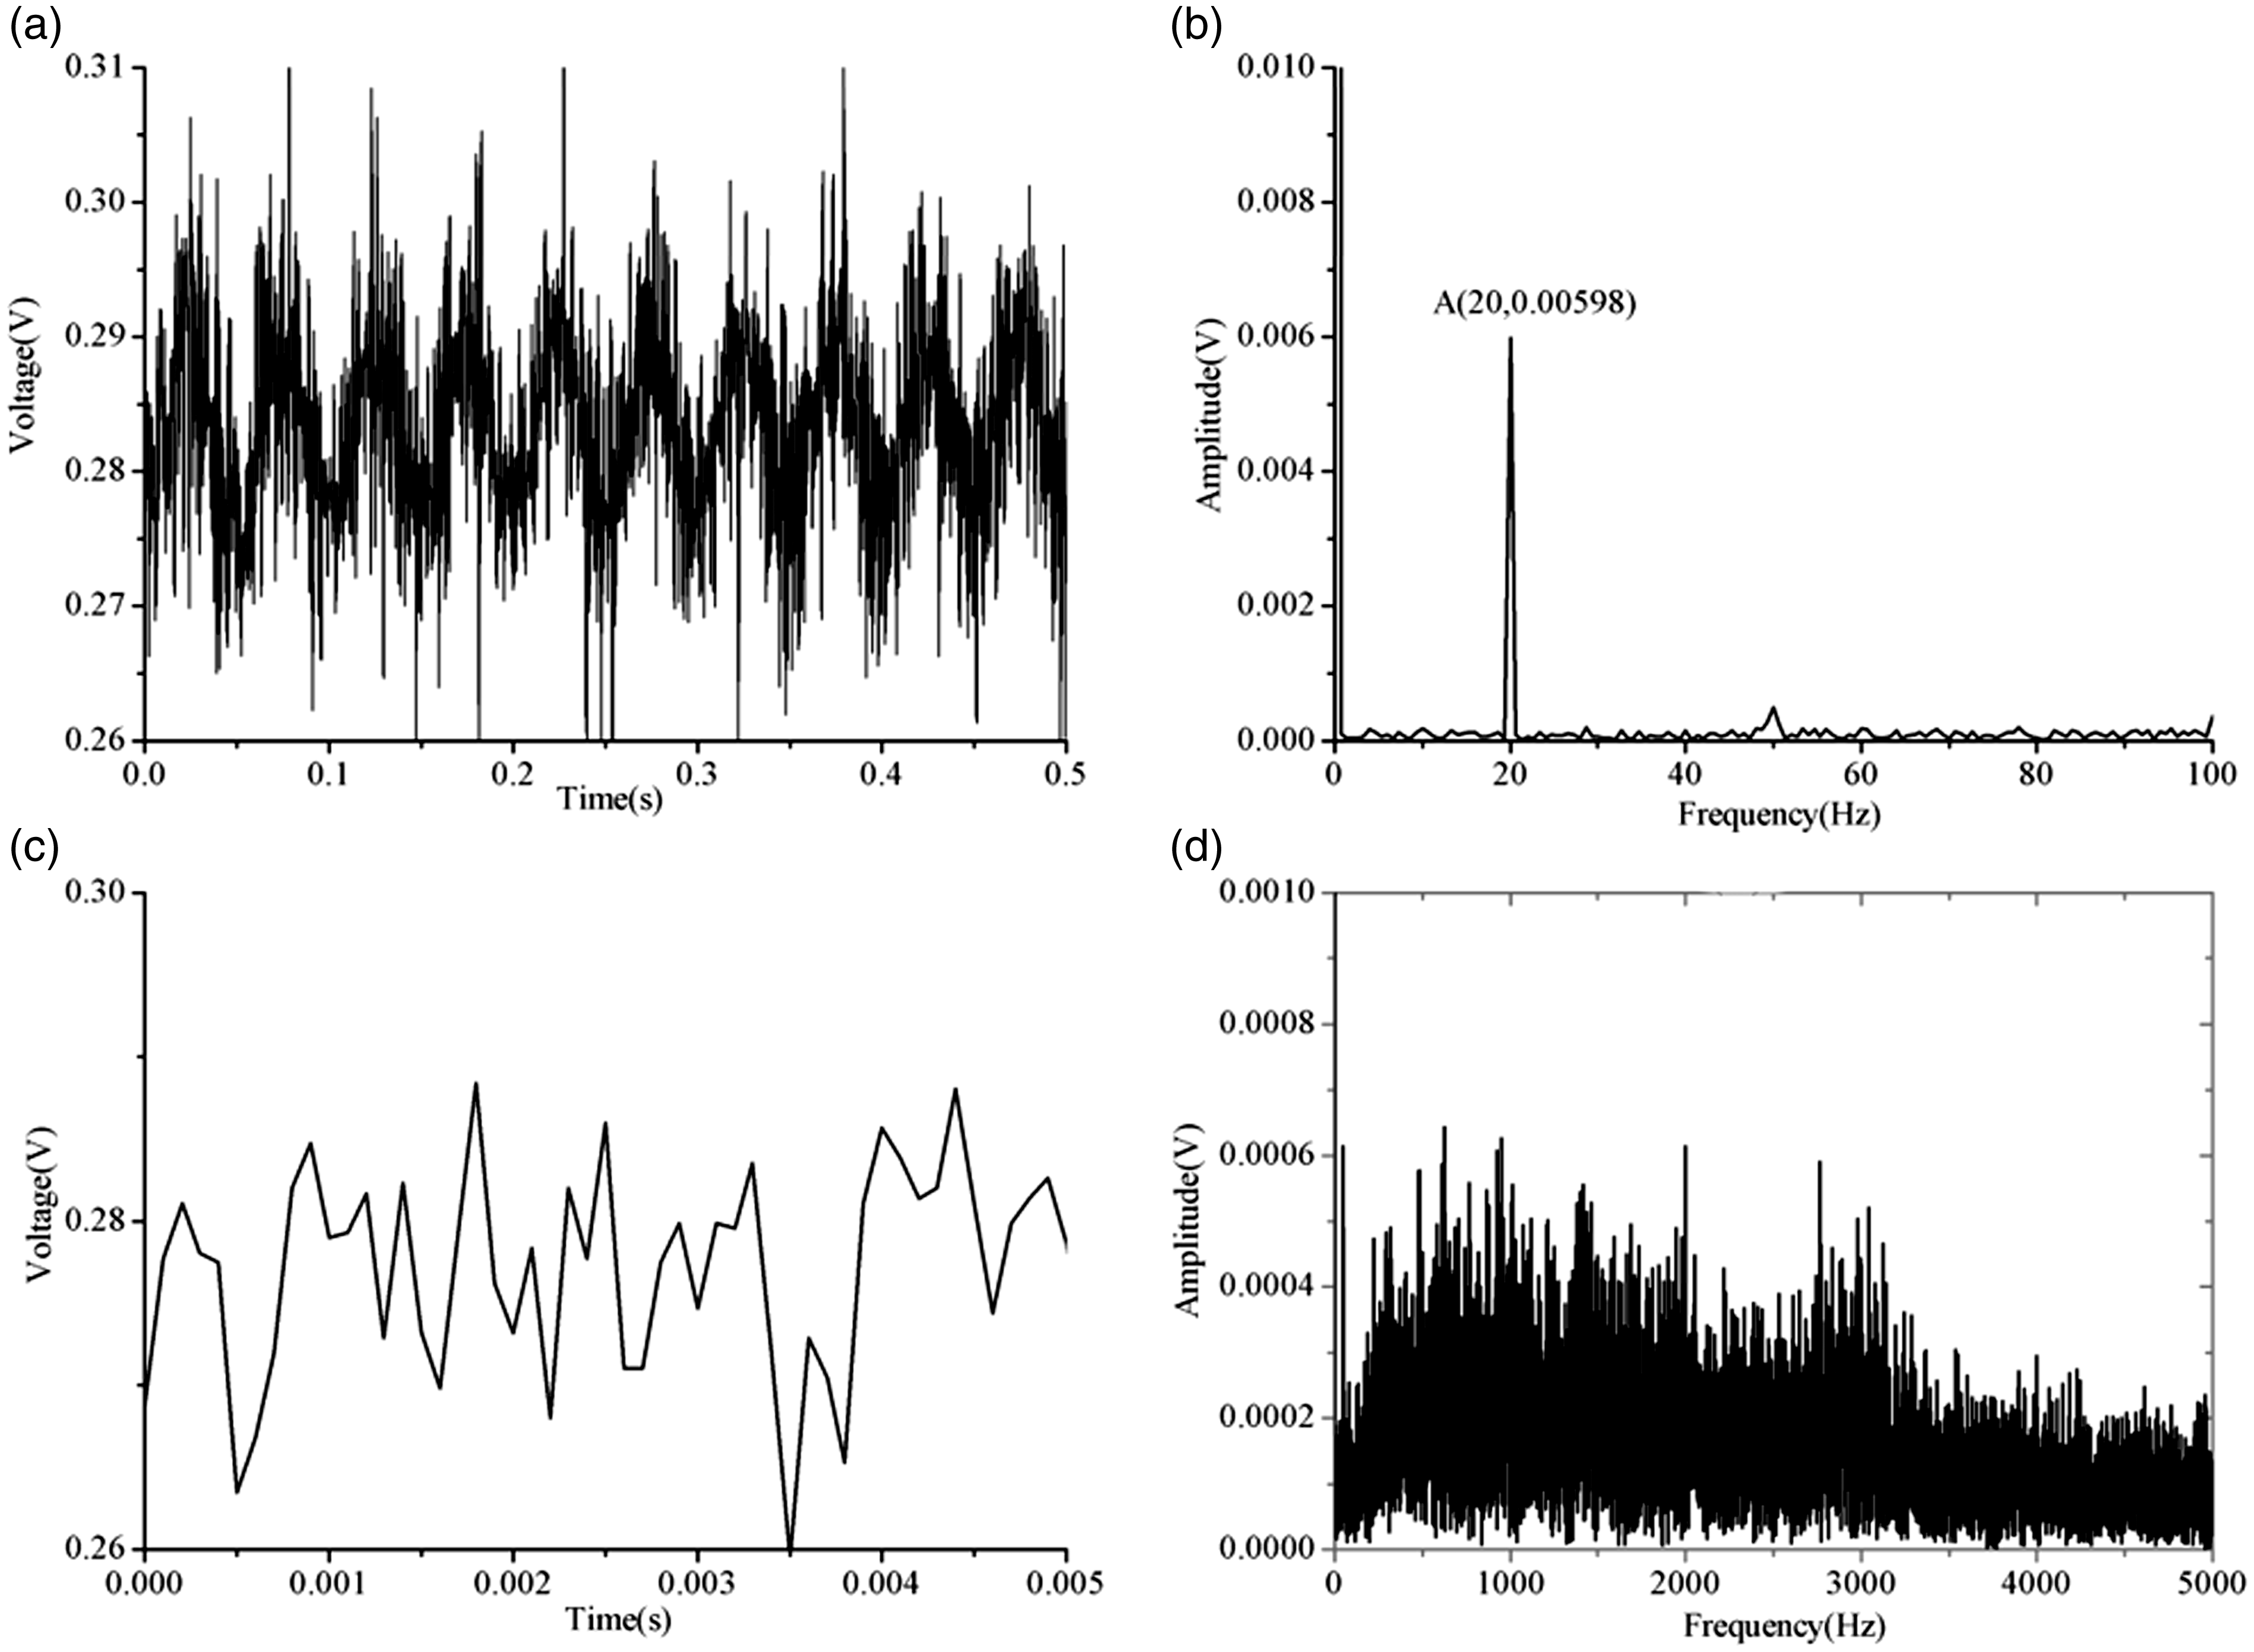
Time and frequency domain signals using a narrow-band light source reflected from FBG as input: (a) time domain signal at 20 Hz, (b) frequency domain signal at 20 Hz, and (c) time domain signal at 2 kHz, (d) frequency domain signal at 2 kHz.
Results of using a laser light source as input
In Figure 3, the part in the dotted box is directly replaced by a laser light source with a central wavelength of 1550 nm. That is to say, a laser light source was directly used as the input of a PM-FLM from port 5. The other experimental conditions and methods are the same as the above experiment.
Figure 6(a) shows the time domain signal of a PM-FLM using a laser light source as input when the vibration exciter produced a 20 Hz sinusoidal signal. We observe from Figure 6(a) that the time domain signal was a standard 20 Hz sinusoidal wave, which agrees well with the vibration source. Because the time domain signal has almost no noises, the frequency domain signal in Figure 6(b) is directly converted from Figure 6(a) via the FFT algorithm without FFT filter. The frequency in Figure 6(b) is 20 Hz, which agrees well with the vibration source frequency. The voltage amplitude in Figure 6(b) is 0.30322 V. In the same way, the time and frequency domain signals of a PM-FLM using a laser light source as input at 2 kHz are shown in Figure 6(c) and (d), respectively. The frequency and amplitude are 2 kHz and 0.00508 V, respectively.
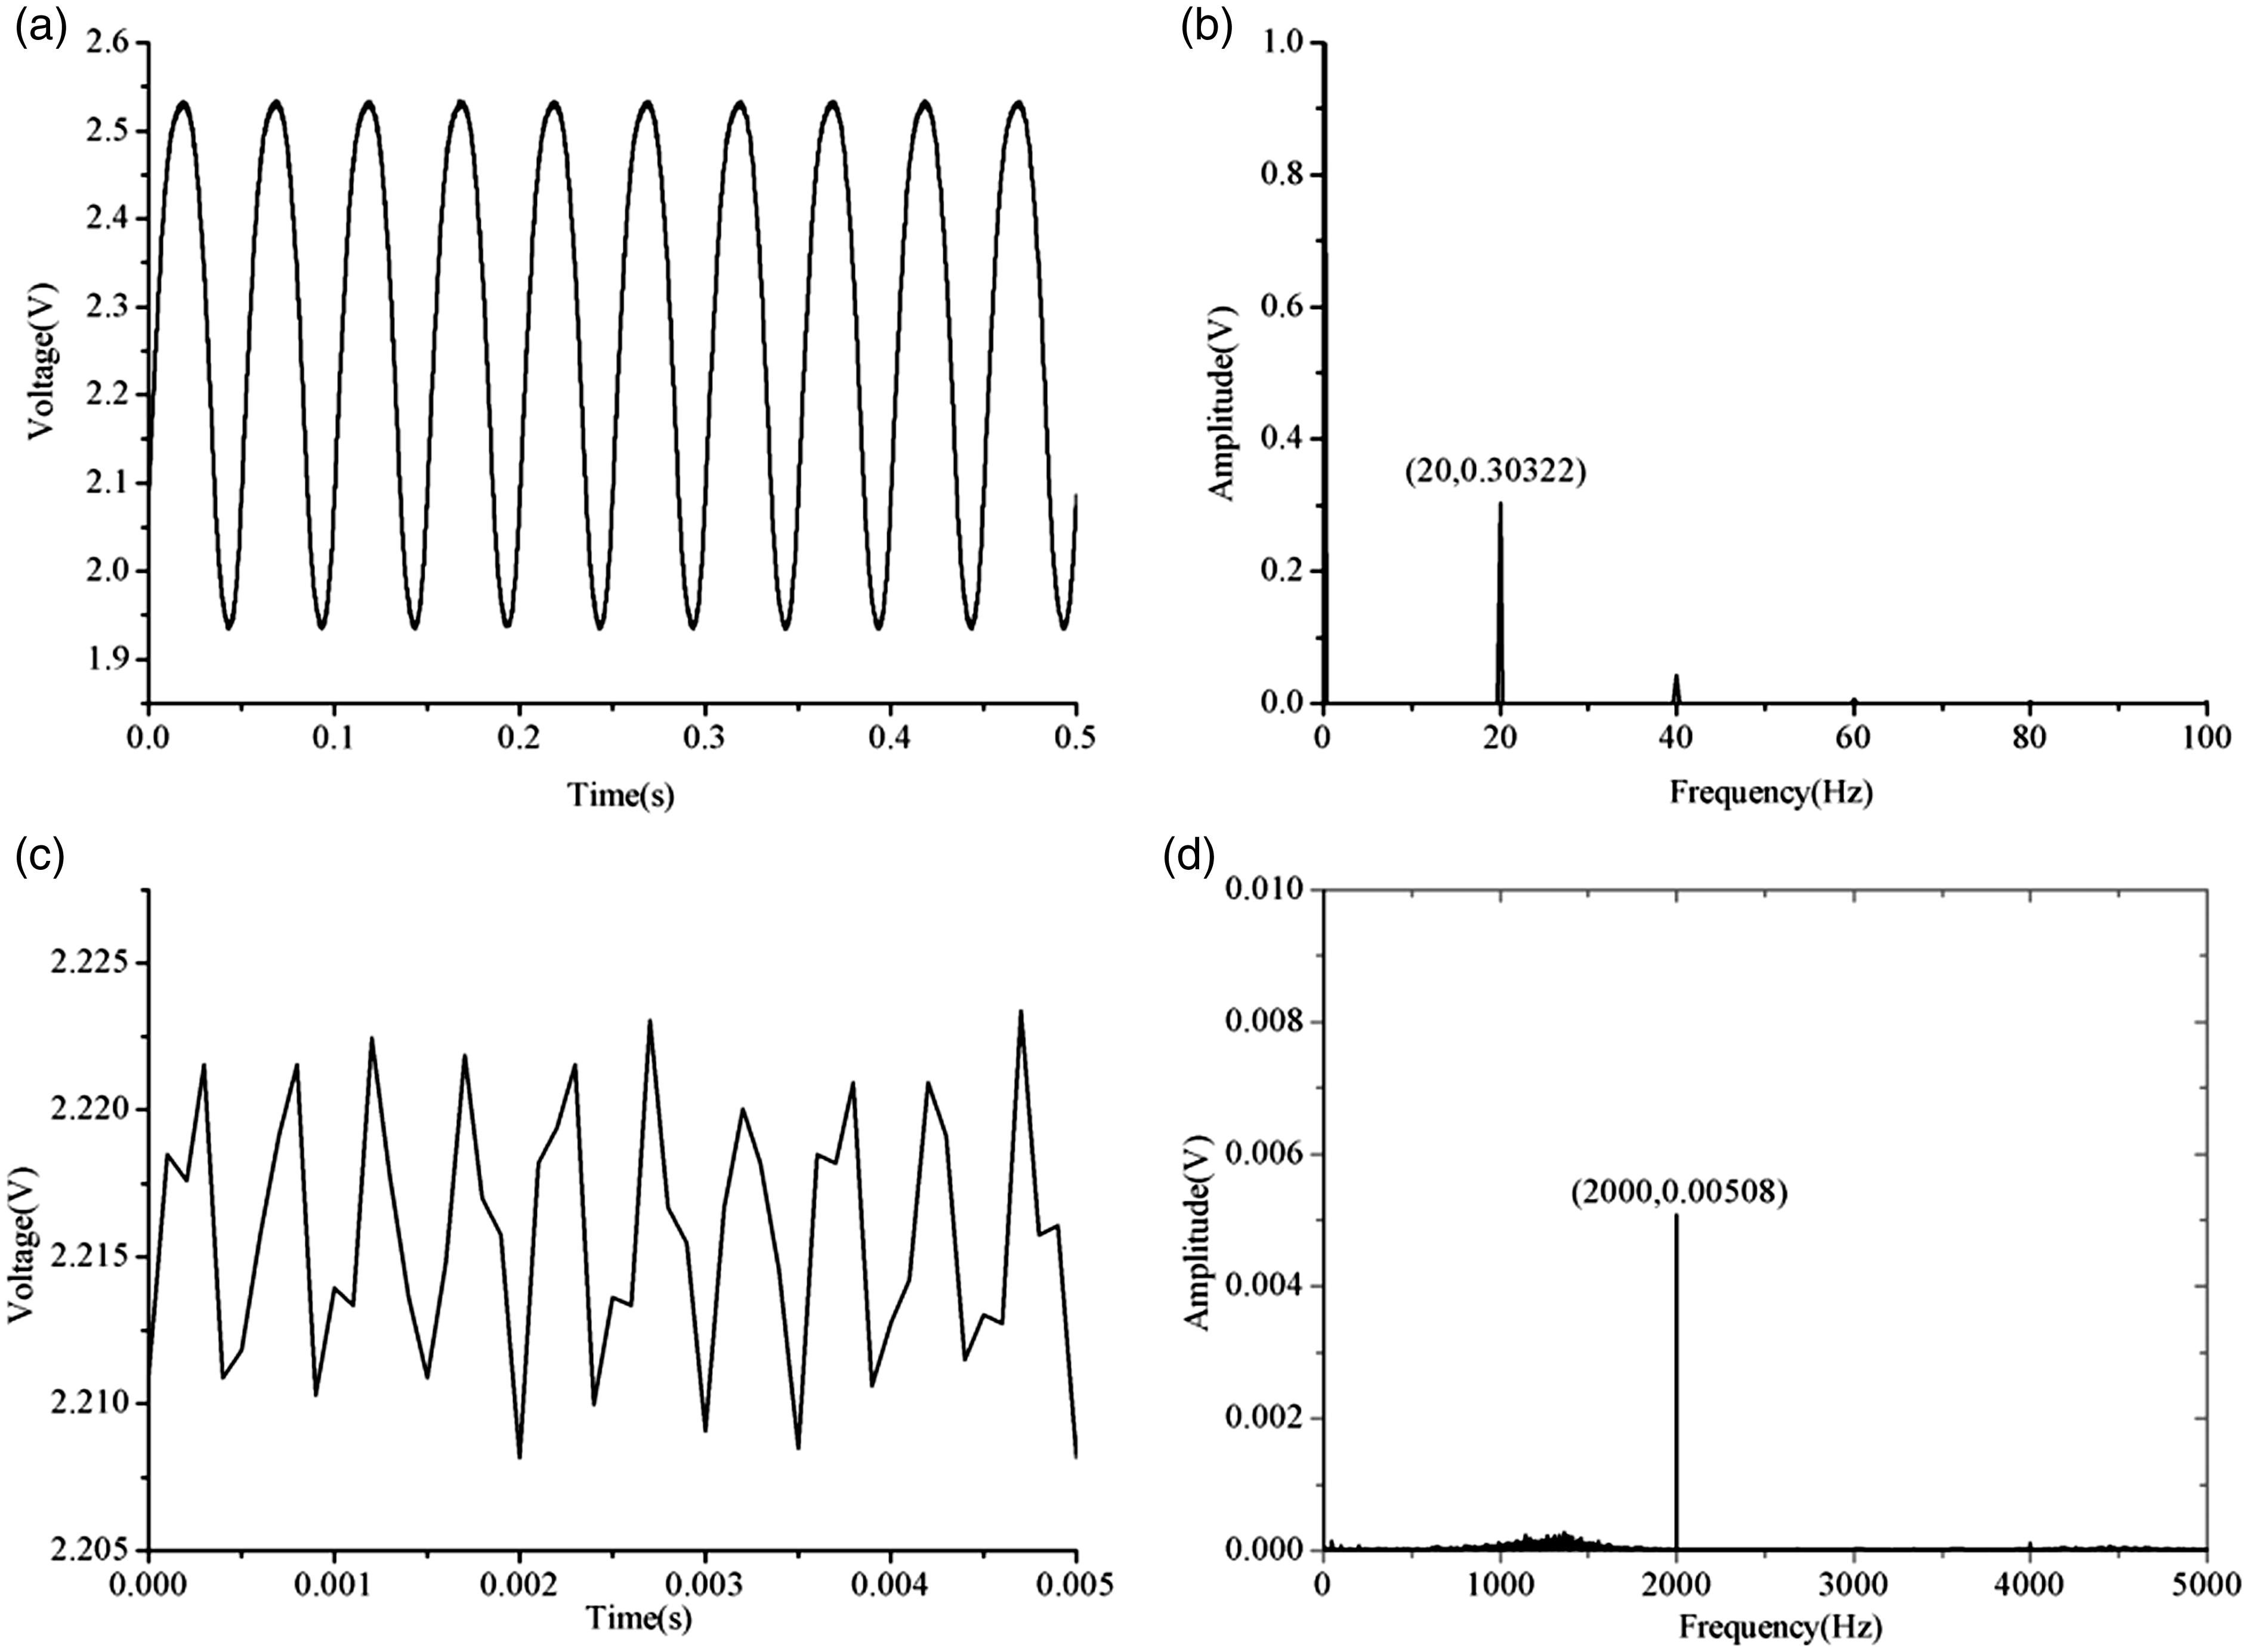
Time and frequency domain signals using a laser light source as input: (a) time domain signal at 20 Hz, (b) frequency domain signal at 20 Hz, (c) time domain signal at 2 kHz, and (d) frequency domain signal at 2 kHz.
Discussions
When the vibration exciter produced a 20 Hz sinusoidal signal, the PM-FLM sensors using two types of different light source as input can measure the vibration signal correctly. The time domain signal of a PM-FLM using a narrow-band light source reflected from FBG as input contained large noises, however, the time domain signal of a PM-FLM using a laser light source as input is a smooth sinusoidal signal. The Signal Noise Ratio of the latter is larger than the former. This proves that the latter has a larger voltage signals on the condition of the same experimental systems and methods. We also observed from Figures 5(b) and 6(b) that the voltage amplitudes are 0.00598 V and 0.30322 V, respectively. The sensitivity of the latter is ∼51 times as large as that of the former at 20 Hz. The sensitivity of the latter is significantly larger than the one of the former at 20 Hz. When the vibration exciter produced a 2 kHz sinusoidal signal, the PM-FLM sensor using a laser light source as input can still measure the vibration signal correctly. However, the PM-FLM sensor using a narrow-band light source reflected from FBG as input cannot correctly measure the vibration signal. All these prove that the PM-FLM using a laser light source as input has a higher sensitivity than the one using a narrow-band light source reflected from FBG as input.
The spectra of a laser light source and a narrow-band light source reflected from FBG are shown in Figures 7 and 8, respectively. They are both narrow-band light sources. It is obvious that the light power of the laser light source is larger than that of the narrow-band light source reflected from FBG at ∼1550 nm. According to the voltage demodulation principle, the sensitivity of the PM-FLM using the laser light source as input is larger than the one using the narrow-band light source reflected from FBG as input. The experimental result agrees well with the theoretical result.
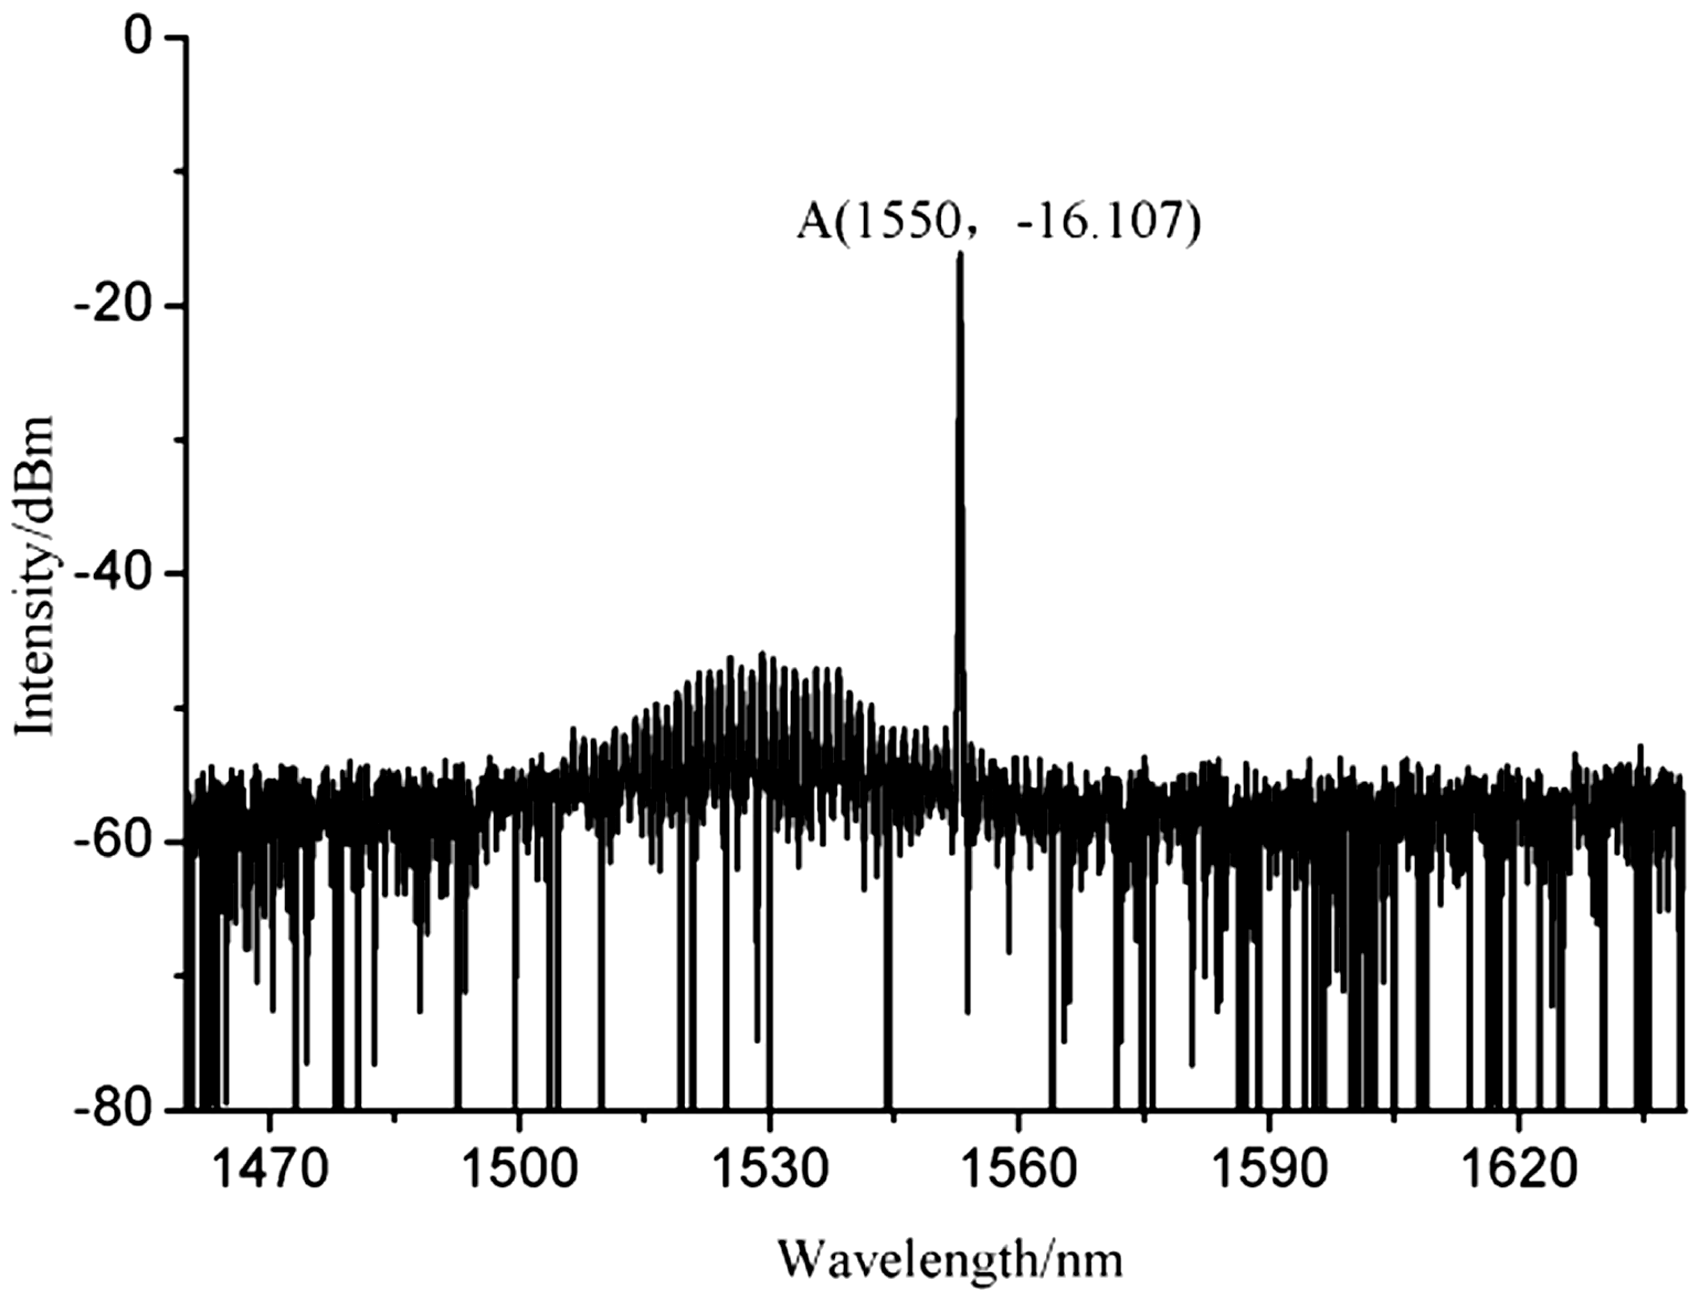
A laser light source.
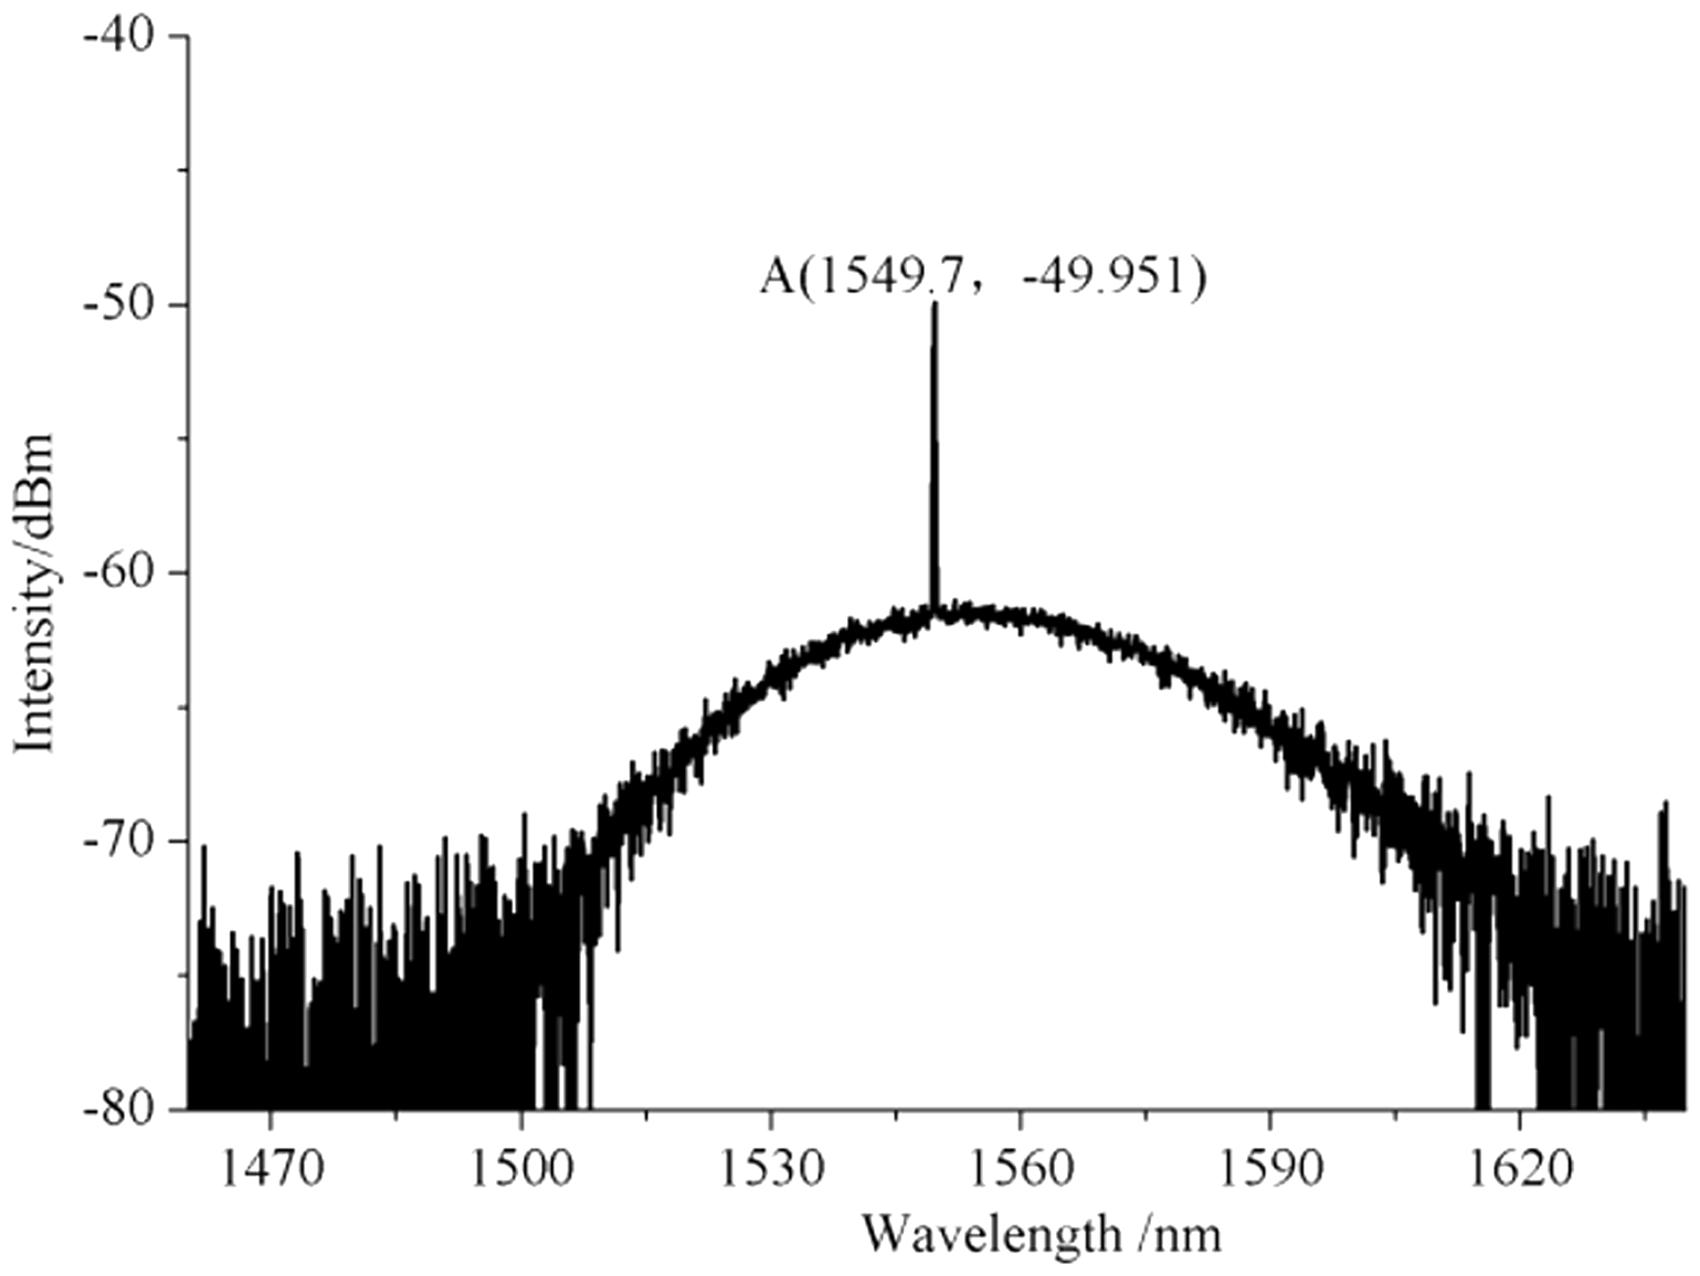
A narrow-band light source reflected from FBG.
The PMF is sensitive to temperature, and the experiments in this work were carried out at room temperature. The polarization maintaining photonic crystal fiber (PM-PCF) was used in the impact detection at different temperature and was found it is insensitive to temperature. 21 If the ambient temperature changes greatly, the PM-PCF may be used instead of the PMF due to its insensitive to temperature.
Conclusions
In this work, we first studied the voltage demodulation principle and explored the influence of light source on the sensitivity. Then we demonstrated the sensitivity of a PM-FLM vibration sensor using two types of different input light source on the condition of the same experimental systems and methods. The experimental result agrees well with the theoretical result. The result shows that a PM-FLM sensor using a high-power narrow-band light source as input has a higher sensitivity to vibration than the one using a low-power narrow-band light source. So we can improve the sensitivity by enhancing the input light source power. The method has the advantages of simple structure, easy implementation.
Footnotes
Declaration of conflicting interests
The author(s) declared no potential conflicts of interest with respect to the research, authorship, and/or publication of this Article.
Funding
The author(s) disclosed receipt of the following financial support for the research, authorship, and/or publication of this article: This research work was supported by the National Natural Science Foundation of China (Grant Numbers 51505231 and 51405223), and Postgraduate Research & Practice Innovation Program of Jiangsu Province (Grant Number KYCX18_0996).