
Abstract
The goal of this study is to develop an internet of vehicles system with augmented reality technology. The system deals mainly with three subjects, namely, lane departure warning, forward collision detection and warning, and internet of vehicles. First, to deal with the subject of lane departure warning, the Hough transform is used in this study to extract the possible positions of lane lines from the region of interest of an image. The Kalman filter is further employed to remove noises and estimate the actual positions of car lane lines. The lane departure decision is then used to determine whether a lane departure situation occurs. Second, the Sobel edge detector and taillight detection method are used to locate the hypothetical region of the vehicle. The characteristic parameters within the hypothetical region can also be obtained through the Harris corner detection method. To verify the hypothetical region and identify the vehicle, the support vector machine algorithm is used. The collision decision is then applied to determine whether the distance between two vehicles is short, thus fulfilling the goal of forward collision detection and warning. In addition, a secure and easy-to-use internet of vehicles is achieved with the use of the Rivest–Shamir–Adleman encryption algorithm, which uses public and secret keys to encrypt and decrypt messages to achieve the task of user identification. Upon obtaining control of the vehicle, the driver has full access to the most up-to-date information provided by the driver assistance system. Finally, internet of vehicles applications incorporating the previously mentioned methods, smart glasses, and augmented reality are implemented in this study. Smart glasses provide the drivers easy access to information about the vehicle and warnings, which helps enhance driver convenience and safety considerably.
Keywords
Introduction
In recent years, industrial giants, such as Facebook, Microsoft, Samsung, and Google, have launched a new revolution in visual technology. In 2016, the major bright spot is the expansion of the augmented and virtual realities of science and technology. The numbers of participants using devices and the developers of software in this revolution are also increasing. Augmented reality (AR) is the combination of computer and real-world information; thus, users can obtain relevant information at the right place and time. Virtual reality (VR) is the ideal artificial environment on a computer wherein a virtual environment is created in a seemingly real or physical manner. In the VR, the operator can interact with the controller in the virtual environment. Meanwhile, in the AR, the operator can interact with the real environment and expand information. Until now, AR and VR still lack the immersive feeling, but developers are not bothered by this as the purpose of AR and VR is to provide information.
The intelligent transportation system (ITS) 1 coordinates and integrates advanced electronic, computer, communication, and control technologies into the transportation system. The reliability and characteristics of the system have been tested in various areas at different levels, enhancing its safety and efficiency in instantly and neatly solving the problems often encountered in traffic. The ITS can be subdivided into five directions, namely, advanced traffic management system, advanced traveler information system, advanced vehicle control and safety system (AVCSS), advance public transportation system, and commercial vehicle operation. This study takes the AVCSS as an example, where the system covers the lane departure warning system and front-mounted detector of the anti-collision warning system, which is called the advanced driver assistance system (ADAS), as shown in Figure 1.
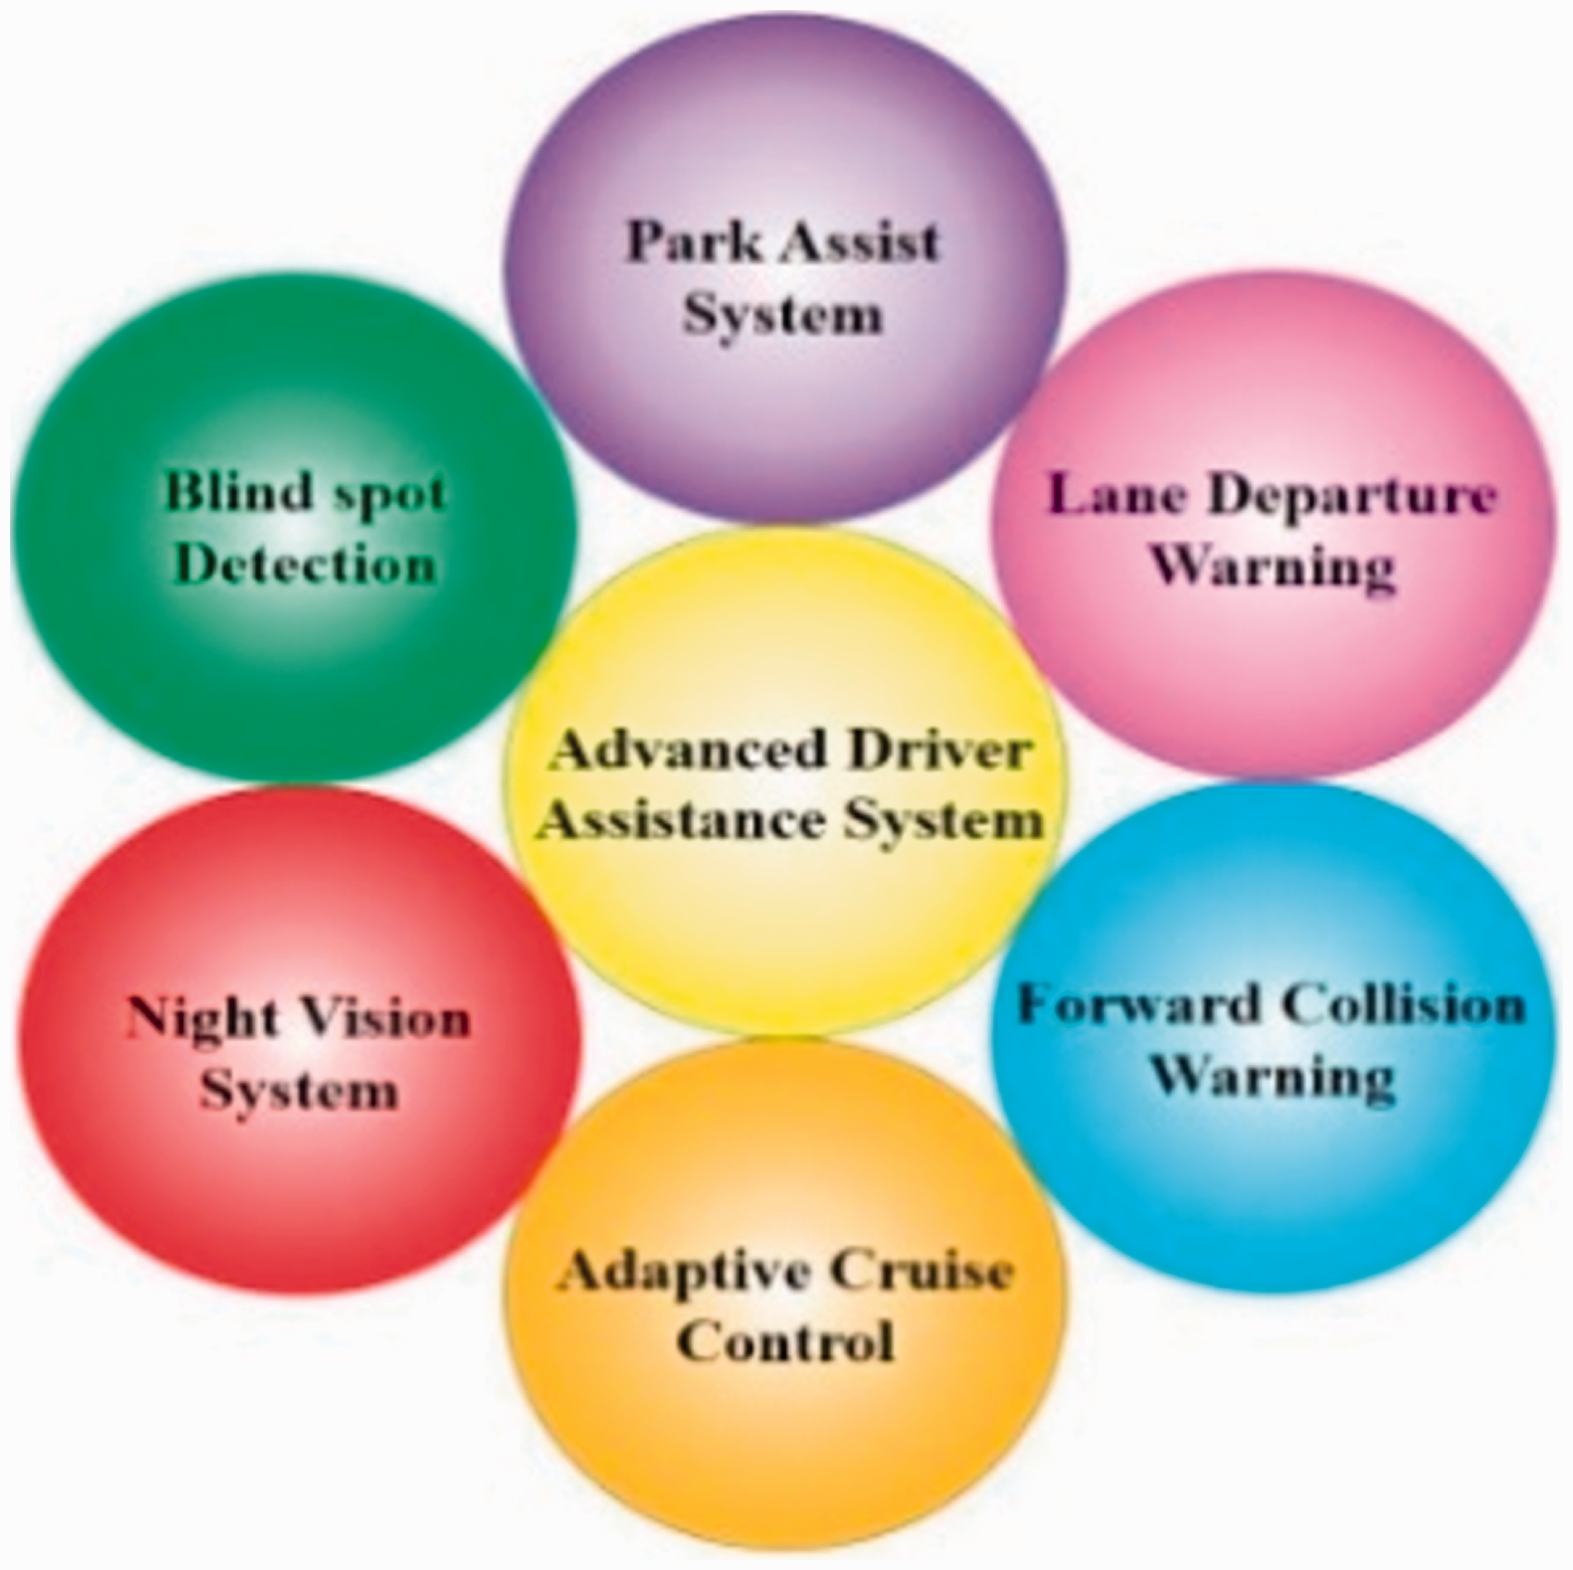
Advanced driver assistance system.
The lane departure warning is an important function of the ADAS. This study uses a camera to capture the driving image and sets the image region of interest (ROI). The edge detection method determines the ROI and edge characteristics or uses scan lines to scan the lane line characteristics within the set ROI range to avoid driving in an offset lane situation under unconscious conditions. The lane line can be divided into two types, namely, straight line2,3 and curve, 4 indicating that the lane line can use the left and right lane information to determine whether the vehicle may or may not offset to issue a warning.
For the front vehicle detection system, a previous study 5 collected and classified the vehicle detection system based on image processing over the years and proposed the framework for the vehicle detection system. Since then, many studies have been conducted on the basis of this framework. Front vehicle detection can be divided into two phases, namely, hypothesis generation (HG) and hypothesis verification (HV). HG is used to identify the possible target vehicle, whereas HV is used to verify the correctness of the target. Two methods summarized in the literature, namely, template-based and appearance-based prediction methods, are also used. The template-based prediction method6,7 is used for vehicles with obvious characteristics, such as the clear horizontal and vertical edges of the vehicle, the shadow at the bottom of the vehicle, and the U-shaped features formed between bottom and rear of the vehicle. This method has the advantages of quick detection of the target and low computation amount; however, it is susceptible to interference from surrounding environment and obstacles. The appearance-based prediction method8–10 involves learning through a machine to determine whether the front vehicle is in hypothetical area. This method trains a classifier with a large number of training materials. The training materials contain positive samples for vehicle images and negative samples for non-vehicle images.
In recent years, as the Internet of things (IoT) has just started to develop its communication transmission security and identity authentication, it has become an easy target for hacking because of its simplicity as compared with the ordinary computer. Therefore, to prevent this situation, this study also utilized the Rivest–Shamir–Adleman (RSA) encryption algorithm. 11 In this application, before the owner gets into his/her car and receives vehicle information, he/she needs to scan the vehicle identification (ID). Then, the RSA encryption and decryption methods will pair the control command. After successful matching, the owner can obtain full authority to control the vehicle.
System structure
The system architecture can be divided into three main parts, namely, lane detection collision prevention warning, front vehicle detection anti-collision warning, and onboard Internet of Vehicles (IoV). Figure 2 shows the flowchart of the use of smart glasses in the onboard IoV system to scan the vehicle’s ID and identify the owner. When the owner has been identified, the owner can log in to the server, use different vehicle functions, such as lane departure detection warning system and front vehicle detection anti-collision warning system, and access the current vehicle’s information.
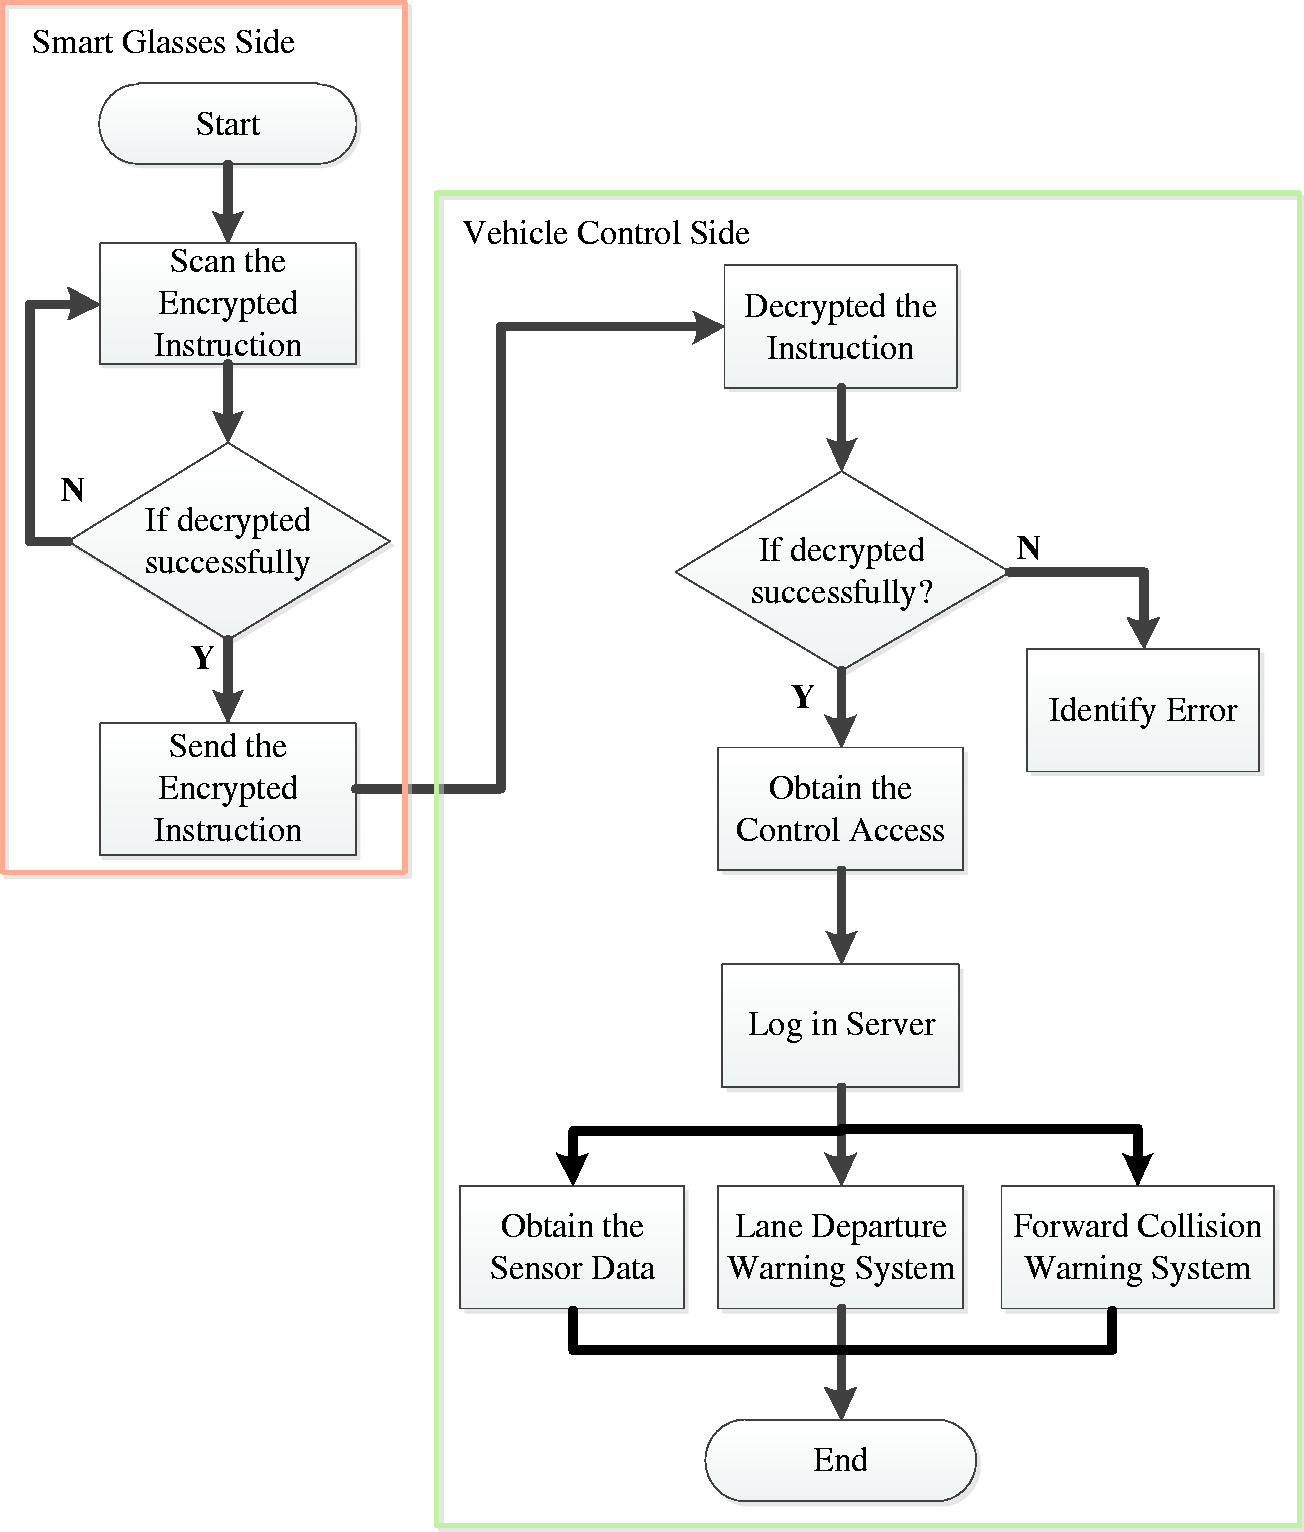
System architecture.
Lane departure detection warning
In the beginning of this study, the range of the search route, which is either the full screen or the local picture of interest, is set and the information on the color space in the ROI is transformed into HSV from RGB through grayscale image processing. After grayscale image processing, the edge detection method, which can reduce the computational complexity, is used to determine the characteristics of the lane line. However, in this study, after determining the characteristics of the lane line, Hough transform is used to identify the starting point of the left and right lane lines. After recording these two points, the information of these coordinates is inputted into the Kalman filter12–14 to conduct the test to determine the actual lane line position. Finally, the lane departure decision is used in this study to determine whether the vehicle is offset or not. The lane line offset warning process is shown in Figure 3.
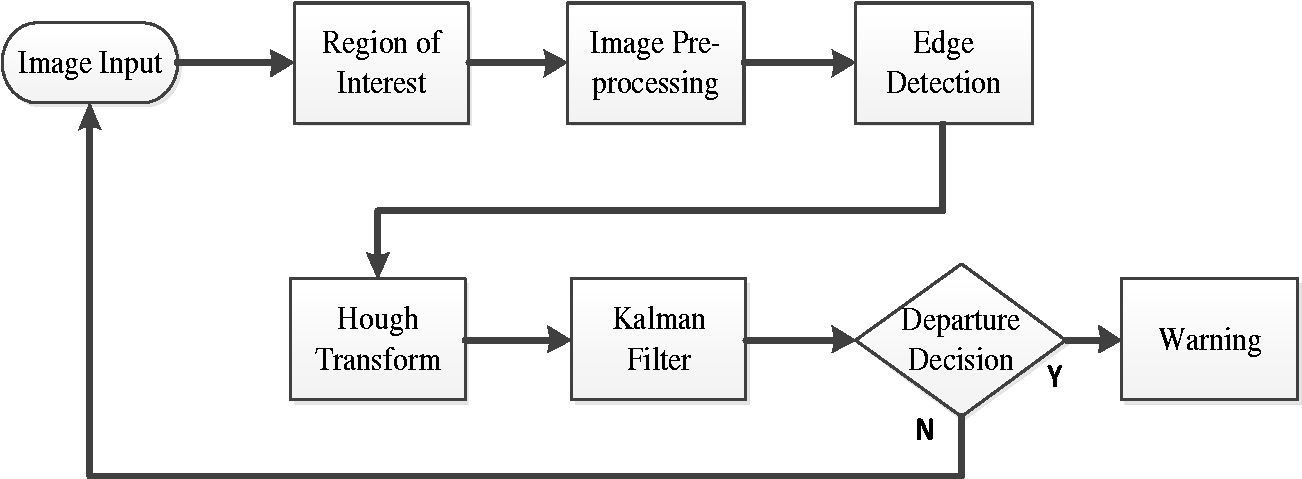
Lane departure warning flow chart.
Region of interest and conversion of color space
The purpose of defining the image region of interest (ROI) is to reduce the amount of system operations and improve the efficiency of lane detection. In this paper, the horizon in the input image is used as the upper boundary of the ROI because the area above the horizon is the sky which represents the non-road region. In reality, the vehicles will not appear here. The lower boundary is measured for about five meters away from the vehicle in front. In addition to traffic congestion, under the normal driving condition, the vehicle in front will not appear in this area. At present, most of the images are using RGB color space. It is easily affected by the light source when the input image is RGB color space. Therefore, this paper has needed to convert RGB images to HSV color space when processing the images. In HSV color space, H (Hue) represents hue, S (Saturation) represents saturation, and V (Value) represents brightness. The HSV has separated the hue, saturation, and brightness which are the three information of the image. So, when processing the images, it will have better performance when there is interference with background noise. Any pixel in the RGB image corresponds to the Hp value of HSV [15], and its formula is as follows: (1):
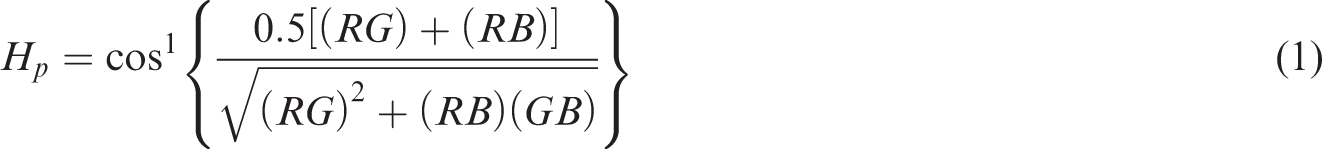


Then, the values of S and V in HSV are calculated by using equations (3) and (4), where Max is the maximum value of the three values of R, G, and B, while Min is the minimum value of the three values of R, G, and B. After obtaining the H, S, V values of the HSV color space, this paper used V (Brightness), which is the gray scale image, to perform the subsequent image processing. Thus, it can reduce the calculation of the image dimension and also improve the efficiency of the system operation.
Edge detection
In the general highway driving screen, the difference between left and right sides of the lane line in the image is approximately ±25°. Nevertheless, this study applies the oblique edge detection operator 16 at 45° and 135° to conduct the edge detection operation on the left and right of the image ROI. The edge detection operator is shown in Figure 4. Several advantages of the oblique edge operator are that the structure is simple and the two pixels in the mask can be subtracted to obtain the edge point, which saves time for image calculation. Figure 4(a) shows the detection result of the right lane line using the 45° edge operator, whereas Figure 4(b) shows the detection result of the left lane line using the 135° edge operator.
The detection results of left and right lane edge.
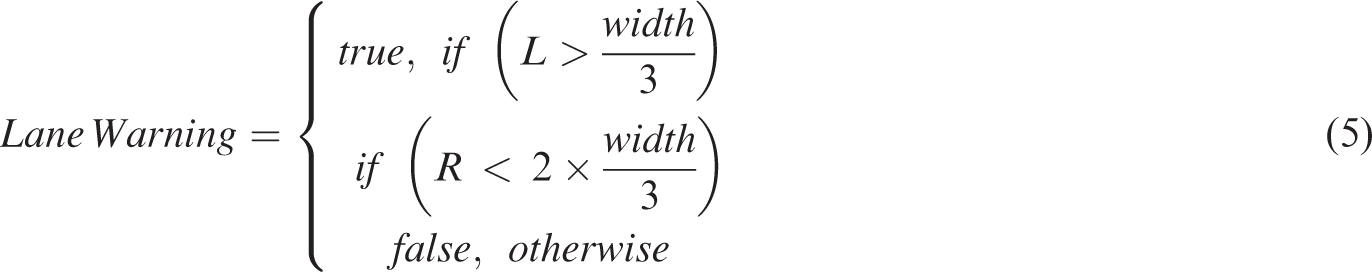
Lane departure decision
In the lane departure decision, this study ruled out the situation in which a signal light is used. When the vehicle is not going in a straight direction while on the road but continues to shift slowly toward the left or right, this action is considered an occurrence of lane departure. This situation will affect not only the rear vehicle’s driver but also the driver him/herself and even endanger life. In this study, the departure decision is expressed in equation (1),
16
where L is the starting point position of the left lane line, R is the starting point position of the right lane line, and width is the image width.
Front vehicle detection and crash warning
When the front vehicle is detected, the result of the vehicle traffic image taken in the third chapter and the detection of the lane line are taken as the inputs of vehicle crash warning. First, the ROI of the vehicle traffic image is detected vertically and horizontally and HG is conducted. Then, the support vector machine (SVM) is used to verify the HG part, so that the system automatically determines whether there is a vehicle in front or not. This step is called the HV. After detecting the vehicle in front, the collision prevention decision is made to determine whether there is a situation in which the vehicle is close. If such a situation occurs, then the system will issue a warning to remind the driver to maintain the appropriate driving distance. The front vehicle collision warning flowchart is presented in Figure 5.
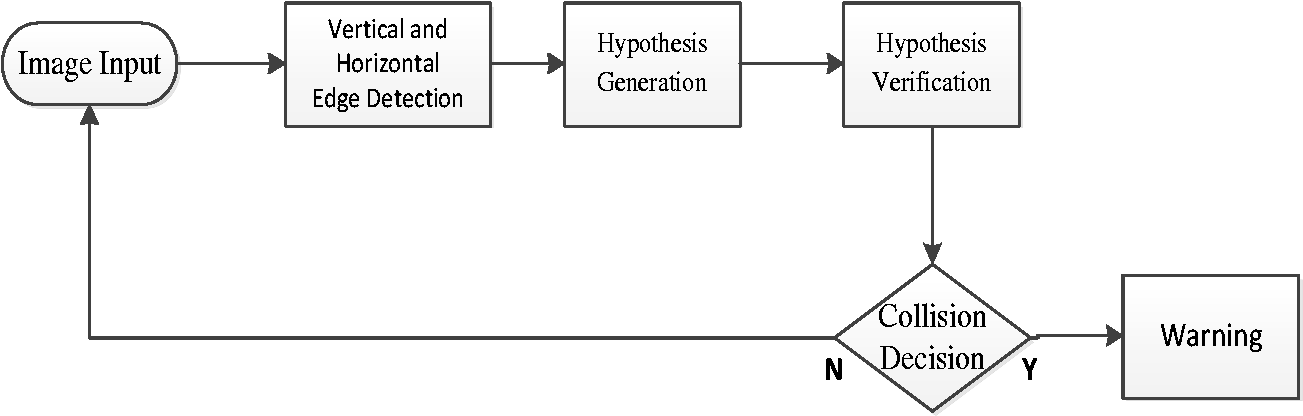
Forward collision warning flow chart.
Vanishing point detection and lane masks
In this paper, the lane line position coordinate and the slope of the straight line can be obtained through the calculation method presented in the previous chapter, i.e., Hough transform combined with the Kalman filter. Then, equation (6) is used to identify the intersection point of the two lines of infinite extension, which is also known as the vanishing point
16

Day foreground target capture
As the vehicle is a regular-shaped object, it has a strong edge characteristic when driving on the road. This study uses this feature as a basis for the detection of the front vehicle and location. In general, the rear of the vehicle has obvious horizontal and vertical characteristics. Thus, this study first uses the Sobel edge detection operator to obtain the gray contour image of the target contour. Then, Otsu’s threshold method (also called Otsu’s method)
17
is used to separate the target contour from the background to obtain the foreground goal. Sobel edge detection is used to enhance the horizontal and vertical characteristics, as expressed in equation (7)

Otsu’s method is an adaptive binary method. Although this method takes more time to calculate and generate statistics, this method has good adaptability. The appropriate threshold can be obtained on the basis of the changes in the brightness and image background. The aim is to separate the background from the foreground of the image to achieve the goal of our interest. Histogram statistical analysis is employed to assign the pixel with a value greater than the threshold as the foreground and the pixel with a value lesser than the threshold as the background. Then, the smallest variance of the foreground and background of the two groups is calculated and the two values are added to obtain the best threshold.
Pavement noise filtering
In this study, to eliminate the pavement noise, first, we observe the changes in the gray value of the pavement. After sampling the road image, we calculate the average grayscale value and use it as the threshold value of the binary image. Finally, we expand the binary image to highlight the high luminance region. The expansion operation used in this study is a method widely employed in morphology, which can remove noise from the image, reach the connection gap, and repair the function of the broken image. The purpose of using the expansion operation in capturing the daytime foreground target is not to connect or repair the broken image but to expand the high brightness area to achieve the purpose of removing pavement noise.
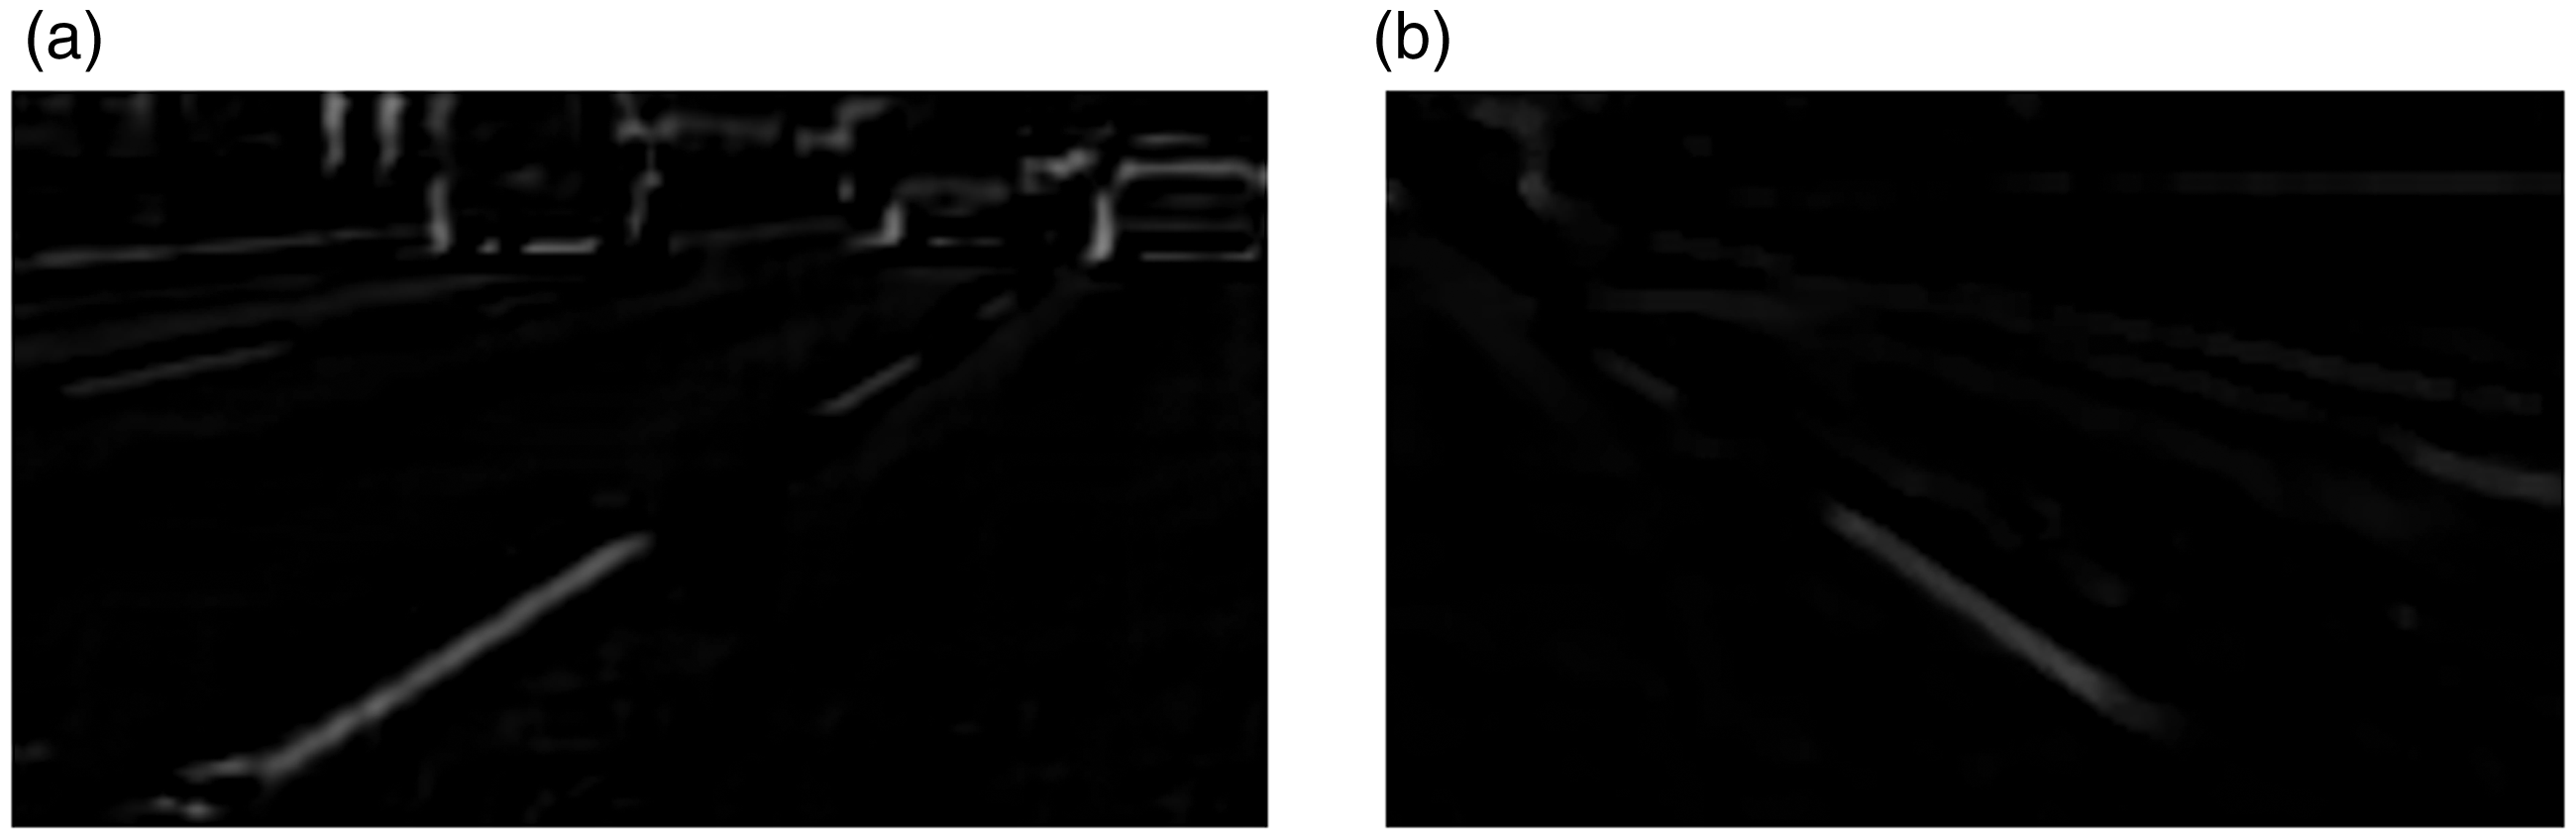
Finally, in this study, the images obtained using Otsu’s method and the expansion operation are subjected to conditional image subtraction processing, as presented in equation (8). Hence, the driver will be able to isolate the vehicle from the noise while on the road, thereby reducing the interference of the road area and ensuring that the obvious edge of the vehicle is easily detected. Figure 6 shows the results of the conditional subtraction operation of two images. As shown in the figure, the subtraction operation nearly filtered out the noise on the pavement and only left the features of contours of the vehicle tail.
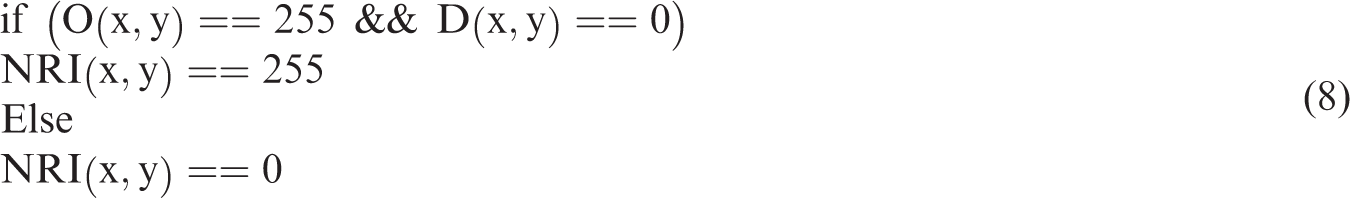
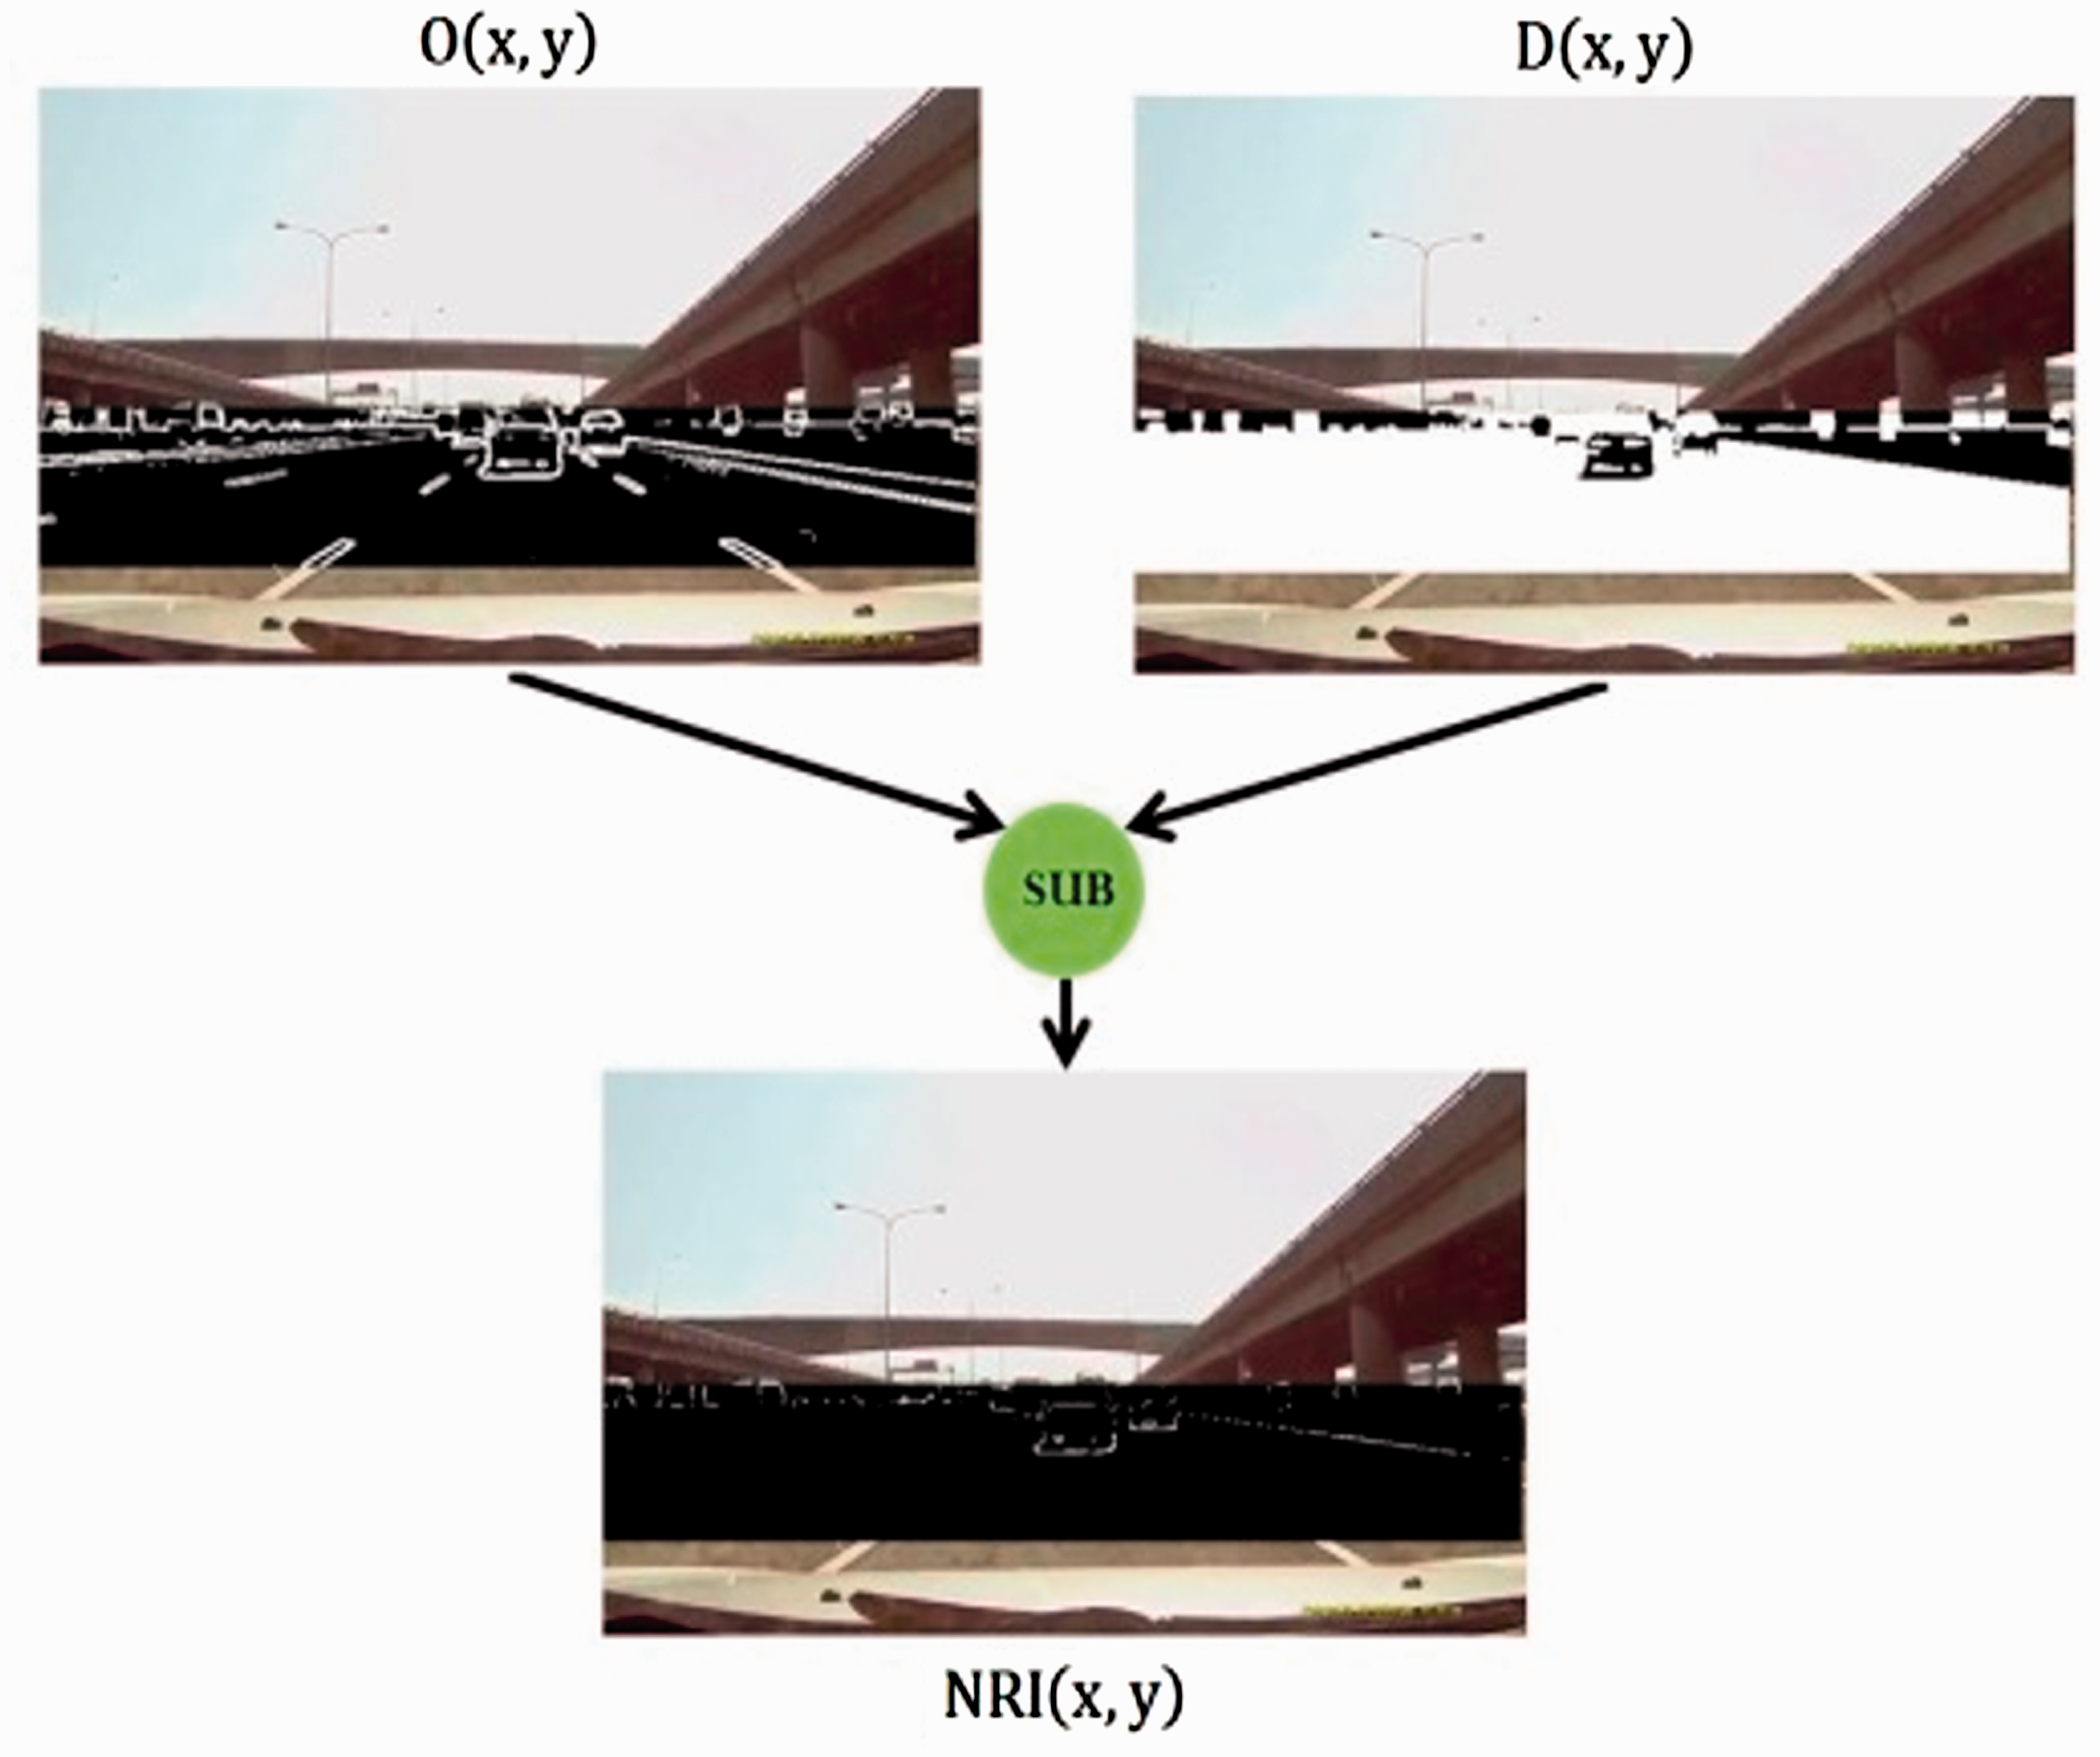
The result of lane noise is removed by Subtraction operation.
Finally, this study uses the AND operation for the lane mask image to remove the pavement noise and obtain the contours of the front vehicle in the lane, as shown in Figure 7.
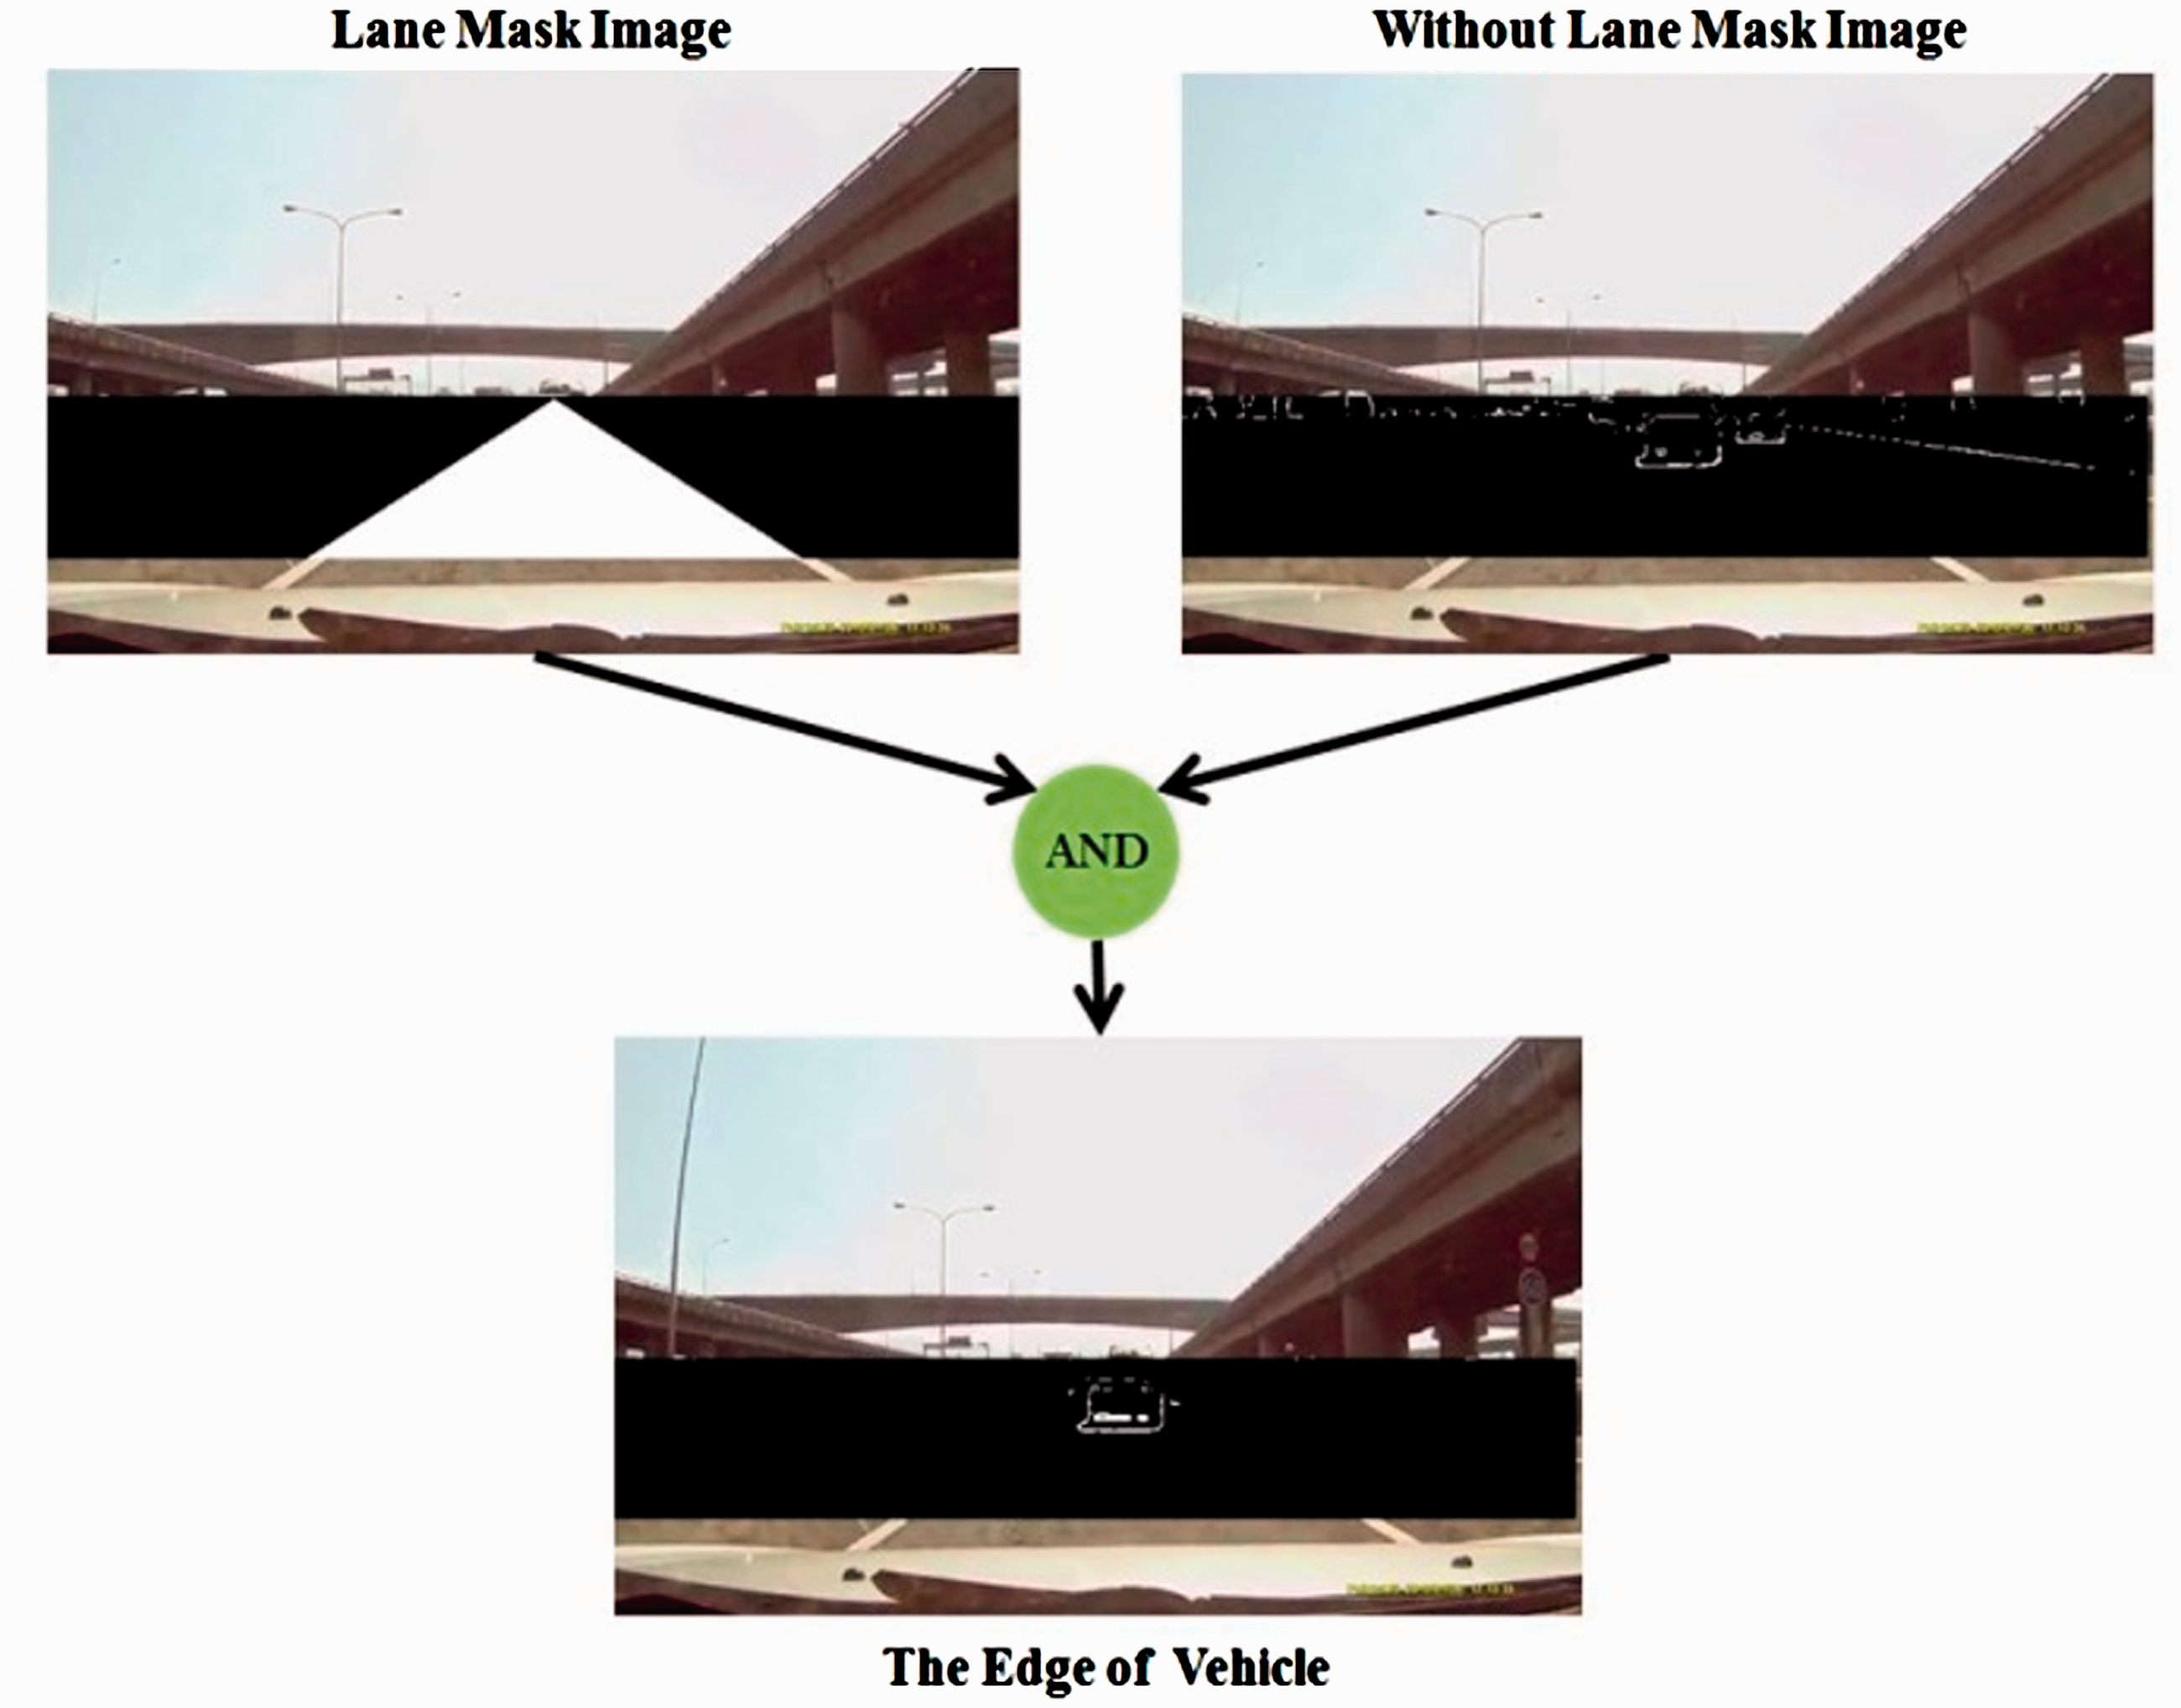
Using AND operation to obtain the forward vehicle edge contour.
Night foreground target capture
When the vehicle is traveling at night, the vehicle edge characteristics cannot be detected by the edge detection methods because the light is not as adequate as in the daytime. However, the most obvious vehicle characteristic at night is the rear light of the vehicle. Therefore, this study uses the method that can detect the rear light of the vehicle 17 to capture the foreground target. First of all, the method previously mentioned in Region of interest and conversion of color space section is used to establish the ROI image and change its RGB color space to the HSV color space. Then, the red rear lights and the rear light produced by the red halo are used to easily identify the characteristics and set the values for the three HSV components, so that only the red target is detected. Subsequently, the expansion and erosion treatments are applied to connect the broken foreground target and remove unnecessary noise. In this manner, the red light block can be detected. Finally, the detected car light’s block and the lane line generated by the lane masks are used to conduct the AND operation. The detection results of the lights are shown in Figure 8.
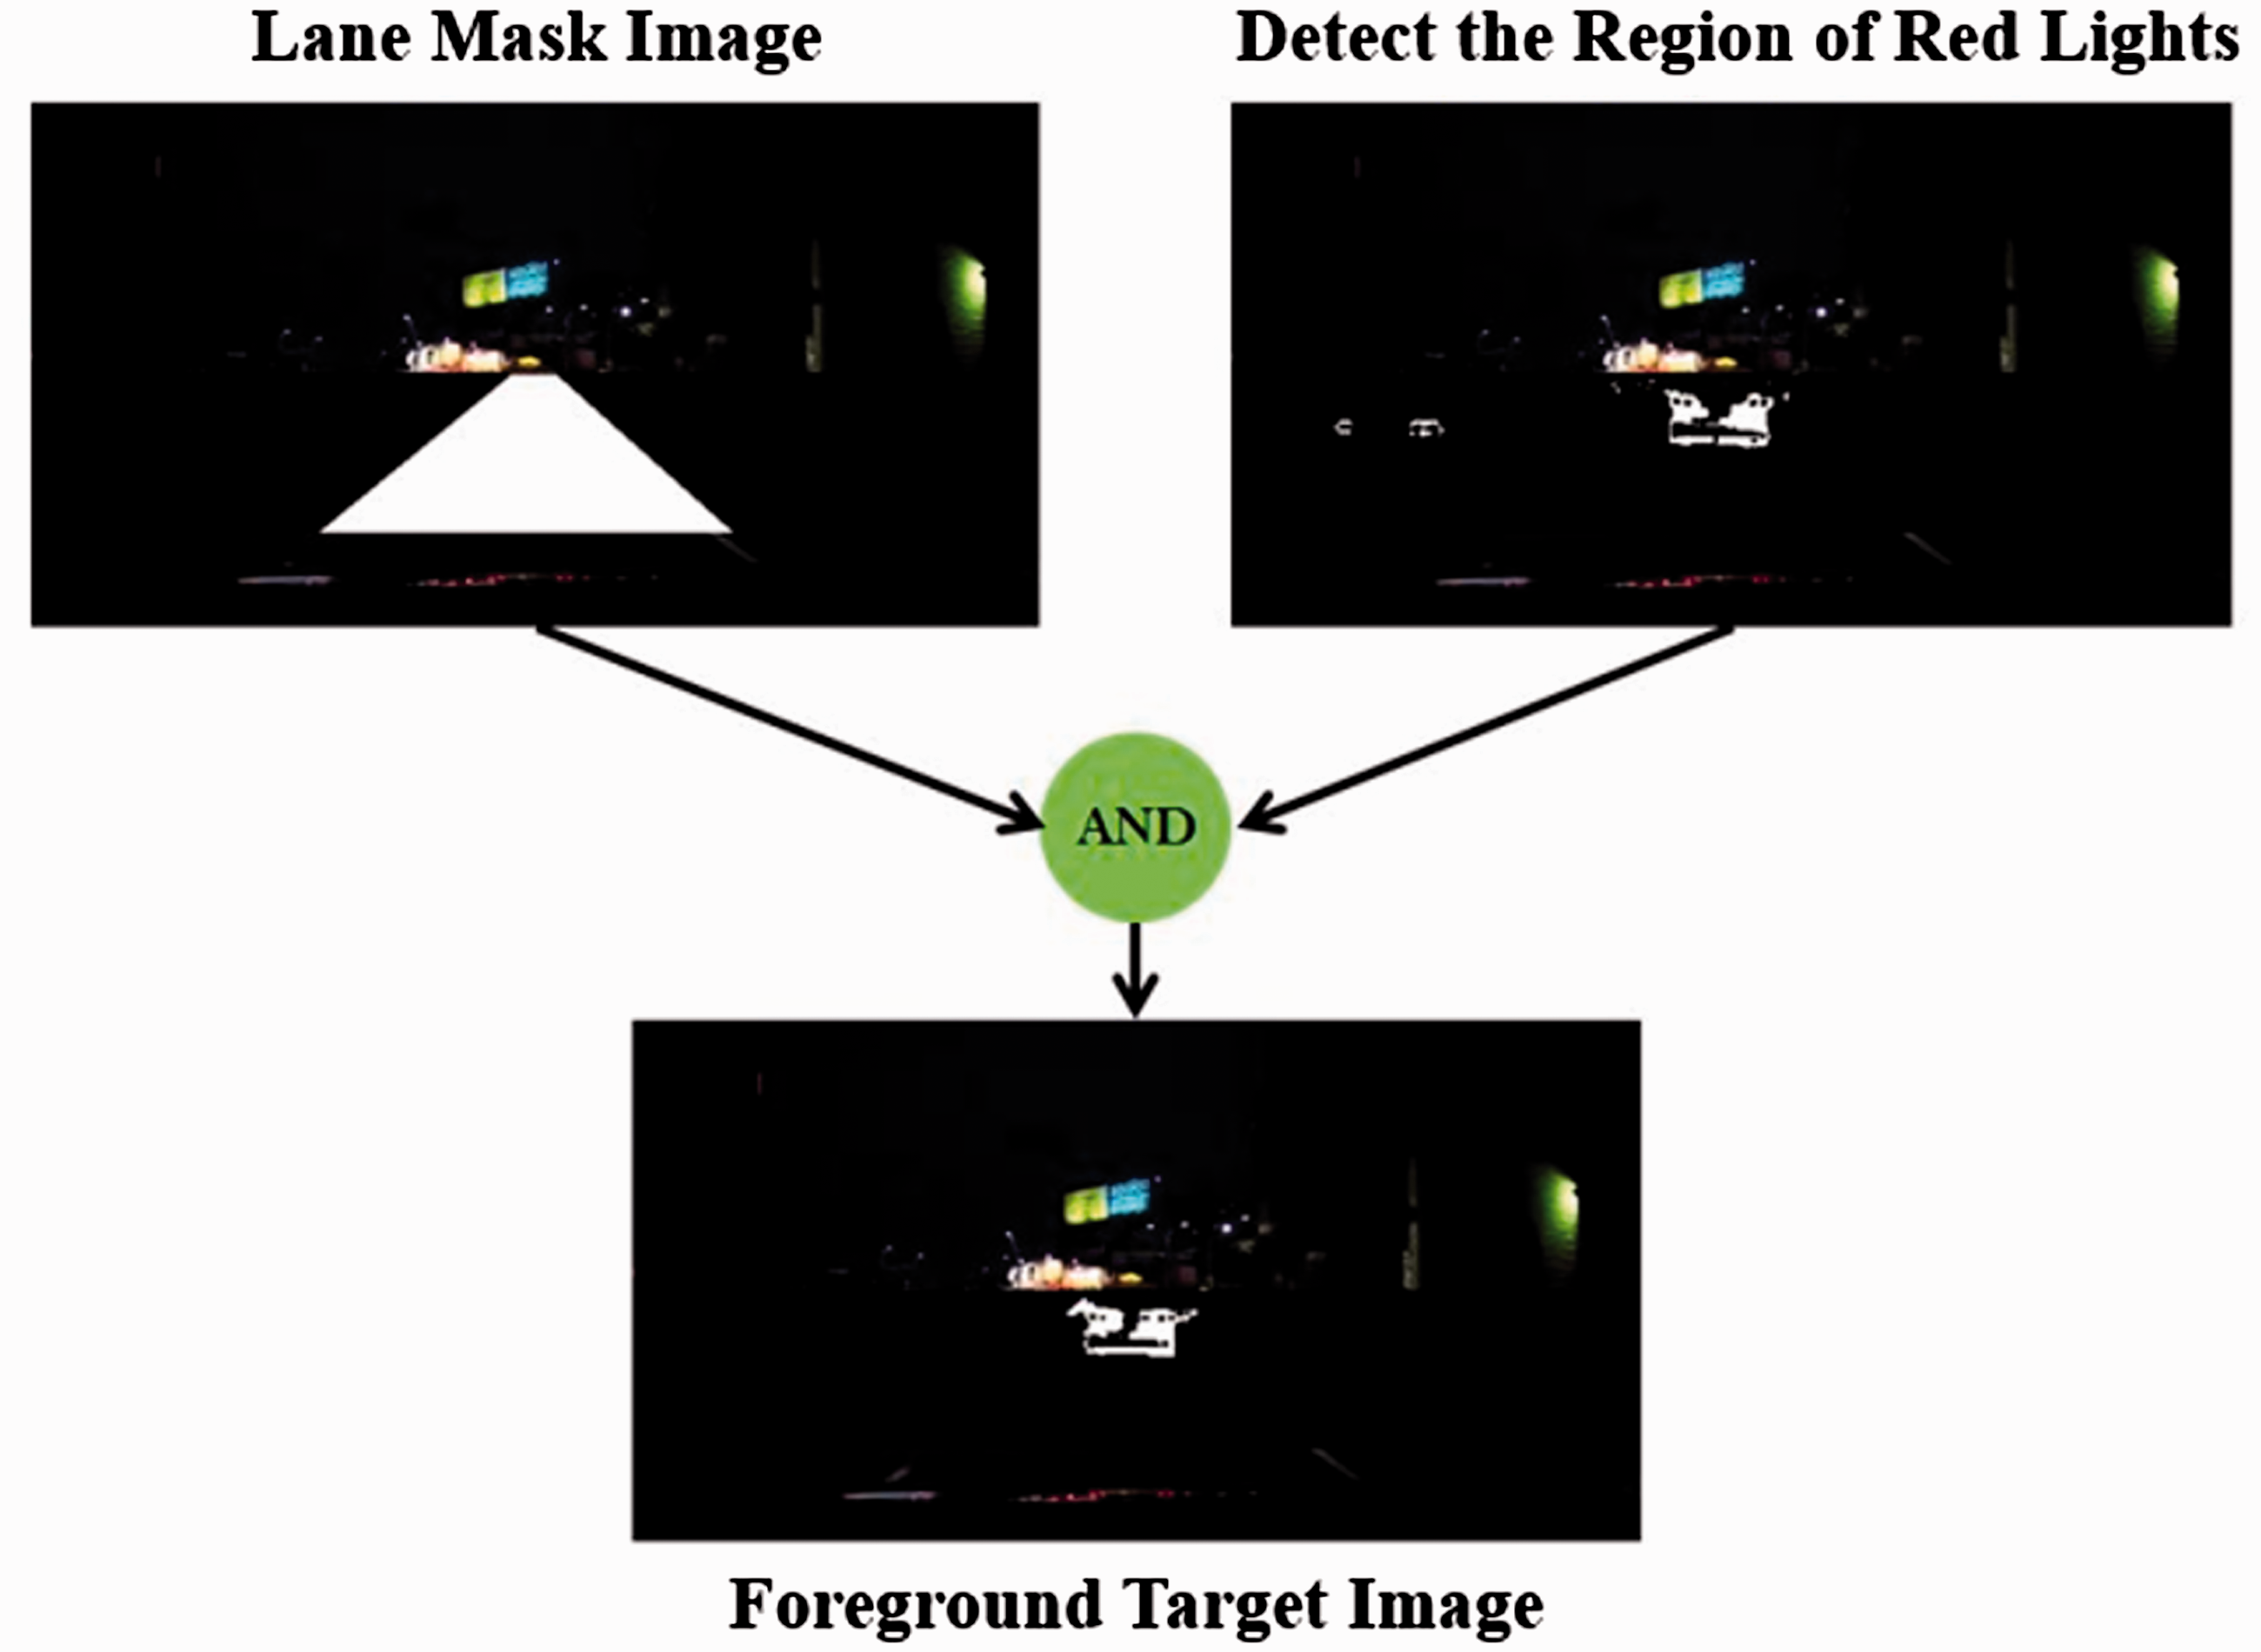
Fetch foreground target at night.
Extraction of vehicle edge feature
In this study, the edge of the image is scanned using the edge point scanning approach. 18 The scanned vertical edge point of the output image is shown in Figures 7 and 8. The scanning direction is from the center of the image to the left and right sides of the x-axis, as shown in Figure 9.
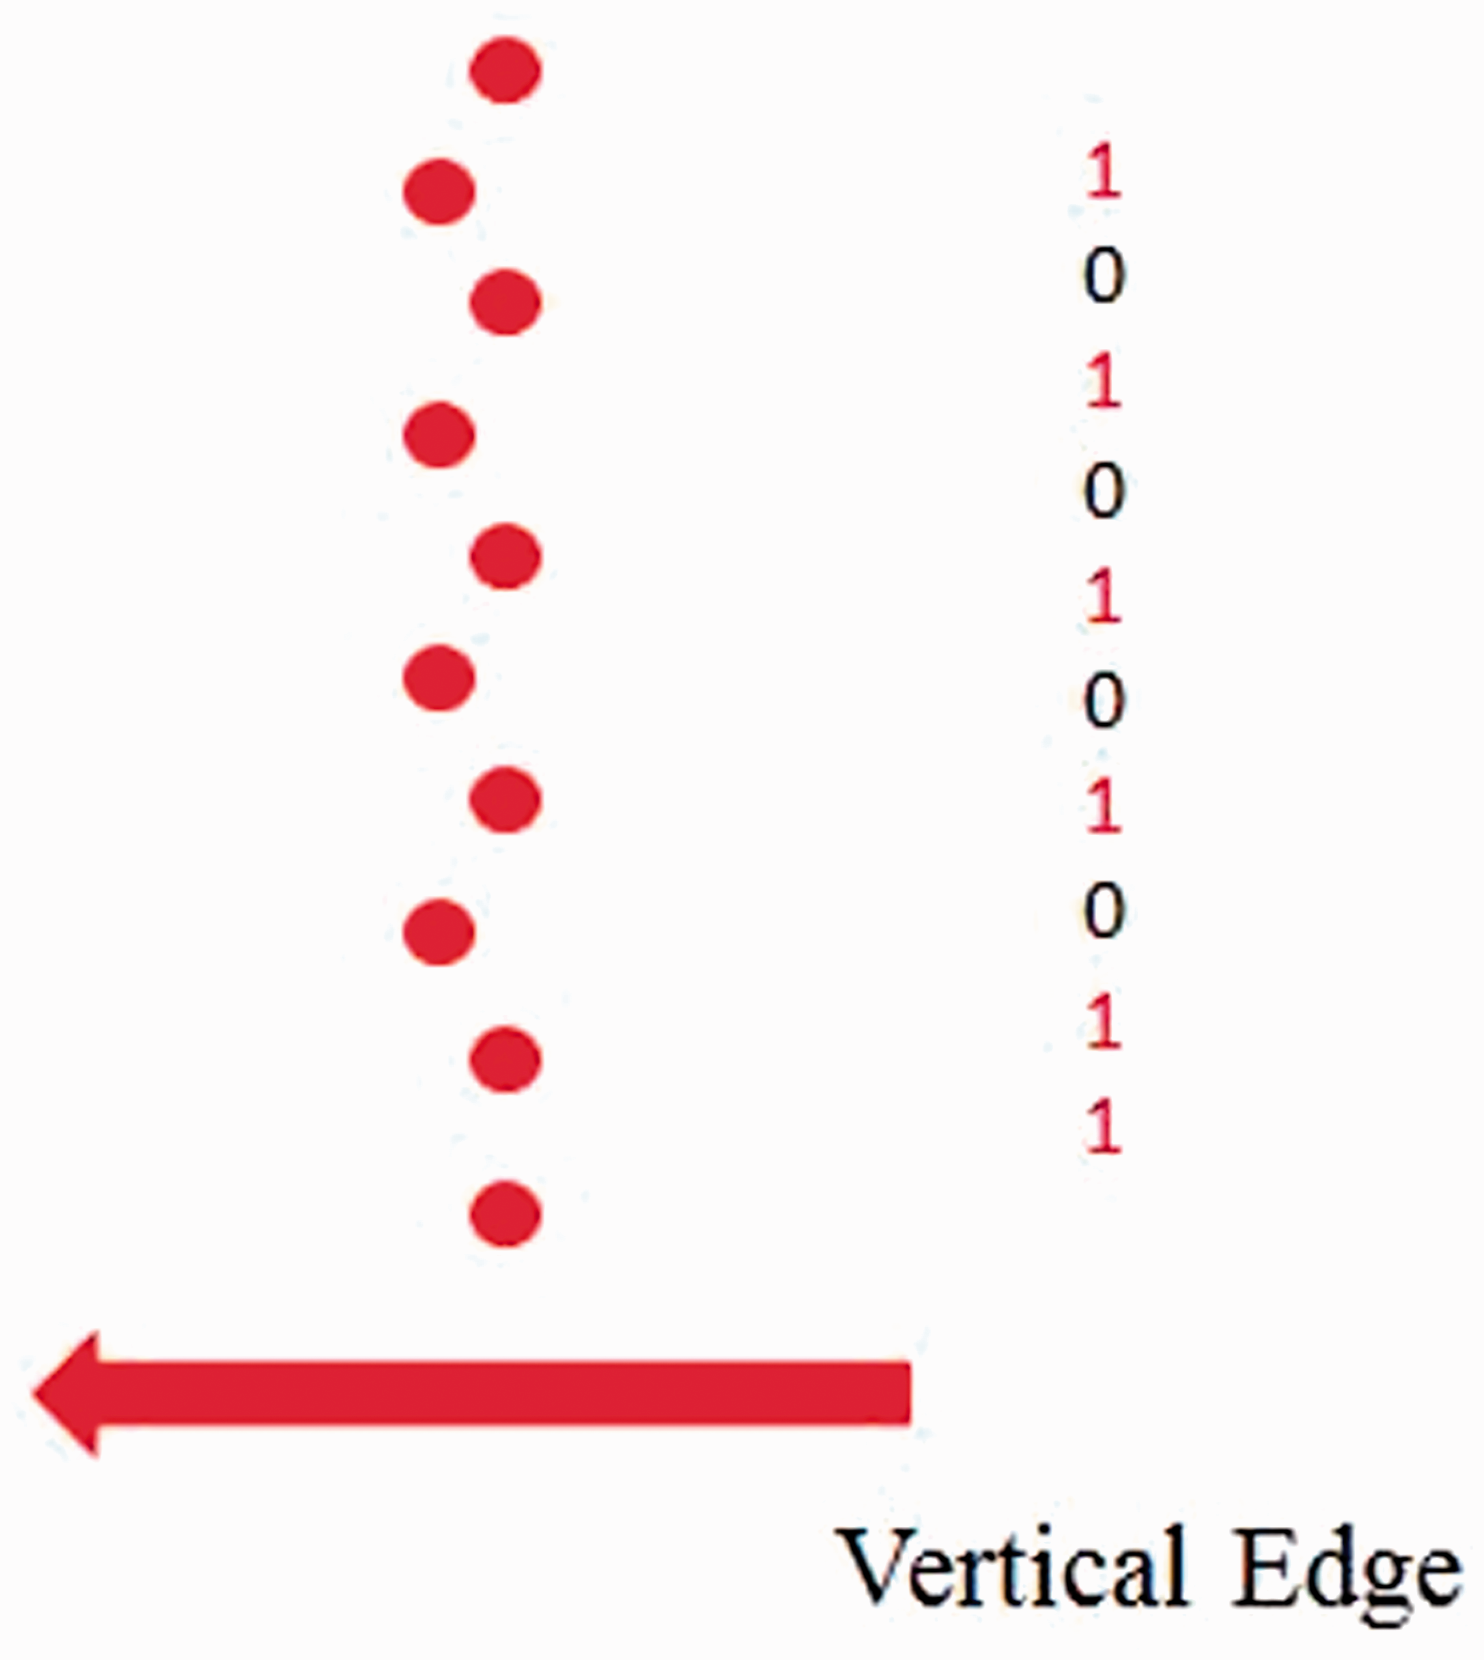
Scan the vehicle’s vertical edges.
First, a vertical array with an initial value of 0 is set and the red dot is assumed to be the vertical edge feature of the vehicle. When scanning toward the vertical edge feature, the initial vertical array value will change from 0 to 1. When the number of vertical arrays reaches a certain percentage, the value will change from 0 to 1. Then, the x-axis coordinates will be considered the edge of the vehicle. However, the effect is unsatisfactory when scanning the edge because of the environmental factor interference. Therefore, this study determined whether the width of the left and right sides of the vehicle is within the reasonable range or not. In this study, the national road lane is used as an example. The width of the vehicle is approximately 0.45–0.75 times the width of the lane. Thus, if the left and right vehicle edge points do not meet the limit, then no hypothetical judgment can be made. The reasonable width of the vehicle is determined using equations (9) and (10)


Hypothesis verification (HV)
Support vector machines (SVM)
The main idea of the SVM19–24 is to identify the best hyperplane on the basis of the eigenvalues of the classification in a data set composed of different categories. In this case, different data can be sorted and the distance between data edge hyperplanes can be maximized. The SVM can be divided into three categories, namely, linear separable, linear inseparable, and nonlinear. The linear separable SVM is analyzed for a linear system. For the linear inseparable and nonlinear SVM, the linear inseparable or nonlinear samples in the low dimensional space are raised to the high dimensional space to make it linearly separable, which allows the nonlinear system to be analyzed in the same manner as the linear system. This study uses the SVM as a classifier. After the SVM learns through machine learning, it will have the capability to identify the input and determine whether there is a vehicle at the hypothetical area or not. This study uses the radial basis function, which is also most commonly used in the SVM.
Front vehicle collision decision
In this study, the use of the hazardous area facilitates the general user to operate on a collision warning basis.
15
According to the result of front vehicle detection in the previous section, when close to the front vehicle, the bottom of the vehicle will be close to the bottom of the image below the screen. By contrast, when the distance of the front vehicle is far from the bottom of the screen, the position of the bottom edge is close. Therefore, through this feature, a determinant (11) has been established.
The system will issue a warning when the bottom position of the current vehicle is in a hazardous area, where
Internet of things information security RSA
The RSA cryptographic algorithm is a public key encryption system published by Professors Rivest, Shamir, and Adleman from the Massachusetts Institute of Technology in 1978, whose system is based on factorization as a basis for the design of a set of encryption systems. The RSA encryption algorithm for the main encryption and decryption is expressed in equations (12) and (13)
1.Arbitrarily selected prime numbers


where 2.Calculate Euler’s Totient
22

where 3.Randomly find an integer E that satisfies the condition of 4.Finally get D from E and


According to the previously presented steps, the RSA algorithm can obtain a pair of keys, where the public key is (E,N) and the private key is (D,N). Either the sender or the receiver must know that the public key is (E,N). Meanwhile, the private key (D,N) can only be known by the receiver. After the completion of key pairing, only the data can be encrypted and decrypted.
Experimental results
The results of lane line detection through Hough transform
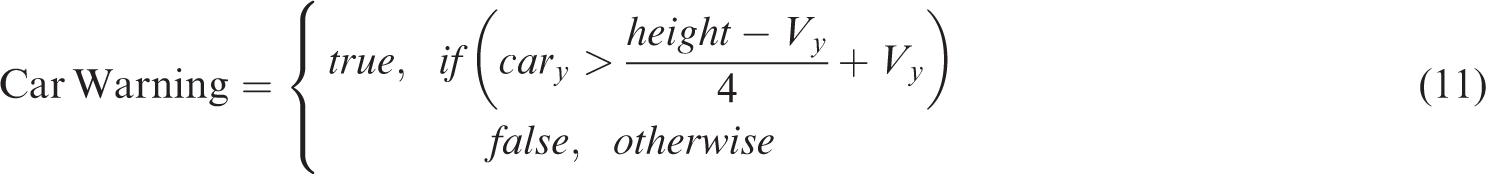
In this study, the lane line detection experiment can be divided into four different environments, namely, sunny, cloudy, rainy, and night. As shown in Figure 10, the Hough transform lane line detection only has good results in lane line detection on sunny days. The Hough transform is susceptible to environmental factors compared with other environments, which makes the detection results unsatisfactory.
Hough Transform of the lane detection results. (a) Sunny, (b) Cloudy, (c) Raining, (d) Night.
Kalman filter for lane line detection results
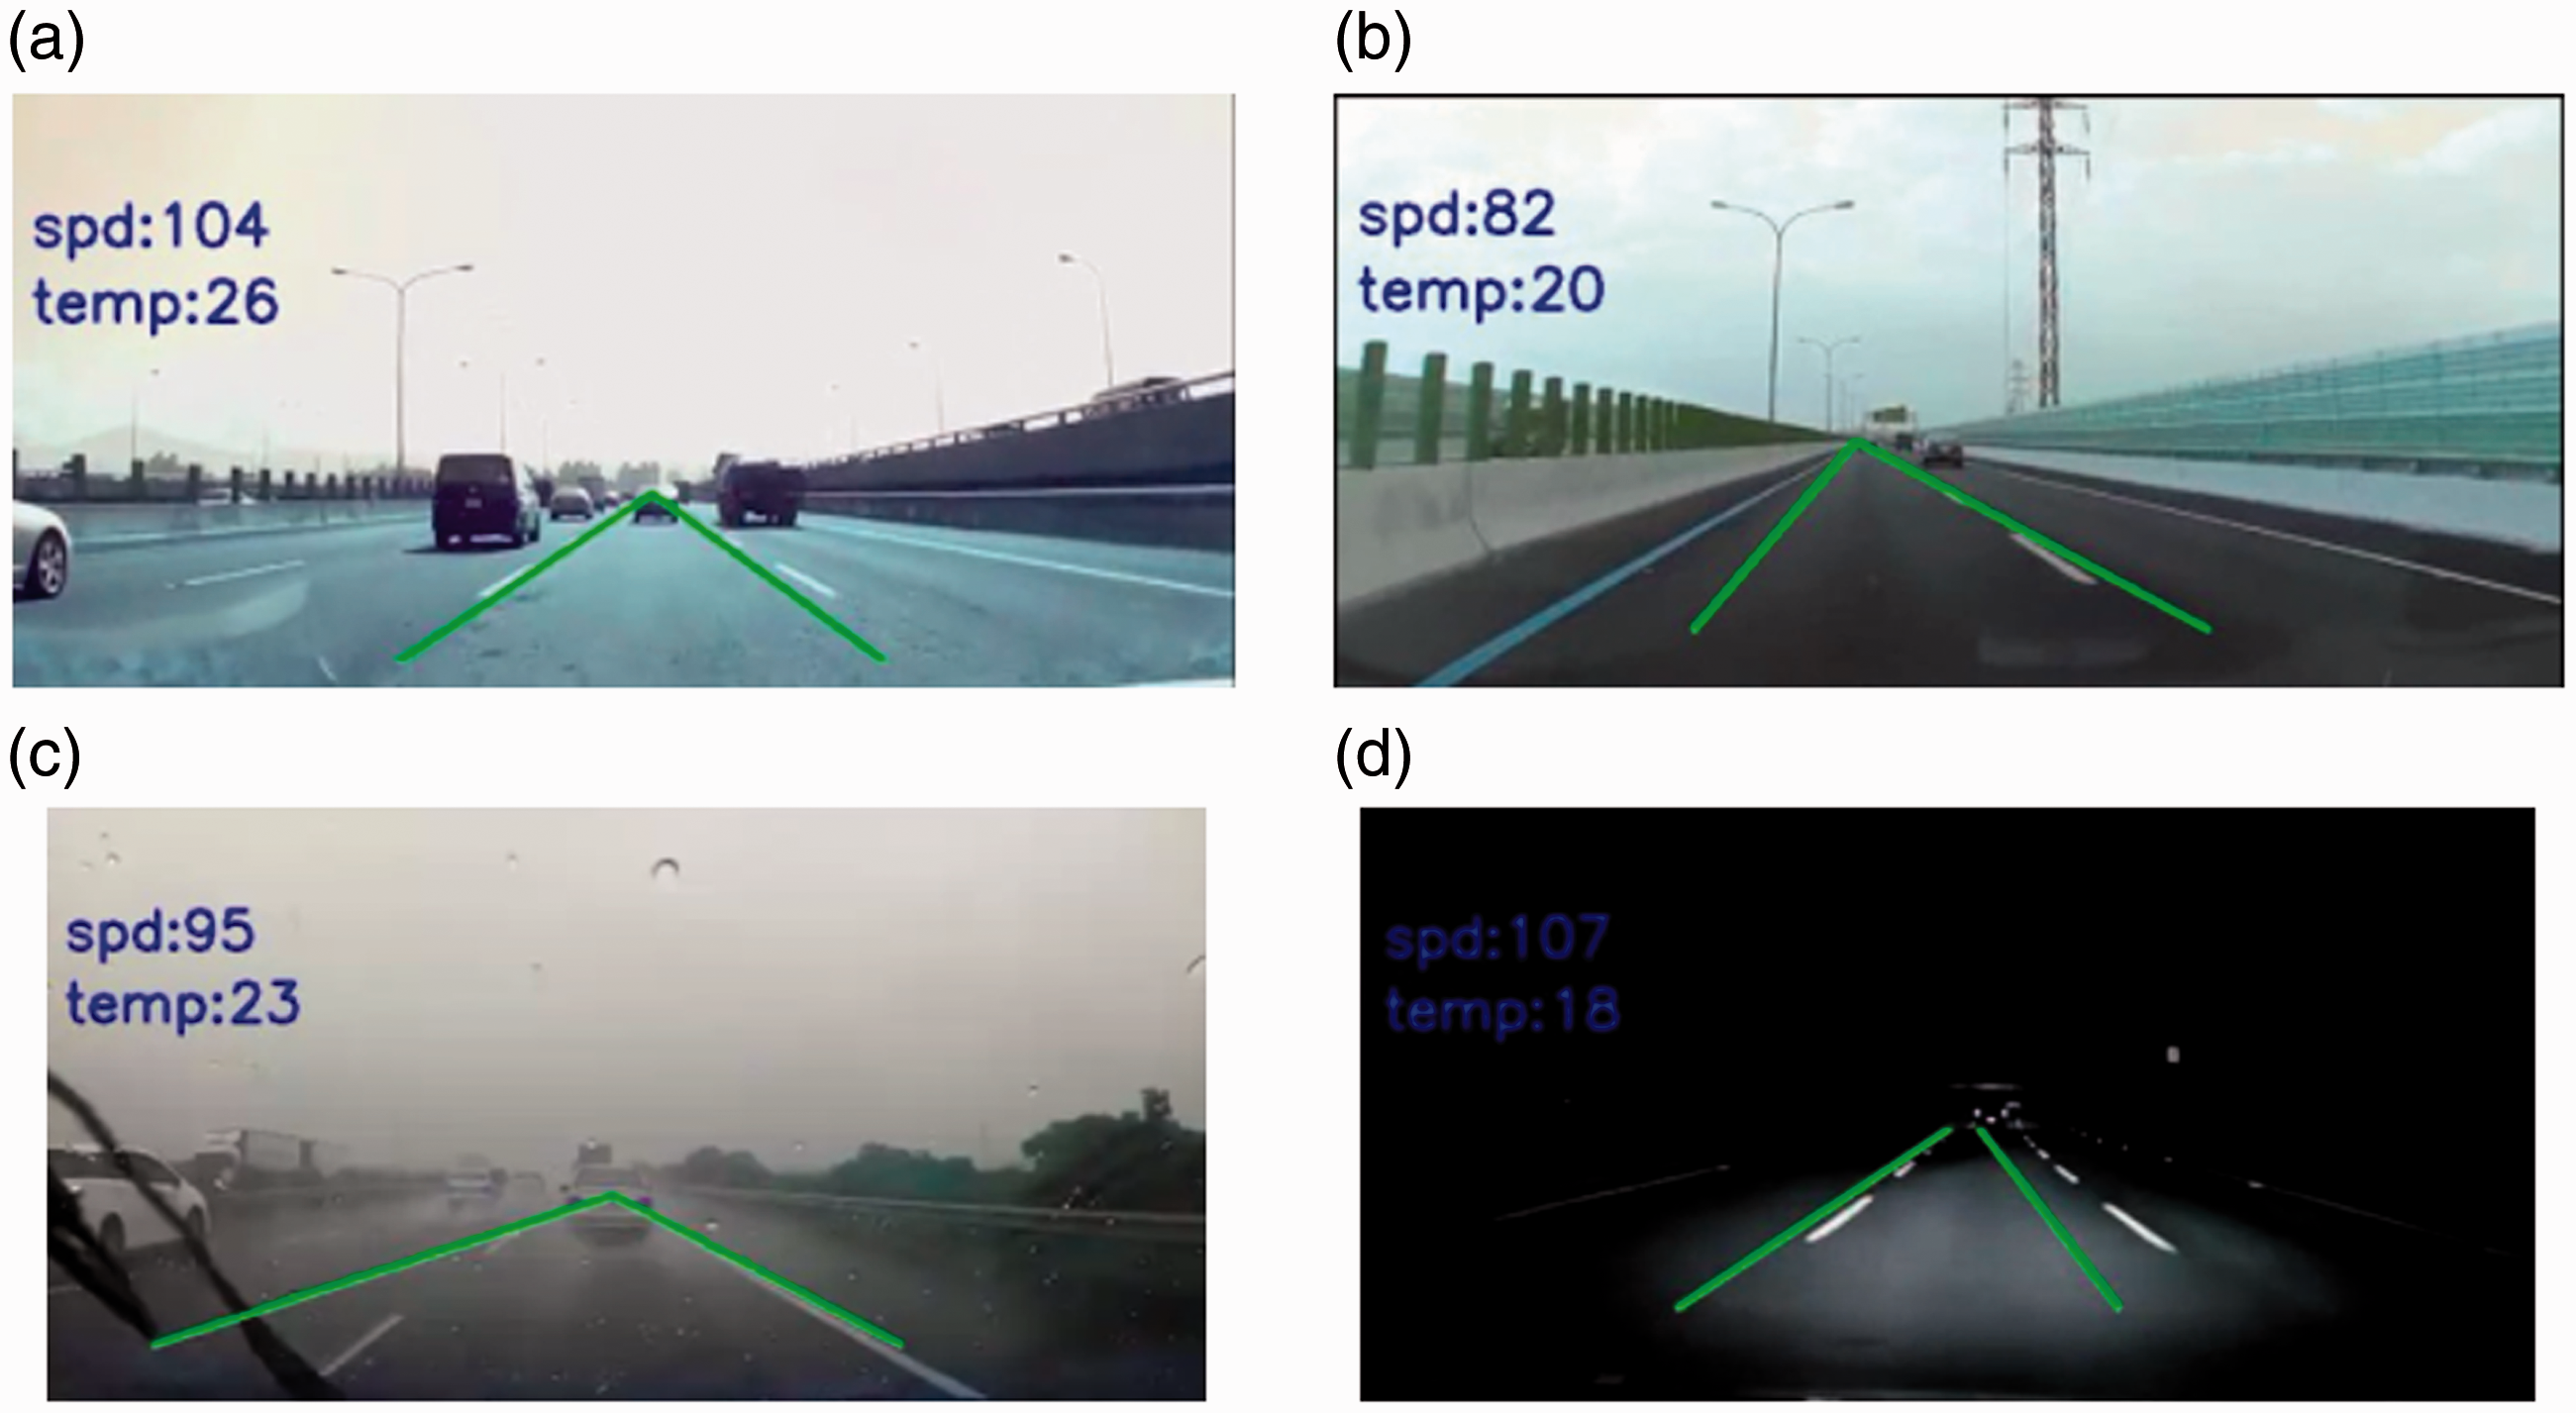
To improve the Hough transform lane line detection vulnerability to environmental factors, the Kalman filter was added to overcome this problem. The experimental results shown in Figure 11 indicate that using the Hough transform plus the Kalman filter for lane line detection provides a better result than using the Hough transform alone. This finding can be attributed to the fact that the Kalman filter can filter out the noise on the road and predict the location near the actual lane.
The lane detection results of Kalman filter. (a) Sunny, (b) Cloudy, (c) Raining, and (d) Night.
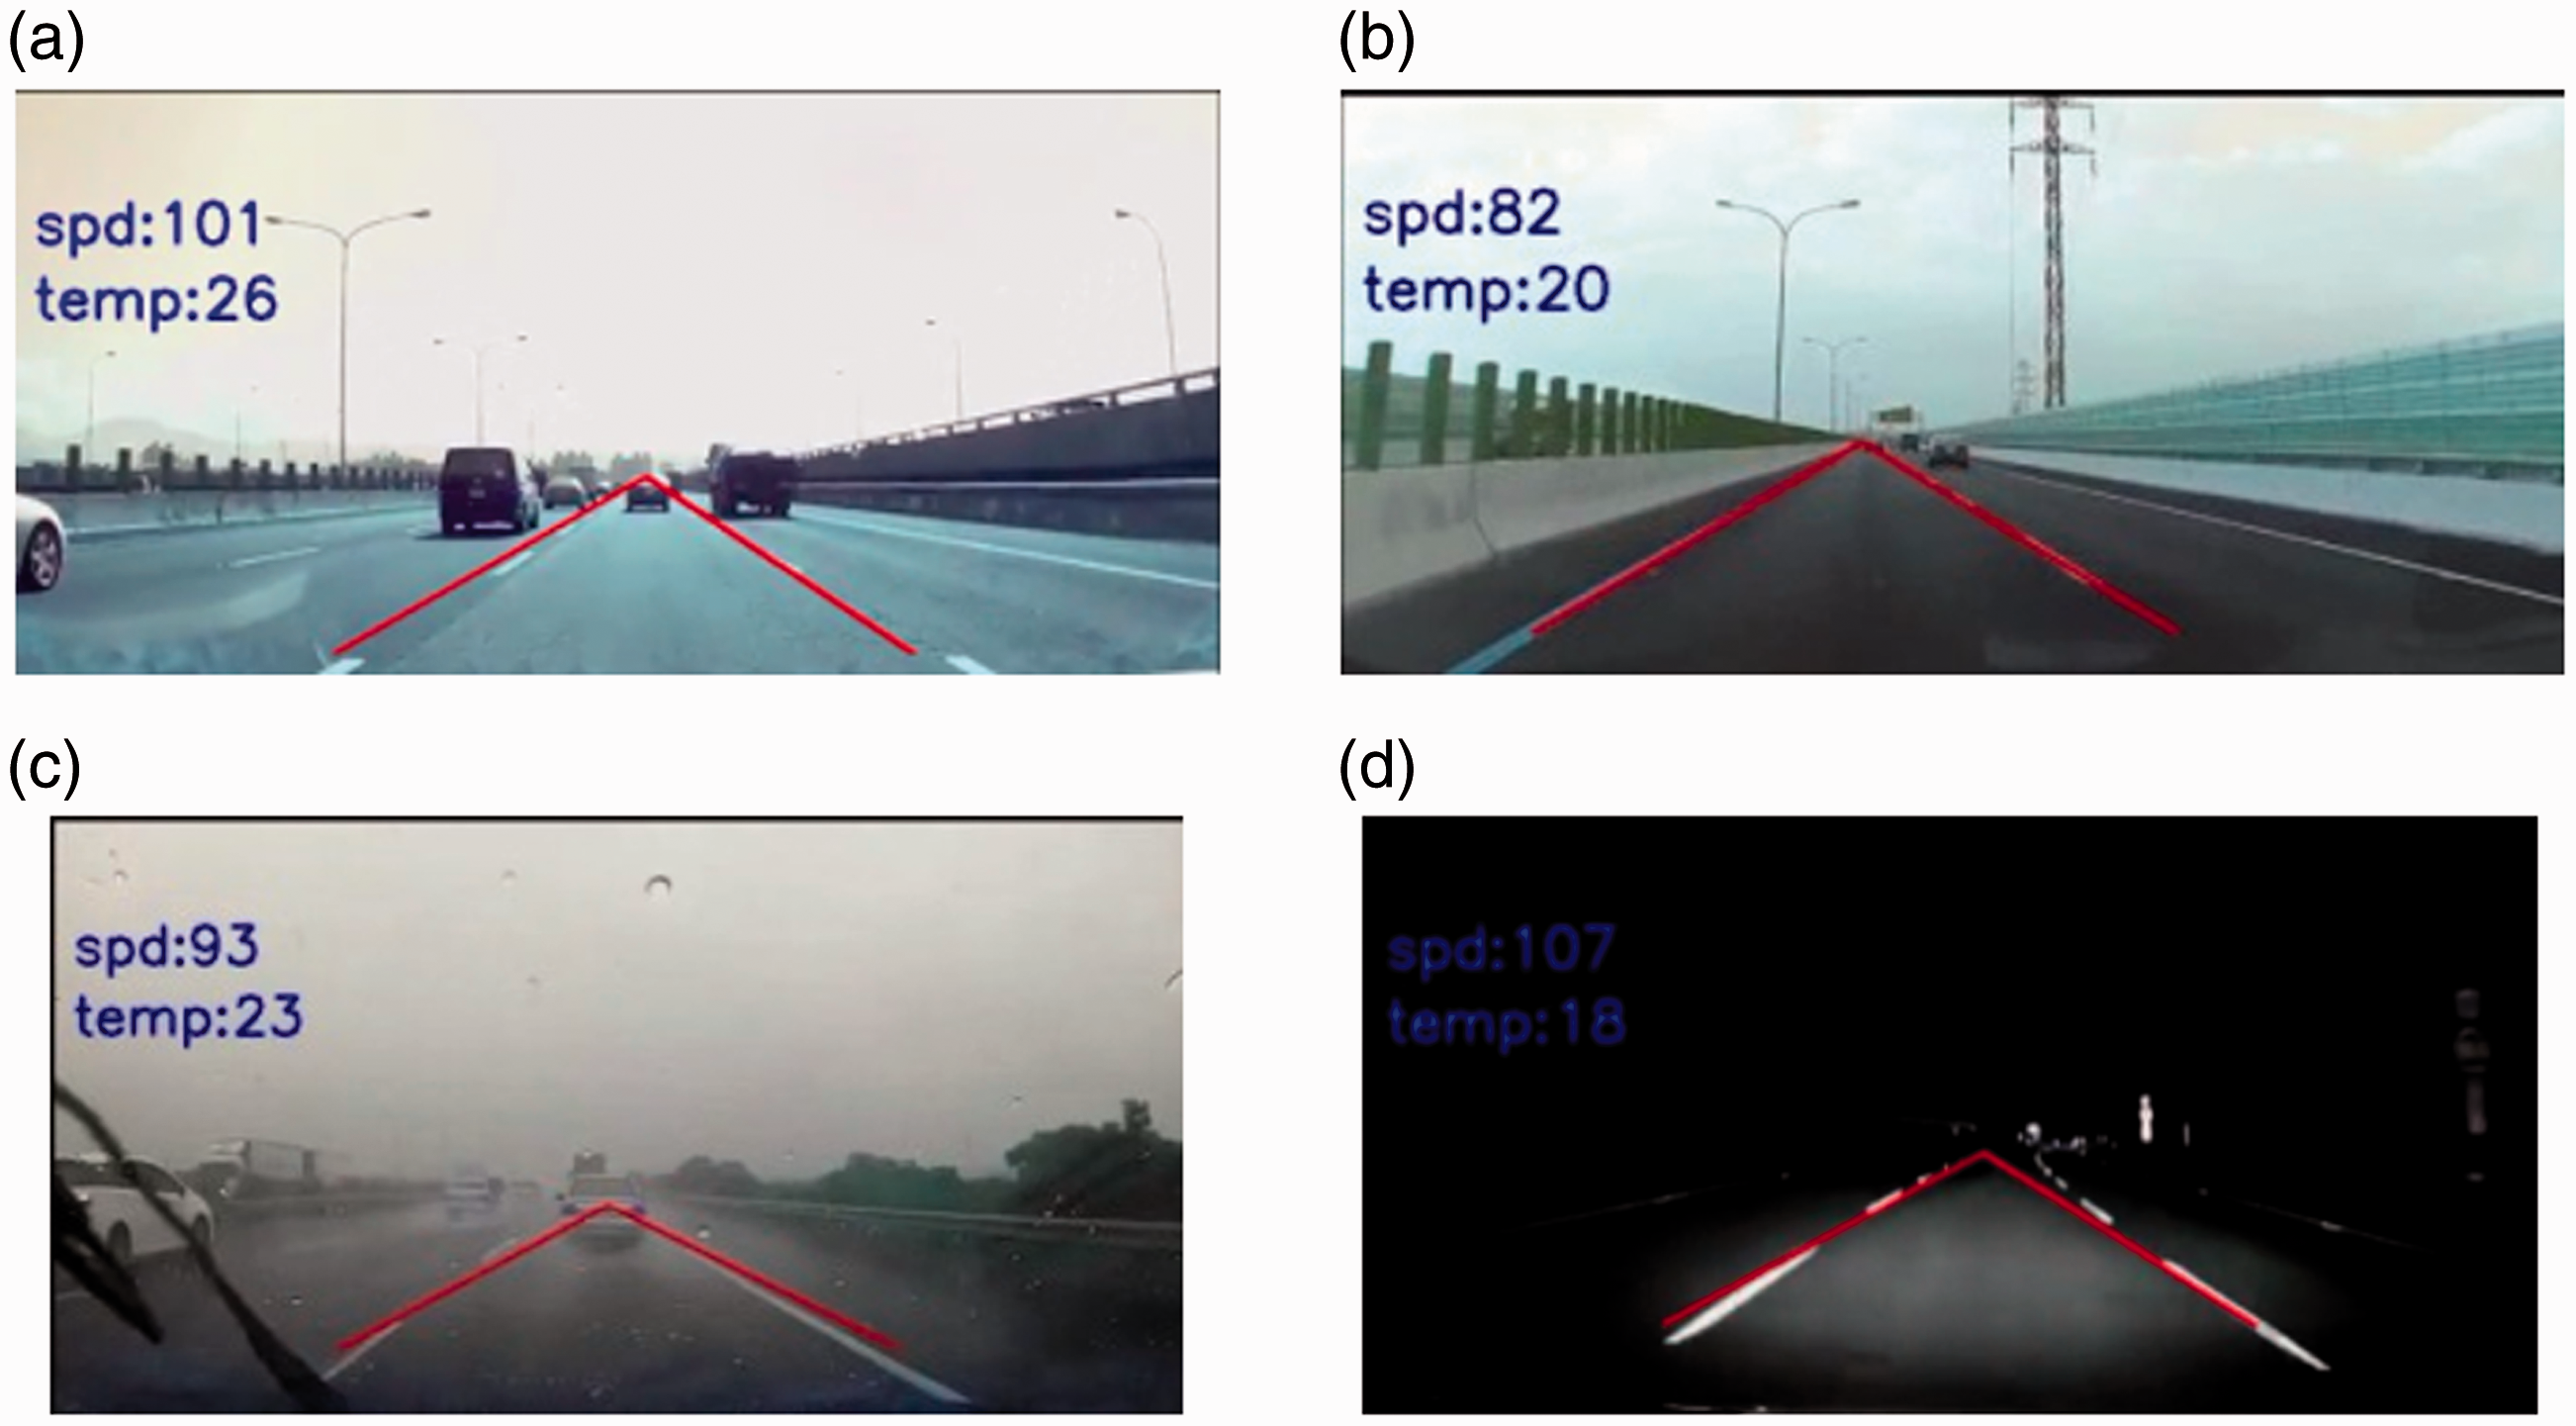
As shown in Figure 12, the Kalman filter does not only exhibit a good performance in the four cases but can also accurately predict the actual location of the lane line when facing other noises. This good performance improved the vulnerability to environmental factors that affected lane line detection using the Hough transform.
Lane detection results for Kalman filter under the different noise. (a) Detection results of the car into gateway, (b) Detection results of rain and wipers, (c) Detection results of bridge shadow noise, (d) Detection result of forward vehicle shadow.
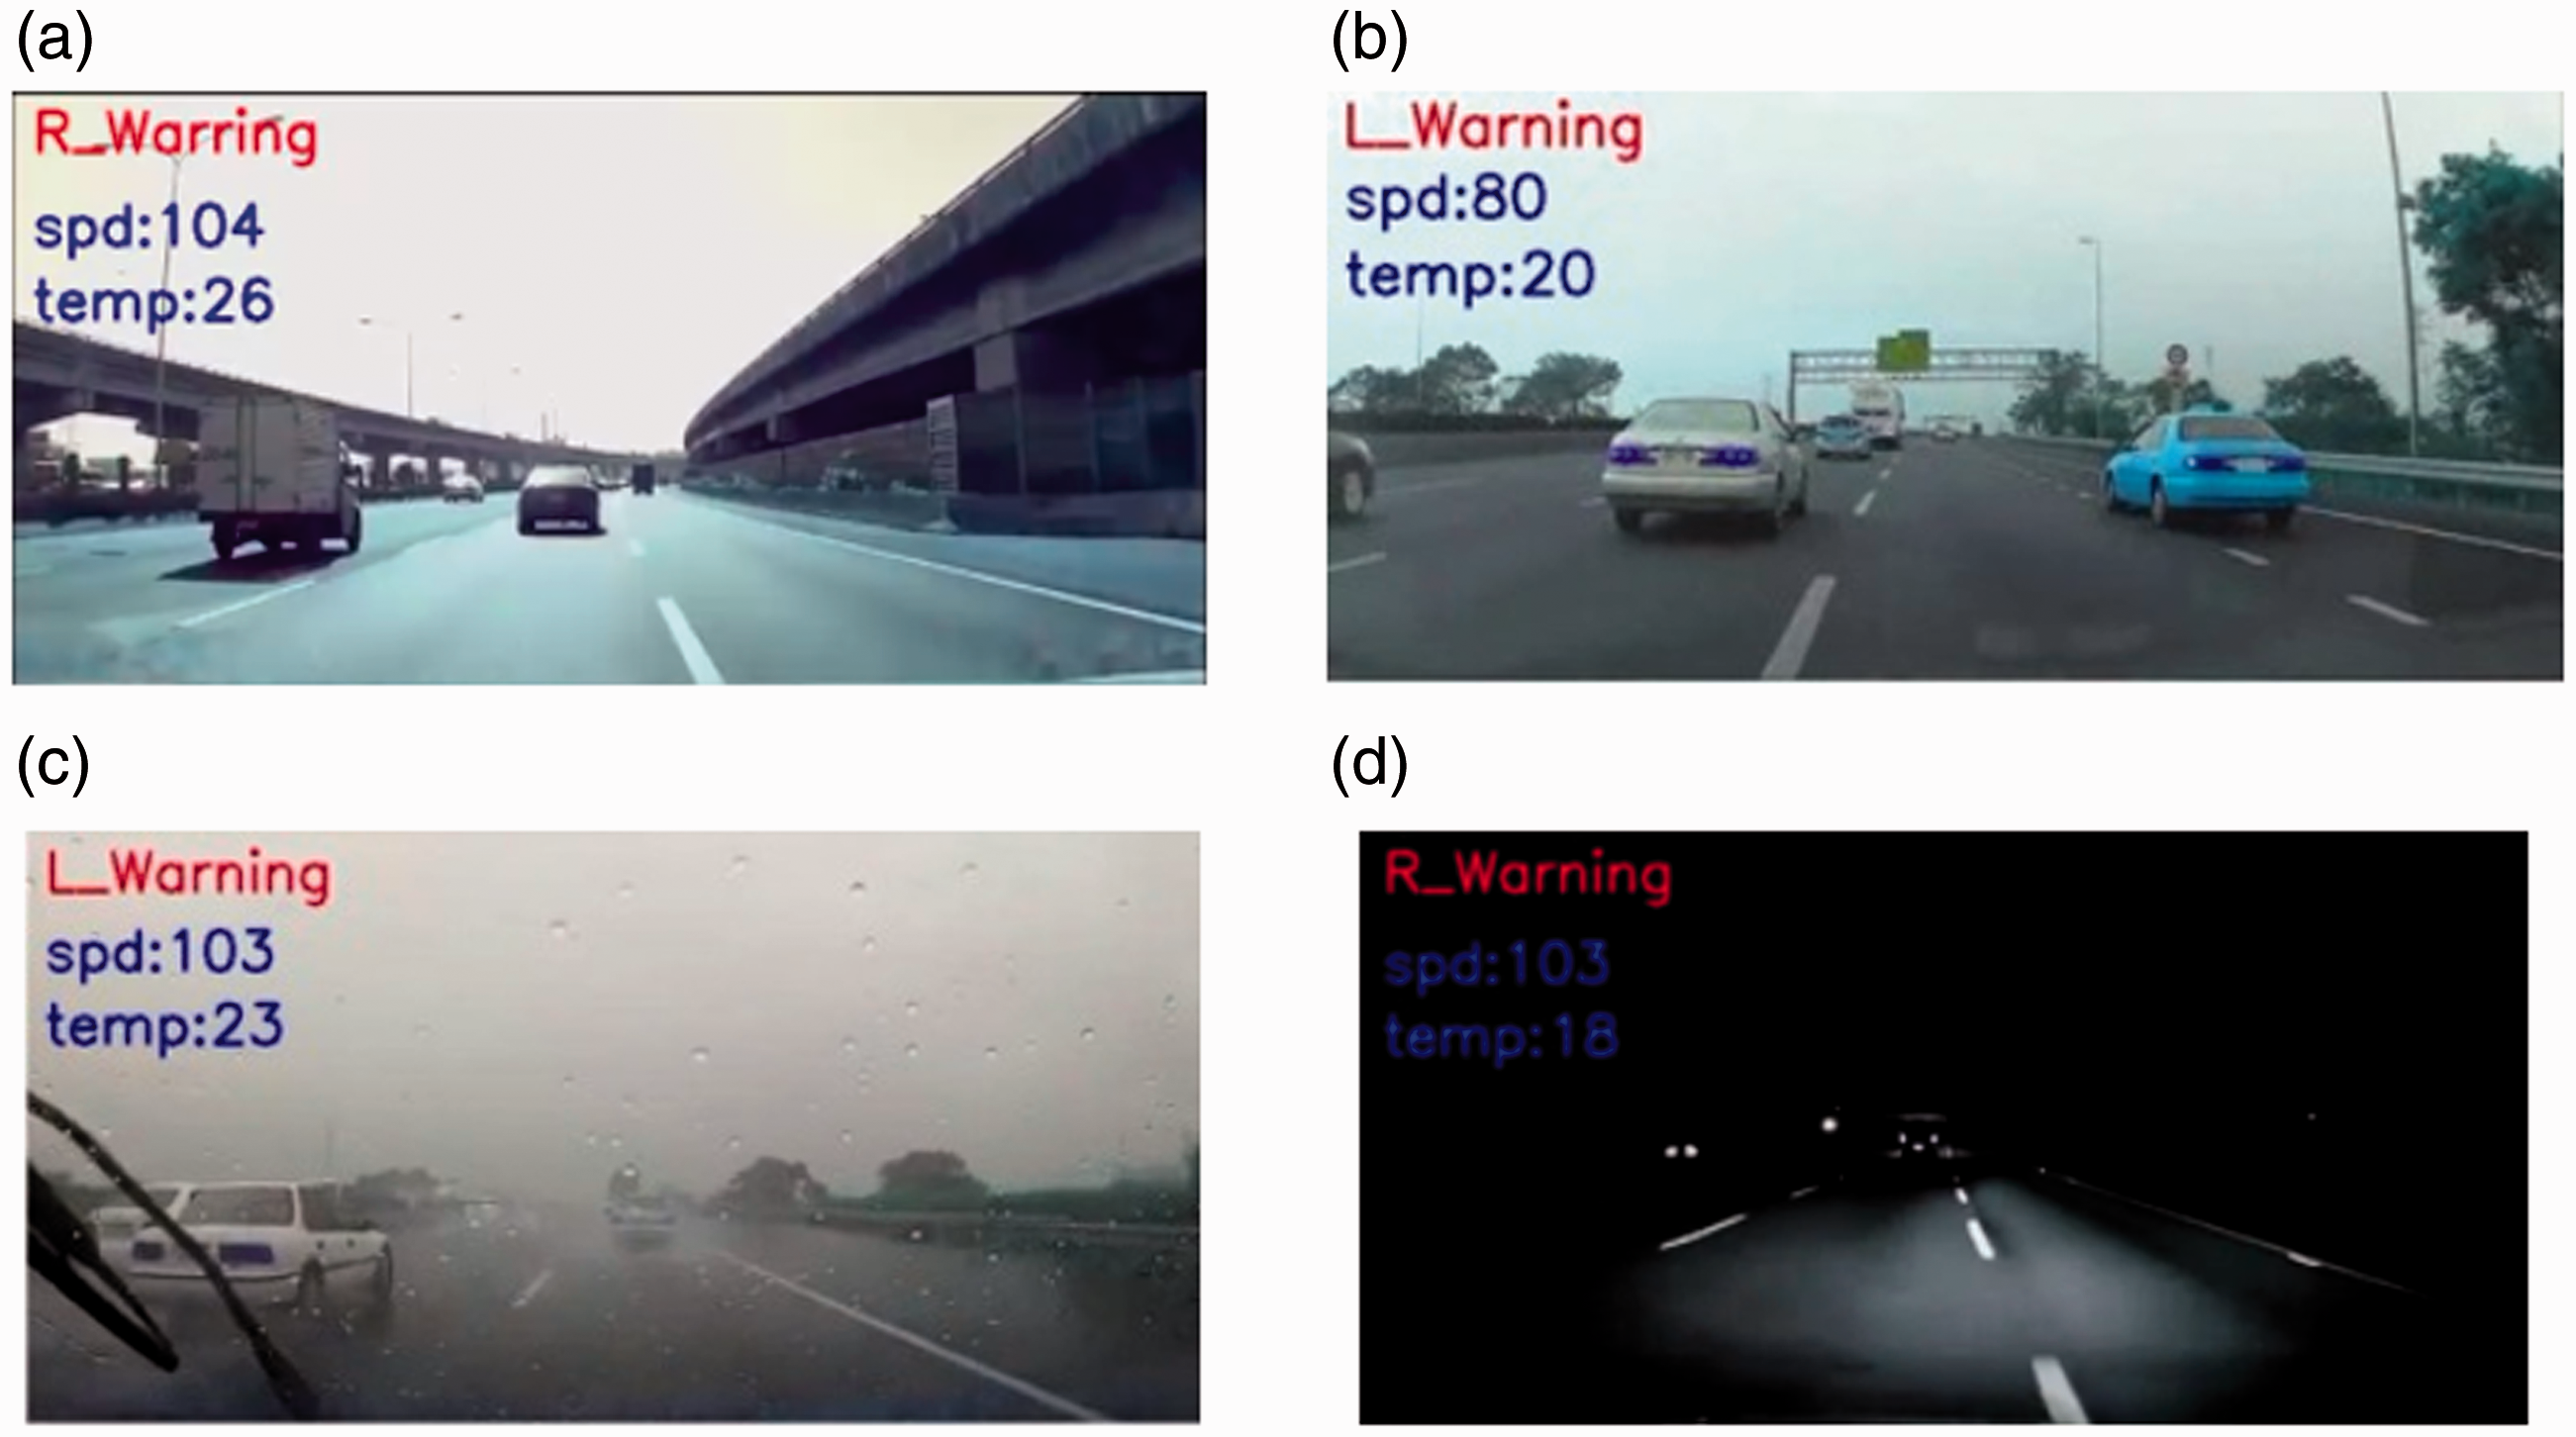
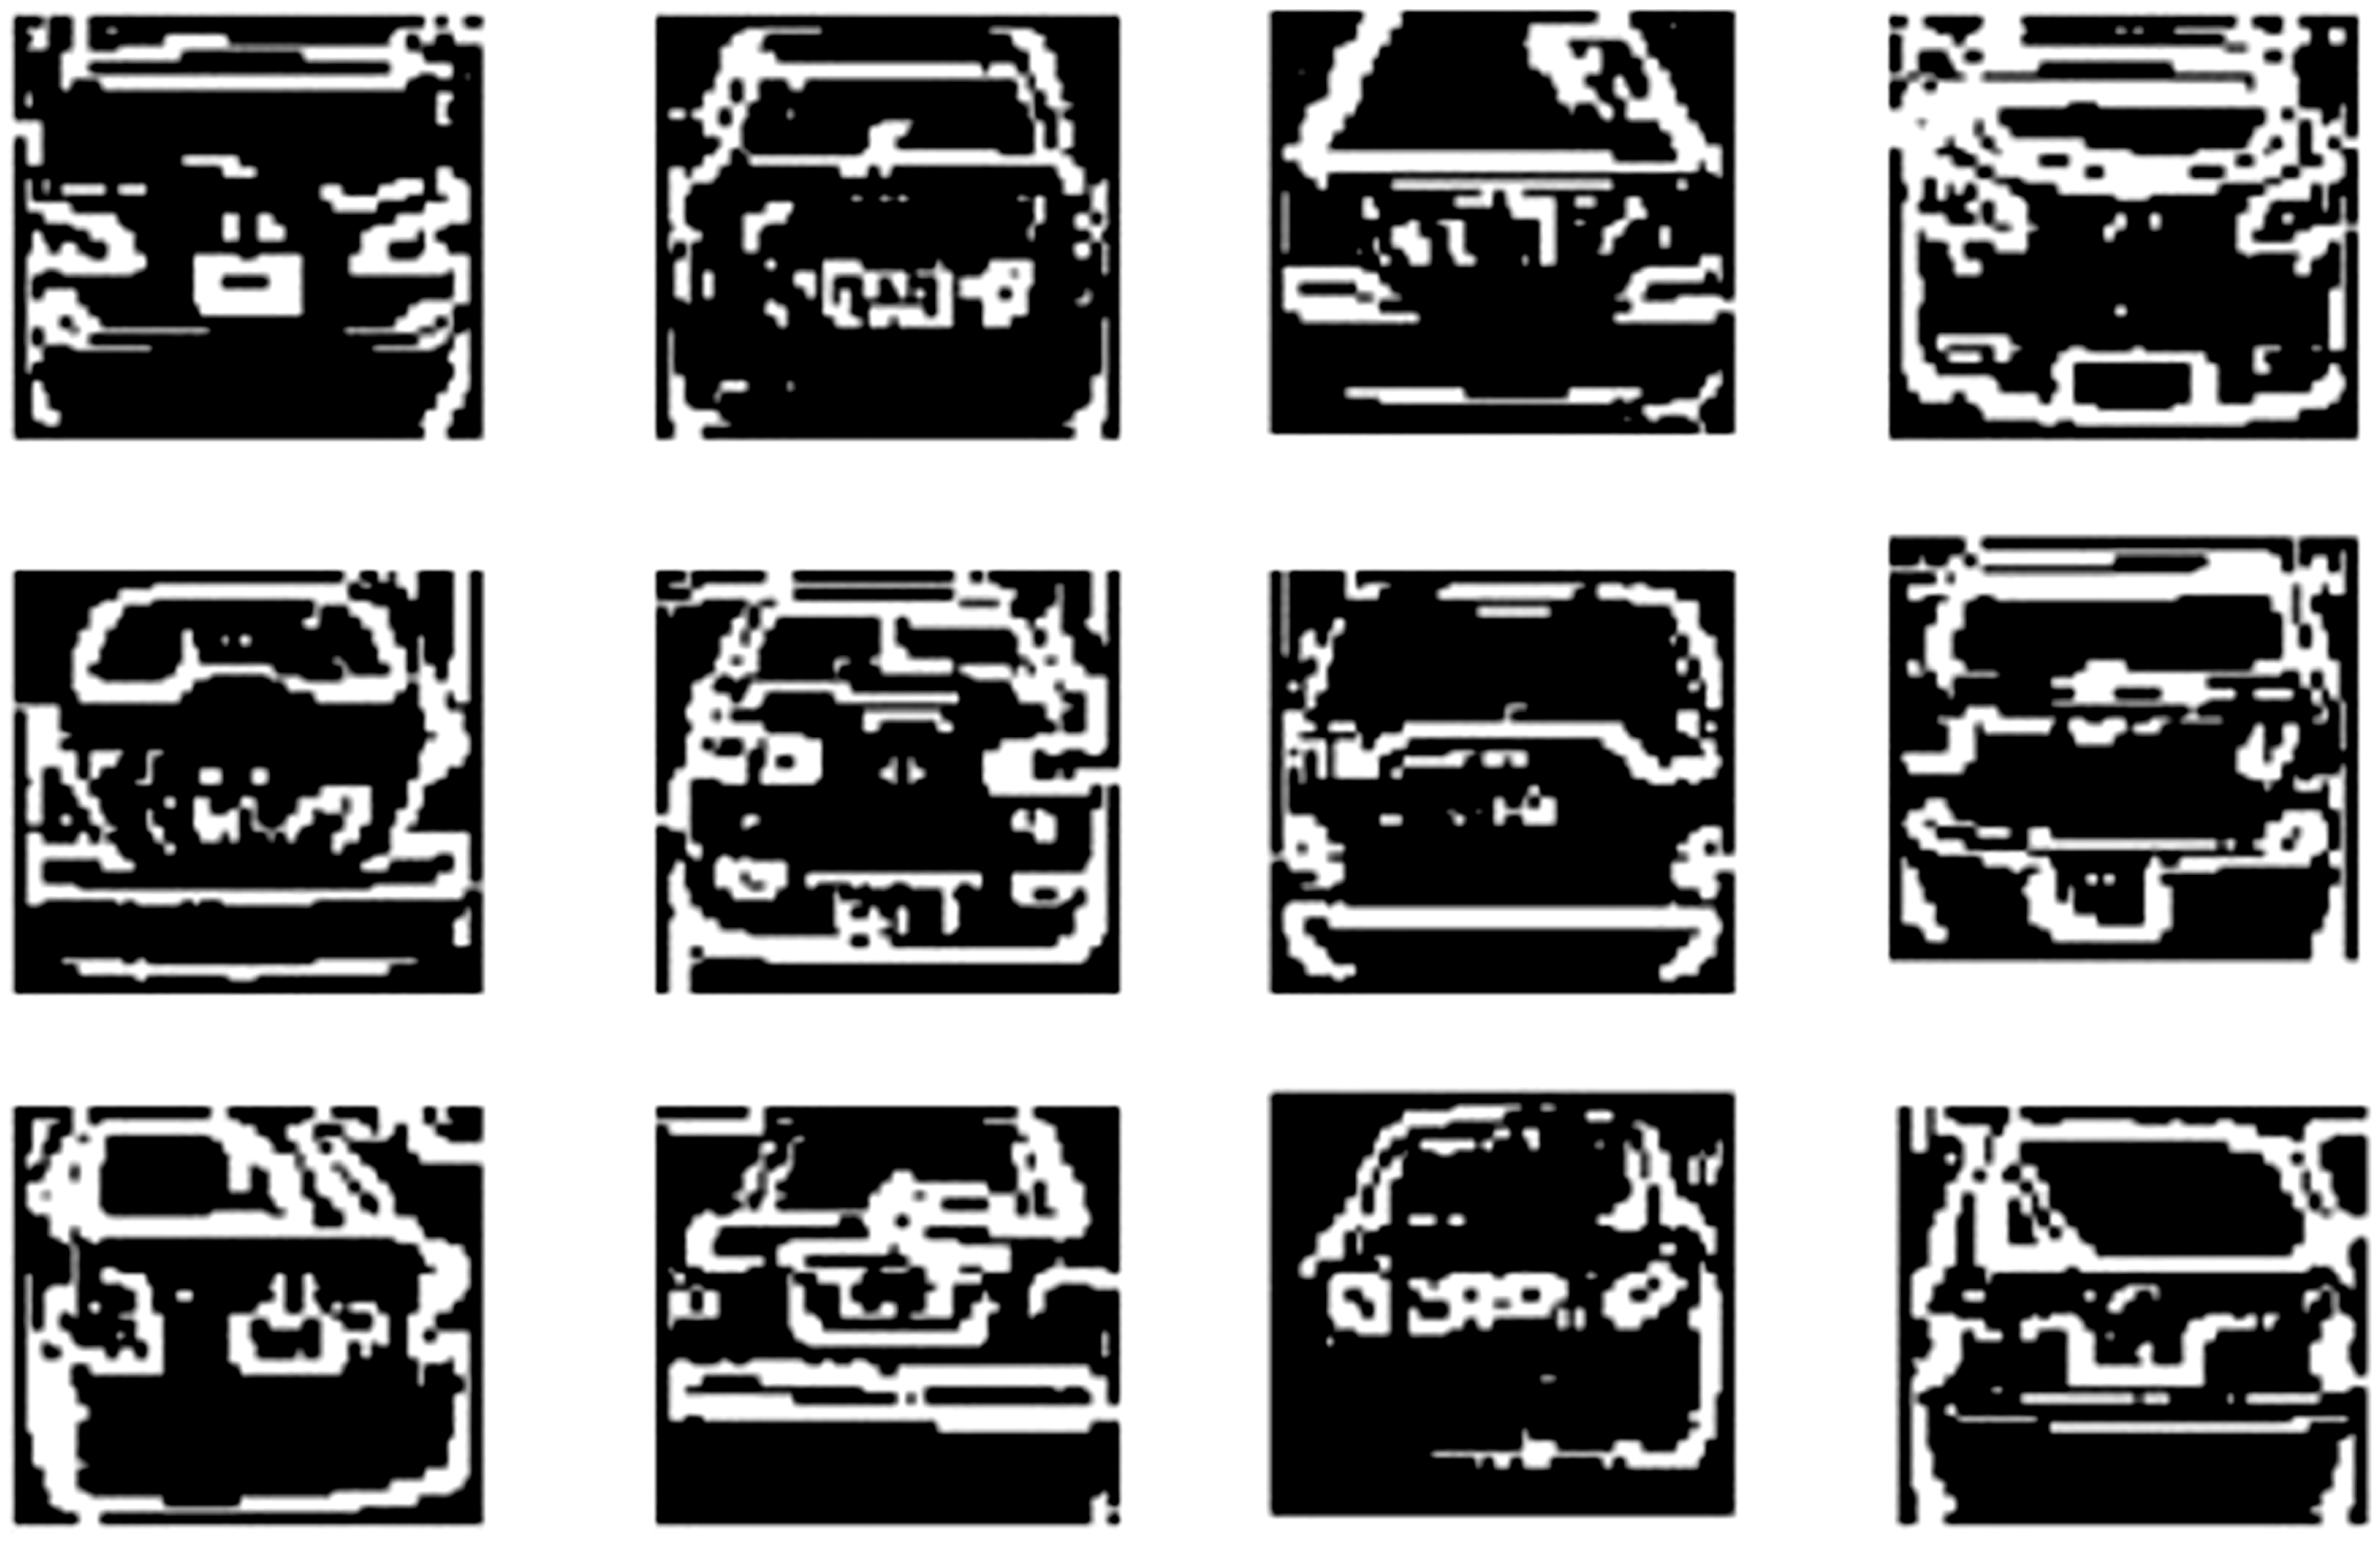
Table 1 shows the number of test samples used for lane line detection. This study excludes the detection of the situation where the vehicle is in front of the vehicle and the number of lane test samples is set to 300 frames. Table 2 also shows that the Kalman filter has the advantages of filtering out the noise and predicting the lane line over the Hough transform, so that it is tested during the rainy day. Different from the Hough transform, which is vulnerable to the effect of the environment, the Kalman filter significantly improves the correctness of the test results.
Number of test samples for lane line detection.
The correct rate of lane detection.
The results of the lane departure warning
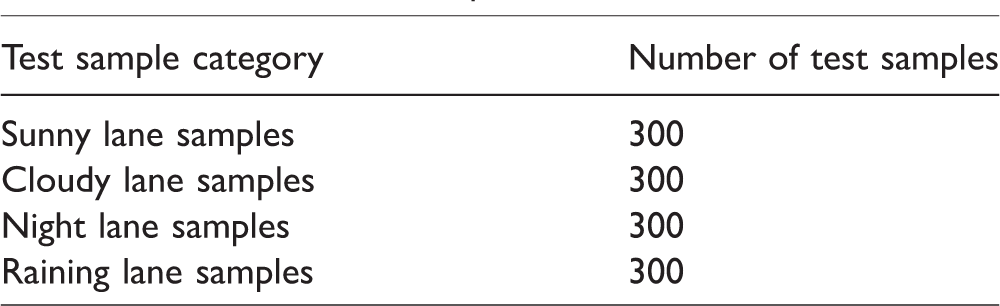
This system is based on the position of the left and right lanes in the image on the screen to determine whether the current vehicle is offset or not. Several advantages of this method are that the system is easy to judge and the computational complexity of the system can be reduced. When the image goes through Kalman filter lane detection, the coordinates of the x-direction of the left and right lane lines can be known. When the right lane x-axis coordinate value is less than two thirds of the image width, the current vehicle is shifting to the right. Conversely, when the left lane x-axis coordinate value is greater than one third of the image width, the current vehicle is shifting to the left. When the vehicle continues to move to the right or left, the system will display a warning message on the screen of the smart glasses, as shown in Figure 13, to warn the driver that he/she should pay attention to the current traffic conditions.
The results of lane departure warning. (a) Sunny departure warning, (b) Cloudy departure warning, (c) Raining departure warning, and (d) Night departure warning.
Experimental results of SVM front vehicle identification and collision avoidance warning
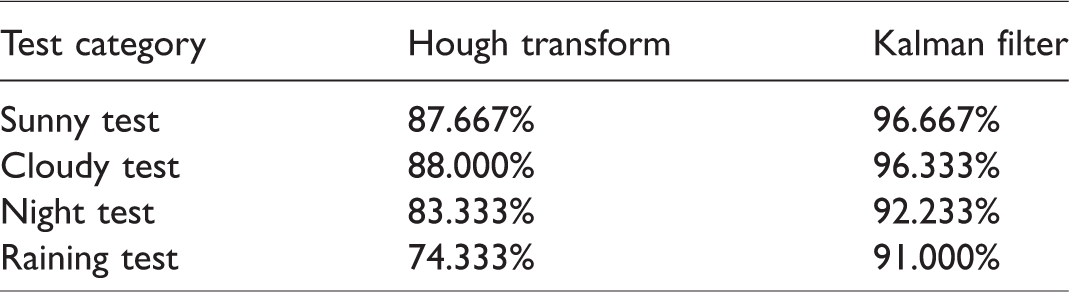
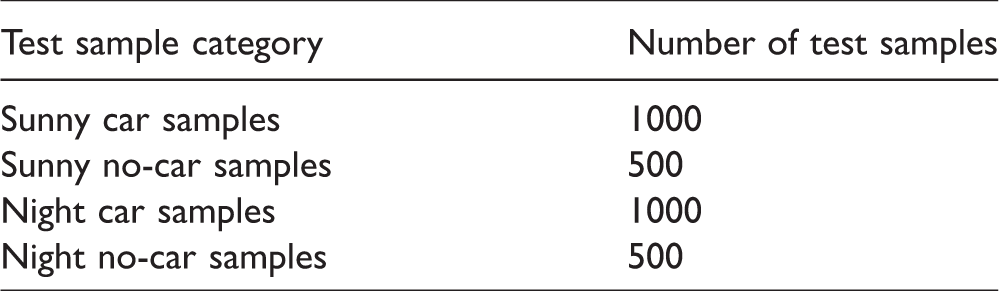
In this study, the front vehicle ID is based on the use of LIBSVM 25 open source machine learning library proposed by C. C. Chang and C. J. Lin for SVM training and prediction. To increase the adaptability and robustness of SVM forecasting, this study takes vehicle and non-vehicle images of the streets of Taiwan during the day and night. All of the images are captured by Harris corner detection to obtain the eigenvector, and the training samples are normalized to 50 × 45 pixels. Figure 14 shows the vehicle training samples used in this study. The training samples can be divided into two types, namely, car in day and car at night, with positive samples for the vehicle images and negative samples for the non-vehicle images. Table 3 shows the number of positive and negative samples used in this study.
Vehicle training samples.
Number of vehicle training samples.
The type of SVM used in this study is known as the C-support vector classification, the kernel function is known as the radial basis function, the parameter C penalty is set as 2, and the parameter
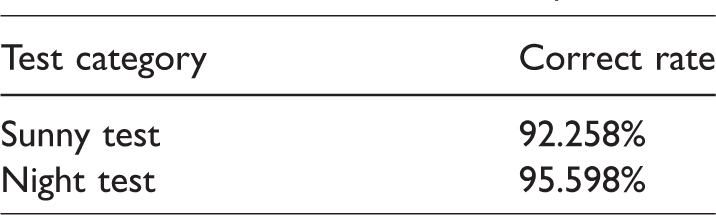
The correct rate of SVM predict.
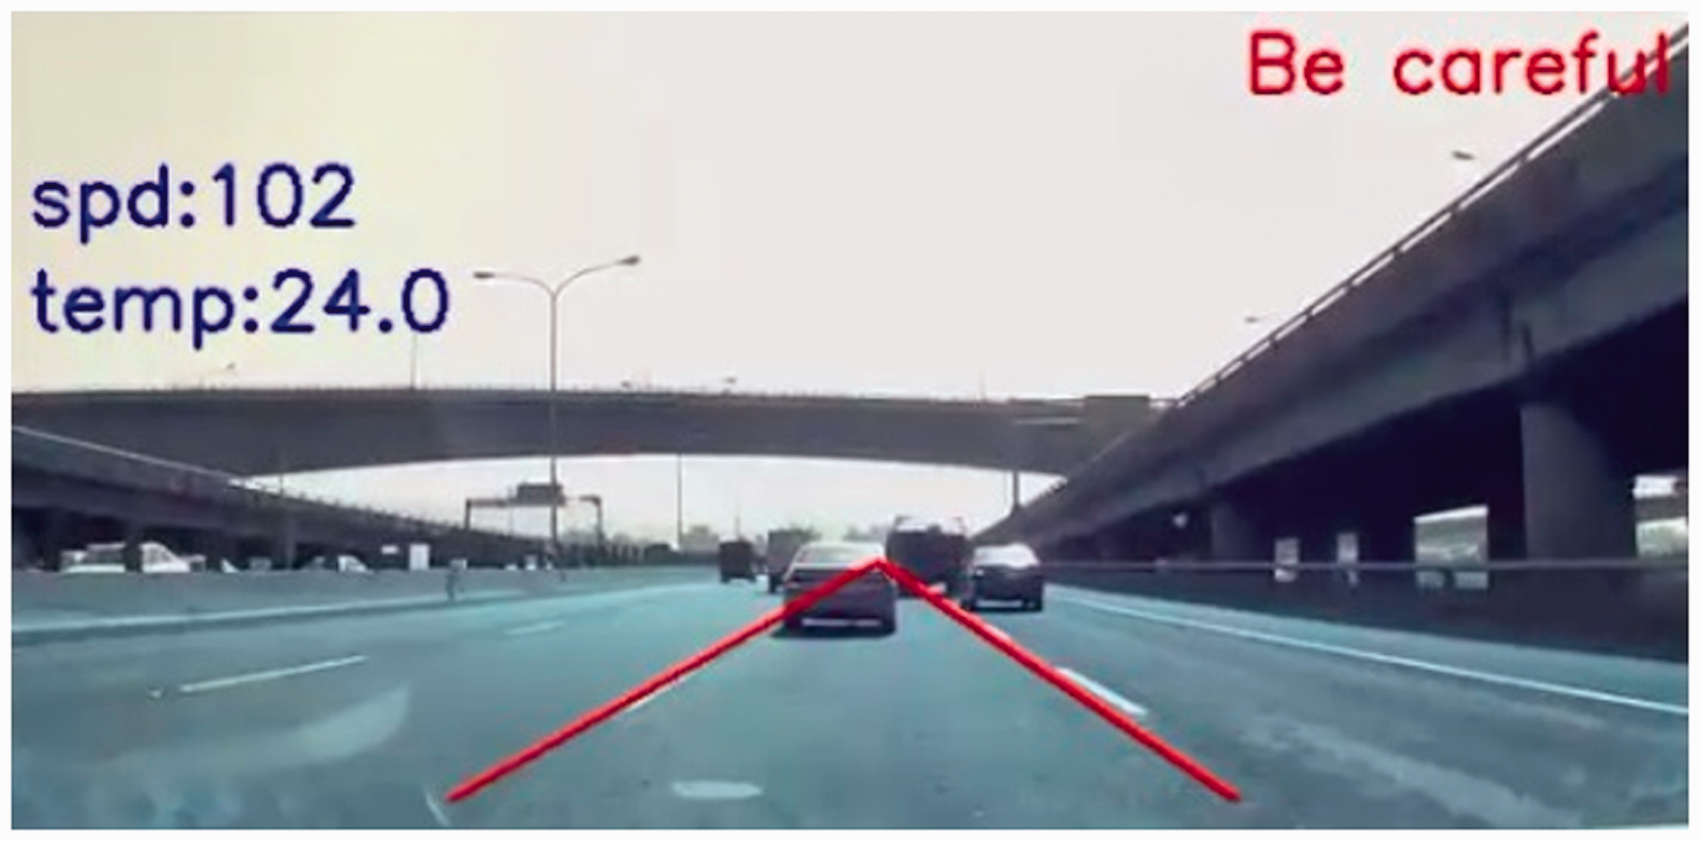
The decision method that the system uses to determine whether the distance from the car is close is the size of the y-direction coordinates of vehicles in the image. When the SVM identifies that there is a vehicle in front, it will in turn determine the y-direction of the coordinates of the vehicle where the distance of the vehicle in front is greater than the y-axis coordinate value. By contrast, if the y-axis coordinate value continues to increase, then the distance from the front vehicle is close. Subsequently, the system will display a warning message on the screen to inform the driver to maintain the appropriate driving distance. Figure 15 shows the results of daytime and nighttime front anti-collision warning.
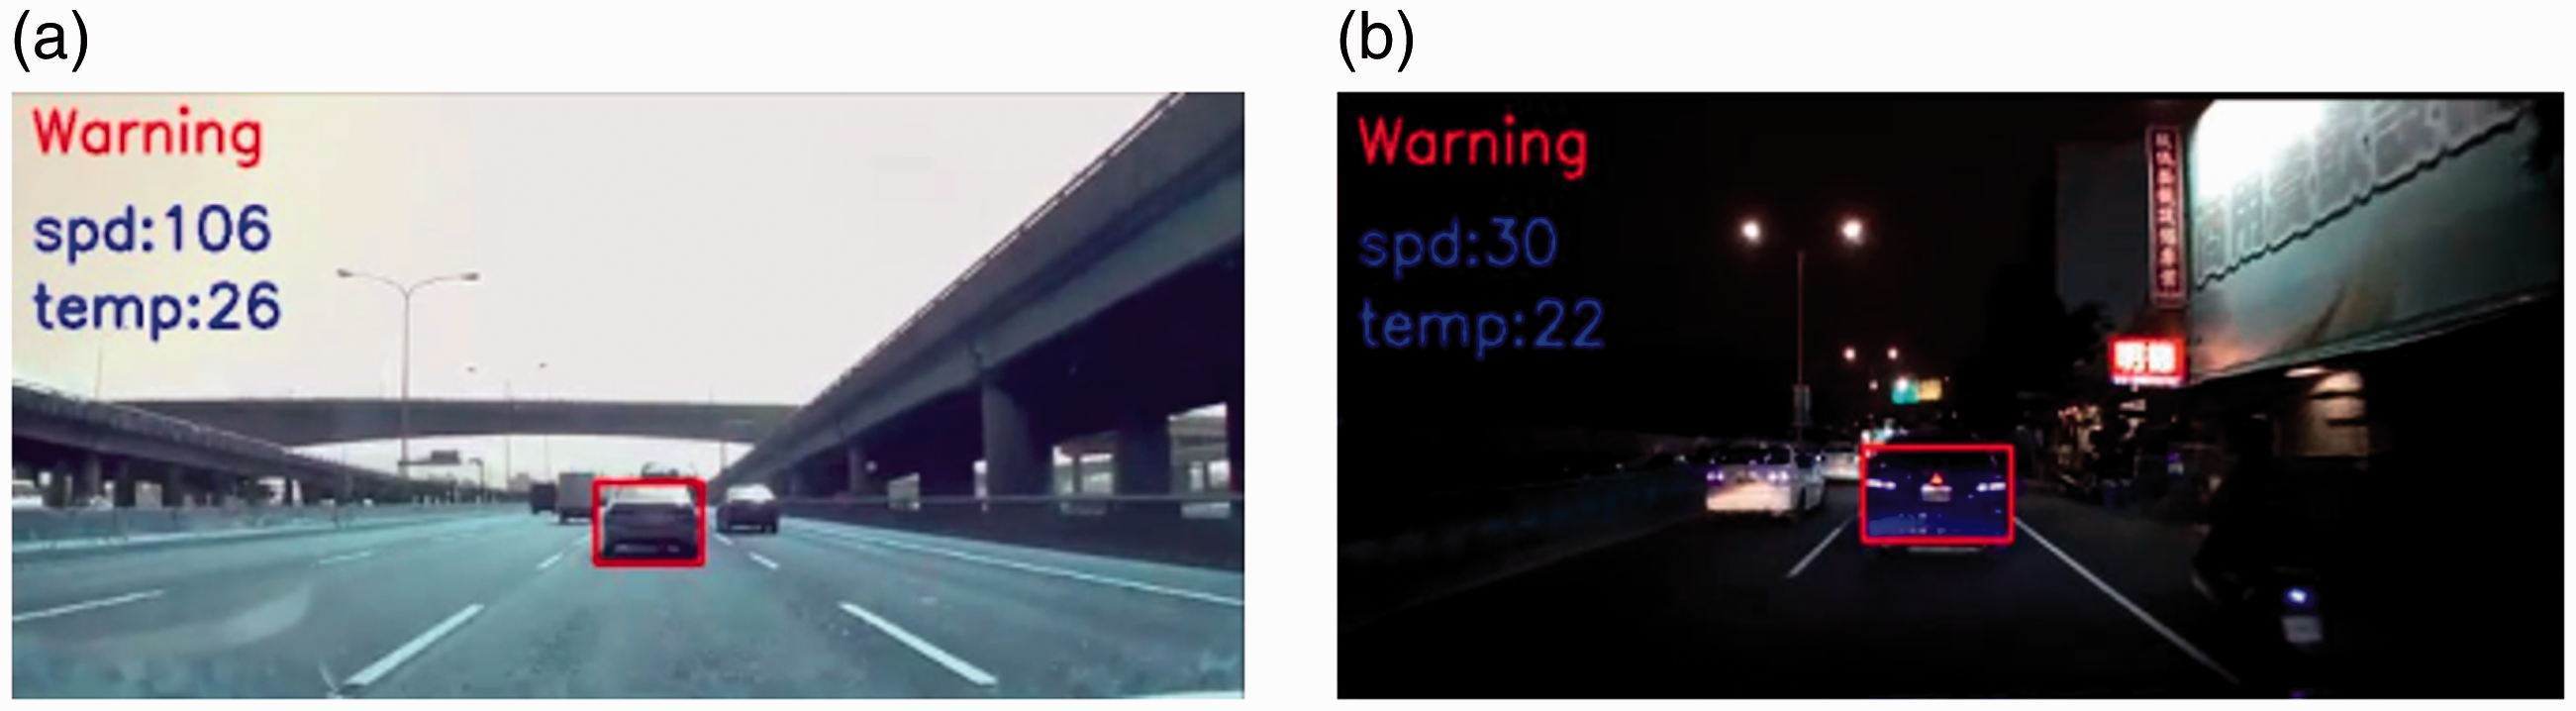
The results of forward collision warning. (a) Daytime warning message and (b) Warning message at night.
Test results of on-board Internet of things
This study develops an app on Android. When the program is turned on, the owner must first turn on the Bluetooth and Arduino connections to identify the action of the owner. After the system is identified successfully, it can now obtain the authority to control the vehicle, connect to the server to access the vehicle assistance system, and obtain the current information of the vehicle. Figure 16 shows that the system successfully identifies the owner. Then, the app interface will inform the owner that the vehicle has been unlocked.
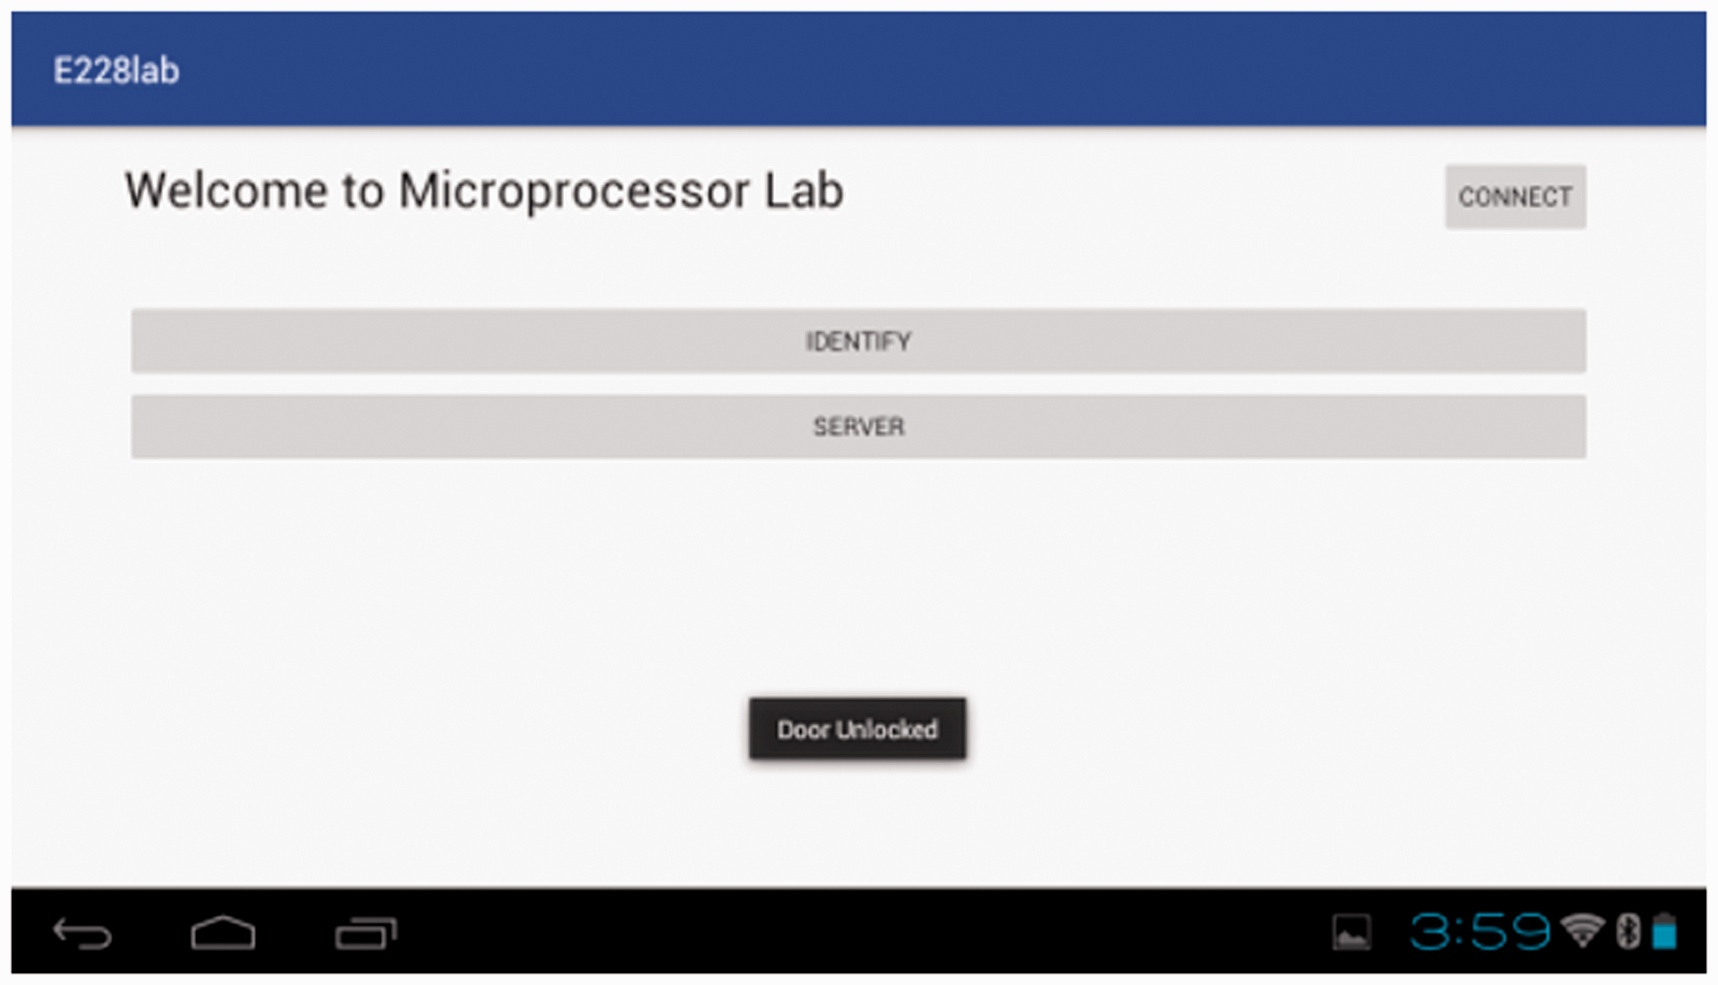
The door has been unlocked.
The blind spot detection system can help the driver overcome the blind spots on the field of vision, wherein the detection range in the rear side is 3 m. The blind spot detection system can prevent the occurrence of accidents when changing lanes because of the effect of blind spots behind the vehicle that the driver cannot pay attention to. Figure 17 shows the simulation employed to help the driver detect blind spots at the rear of the car. The smart glasses screen will remind the driver to pay attention to the rear of the car.
The results of simulate of the rear drive.
Conclusion
In this study, the design of a vehicle with advanced driving support function of the IoV system is based on the concept of the expansion of AR. The system can be divided into three parts. One part involves lane departure warning. In this study, the Hough transform is used to identify the location of the lane line from the ROI of the image. The Kalman filter is added to improve vulnerability of the Hough transform to environmental factors in identifying the actual lane line. Then, the lane departure decision is employed to determine whether the vehicle is offset or not. The experimental results show that the accuracy of the Kalman filter test is up to 90%. The second part involves anti-collision warning. In the daytime vehicle detection section, the Sobel edge detection result and the lane mask generated by lane mark detection are inputted into the AND operation. The unnecessary noise in the image is filtered out, and the vehicle hypothetical area is determined by scanning the vertical edge. Nighttime front vehicle detection is achieved by detecting the front car red light area and using the same lane mask to filter noise to identify the vehicle assumed area. Finally, the vehicle assumed area is acquired by Harris corner detection to obtain the vehicle characteristic parameters. Moreover, the SVM ID model trained by a large number of training samples is used to identify the vehicle. The correctness of the forecast result of the daytime vehicle test sample set is 92.258% and that of the nighttime vehicle test sample set is 95.598%. The last part is the IoVs. This study added the RSA algorithm to enhance information security on the Internet through public and private key pairing to determine the owner. After obtaining the authority to control the vehicle, the owner can now connect to the server side and access various sensors to detect vehicle information from the smart glasses.
Finally, this study actualizes the image recognition part in the industrial computer and use of Arduino Yun to establish Internet of Things. Through the network transmission mode, the image identification results and vehicle information can be displayed on smart glasses to achieve the purpose of AR of the Internet of Things.
Footnotes
Declaration of conflicting interests
The author(s) declared no potential conflicts of interest with respect to the research, authorship, and/or publication of this article.
Funding
The author(s) received no financial support for the research, authorship, and/or publication of this article.