
Abstract
State of Charge (SOC) estimation plays a crucial role in managing the performance and longevity of electric vehicle (EV) batteries. Various estimation techniques, including various Kalman Filters (KF), have been employed for this purpose. The mathematical process and limits of different KF family algorithms are analysed. In this study, an impact of nonlinear KF parameters on SOC estimation accuracy for EV batteries is analyzed. Specifically, the performance of Extended Kalman Filter (EKF), Unscented Kalman Filter (UKF), and Particle Filter (PF) is examined. EKF is most preferred for SOC estimation whereas introducing sigma points in UKF is the basic difference between EKF and UKF. In comparison to EKF and UKF, PF is more flexible since it applies to nonlinear systems with non-Gaussian distributions. Utilising a sequence of noisy measurements, KF is a recursive method that approximates the state of a dynamic system. It requires accurate parameters such as process noise covariance (Q) and measurement noise covariance (R) to work effectively. In this work, the effect of these parameters on state of charge estimation using nonlinear KFs has been analysed under different settings of noise covariance matrices. Tuning these parameters is essential for optimizing the performance of the KF and ensuring accurate and reliable state estimation in real-world applications. To find parameter values that provide the best balance between accuracy, robustness, and computational efficiency, the tuning process involves experimentation, simulation, and validation using real-world data. According to the results observed, the filter parameters such as three diagonal elements of Q are selected as 2e-8, 0.005, 0.003 and R as 2e-6. By evaluating the state estimation accuracy under different driving scenarios, robustness and sensitivity of filtering technique in estimating SOC for EV batteries has been studied. This analysis contributes to the optimization of SOC estimation algorithms, enhancing the reliability and efficiency of EV battery management systems.
Keywords
Introduction
There are numerous important functions that electric vehicles (EVs), serve in society, contributing to various aspects of society, the economy, and the environment (Liu et al., 2020). EVs can facilitate the development of sustainable urban transportation systems. They contribute to reducing noise pollution and improving air quality in cities, making urban areas more livable. EVs use rechargeable batteries to store electricity for powering the vehicle's electric motor. Lithium-ion batteries are chosen for EVs because they have high energy density, which allows for extended driving ranges on a single charge. The battery management system (BMS) is crucial for guaranteeing the safe, reliable, and effective process of lithium-ion batteries in EV applications, while also maximizing their performance, lifespan, and integration with other systems (Adaikkappan and Sathiyamoorthy, 2021).
The main goal of the BMS is to accurately determine the battery's state of charge (SOC), which is crucial for drivers to plan their journeys effectively (Maheshwari and Nageswari, 2020). The popularity of data-driven SOC estimate has increased because to the rapid growth of artificial intelligence. The benefits of machine learning approaches such as support vector machine, Gaussian process regression and deep neural techniques in the context of state estimation are methodically demonstrated (Tian et al., 2021). Deep learning has recently sparked innovation in the battery management space. Battery operational signals, such as voltage and current, can be directly mapped to SOC using deep learning-based techniques. Because deep learning techniques are very scalable, they may be used to train models on enormous datasets derived from various battery types. Deep learning techniques are a viable alternative that are projected to bridge the gap between the explosion of battery big data and the restricted learning capacity of traditional SOC estimate methods in the big data era where large battery operating data are gathered. Deep learning can estimate SOC through online with low computational time, but it needs more time for an offline training process, since it is a multi-layer architecture that increases the number of neurons (Xiao et al., 2021). For Gaussian process regression, choosing the right kernel function and optimising its hyperparameters are essential since the kernel function may capture the complex data structure. Furthermore, while data-driven learning techniques applied to battery state estimation gained a lot of attention recently, accurate SOC estimation remains hampered by these techniques’ poor generalisation and unused measurements in real-world scenarios (Wu et al., 2024). Such challenges will also prevent accurate SOC estimation from being realised for on-board applications (Maheshwari et al., 2022a).
An increasing number of scholars are concentrating on the analysis of model-based techniques for SOC estimation. The two most prevalent types of battery models now in use are equivalent circuit models (ECM) and electrochemical models (EM). Because of its moderate precision and straightforward structure, ECM has been widely used in real-world BMS applications (Xiao et al., 2021). In model-based estimation, KF is an effective tool for prediction of internal states in dynamic systems, including estimating the SOC in batteries of electric vehicles. When the system is operational, KF plays a vital role in the model-based SOC estimate technique. Given that the battery operates as a nonlinear system, nonlinear filter is an appropriate for estimating the SOC. Nonlinear Kalman filters such as extended Kalman filter (EKF), unscented Kalman filter (UKF), and particle filter (PF) are widely used for state estimation (Shrivastava et al., 2019). Table 1 provides a summary of various Kalman filtering techniques used for SOC estimate in EV applications, since they show great potential (Maheshwari and Nageswari, 2022b). The superiority of one filtering method over another depends on the specific characteristics of the problem being solved, including the nature of the system dynamics, the availability and quality of measurements, computational resources, and desired performance criteria. Implementing a nonlinear KF is quite simple, particularly when the linearized system matrices can be calculated systematically (Maheshwari and Nageswari, 2022c). The effectiveness of estimating the SOC using the KF family algorithm greatly relies on selecting the appropriate filter parameters such as process and measurement noise covariance matrices.
Process noise covariance (Q): This matrix represents the covariance of the process noise, which accounts for uncertainties and disturbances in the state transition process. It captures how much the state is expected to deviate from the predicted value due to process noise. Measurement noise covariance (R): This matrix represents the covariance of the measurement noise, which accounts for inaccuracies and uncertainties in the sensor measurements. It captures how much the actual measurements are expected to deviate from the true state due to measurement noise.
Comparison of various Kalman filters used in SOC estimation.
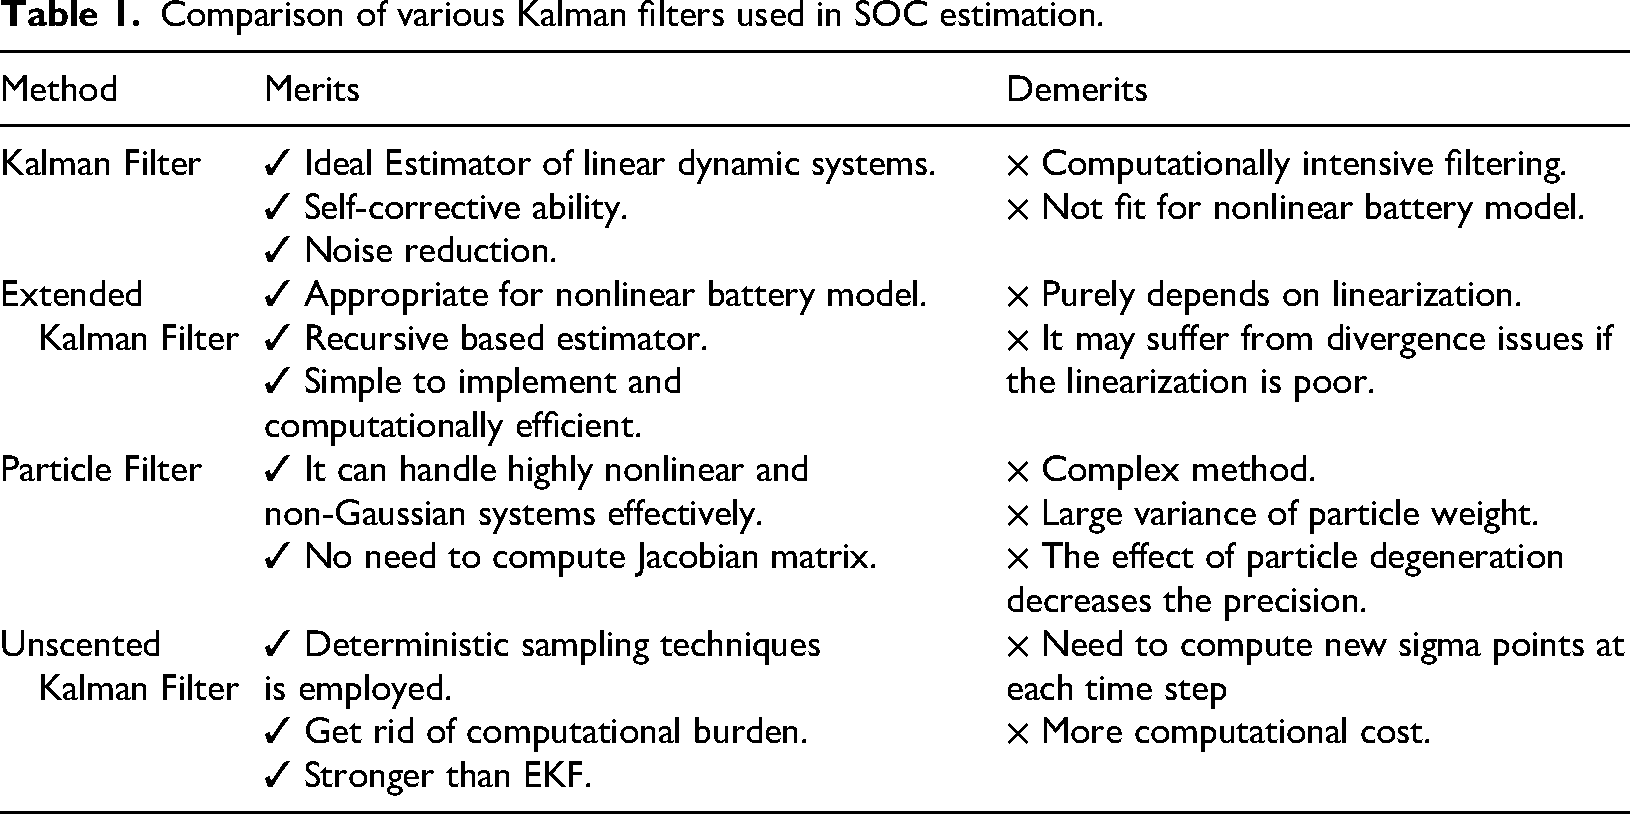
Given that the effectiveness of KF algorithms is directly influenced by noisy covariance matrices, the presence of erroneous values diminishes accuracy and leads to divergence in state estimation (Rout et al., 2024a). Adjusting these parameters requires a good understanding of the system dynamics, noise characteristics, and measurement uncertainties (Rout et al., 2024b). Tuning these parameters involves a trade-off between the filter's responsiveness to changes in the system and its ability to reject noise and uncertainties (Campestrini et al., 2016). The adaptive extended Kalman filter and adaptive unscented Kalman filter are employed to cut the error resulting from inexact noise statistics (Rout et al., 2024b). These adaptive filtering techniques enhance both accuracy and computational complexity. Furthermore, researchers often favour the use of the constant parameters approach. An approach is necessary that can achieve a balance between accuracy and ease in order to estimate the SOC.
According to Kalman theory, a thorough understanding of the process and measurement noise is necessary for accurate state estimate. The adaptive approach or filter tuning aims to obtain the filter statistics Q & R by applying a filter to the measurement data. Adaptive filter tuning refers to the procedure of calculating Q & R and automatically updated at each step. The pursuit of filter tuning is inherent in every viable formulation or variation of the KF, including the EKF, UKF and PF (Propp et al., 2017). Optimal solutions can be achieved by implementing the most practical adjustments. Assessing the impact of different formulations of Kalman filters on performance is challenging unless they are appropriately calibrated.
Hence, it is imperative to examine the influence of KF parameters on SOC prediction utilizing techniques from the Kalman filter family. In this paper, the influence of filter parameters on SOC estimation using nonlinear Kalman filters such as EKF, UKF and PF is explored.
State space model of battery
Battery modeling involves developing mathematical representations of battery behavior to predict its performance under different conditions (Elmarghichi et al., 2021). Modeling is the primary phase in the development of a SOC estimating technique (Peng et al., 2022). The choice of model depends on factors such as accuracy requirements, computational resources, and available data for parameterization and validation. The equivalent circuit model has achieved extensive recognition in model-based SOC estimation because of its succinct nature (Ouyang et al., 2020). The Two RC-ECM, which is a second-order equivalent circuit model, has recently been shown to strike a favourable balance between complexity and accuracy (Qiu et al., 2020). This is frequently employed to define the dynamic behavior of batteries, particularly lithium-ion batteries, in EV applications. This model consists of two resistor-capacitor (RC) pairs connected in series. The combination of these RC pairs allows the model to capture the transient characteristics of the battery, including voltage response to changes in current, as well as relaxation effects during charging and discharging (Seaman et al., 2014).
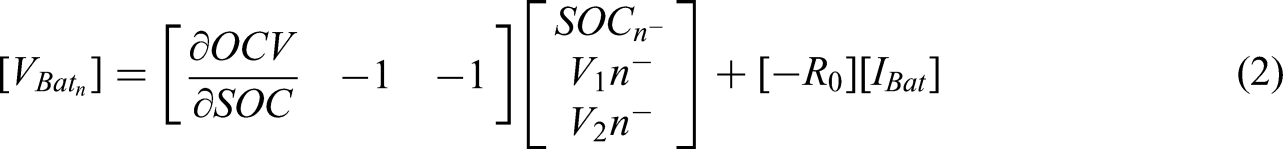
The state space representation of a two RC-ECM can be derived using Kirchhoff's principles. Equation 1 provides the discrete state equation, which incorporates the SOC as one of the states. Equation 2 denotes the observation equation. The above equations use two variables t, which represents the sample interval, and n, which represents the discrete-time step. Given that there are three variables i.e., 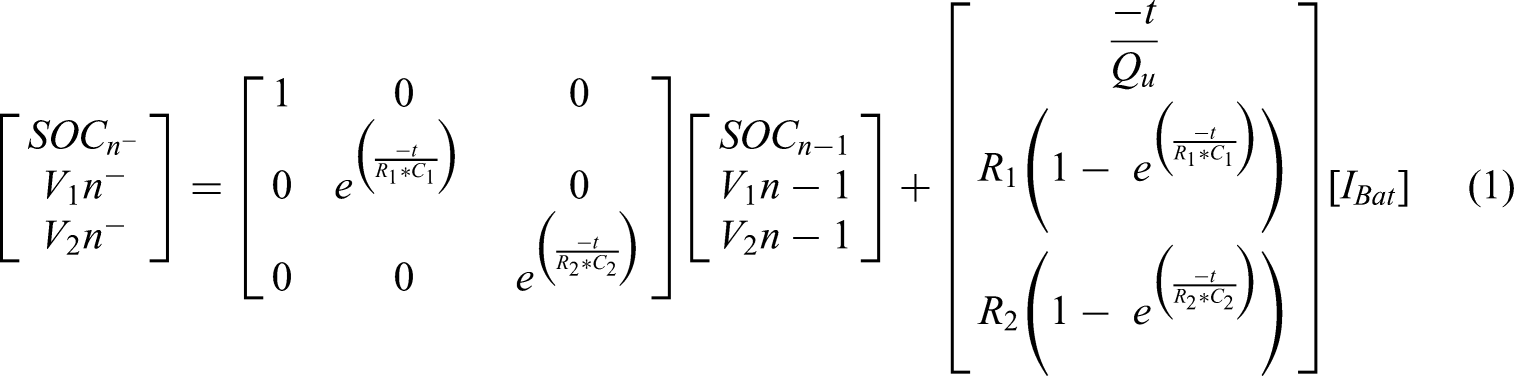
Nonlinear Kalman filters
The literature often focuses on researching nonlinear filters, such as EKF, UKF and PF, because of their exceptional performance in estimating SOC. These filters are particularly preferred due to their model-based construction (Meng et al., 2016, 2017). The precision of the algorithm is directly correlated with its computational complexity. Regrettably, the difficulty of each algorithm escalates in proportion to its accuracy, so rendering the choice of an estimating technique progressively challenging (Papazoglou et al., 2014). This work aims to investigate the impact of filter parameters on state estimation using nonlinear Kalman filters, including the EKF, UKF, and PF.
These measurements are conducted to compare several nonlinear filters under the same conditions.
Each solution utilizes the same two RC battery model. The same battery and a configuration that maintains a constant current discharge are used to test the influence of Q and R on SOC estimation using nonlinear filters.
Extended Kalman filter
EKF is a statistical estimation algorithm that utilizes the information about the model and parameters to estimate the states (Charkhgard and Farrokhi, 2010). The EKF extends the basic Kalman Filter to accommodate such systems by linearizing the nonlinear equations around the current estimate. Due to its utilization of fundamental matrix operations, the EKF can be easily integrated into onboard Battery Management Systems (BMS), providing significant benefits in EV applications. EKF state estimation process, which involves prediction step and update step, as shown in Figure 1.
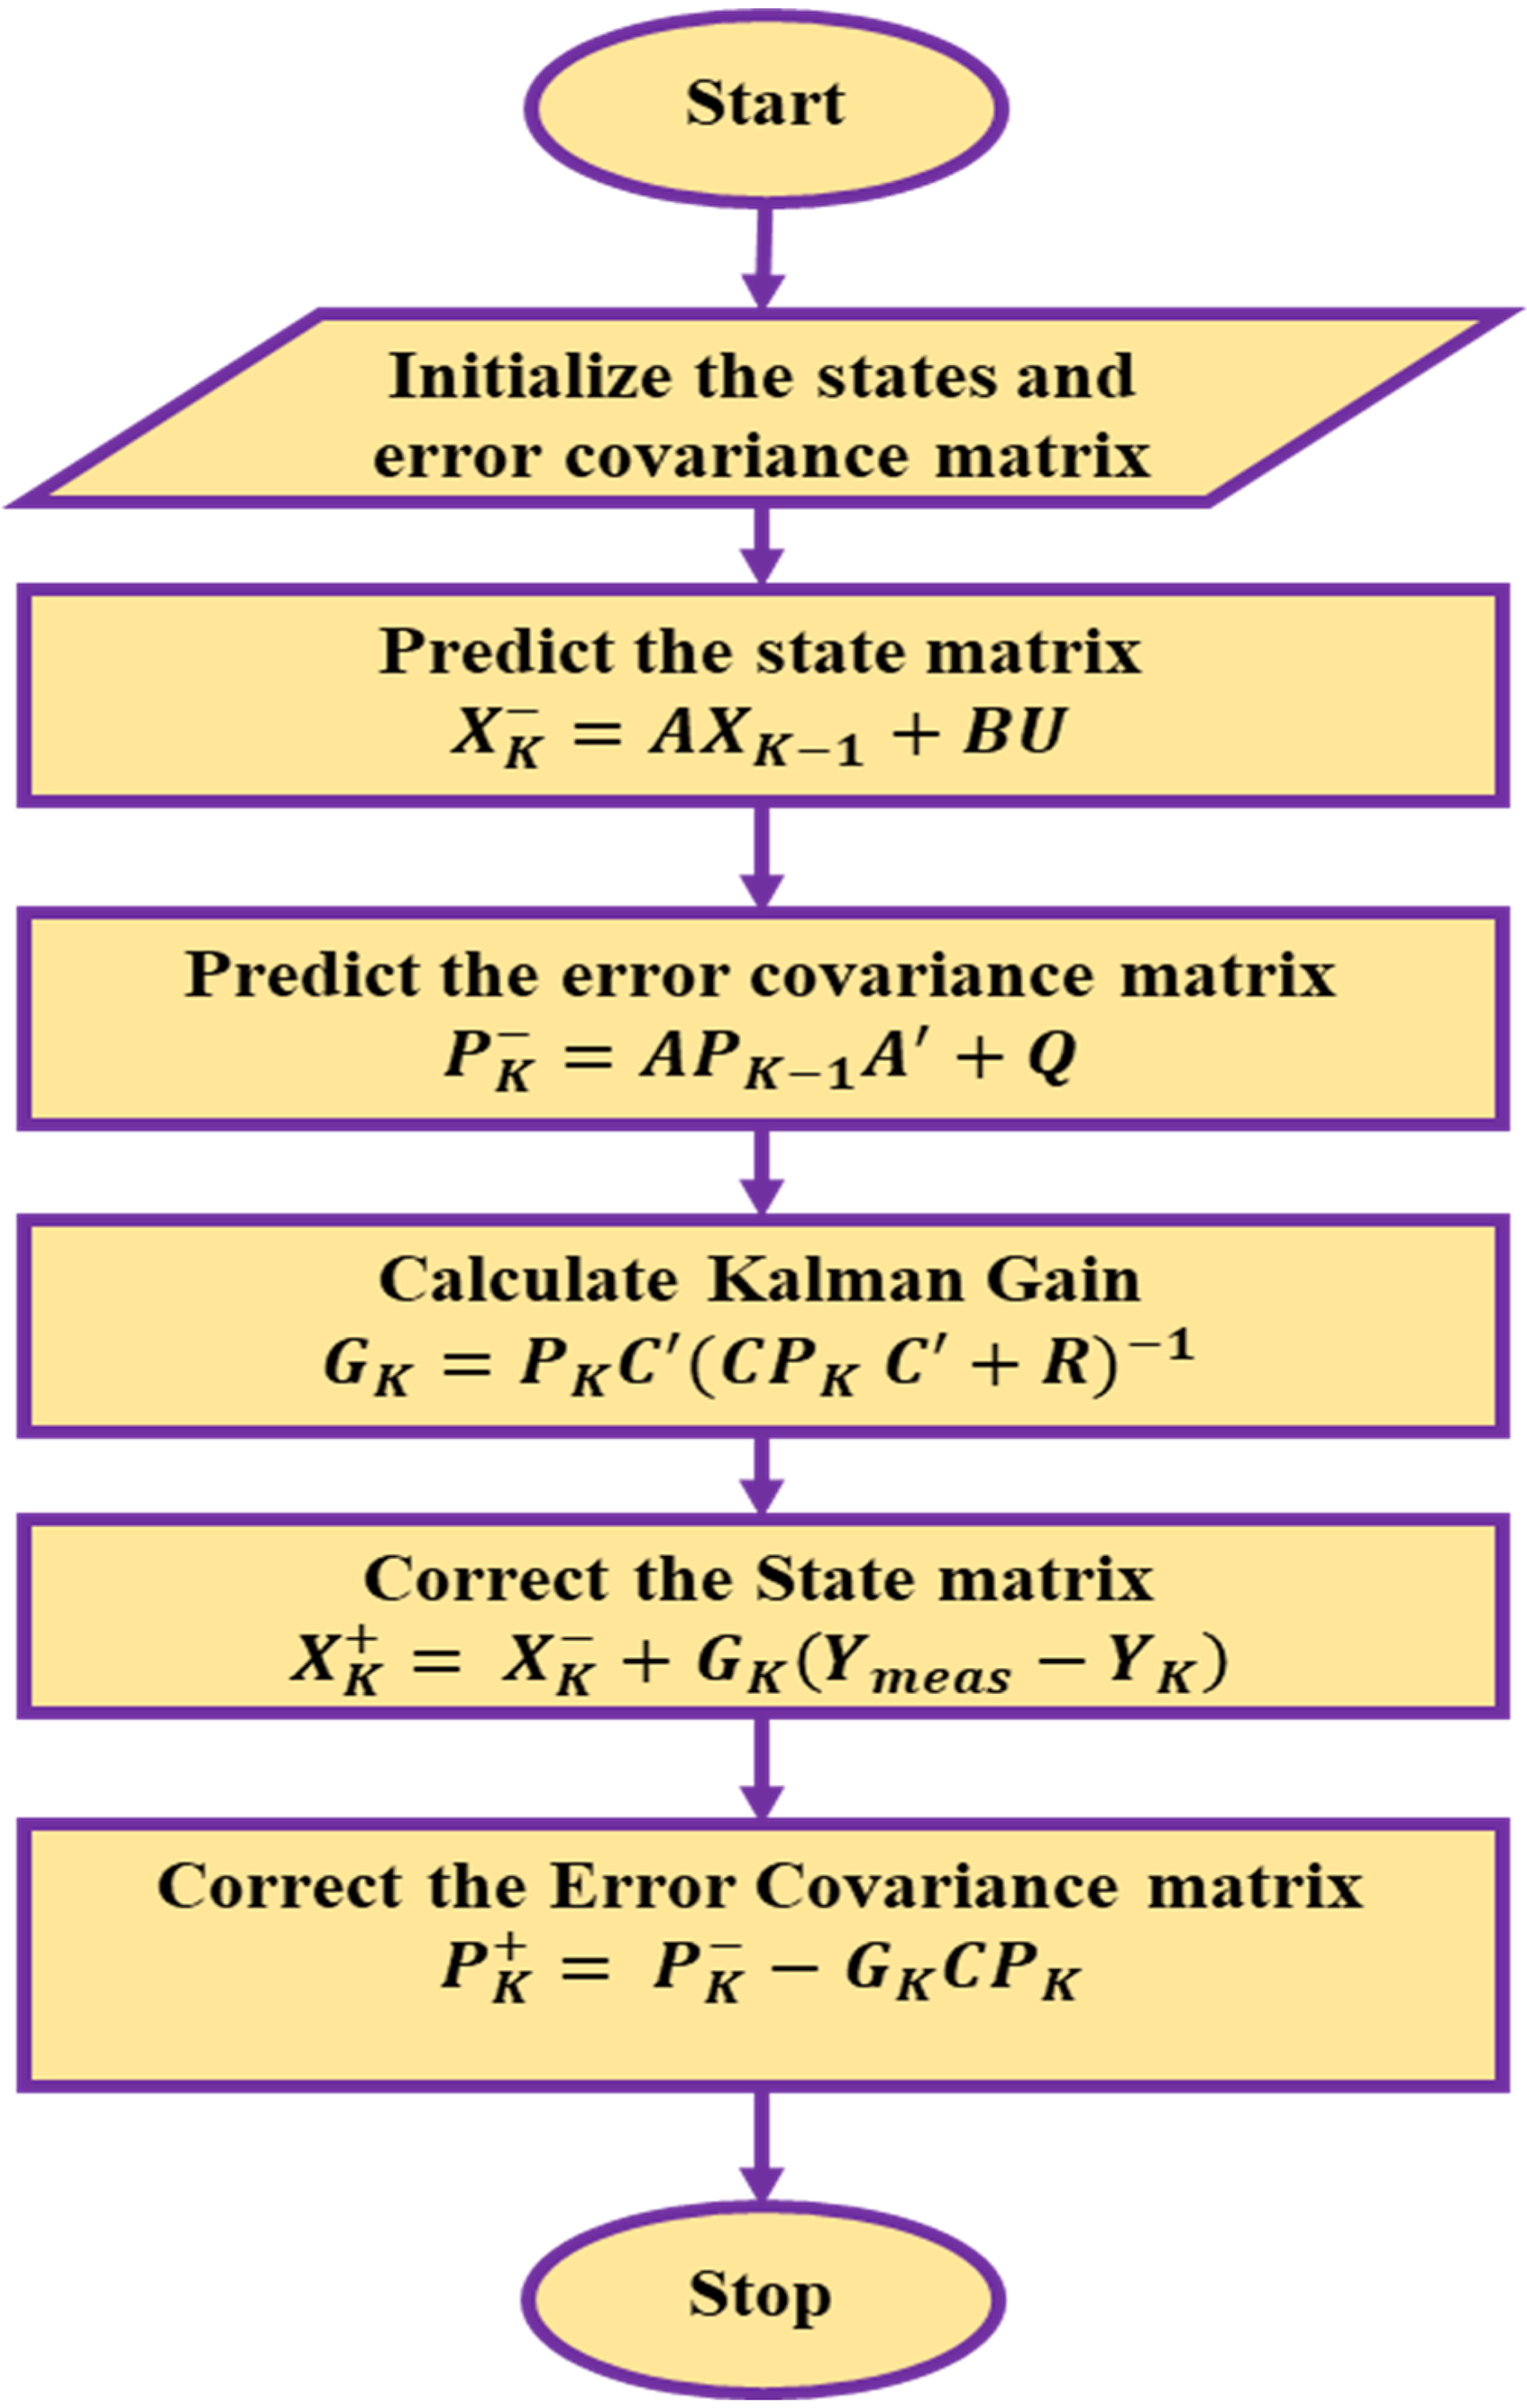
EKF state estimation process.
Prediction Step: The EKF starts with a prediction of the current state based on the system's dynamics model. This prediction involves two main steps:
➣ Projecting the current state estimate forward in time using the system's dynamics model (often represented by a set of nonlinear equations). ➣ Projecting the error covariance matrix forward using the linearized dynamics model.
Update Step: In this step, new measurements are incorporated to update the state estimate and its uncertainty. The steps involved are:
➣ Computing the measurement prediction based on the current state estimate and the measurement model (often nonlinear). ➣ Linearizing the measurement model around the predicted measurement. ➣ Computing the Kalman gain, which determines how much the predicted state estimate should be adjusted based on the new measurement. ➣ Updating the state estimate using the difference between the actual measurement and the predicted measurement, weighted by the Kalman gain. ➣ Updating the error covariance matrix to reflect the incorporation of the new measurement.
The EKF is a powerful tool for state estimation in nonlinear systems, but it requires careful consideration and tuning to ensure accurate results.
Unscented Kalman filter
The UKF is an alternative to EKF for estimating the state of nonlinear dynamic systems. It addresses some of the limitations of the EKF, particularly regarding the linearization of nonlinear functions, which can lead to inaccuracies, especially when the nonlinearities are significant. A linearization of state space equations is not necessary for the UKF (Yu et al., 2010). It employs a nonlinear unscented transformation to iteratively and accurately update the state and error covariance of the nonlinear model (Xiong et al., 2017). The sigma points for the unscented transformation are selected in a manner that ensures precise knowledge of their mean and covariance.
Each sigma point is then subjected to the system state function to generate more sigma points, and their statistical features are used to determine the newly approximated mean and covariance (Yang et al., 2016). Similarly, every sigma point undergoes the measurement function, resulting in the calculation of the mean and covariance of the measurement, as well as the cross covariance between the state and measurement (Gholizade-Narm and Charkhgard, 2013; Zhao et al., 2018). The SOC estimate for a battery can be constructed using the UKF, as shown in Figure 2.
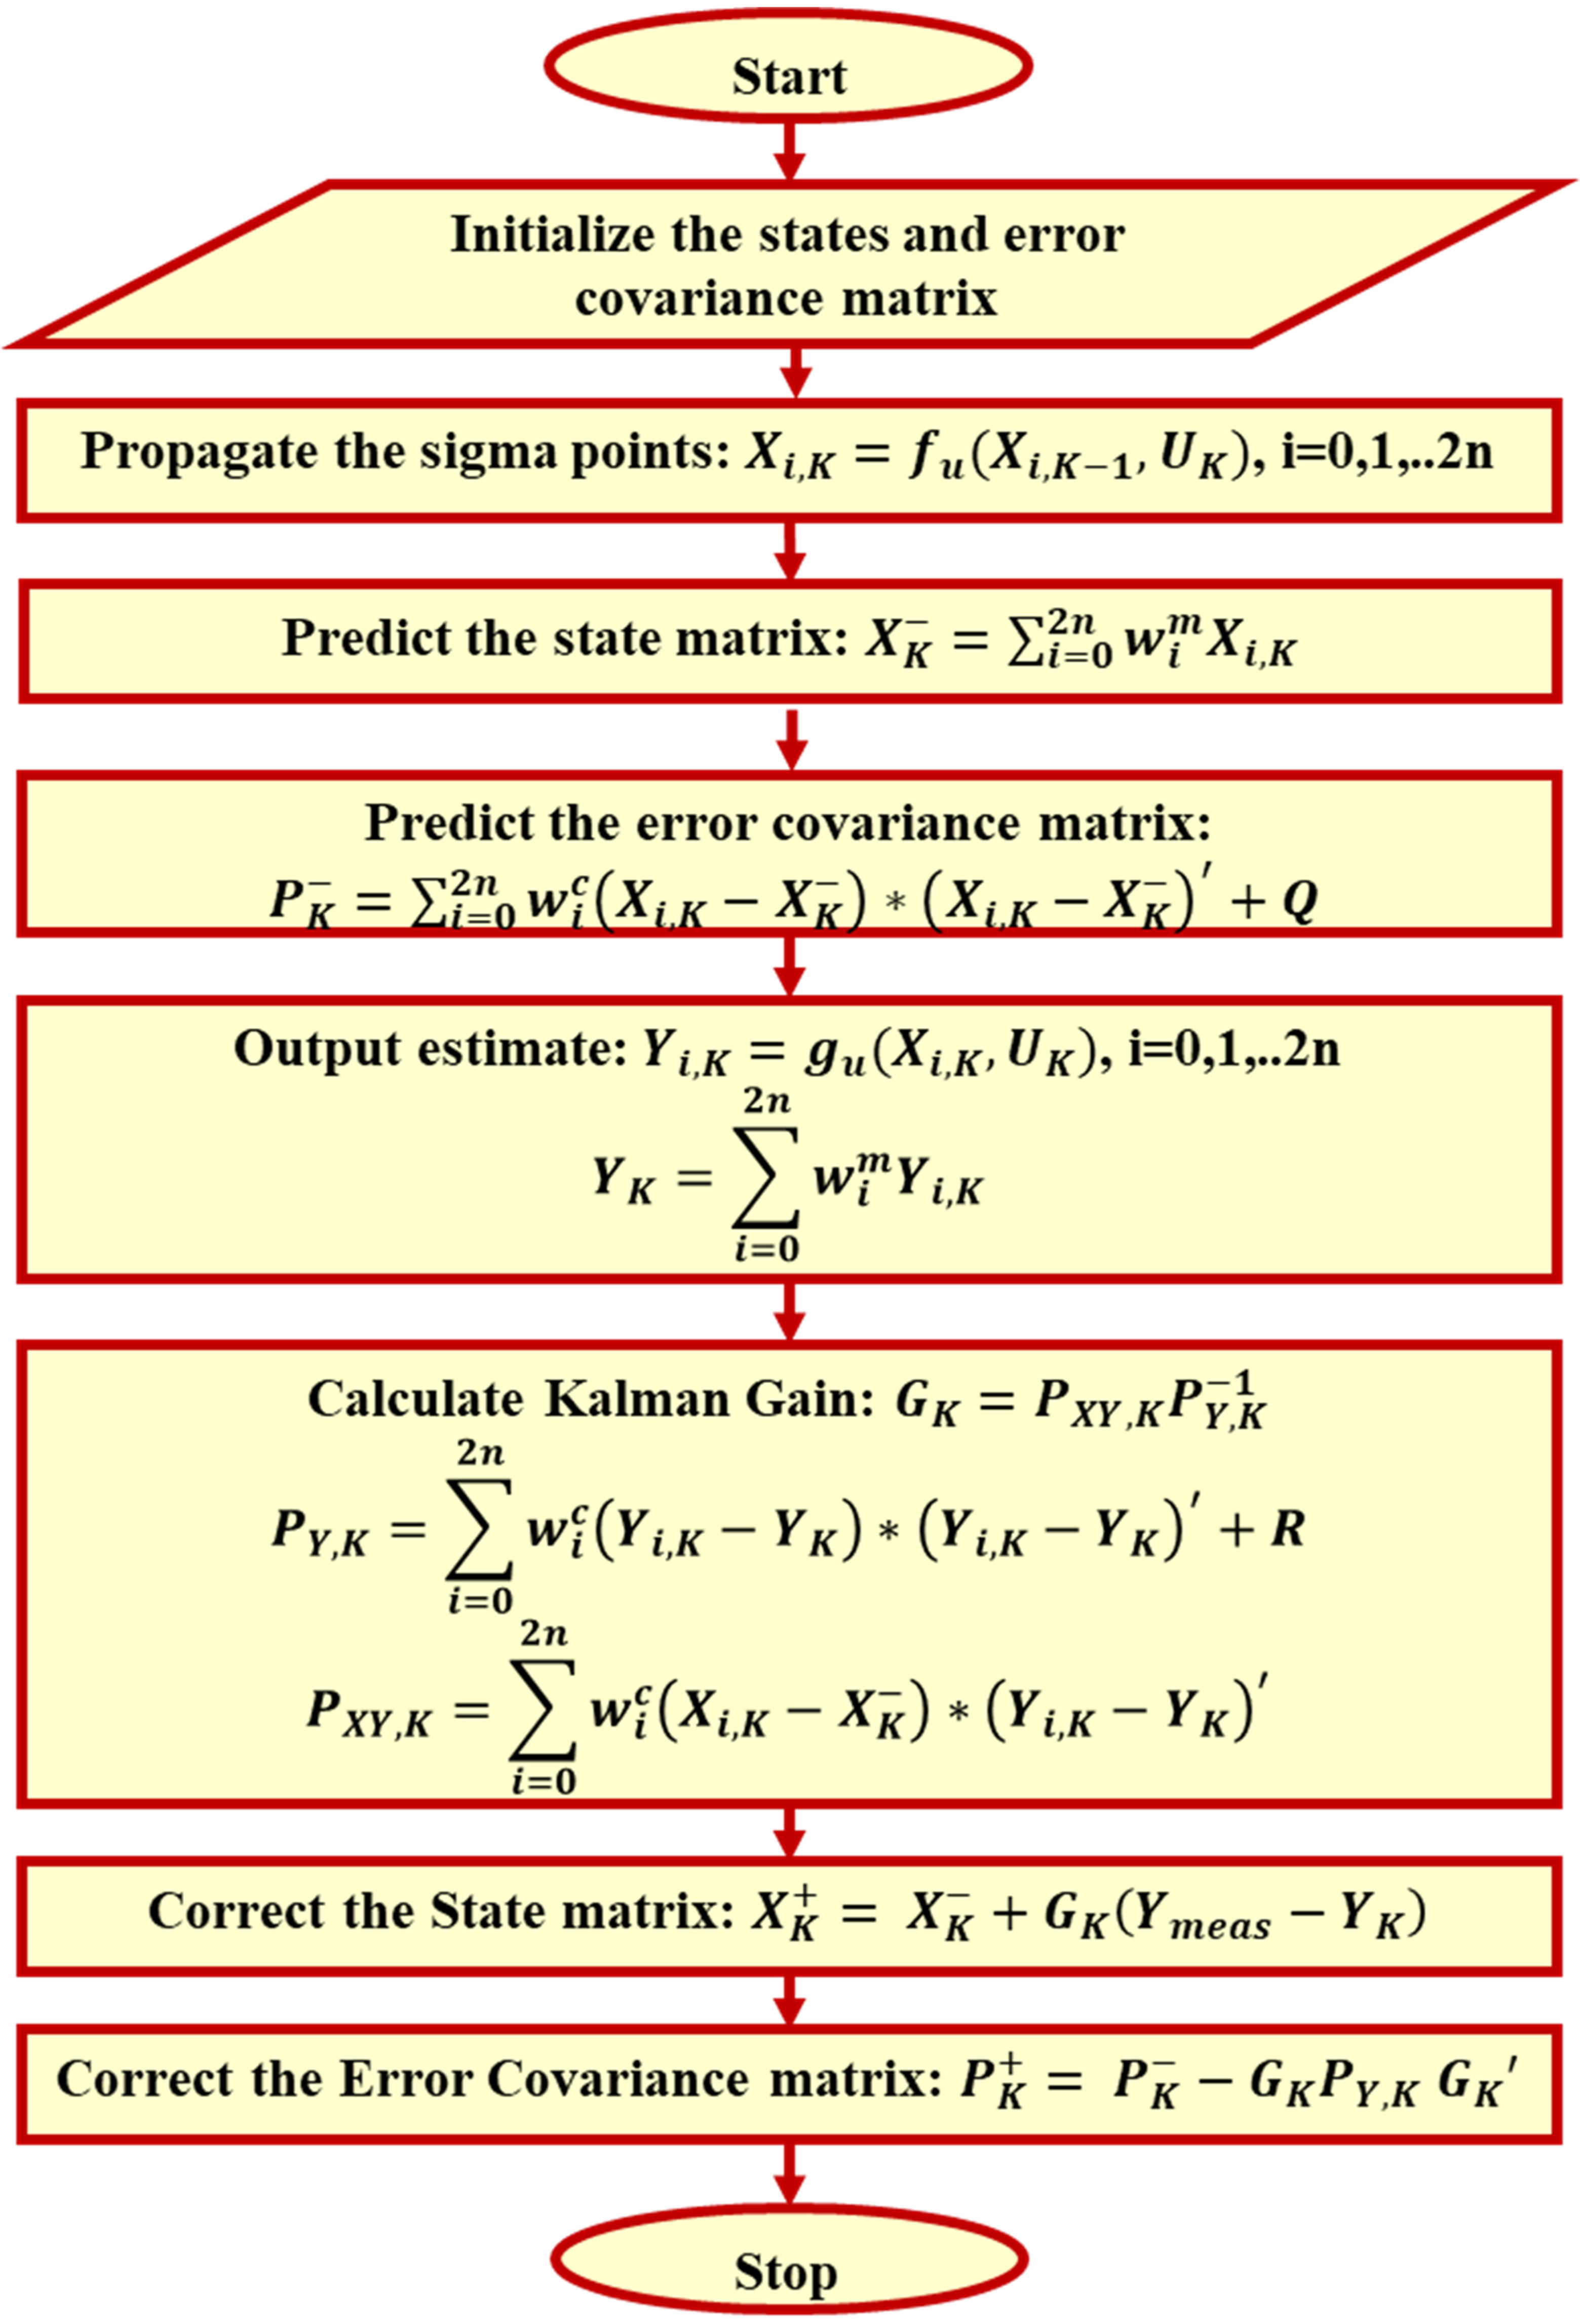
Estimation process of unscented Kalman filter.
The observer is capable of computing the voltage using the model. The Kalman gain is tuned automatically on the basis of the difference between the observed and estimated system output, with the aim of obtaining a more precise SOC. Erroneous estimated values will lead to significant measurement errors, hence increasing the ideal Kalman gain required for efficient closed-loop feedback to correct the estimated values. Upon reaching a sufficient number of iterations, the estimation outcomes will accurately converge to the exact value.
Particle filter
While the EKF & UKF produces good outcomes, it necessitates that the noise of the system conforms to a Gaussian distribution. PF is a versatile method that may be applied to systems that are both non-linear and non-Gaussian. PF has found extensive application in object detection and autonomous control. However, its utilization in SOC estimation is a relatively recent development. In this study, the performance of PF, UKF, and EKF has been examined and compared to assess its potential suitability for SOC calculation. Figure 3 depicts the flowchart of the particle filter. PF is a statistical filtering approach that relies on Monte Carlo methods and the Bayesian principle.
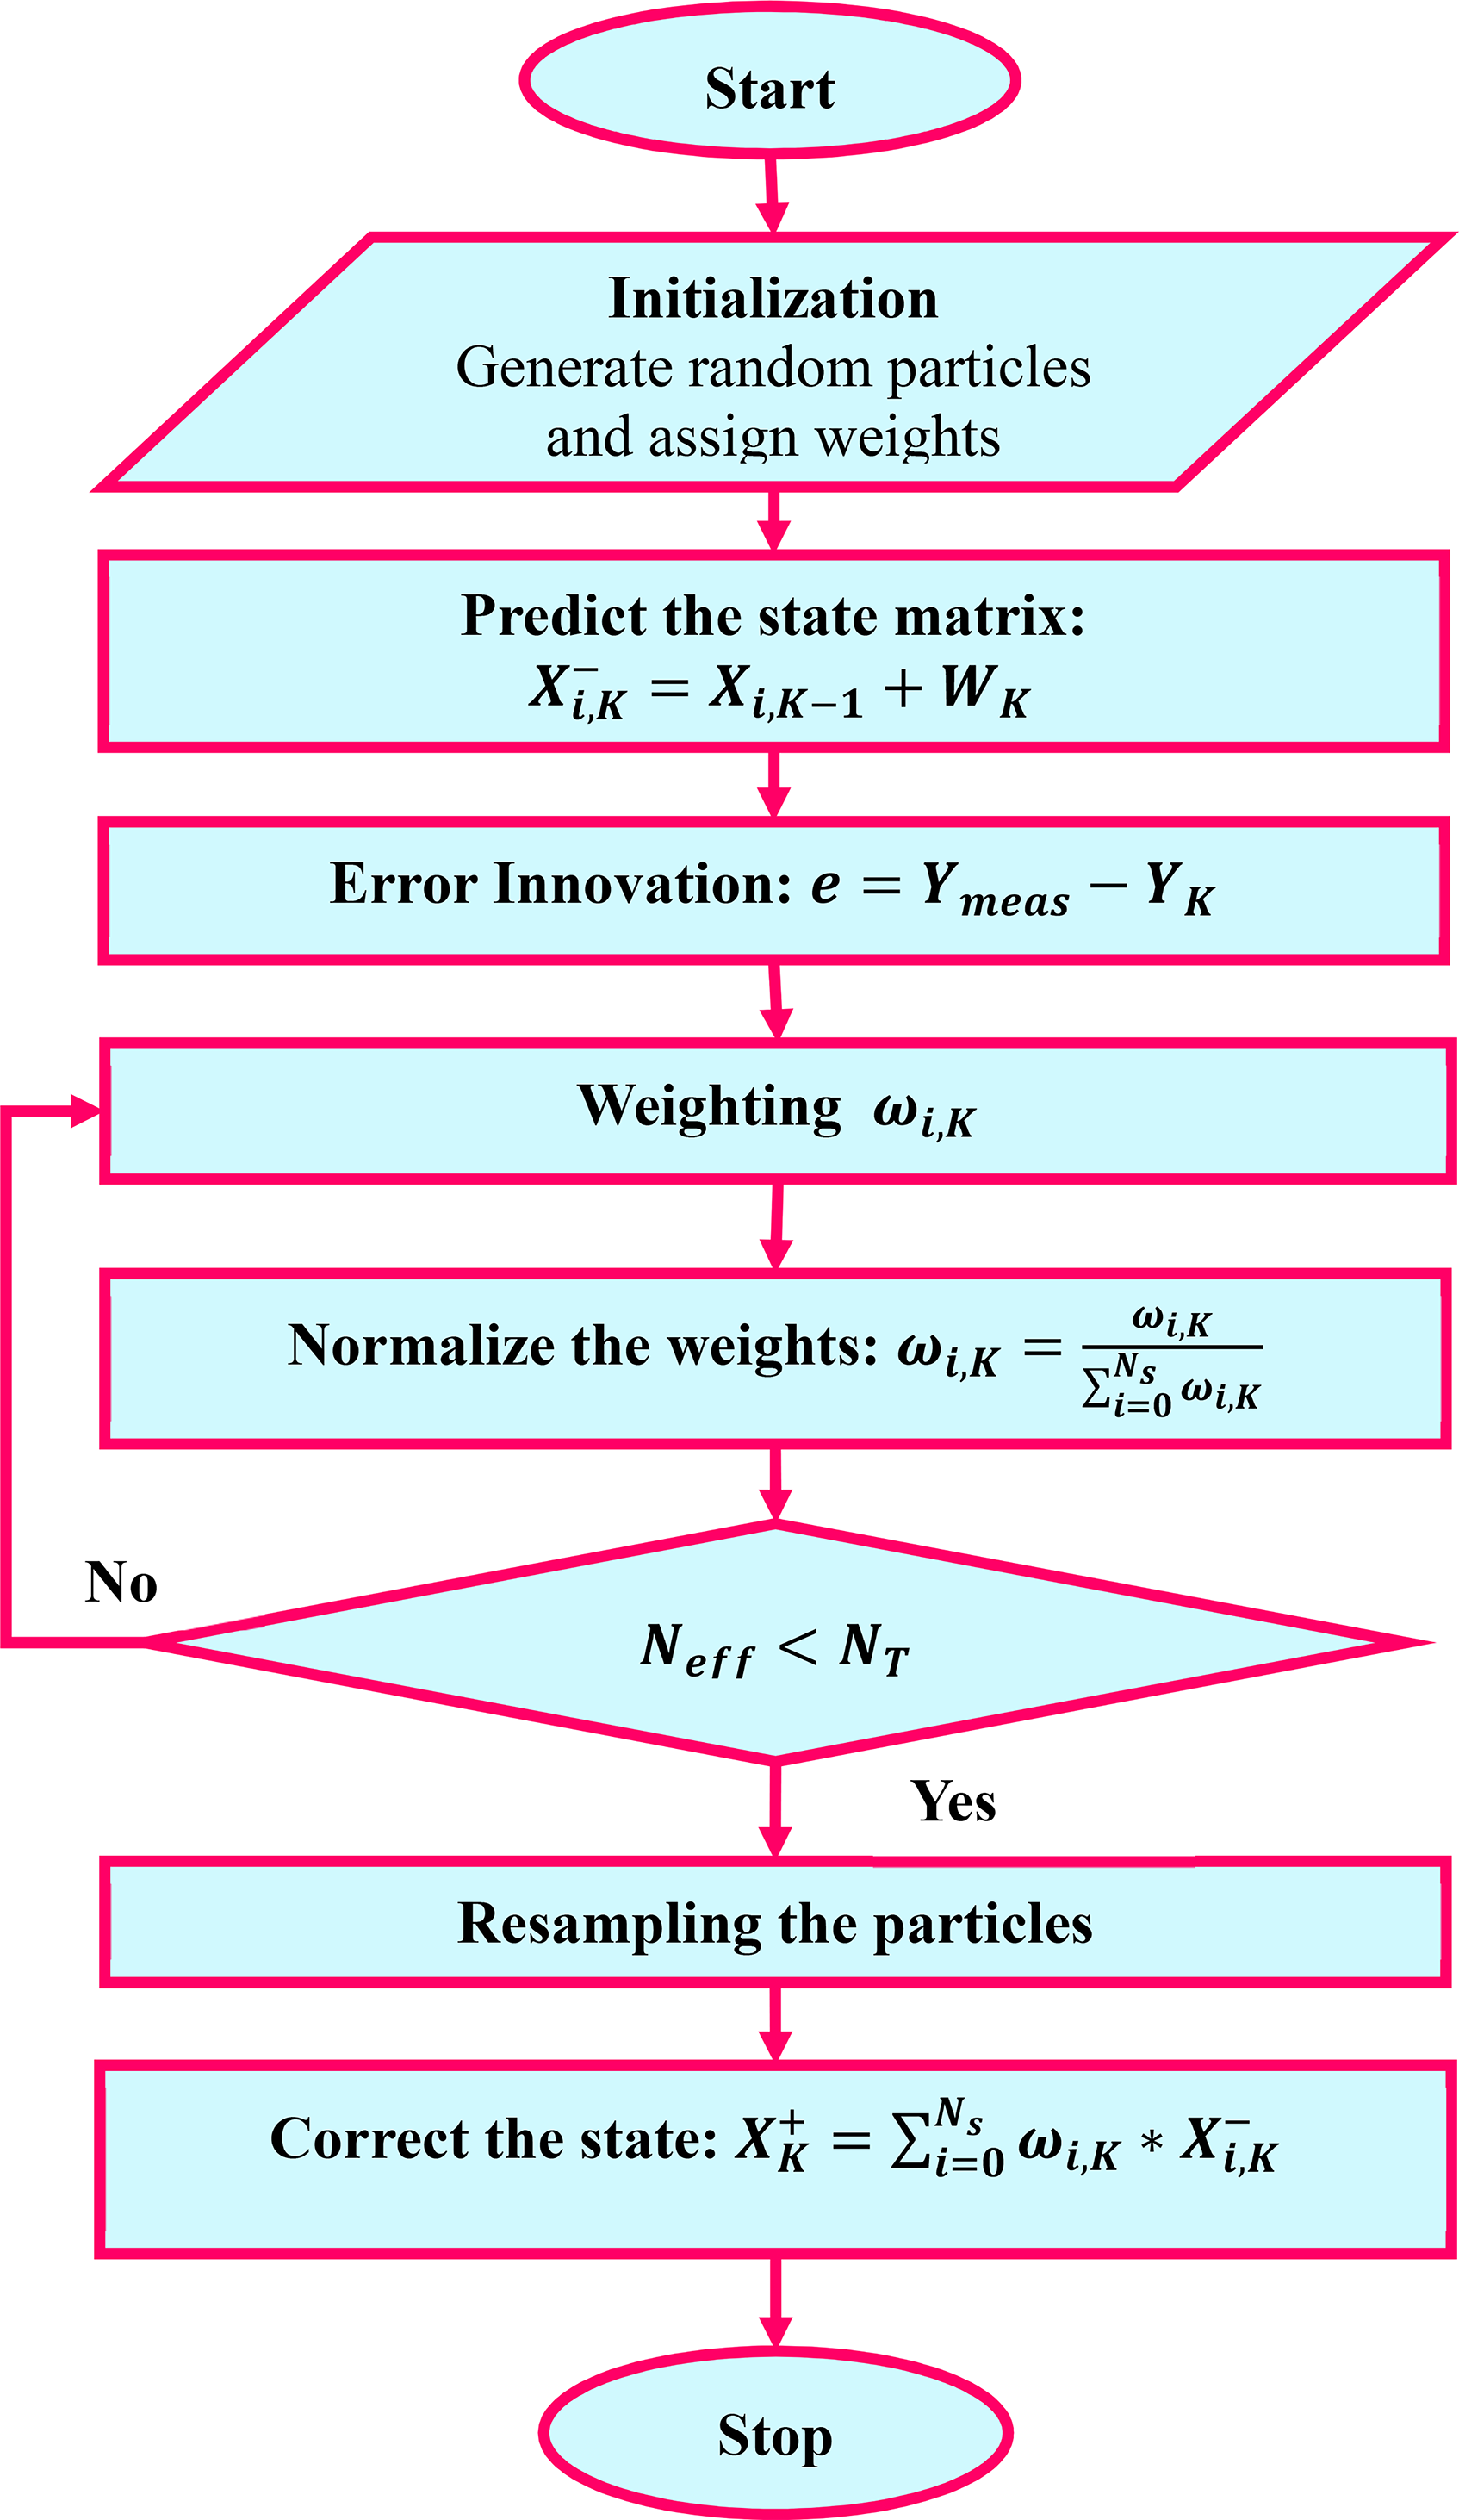
Flowchart of particle filter.
The fundamental concept of PF is to allocate weights to particles (samples) obtained from the posterior probability in order to depict a probabilistic distribution (Zhang et al., 2019). PF is more versatile than EKF & UKF as it can be applied to nonlinear systems that have non-Gaussian distributions.
Bayesian estimation can be employed to estimate the system's state described in Equation 1 through a two-phase process. Nevertheless, this relationship appears to be straightforward, but the exact mathematical expression for the posterior distribution is often unknown. The Monte Carlo technique utilizes a substantial number of weighted particles to estimate the posterior distribution. In this situation, a set of Ns randomly created particles is present. The weight of each particle is assigned as 1 divided by the total number of particles (Ns), ensuring that the sum of all particle weights equals one.
Analysis of filter parameters on SOC estimation
The efficacy of the nonlinear KF is totally contingent upon the meticulous selection of the filter parameters. Selecting a value for these parameters poses a challenge due to the stochastic and indeterminate nature of the noises. The convergence rate and precision in estimation are greatly influenced by the values of these parameters. Figure 4 demonstrates the influence of Q & R on SOC estimation outcomes.
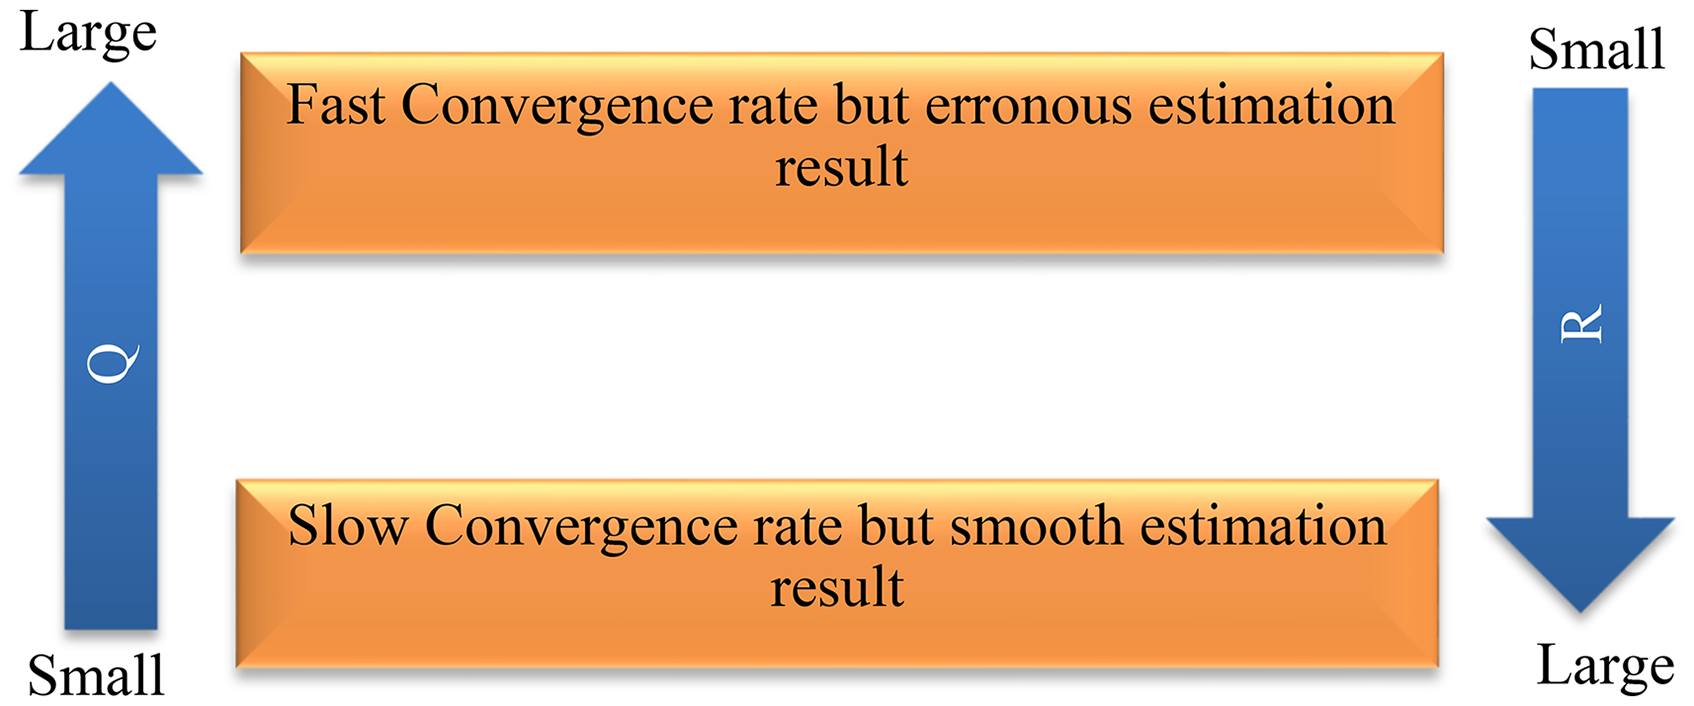
Filter parameters on estimation results.
The relationship between R and Q is negative due to their presence in the observation and state equations, respectively. The Q factor represents the average rate of change in the state, which indirectly affects the estimate precision by controlling how quickly previous data is elapsed. The impact of R is completely contrary to Q. Improper selection of statistics for simultaneous recursive estimation can lead to overestimation of R and underestimation of Q, and vice versa. Hence, it is crucial to ensure the overall efficacy of the KF family algorithm. To tackle this issue, the authors proposed an alternative adjustment of the parameters Q and R in this article.
Simulation results and discussion
In model-based estimating approaches, the discrepancy between the sensor's voltage and the battery model's output is employed as feedback to correct the SOC. Its closed-loop design enables it to handle unpredictable initial SOC (Maheshwari and Nageswari, 2022d). The verification of the state estimation process for two RC-ECM has been conducted. Simulink is used for building the battery model, and MATLAB code is developed for the EKF implementation. In the discharging scenario, it is assumed that the initial SOC is 100%. The initial values for the state are selected as [1 0 0]T. The signal builder is used to communicate the measured data. The electric current is applied into the battery model. Due to the independent nature of states, the matrix P is selected to be a diagonal matrix.
Following each phase, the revised values are reintroduced into the system, namely, the states (X) and error covariance matrix (P) are changed with a new value. An analysis is conducted on the influence of Q & R matrices on estimate prior to the selection of the value. Only the 2.6Ah Li-ion battery is utilized solely for the purpose of analysis. After selecting suitable values, the proposed estimation algorithm based on ECM is tested for discharging situations at different C-rates.
Impact of KF parameters on state estimation
The filter parameters (Q and R) need to be balanced between minimizing assessment error and maximizing convergence rate in estimation. Erroneous values diminish the precision and make divergent in state assessment. When the value of Q is less than R, the predictable value gradually approaches the observed data and produces a seamless outcome. Increasing Q accelerates the convergence rate and also results in estimate inaccuracy. Conversely, if the value of R is excessively high, the Kalman gain is diminished, resulting in an estimate that diverges. Optimizing the values of filter parameters is essential for enhancing estimation accuracy. The investigation involved conducting a simulation of a Li-ion with a capacity of 2.6Ah at a discharge rate of 1C.
Figure 5 depicts the impact of Q and R on voltage and SOC curves using ten different datasets containing measured values. To compare, the influence of filter parameters on state estimation using three nonlinear filters is investigated. This analysis is depicted in Figure 5a, Figure 5b, and Figure 5c, respectively.
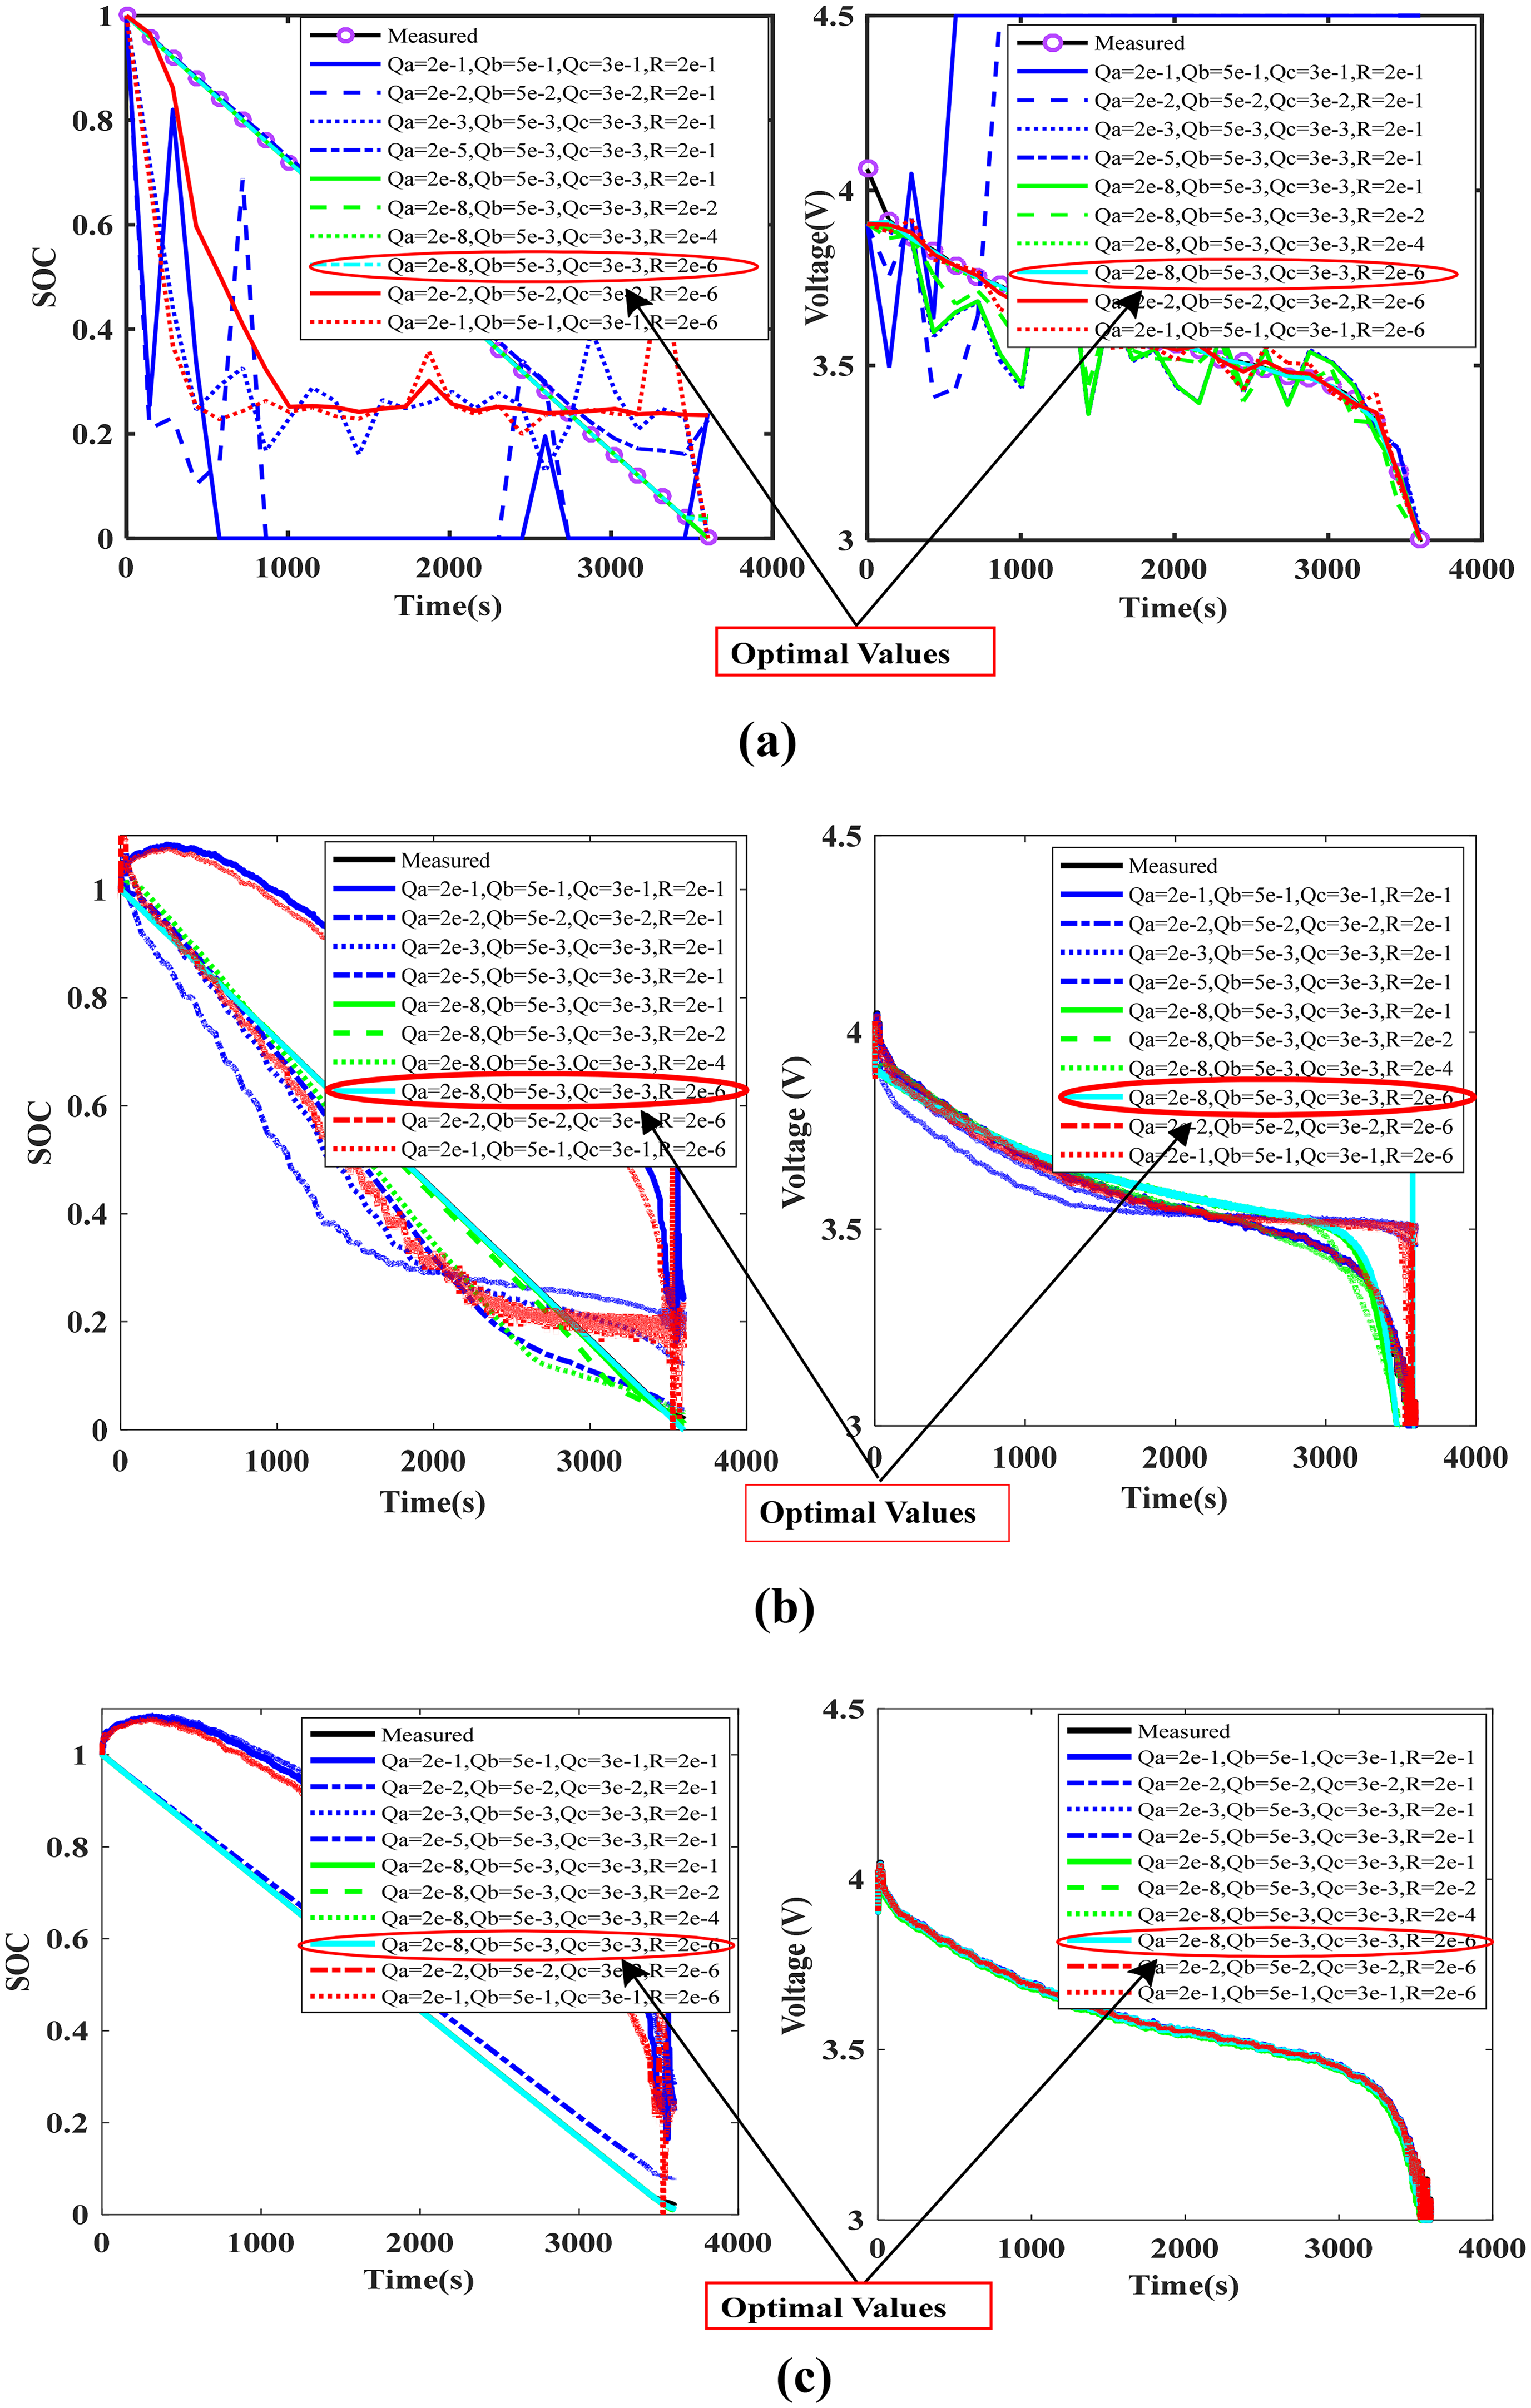
Optimal value of Filter parameters by comparing 10 dissimilar combinations with observed data (a) EKF (b) UKF (c) PF.
Any erroneous combination does not yield effective filter action, and even if it does, it generates inappropriate outcomes, as depicted in Figure 5. Due to the laborious nature of simultaneously adjusting both matrices, the values of Q matrix are tweaked while the R matrix remains constant. Figure 5 indicates that higher Q-values result in an increase in both estimating error and convergence rate. Reducing Q leads to a decrease in the state estimate error, resulting in a smooth convergence, as depicted in Figure 5. Irrespective of the kind of filter, it is crucial to tune the filter in order to minimize the effect of Q & R on SOC estimation.
After a tuning, the values of filter parameters are chosen as follows: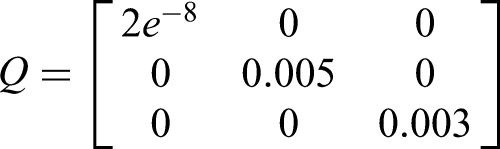
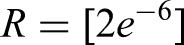
Hence, it is necessary to employ a technique that enables us to identify refined solutions, which may be easily adjusted with minimal computational work. Biased estimates may arise in the filters, particularly when incorrect noise covariances are provided for unknown variables. Even with knowledge of the model parameters, if the filter parameters are inaccurately reported, the filter may generate erroneous estimations or even diverge. The quality of fit is determined by calculating the mean square error (MSE) of the SOC and voltage. These calculations are performed for various filter parameters and compared to the observed data, as presented in Table 2.
Numerical results for the goodness of fit.
Model validation
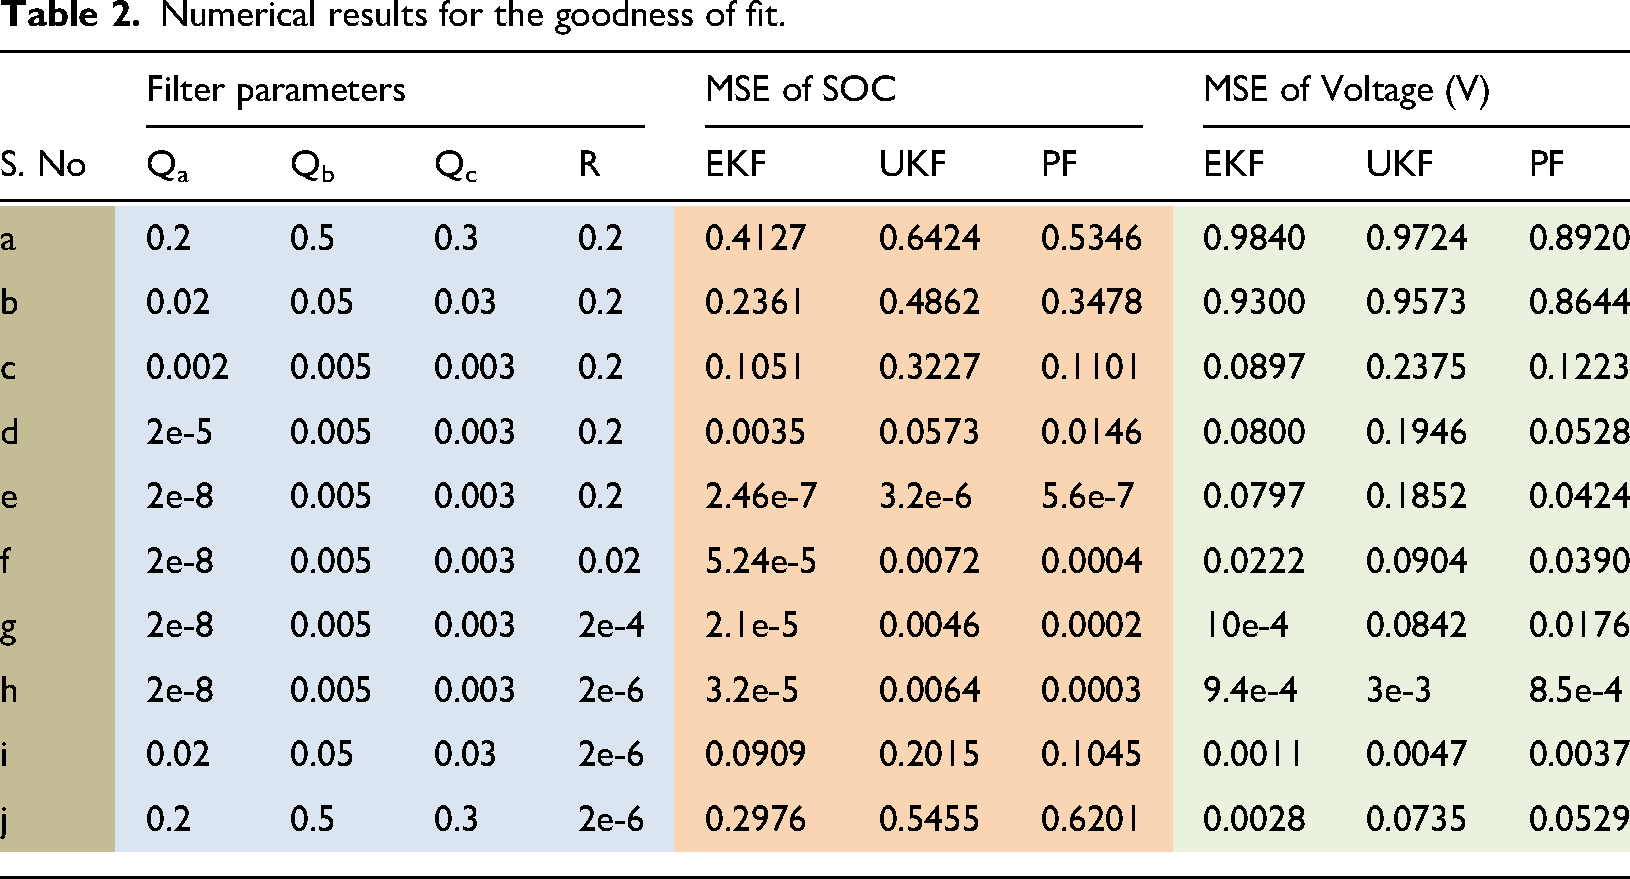
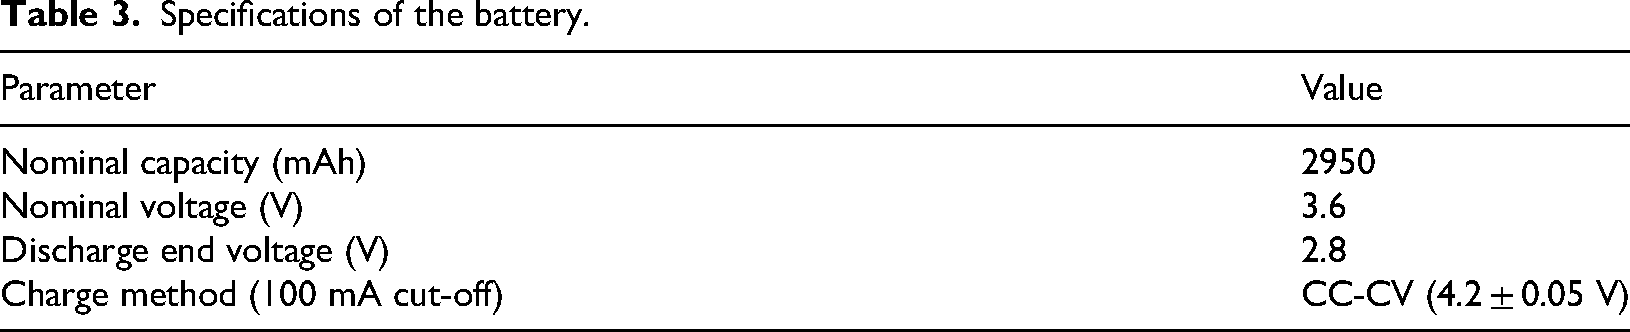
Figure 6 depicts the experimental setup for battery testing. Chroma 17020 Regenerative Battery Test System can achieve specific charge and discharge process. The Chroma 17020 system offers versatile programming capabilities and can be controlled by Chroma's advanced “Battery Pro” software. The capabilities of Battery Pro enable quick and straightforward test development, removing the need for time-consuming scripting or programming by a software engineer. The host computer is set up for communication and interaction. Temperature is controlled to be maintained at 25 deg. The current and terminal voltage are sampled every 1second and saved in the host computer. One cycle comprises one charging process and one discharging process. If one cycle is over, batteries would rest for 40 min. The usable capacity is noted every 10 cycles. Laborious calibration tests are carried to get the correspondence of OCV and SOC. Table 3 shows the specifications of the battery used in the experiment.
Experimental setup (a) Chroma 17020 battery test system (b) Li-ion battery involved in the test.
Specifications of the battery.
SOC can be tracked using a variety of datasets. Typically, data is divided into two categories: experimental data and EV drive cycle data. The experimental data include information gathered through experimental procedures to evaluate the battery's performance. To assess SOC, two types of experimental data are typically used: (1) constant discharge test (CDT) and (2) hybrid pulse power characterization (HPPC) test. Among the three filters, the EKF algorithm is elected for validate the suggested parameter values, specifically for a uniform current discharging condition at different C-rates and HPPC test.
Constant discharge test (CDT)
The lithium-ion battery is fully charged before the test began using the constant current constant voltage method. CDT is carried out by draining the battery current at predetermined rates. In a battery, charging and releasing rates are governed by C-rate. With 1C, battery can completely charge or release its energy in one hour. The CDT has been performed at a discharged current until the battery discharge voltage met the lowest threshold value. In Figure 7, the solid line depicts the measured data, while the result derived using the EKF method is shown by a marker. The influence of the C-rate on the overall discharge behaviour of the battery is also examined.
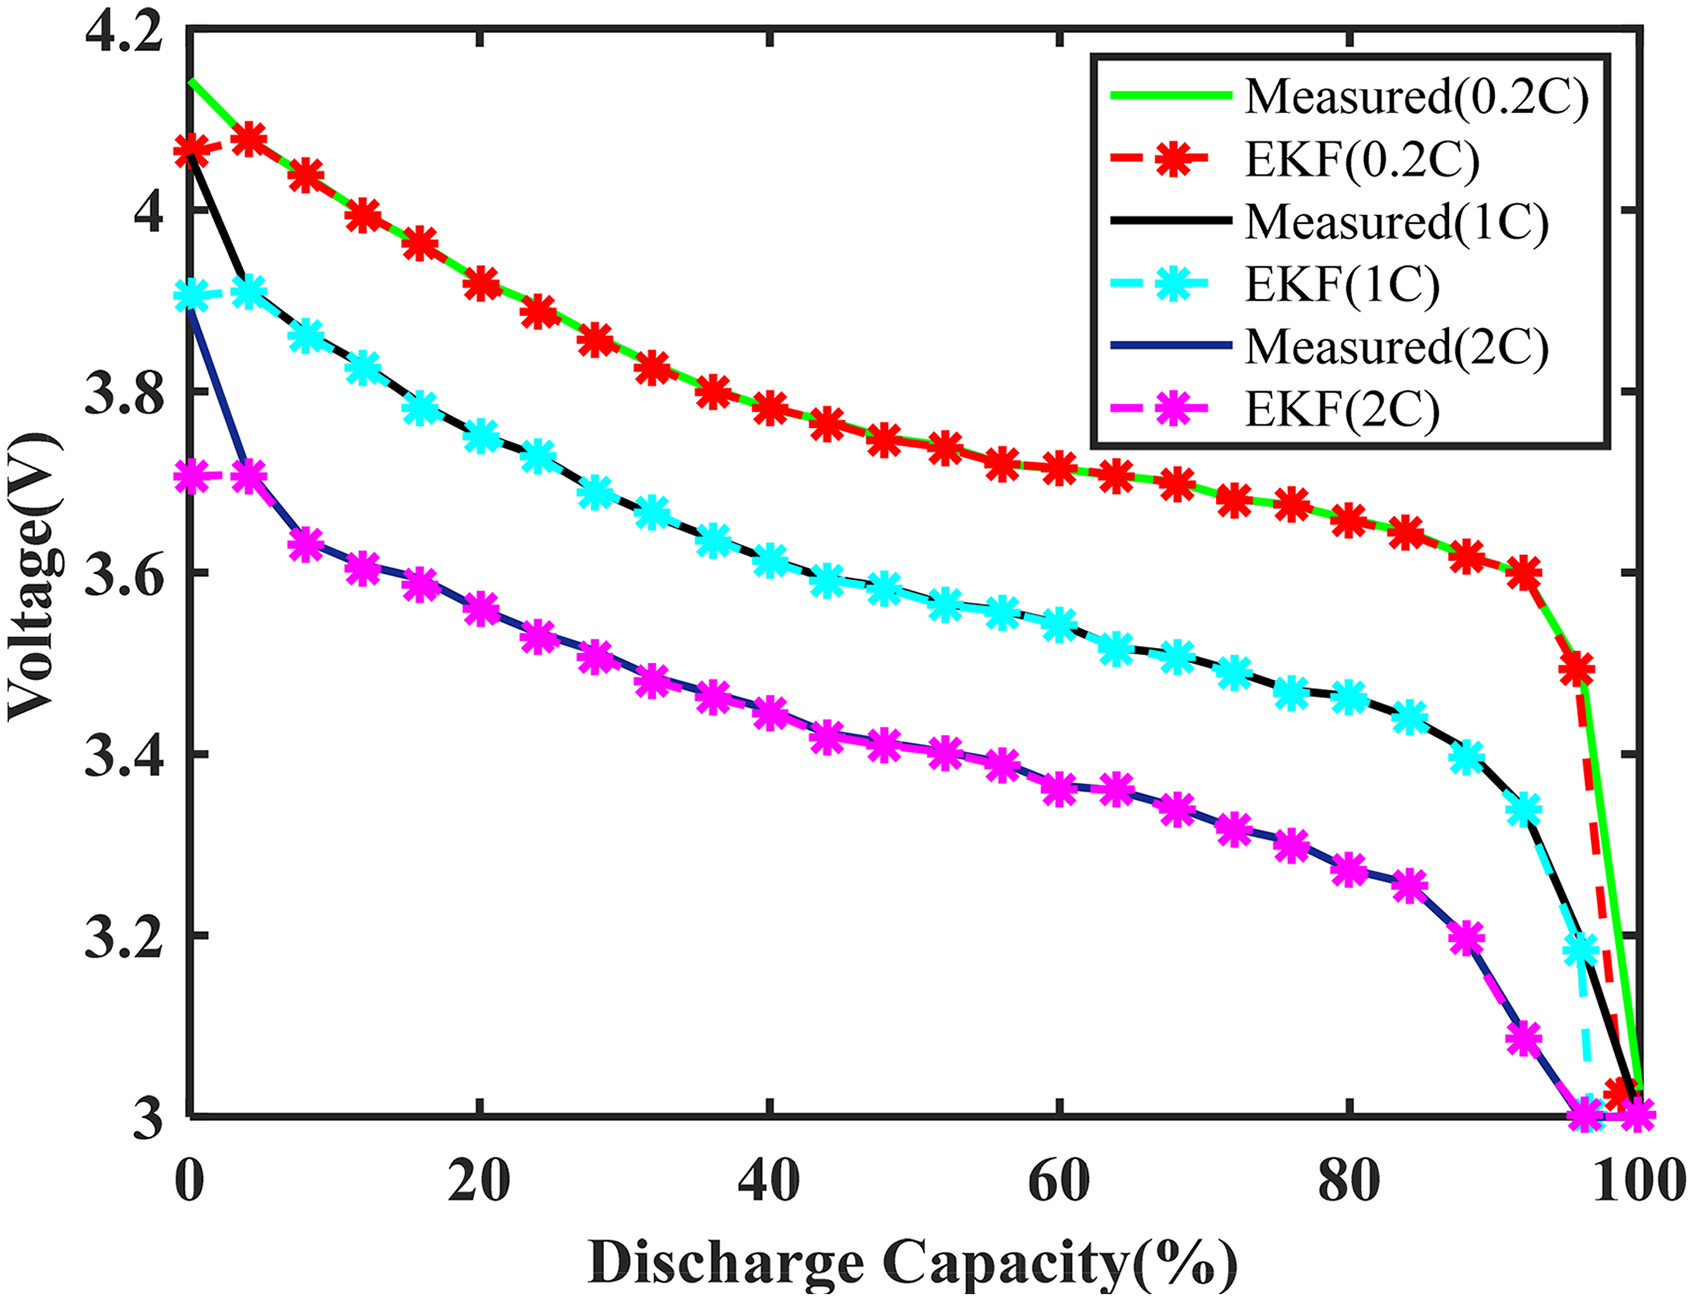
Comparison of EKF result with measured data at various current rates.
Figure 7 demonstrates a negative correlation between the discharge current rate and the discharge capacity. As C-rate increases, the battery's discharge capacity decreases. Typically, the efficiency of draining a battery is lower than the efficiency of charging it. Furthermore, a rise in the C-rate has a profound impact on the efficacy of battery discharge. It is observed that the EKF results fit the measured data very well. Also, as the C-rate goes up, the discharge capacity goes down. To make the battery last longer, a low C-rate is suggested.
Hybrid pulse power characterization (HPPC) test
In contrast, the HPPC test uses ordered charge and discharge current pulses with specified current rates including a 40 seconds rest interval. HPPC aims to reduce battery SOC by 10% per cycle by assigning particular time intervals and discharge current values. Figure 8 depicts the estimation results under HPPC test. With a tolerable level of estimation error, the estimated SOC values, shown in green, can track the variation of the reference SOC, shown in red, during both the discharging and charging pulses.
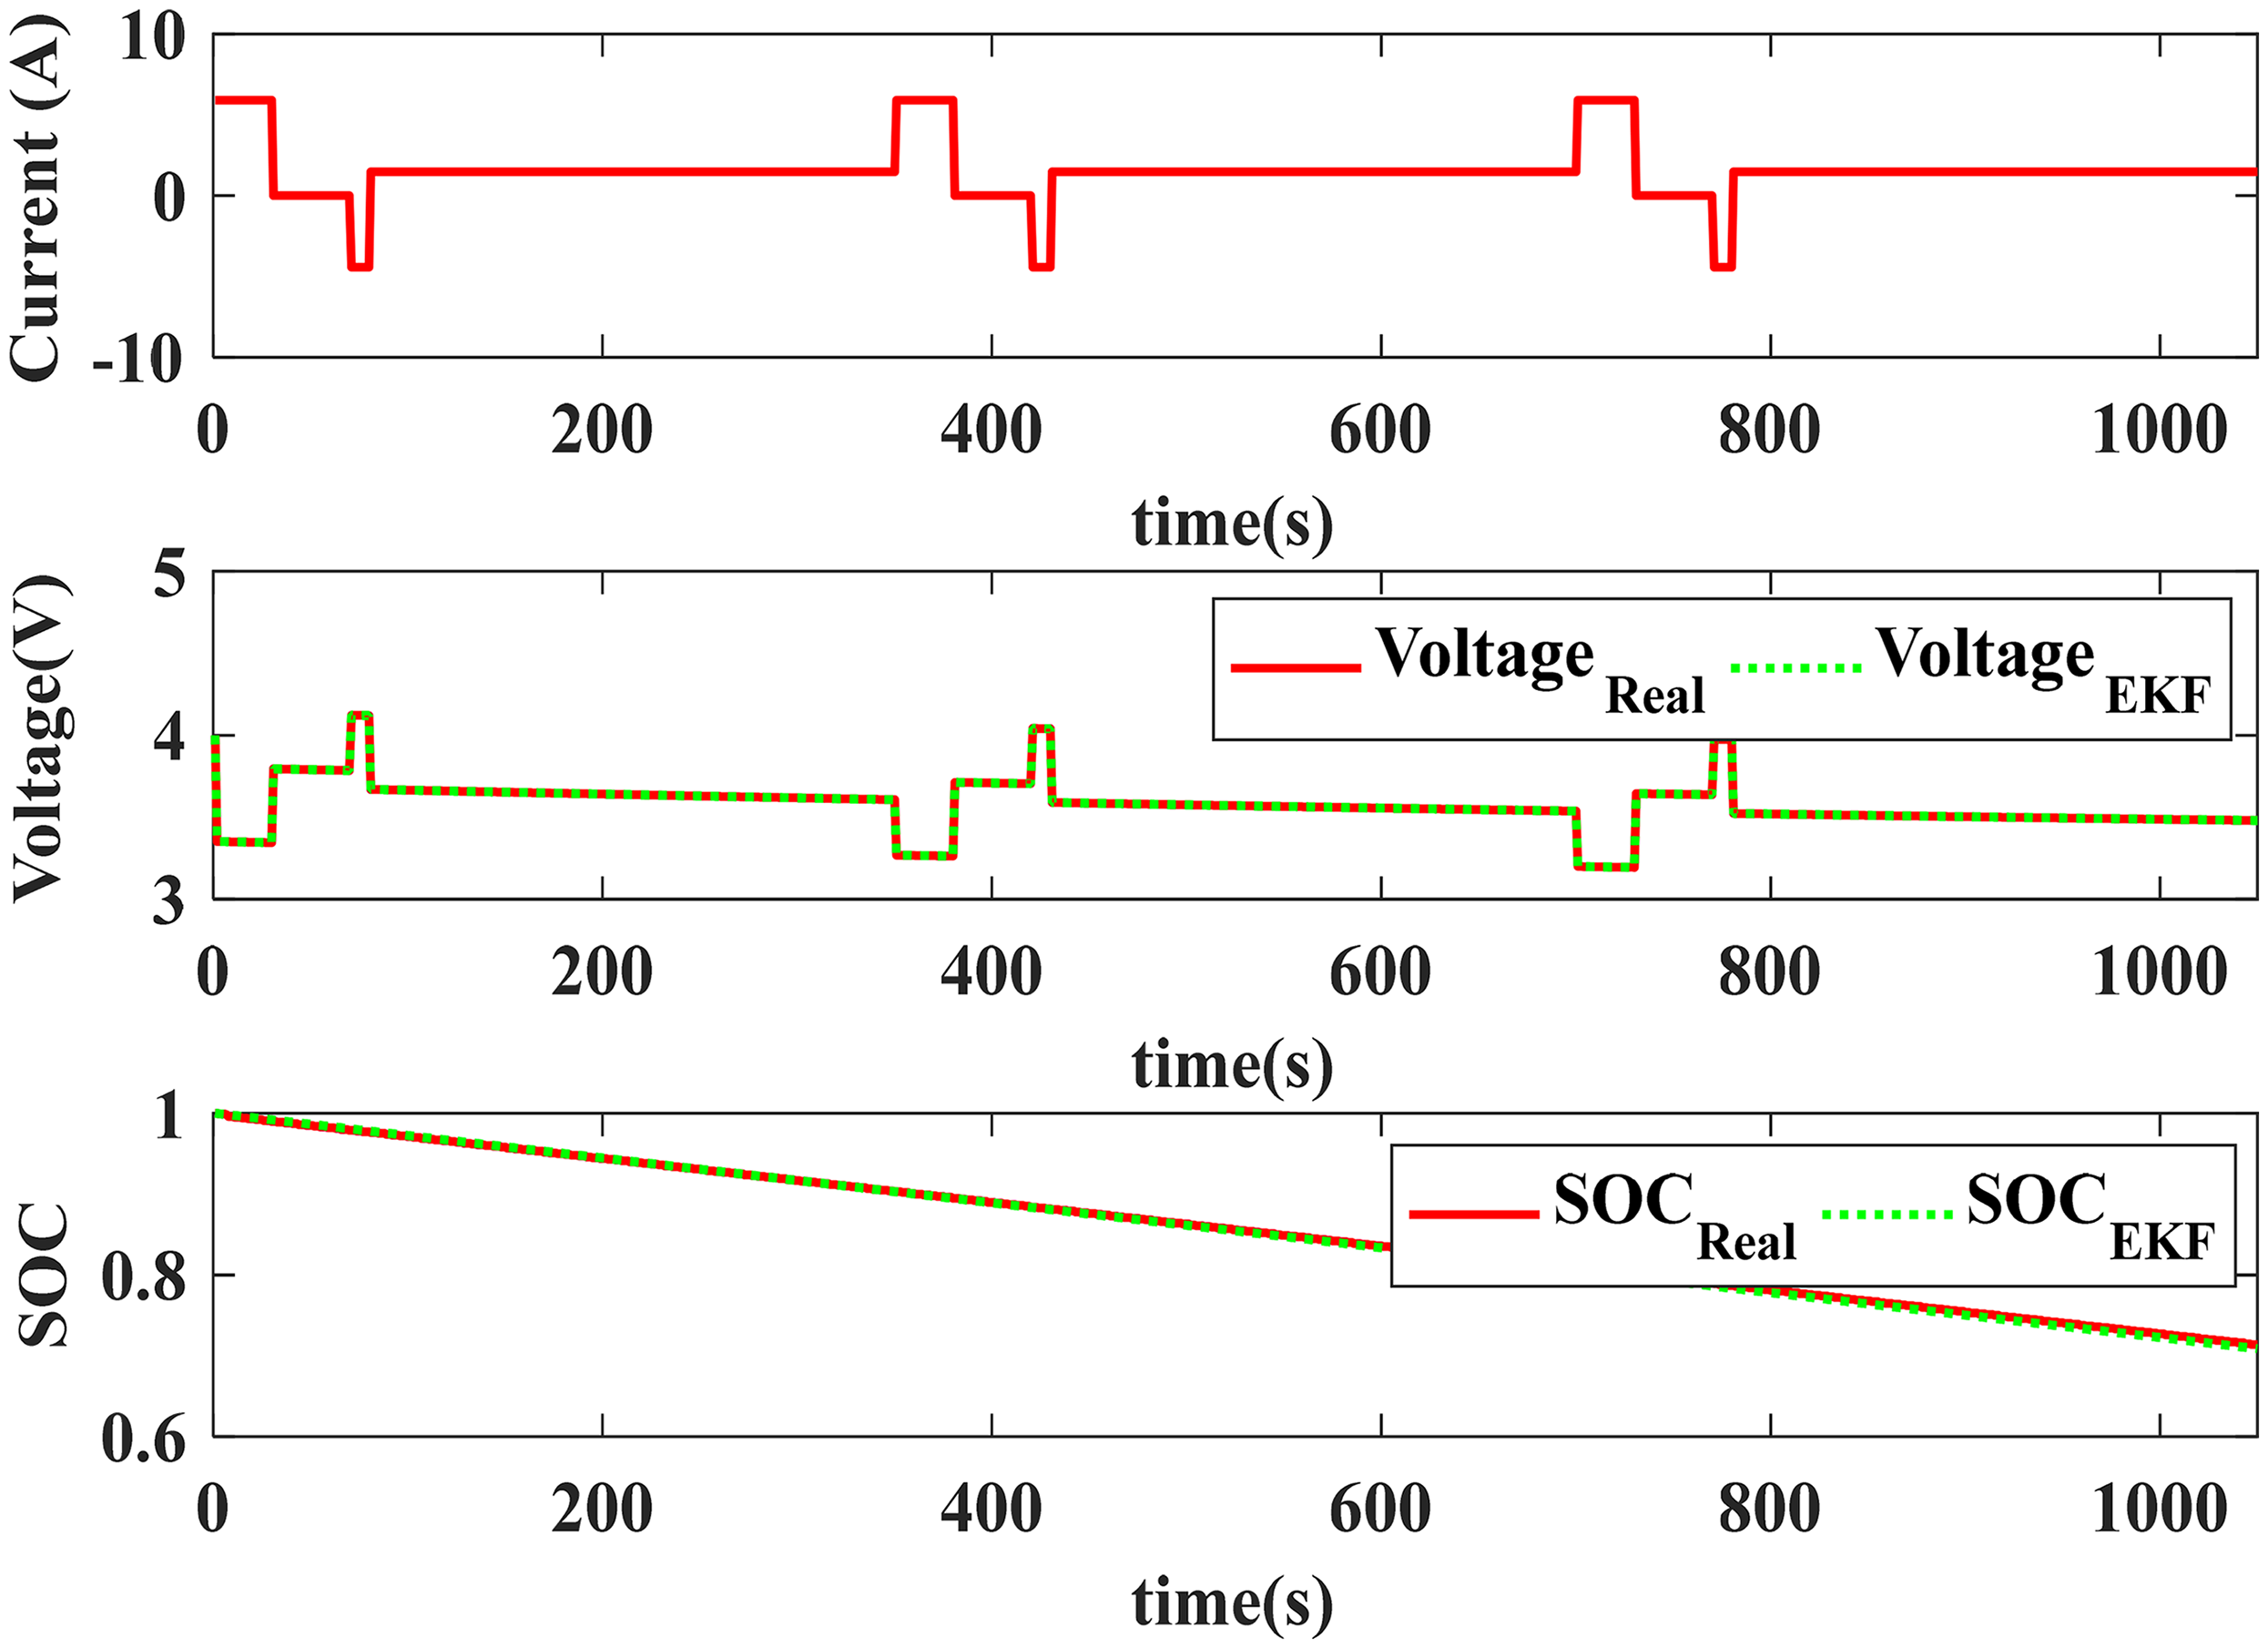
SOC estimation under HPPC test.
Drive cycle conditions
The urban dynamometer driving schedule (UDDS) cycle is primarily used for evaluating the emissions and fuel economy of vehicles. It simulates typical city driving conditions and consists of a series of driving events. UDDS represents light-duty city driving profile. From (Kollmeyer, 2018), the drive cycle data for the Panasonic18650PF Li-ion battery, which has a battery capacity of 2.9Ah and a nominal voltage of 3.7 V, is collected. The UDDS is characterized by frequent stops and starts, representing the driving patterns encountered in urban areas. It consists of a cycle lasting 1137 s (about 19 min) and includes four driving modes: acceleration, deceleration, idle, and cruising. These modes mimic typical urban driving behaviours such as acceleration from a stop, cruising at constant speed, and decelerating to a stop. However, EVs and hybrid vehicles are often tested using different cycles that better represent their driving characteristics. As shown in Figure 9, UDDS is used to evaluate specific aspects of electric vehicle performance, such as energy consumption during stop-and-go driving or efficiency during steady-state cruising.
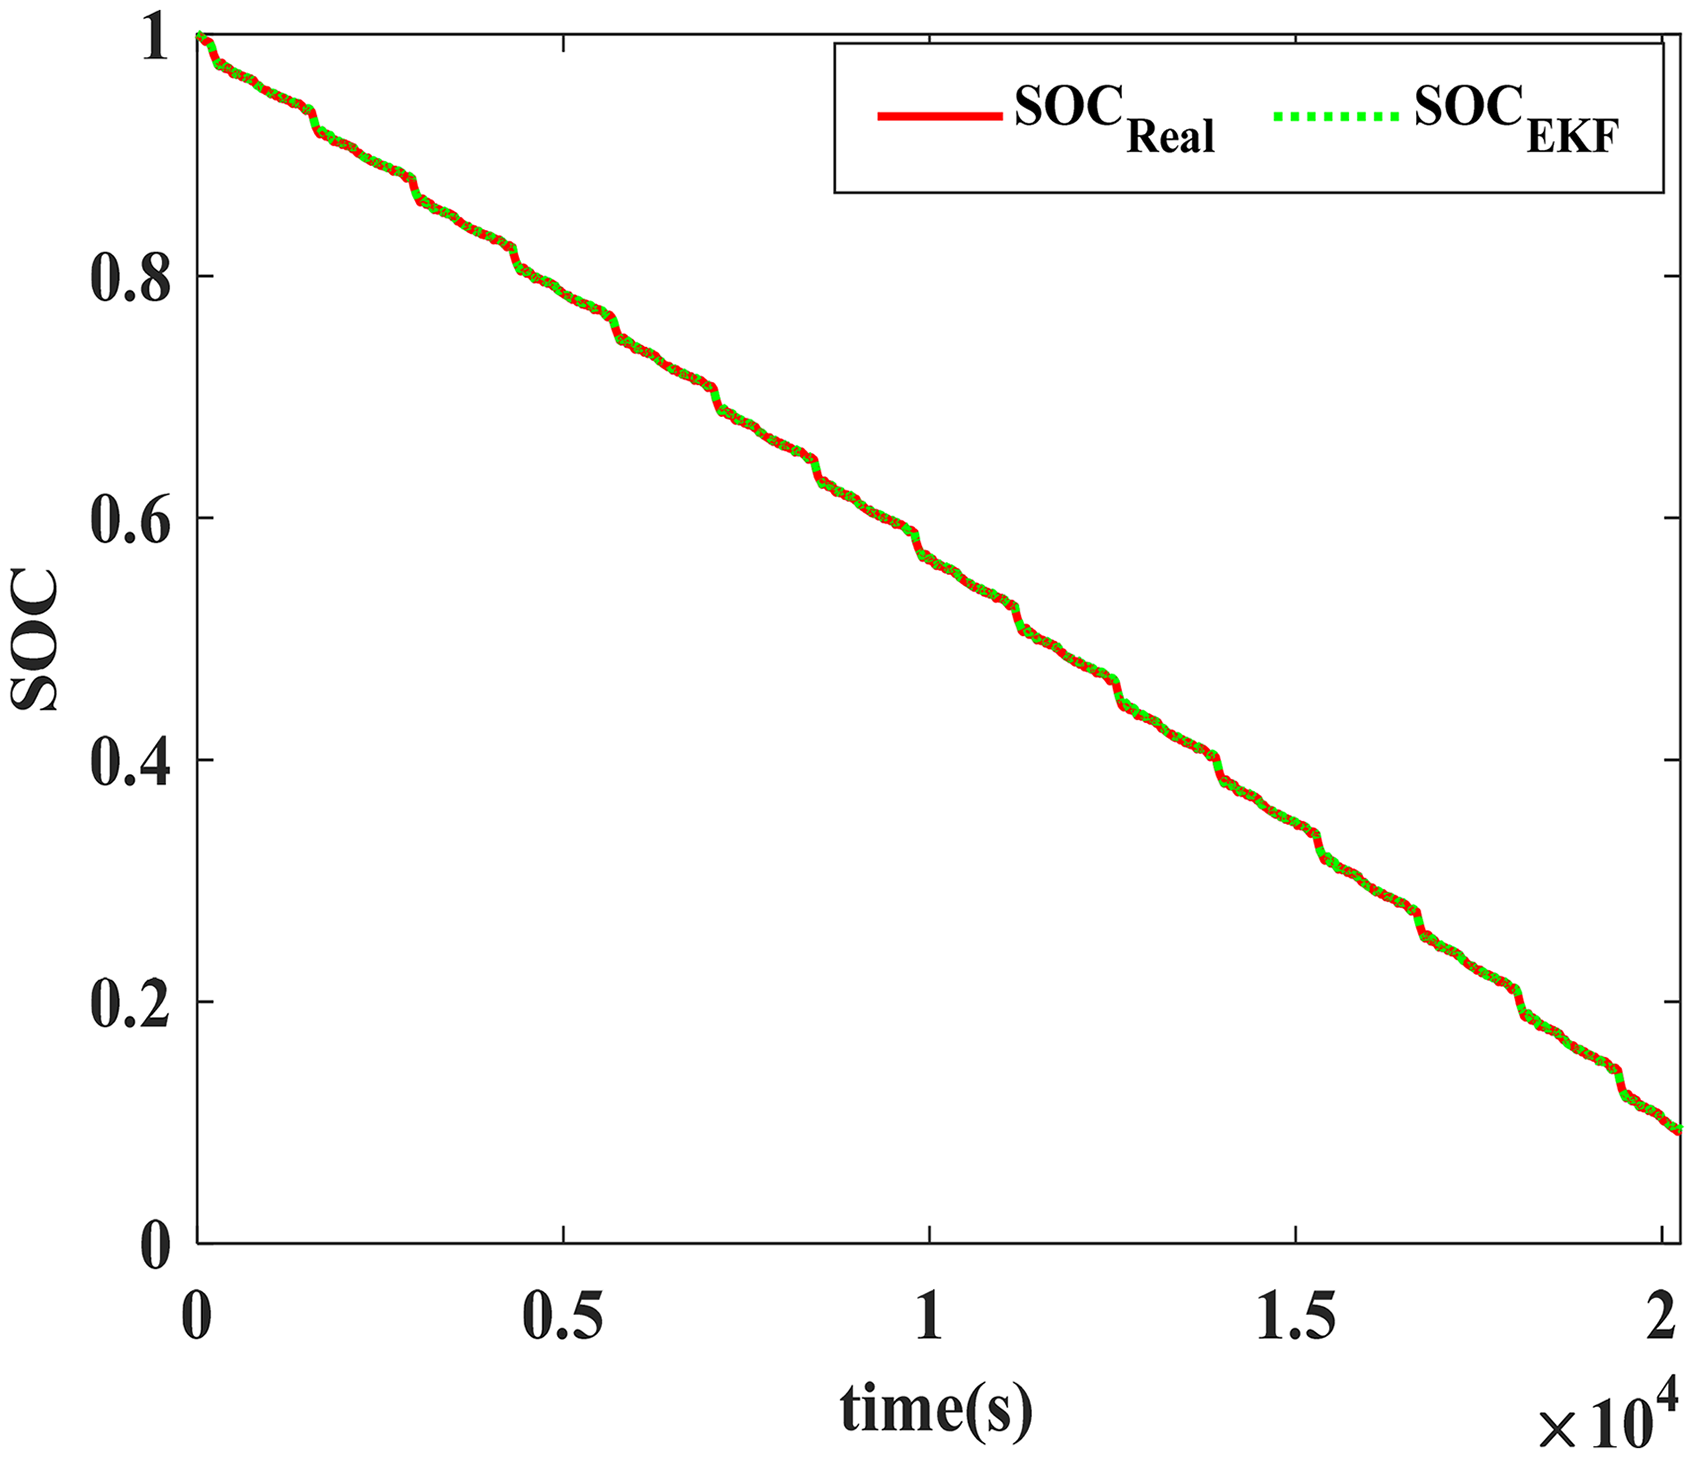
SOC estimation under UDDS cycle.
Conclusion
The inverse relationship between R and Q is evident as they are present in the observation and state equations, respectively. The Q represents the average rate of change in the state, which impacts the exactness of estimation by influencing the speed that previous data is elapsed. The impact of R is completely opposite to that of Q. Improper selection of statistics for simultaneous recursive estimation can lead to overestimation of R and underestimation of Q, and vice versa. To tackle this issue, an alternate change of Q & R is proposed in this study. For the analysis of SOC estimation, ten distinct combinations of noise covariance matrices confidently utilized to examine their impact. Tuning of the filter parameters is crucial for enhancing SOC estimate, irrespective of the type of model and filters used. The filter parameters are carefully selected to consider both the convergence rate and estimate error. According to the results observed from Figure 5 and Table 2, the filter parameters such as three diagonal elements of Q are selected as 2e-8, 0.005, 0.003 and R as 2e-6. With these combinations of Q and R, the EKF provides MSE of SOC and voltage is 3.2e-5 and 9.4e-4 respectively. Correspondingly, UKF yields MSE of SOC and voltage is 0.0064 and 3e-3 respectively. Meanwhile, PF gives MSE of SOC and voltage are 0.0003 and 8.5e-4 respectively. The suggested method is validated using experimental data and EV drive cycle data. The results of the proposed tuned filter method are overlay with the reference discharge curves to confirm the efficacy of the selected parameters. The outcomes demonstrate reduced estimate fault and a strong convergence rate for the tuned filter.
Footnotes
Acknowledgements
This work was supported in part by the Alagappa Chettiar Government College of Engineering and Technology, Karaikudi under Research Promotion Scheme (RPS) of AICTE's grant no. 8-185/FDC/RPS(Rural)/POLICY-1/2021-22.
Author contributions
Funding
The author(s) received no financial support for the research, authorship, and/or publication of this article.
Declaration of conflicting interests
The author(s) declared no potential conflicts of interest with respect to the research, authorship, and/or publication of this article.
Data availability statement
Data will be shared based on request.