
Abstract
The geometrical model was built by the computer-aided design software and imported into STAR-CCM+. Typical wave conditions in the East China Sea were used in computational fluid dynamics simulation. By observing overtopping process and recording water discharge, the relationship between wave conditions and overtopping process was obtained. Finally, the simulation was validated by comparing the theoretical and experimental results. Furthermore, an empirical model was developed to predict the water discharge.
Introduction
According to operation models, wave energy converter (WEC) could be classified into four types, submerged pressure differential, oscillating wave surge converter, oscillating water column and overtopping device. 1 Among these models, overtopping device attracts our attention. A lot of overtopping device, such as Wave Dragon (WD) 2 and Sea Wave Slot-cone Generator, 3 are supported by the Danish wave energy program. All these devices convert energy by capturing incident waves into the reservoirs and release the water, by this method, the potential energy of the high position water could be converted into electrical energy. The efficiency of overtopping device is influenced by a lot of factors, for example wave climate, structure geometry, mooring patterns and so on. There are many studies about these factors, the directional spreading on slopes and vertical walls were studied respectively, 4 regular and irregular wave spectra were used to investigate the overtopping performance in the physical model testing 5 and wind velocity will have influence on water discharge. 6
To harvest more wave energy, offshore overtopping device has advantages. However, it is difficult to design and construct. Compared with the fixed device, floating structure is difficult to study, there have been a lot study about floating structures, such as floating slab, 7 floating raft, 8 and so on. However, the floating of WEC has rarely been studied and the vibration of floating structure has a reduction on the overtopping discharge, tested in laboratory. 9 In terms of the WD, the reduction of overtopping discharge due to vibration is about 50% of the fixed device overtopping discharge. To stay focused on the structure geometry of overtopping device, the mooring system and structure vibration are simplified and the structure is considered to be fixed at the sea level.
The design of structure geometry depends on several factors, such as surface roughness and permeability, crest width, and multiple crest levels. According to Peng and Zou, 10 increasing the crest width will reduce the overtopping discharge; and there are no significant variations in efficiencies when slope angles α changes from 30° to 50°, α = 30° was stated to be the best slope angle for the WD. 11 Multiple crest level has been compared with single crest by Kofoed et al., 2 it leads to 38–53% increase of potential energy. Numerical simulation is often used in structure designs, which could reduce the design cost and get more details.12,13
In this study, the overtopping wave power device is designed to be multi-level and shown as Figure 1. Computational fluid dynamics (CFD) software is used to simulate the overtopping process, and the simulation results is compared with the theoretical results. Compared with single-level device, the hydraulic efficiency of multi-level overtopping wave power device (MOWPD) is improved by about 6%.
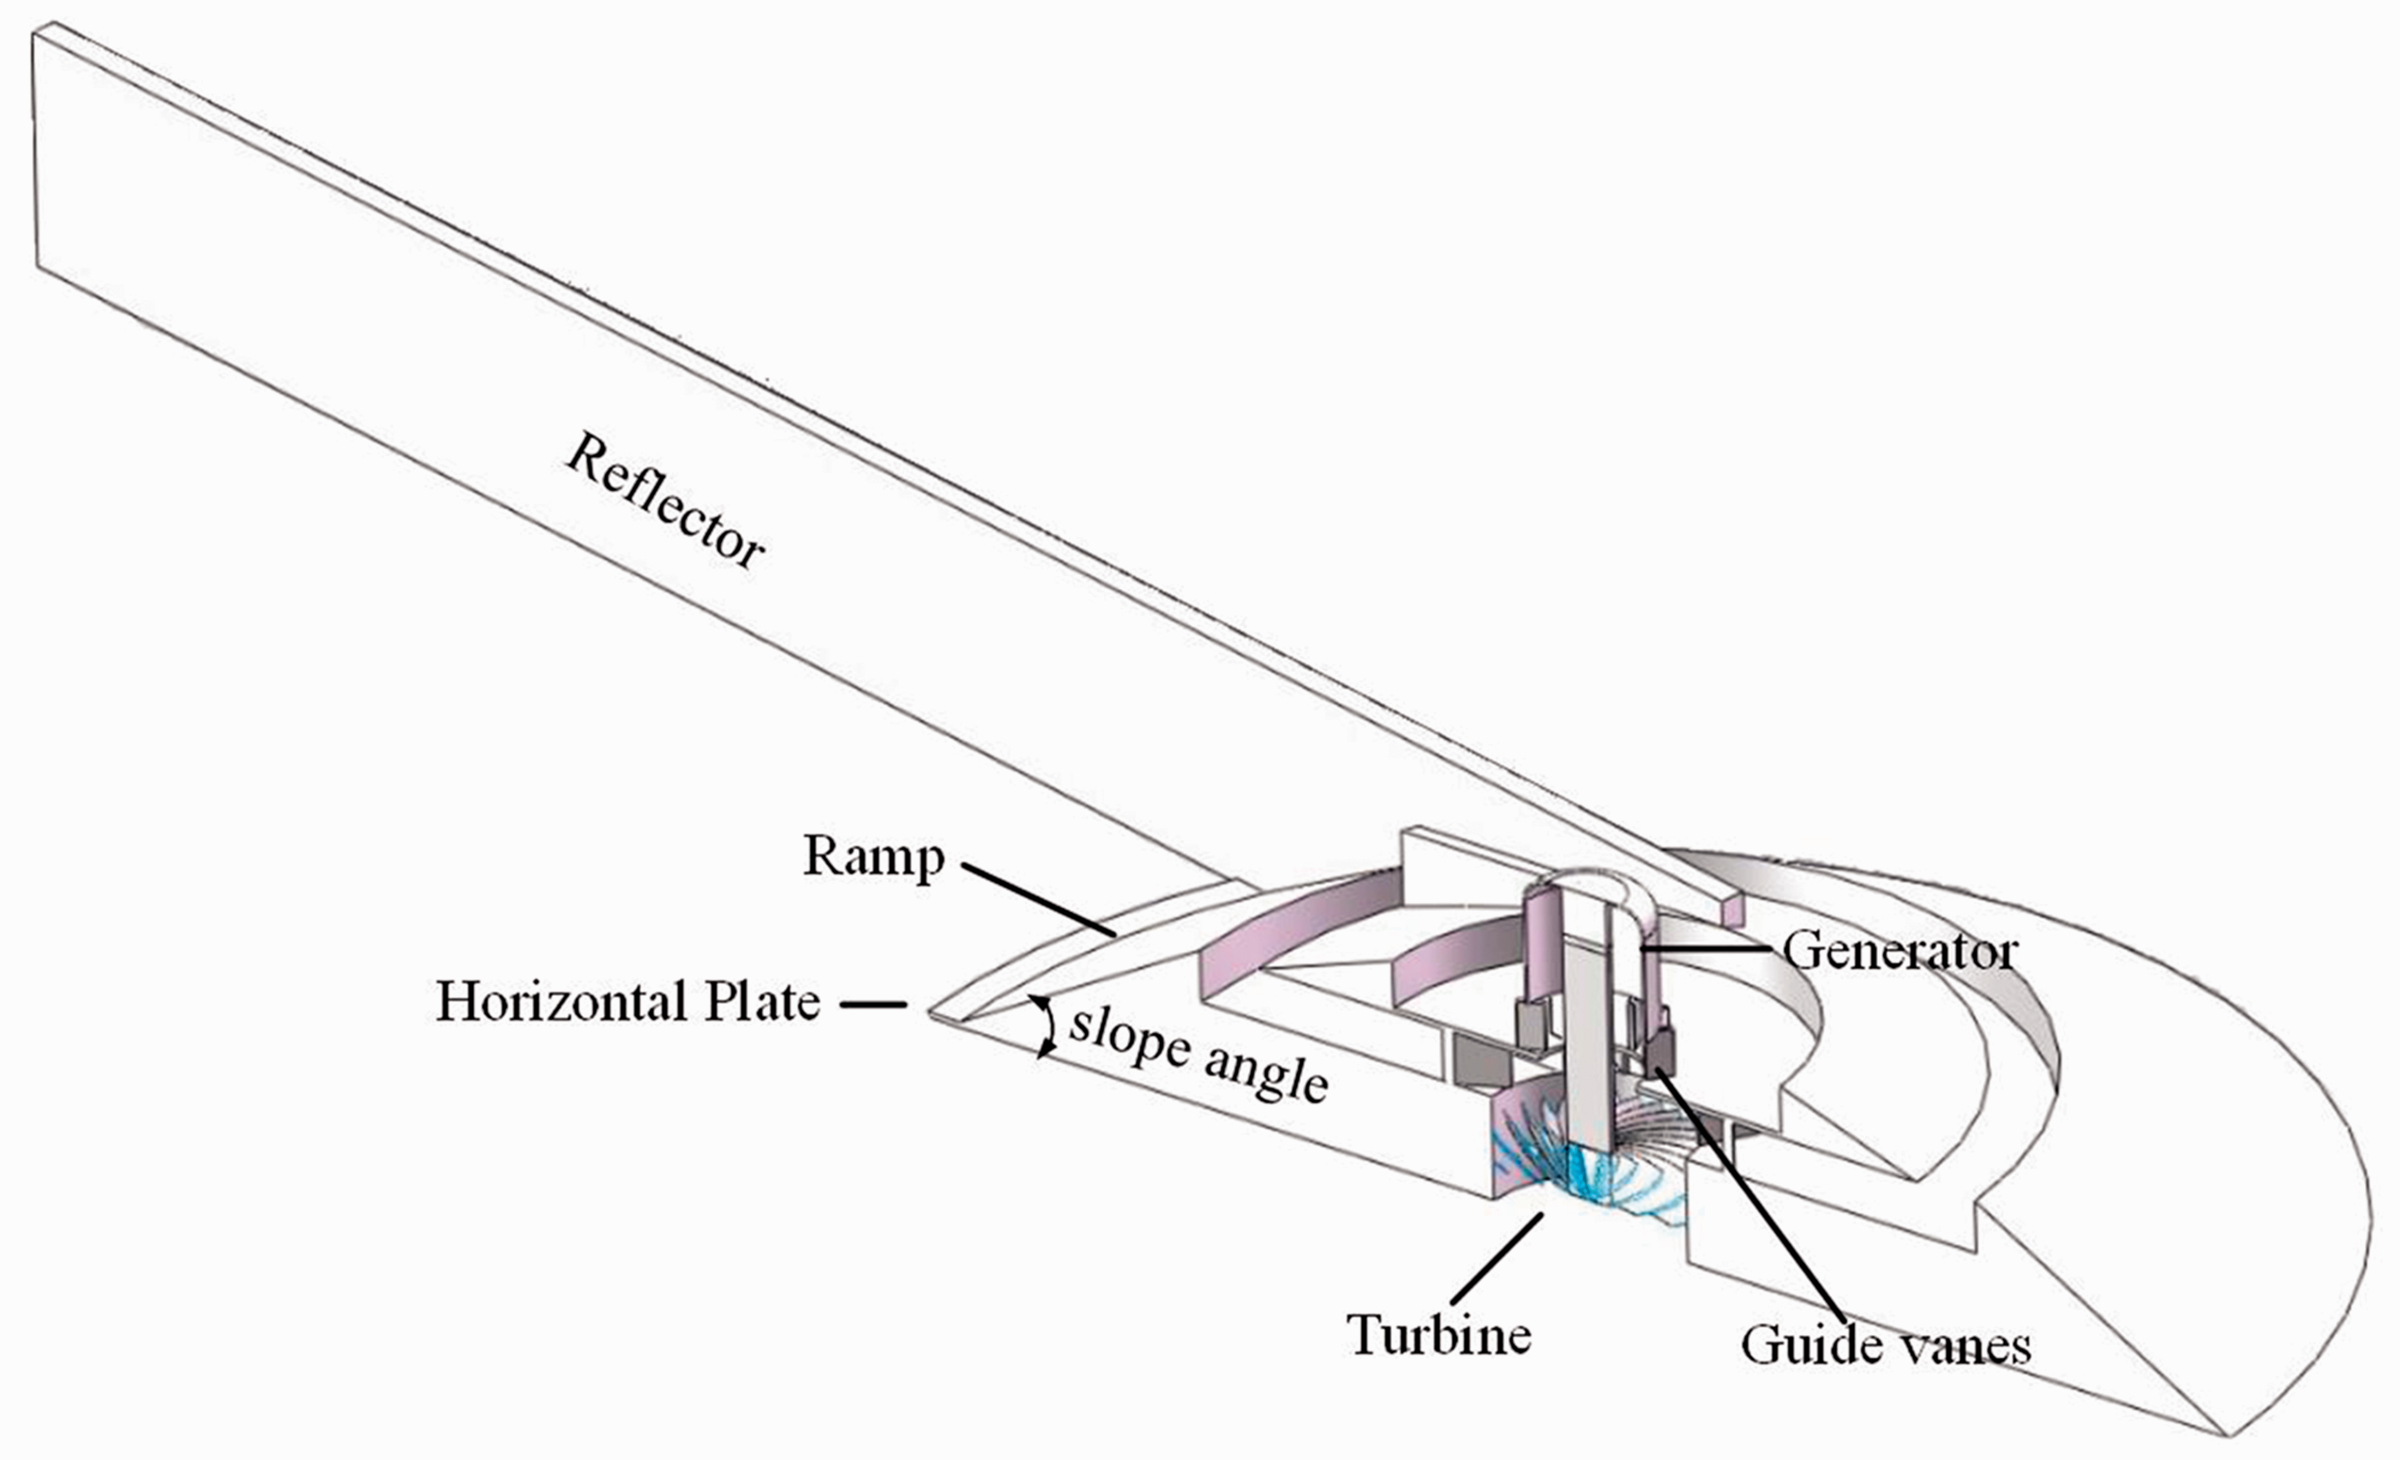
The section of multi-level overtopping wave power device.
The design and experimental details
The design of the wave power convertor
As we can see from Figure 1, the main structure consists of seven parts, which are respectively the reflector, ramp, horizontal plate, generator, turbine, reservoirs and guide vanes. The working principle of the device can be described briefly as follows. The wave height gradually increases as it comes close to the ramp, then it will rush into the ramp and fall into first reservoir, if the wave is high enough, it will climb to the second ramp and get into the second reservoir. Finally, the water in the reservoir will impulse the turbine to generate the electricity.
The device will be floating in the deep sea and fixed by a mooring system. To study the performance of its special geometric design, the device will be fixed on a certain level, which will be suitable for us to focus on the performance of its multi-level feature. This structure can be classified to the overtopping device, but it has certain differences because it can absorb all directional and various-level wave. Consequently, the device can be applied in a lot of different areas.
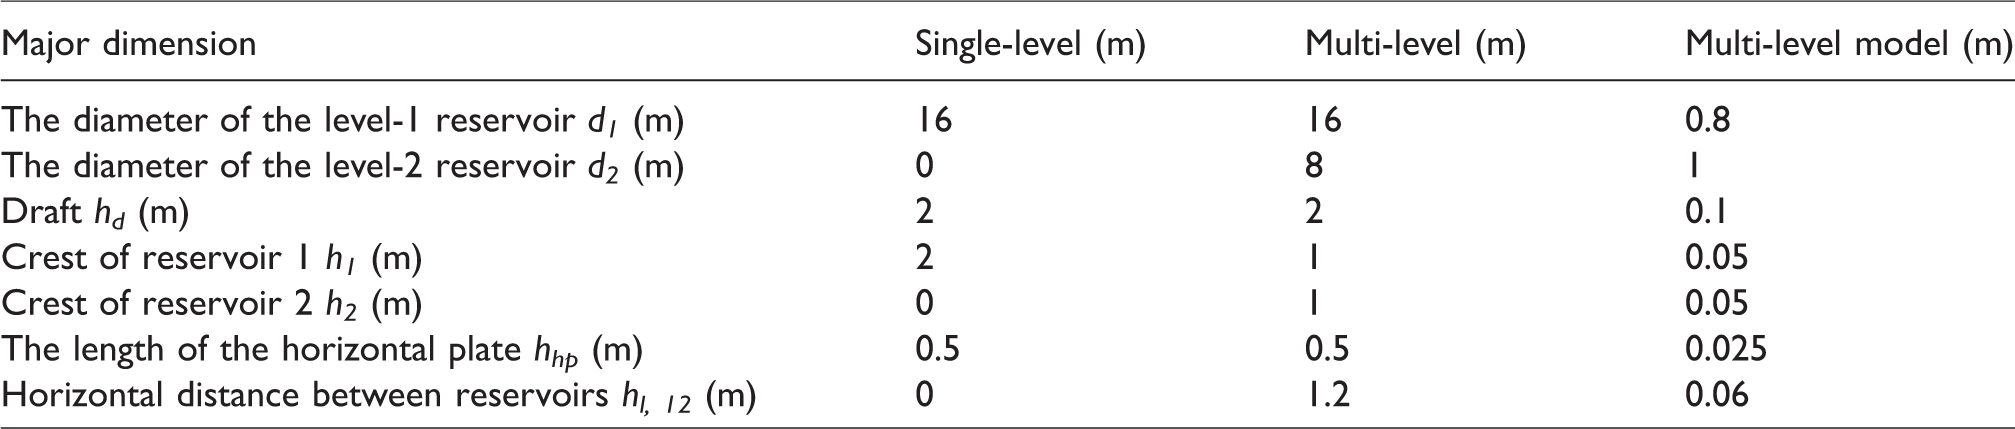
The sketches of the overtopping devices in Figure 2 and the Table 1 of the dimensions of the main structure are presented. MWL is mean water level. They are designed to work in the East China Sea, where the significant wave height is lower than in the Nordic Sea. Taking this condition into account, we conducted some improvements to the device.
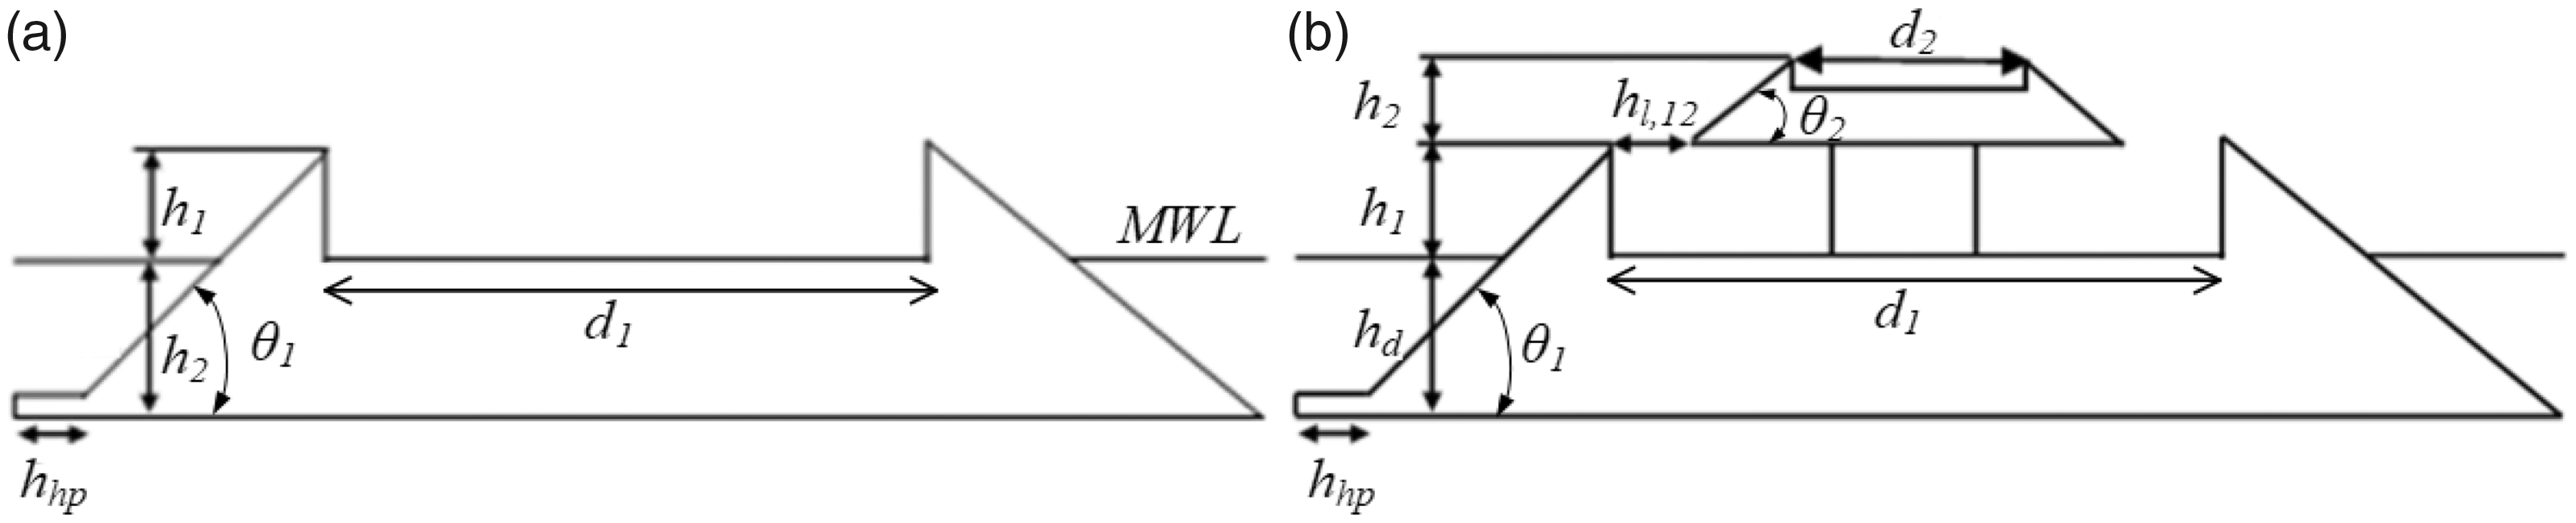
The sectional view of the single-level (a) and multi-level (b)overtopping wave power device.
The comparison of the dimension of the device.
The turbine size was the first point to be considered. The Kaplan turbine was widely used in engineering, 14 the WD in sea test used the Kaplan turbine which can reach the efficiency of 0.9. But the large Kaplan turbines are individually designed for each site to operate at the highest possible efficiency, typically over 90%. These turbines are very expensive to design, manufacture, and install. According to the research on the low head hydro turbines, 15 we can select the available lowest-head axial turbine to generate electricity. The water head of the turbine is 2 m, and the effective power of turbine is about 100 kW and about 6 m3/s volume of the flow.
The water head needs to be kept as stable as possible to supply the sufficient potential energy of gravity. In one wave period, it needs about 30 m3 water to overtop the device. Taking the need of the overtopping discharge and the simulation of the CFD software into consideration, we chose the radius of the reservoir to be 8 m.
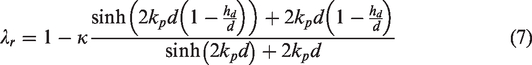
According to the context of the introduction, when the slope angle changes from 30° to 50°, there are a lot of angles that have great performance for the overtopping. The influence of slope on the dike has been predictable through a lot of studies, like the research done by Evangelista 16 . Liu et al. 17 studied the slope ratio by the numerical simulation method. They conclude that the overtopping discharge will be optimized when the slope ratio ranges from 1:1.5 to 1:2. In our structure, the slope angle was designed to be 30°. Additionally, we need to define the number and vertical placement of reservoirs, the horizontal distance between reservoirs, and front geometries of the second slope. By checking the previous research based on the Power Pyramid project, the conditions of multi-level reservoir have been studied by experimental method. According to Kofoed et al., 2 we find that the discharge is neglectable in the third reservoir when the significant wave height is under 2 m. By comparing all the tested situation, one of these has the best performance when the Hs change from 0 to 2 m; it can help us determine hl,12 (1.2 m) and the angle of the second rampθ2 (20°).
According to the same research carried on by Kofoed, linearly converging walls with an opening ratio 0.848 results in an increase in the overtopping discharge of 15%. If the ratios are too small, for example 0.536 or 0.368, the converging walls begin to reflect the waves and it will reduce the overtopping discharge by 5 or 24%. Compared with the linear guiding wall, the curved guiding wall was tested to have an unobvious effect on the overtopping process. In conclusion, 0.848 was selected to be the opening ratio for our device.
To increase the overtopping efficiency, there are two points to be considered, the horizontal plate which is added in front of the slope and the profile of the slope. It is easy to understand that the more we prevent the wave running under the slope, the more energy can be used to rush upon the slope. According to the research from Kofoed et al., 2 there will be a 7% increase when the plate length is 25% of the slope draft length. Convex top of slope could have an influence on the efficiency. Kofoed et al. 2 show that a convex deflection with an unchanged slope angle has a bad influence on the overtopping, but the inventor of WD, Erik Friis-Madsen, introduce that an elliptical-shaped slope will increase the efficiency by 18%. When taking the construction cost into account, we decided to use linear slopes.
The theoretical calculation of the overtopping
The combinations of the geometrical layout and material properties have infinite possibilities, so none of one investigation can include all situations. In the previous investigations, many empirical relationships have been found through model tests. There are a lot of the resulting discharge predictions formulas established. In this study, equation (1), (2), (3), and (4) built by Van der Meer and Janssen are used as a reference in this paper.
18

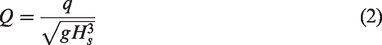
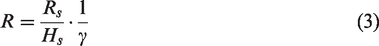
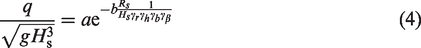
These equations can be applied to the impermeable, smooth, rough, and straight slopes. The dimensionless overtopping discharge Q depends on the average wave overtopping discharge per width q and the significant wave height Hs. The dimensionless freeboard R depends on the significant wave height Hs, the crest freeboard Rs, and the coefficient
Kofoed takes the coefficient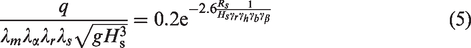

The coefficient β is 3 and αm = 30°is the optimal slope angle
Finally, we need to calculate the experimental dimensionless overtopping discharge Qexp and the theoretical dimensionless overtopping discharge Qth. By comparing the results of Qexp and Qth, the correctness of the experiment can be tested. The improvement of the formulas might be made

The hydraulic efficiency 

The numerical calculation of the overtopping
Mesh generation
The trimmed cell mesh and prismatic layer mesh were often used to generate the mesh in the Star-CCM+. 19 The trimmed cell can provide high-quality cells when the structure is complex. The prismatic layer mesh can be used to control the boundary layer. Y+ is defined as a non-dimensional wall distance and can be used to determine the first layer wall thickness. There is a transition region between viscous sublayer and full turbulent flow. According to previous turbulence study, 20 the value of Y+ should not be 5–30 to prevent the first layer wall appear at transition region.
To capture the special structure of the device and the free surface, some areas need to refine meshes. The free surface needs to be refined to embody the movement of the free surface, and according to previous CFD simulation about the interaction of wave and structure, 21 it needs more than 80 cells per wavelength and 20 cells in the vertical direction. When the mesh is close to the device, the mesh should be refined more carefully, about 150 cells per wavelength is needed to capture the slamming and overtopping movement near the device. The mesh is displayed by Figure 3.
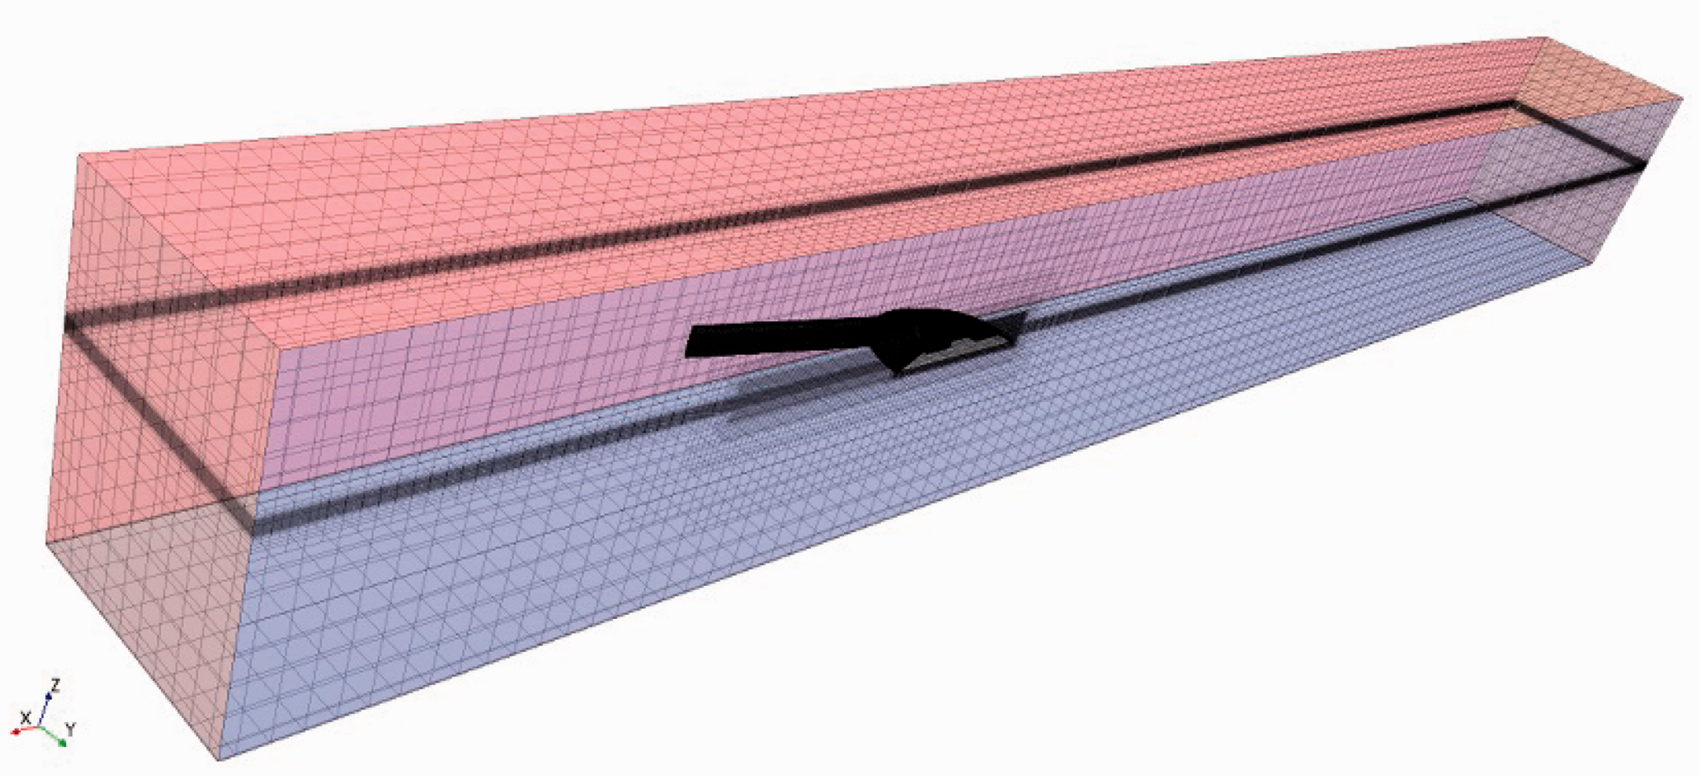
Mesh distribution of the device. 24
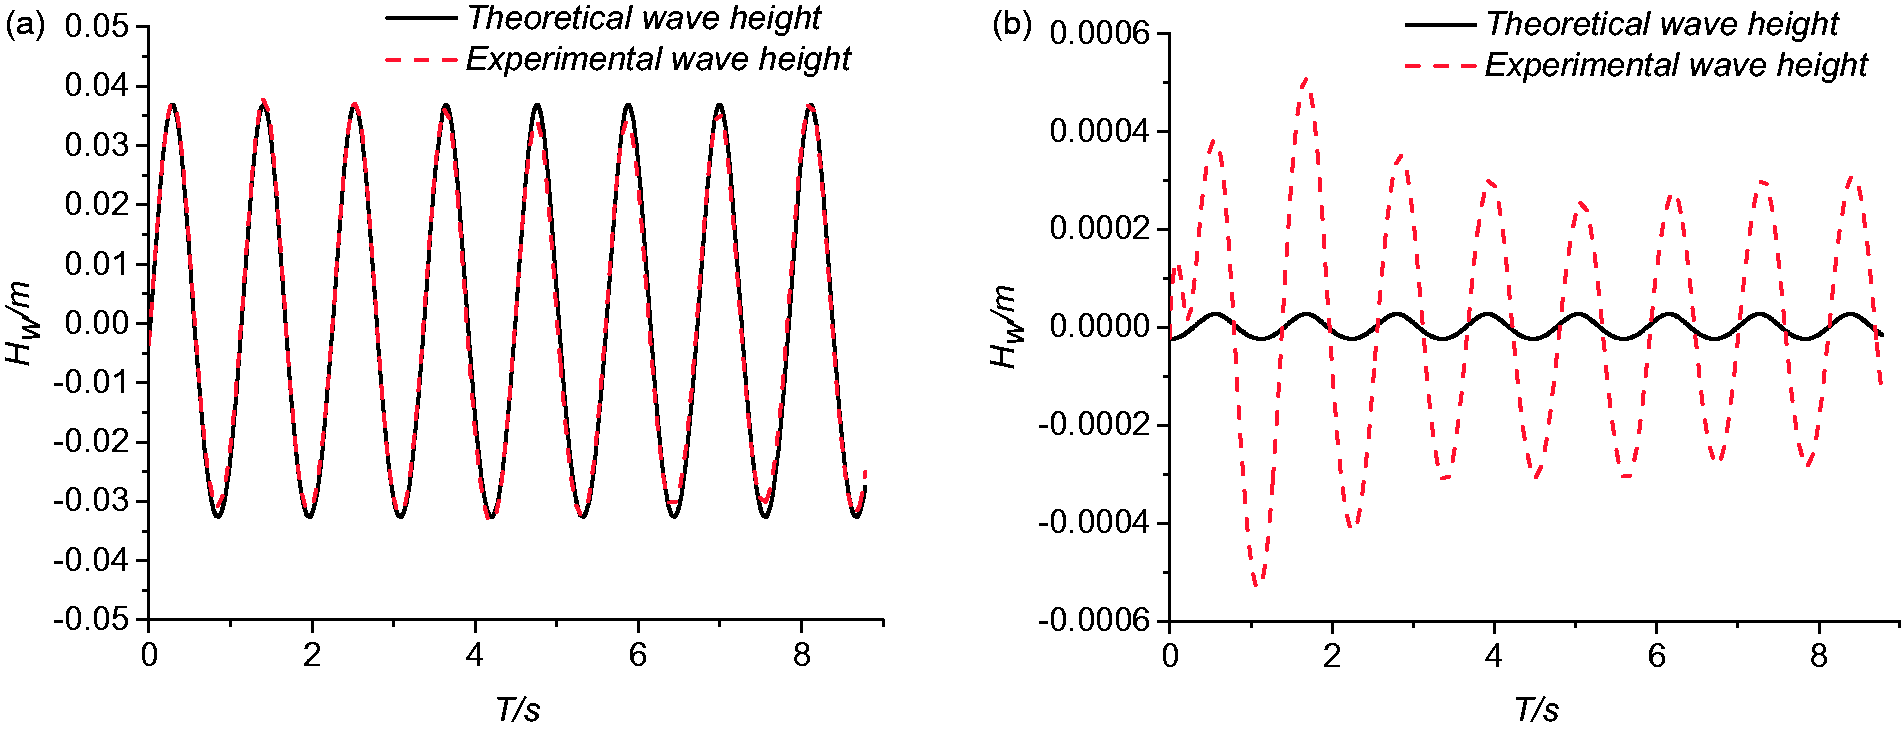
The comparison of experimental and theoretical wave height in the developed area (a) and damping area (b).
Physics model setting up
The solvers use the finite volume method to model the fluid flow. There are two kinds of the fluid used, air and water. To express these fluids, the Eulerian multiphase flow was selected to describe the distribution of the phases. The finite volume method (FVM) uses the algebraic equations to represent partial differential equations. 23 The Reynolds-averaged Navier-Stokes equations (RANS) solver link the continuity and momentum equations with the predictor-corrector approach.
For industrial applications, the К-ε model is often chose as the turbulence model. 24 In many papers that use the Star CCM+ to do numerical simulation of the ocean structure, К-ε model is selected as well, for example in the full-scale unsteady RANS simulations of vertical ship motions in shallow water. 25 The advantage of the К-ε model is that it can save the CPU time which is very important to the simulation.
To describe the free surface of the wave, the volume of fluid method was used in this test. The sharp interface which is between air and water can be captured. The whole fluid can be described by the volume fraction of water, the value = 0.5 means that there are 50% water and 50% air, thus it can represent the interface.
The Cartesian coordinates was used in this model. The overtopping process was studied firstly in the fix position, so it does not need the dynamic fluid body interaction (DFBI) module; but in the future, when the floating motion is considered, the DFBI module will be used.
The fifth-order wave was used in this simulation. A fifth-order wave is modeled with a fifth-order approximation to the Stokes theory of waves. This wave more closely resembles a real wave than the one generated by the first-order method. Compared with the first-order wave, the fifth-order wave has less reduction of the wave height as the wave spreads. The height of wave can be kept above 95% of the setting number. There is also a wave absorbing area near the outlet, it can reduce the reflection of the wave. The comparison results between experimental and theoretical wave height are shown is Figure 4.
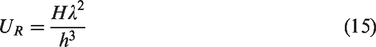
It is suggested that the fifth-order Stokes theory should only be applied to Ursell number UR less than 30
Boundary conditions
The calculate region was slipped into two parts. It was divided by x-z plane, and the new-form plane was called the symmetry plane (Figure 5). The whole domain was seen from the port side.
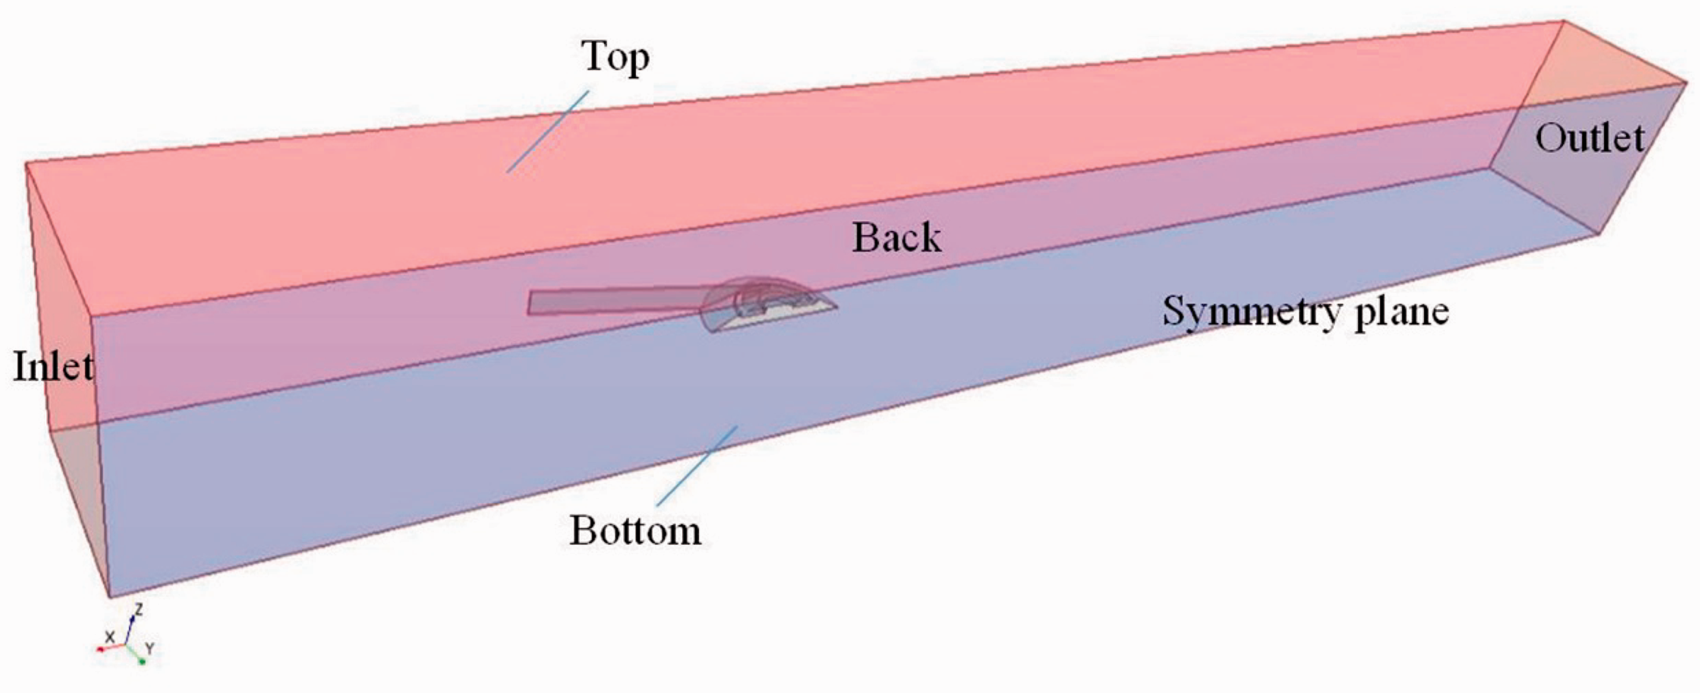
The boundary conditions of simulation.
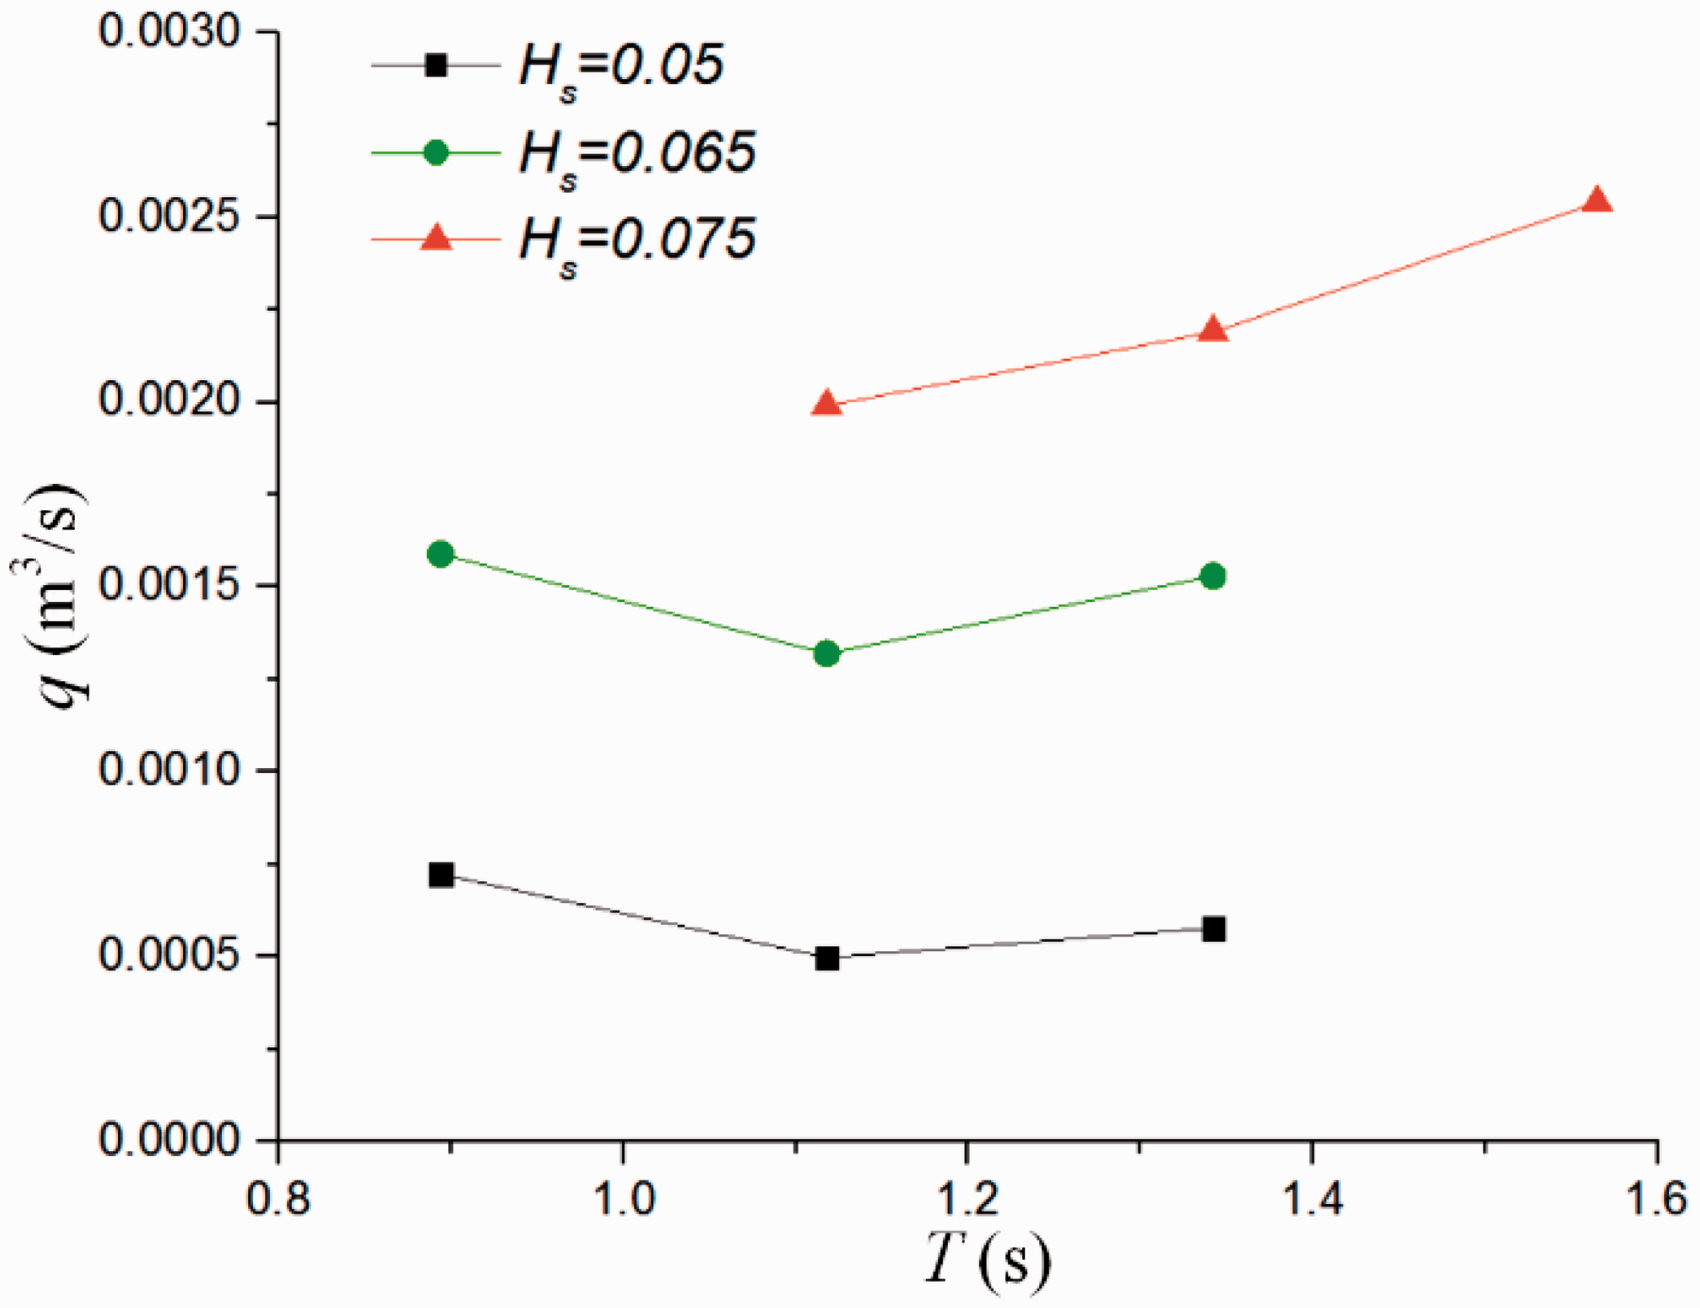
Influence of the wave period T on the average wave overtopping discharge per width q.
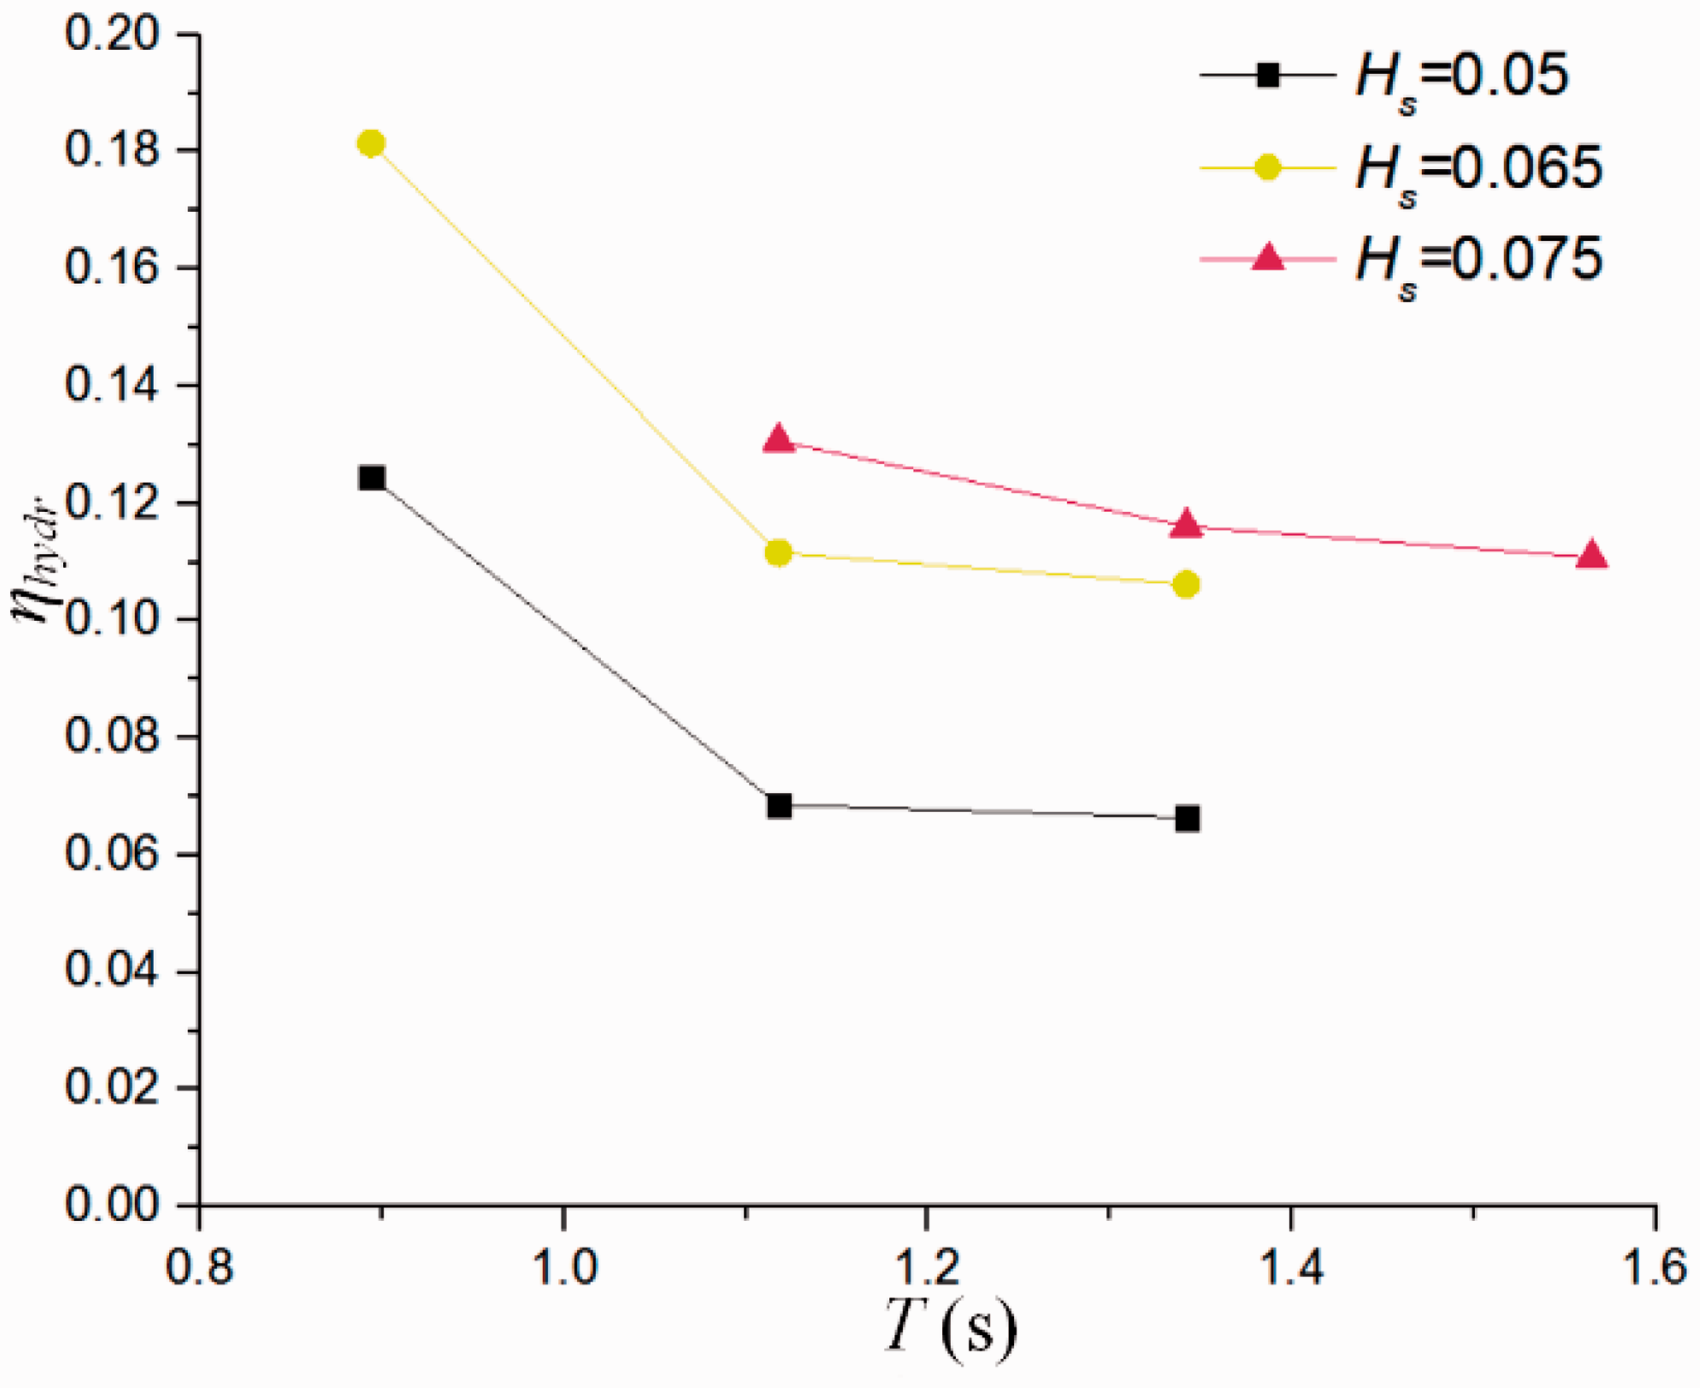
Influence of the wave period T on the hydraulic efficiency ηhydr.
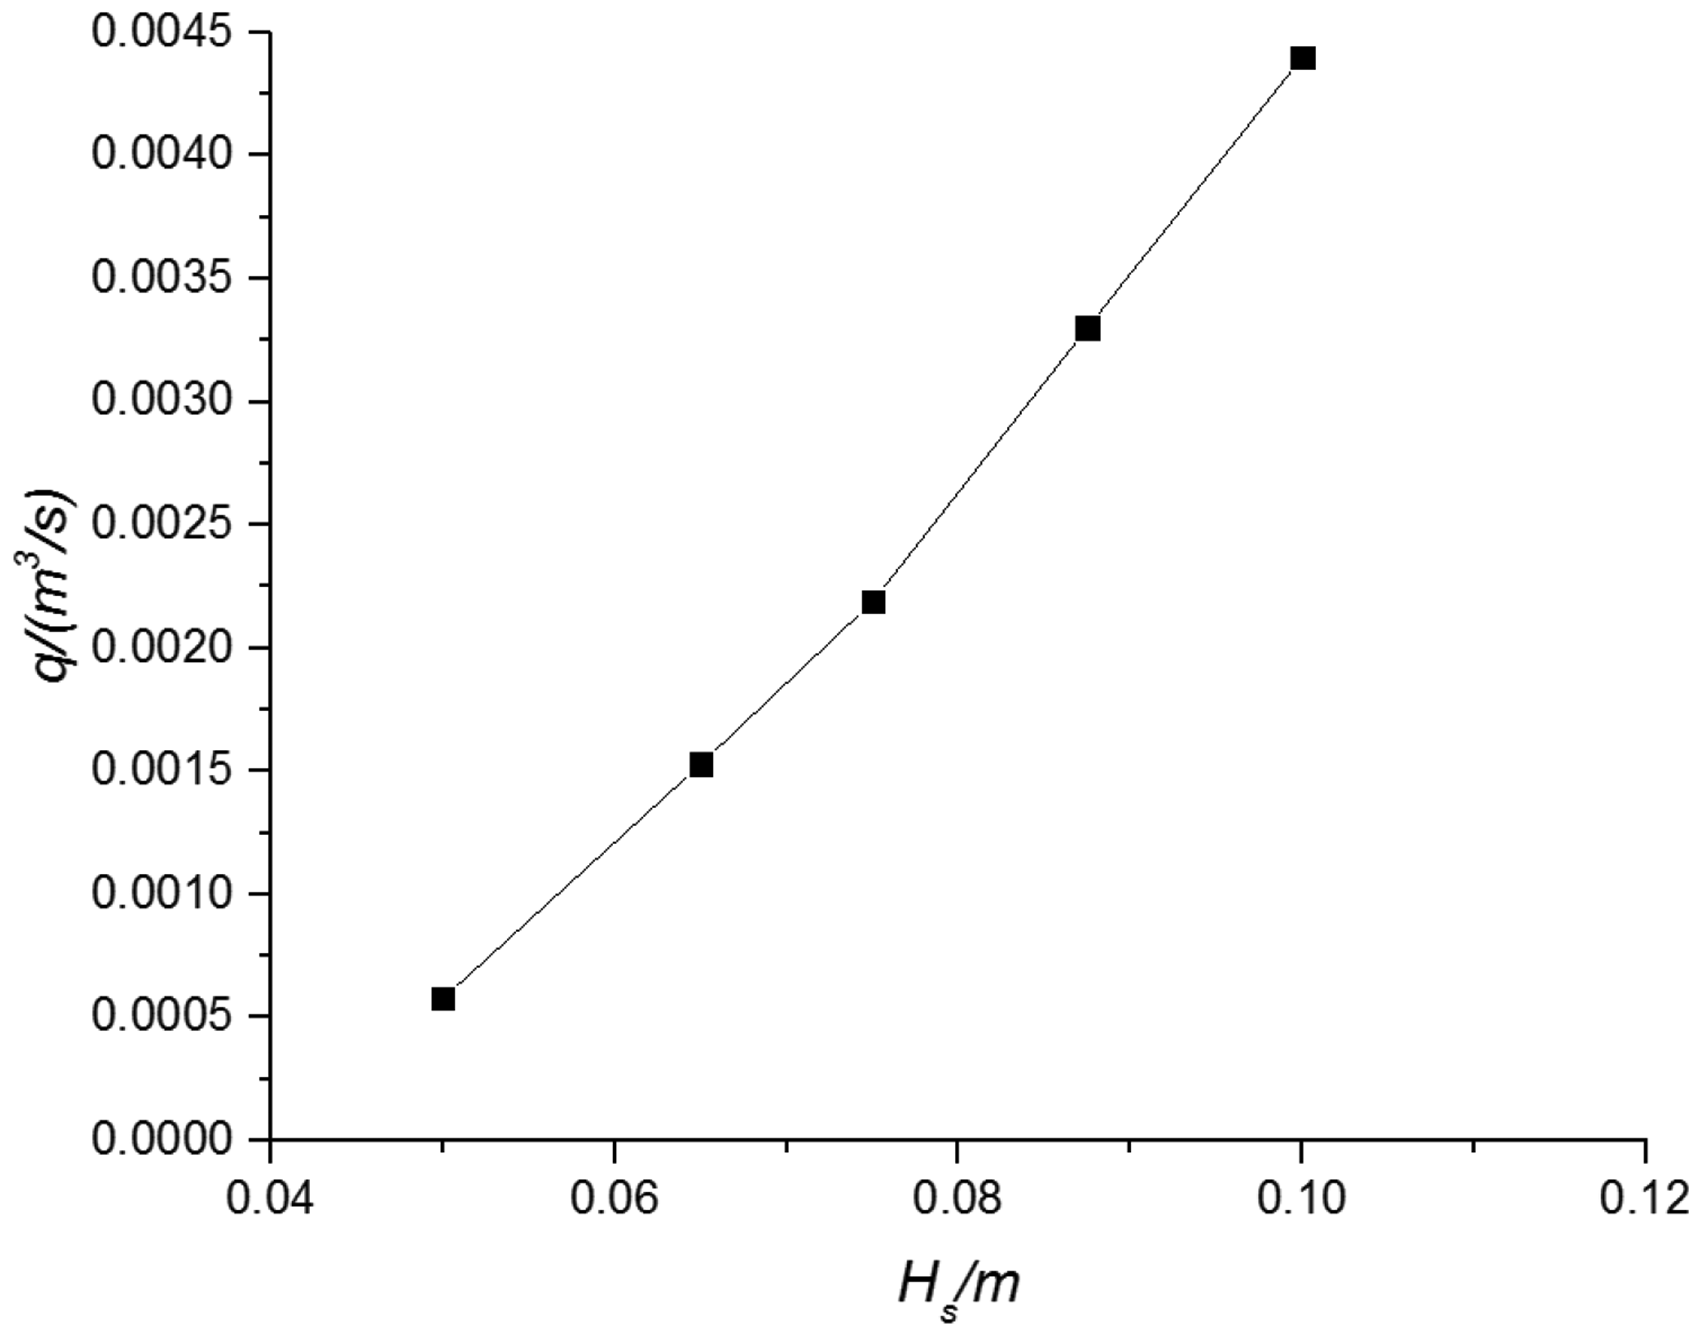
Influence of the wave height on the average wave overtopping discharge per width (T = 1.342 s).
There are six boundaries in this area. In the positive x-direction, the inlet boundary was set to be velocity inlet, the top was set to be the pressure outlet, and the back boundary was also set to be the symmetry plate. Top and bottom boundaries were completely in contact with air or water. But the velocity of the water is zero when it closes to the bottom. Hence, the bottom boundary needs to be set as no-slip wall. Apparently, the symmetry plane has a symmetry condition.
The distance between the device and the boundary is also very important. According to Bhattacharyya et al., 26 the inlet boundary needs to be 1–2 wavelength away from the device, the outlet needs to be 3–5 wavelength away from the convertor. But in this case, the wave between the outlet and the device is not the main part we want to study, so the distance can be reduced to 1 wavelength or so. The calculate region also needs a damping area which has the same length as the wave length and is used to absorb wave.
Choice of the time step
To select a proper time step, we need to consider some aspects, like courant number, the flow properties. The courant number is a dimensionless number to estimate whether the partial differential equations is convergent, and it should be less than 0.5 when only the wave was generated and it should less than 1 during the whole simulative progression. At least 100 time-step should be provided during one wave period. 27 During the simulation, we find that the time-step will influence the wave height, the height will decrease a lot when the time-step becomes longer. Taking all these things into consideration, we decide the time-step to be 0.001 s.
Result and discussion
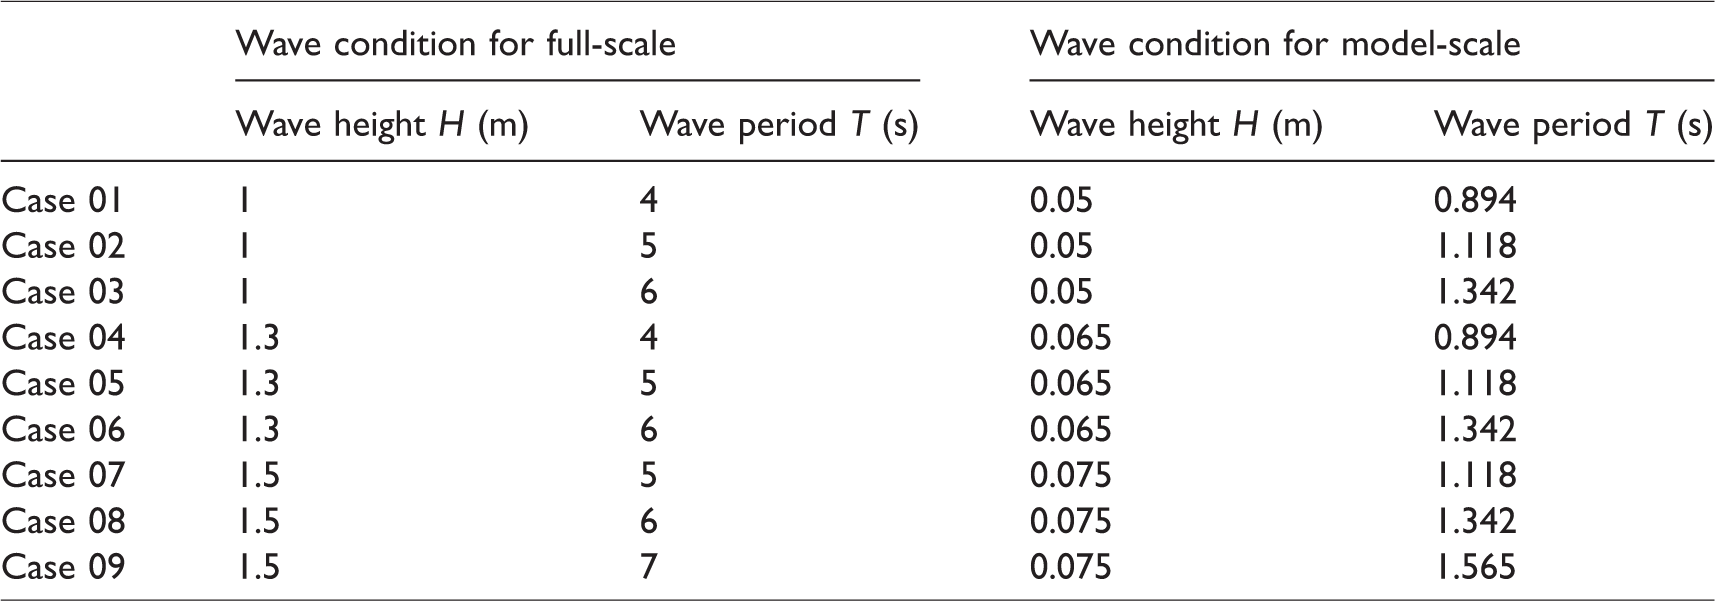
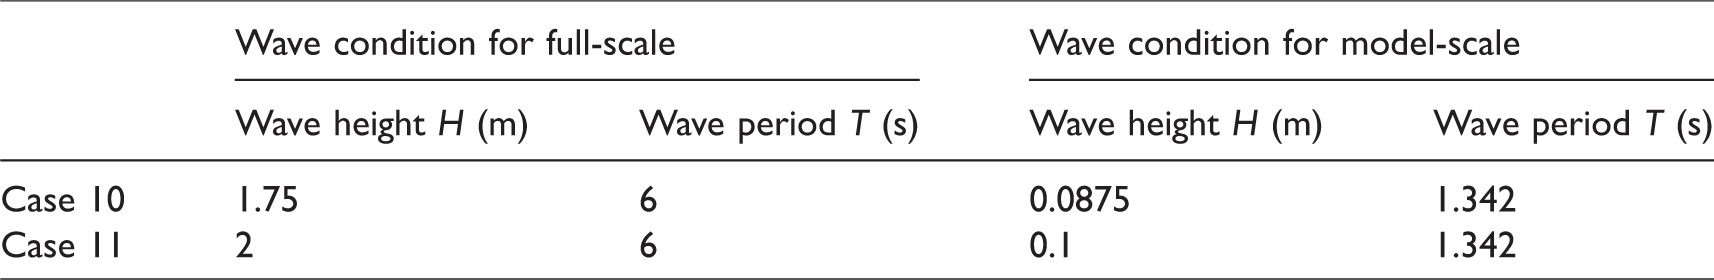
For field application, the chosen sea areas need to have relatively abundant wave energy and be easy for measuring and testing. According to the statistic measured from the East Sea of China, we can find the significant wave heights in the Sheng Shan, Xia Da Chen and Tai Shan, respectively, are 1.1 m, 1.3 m, and 1.4 m. And the average wave periods are 4.6 s, 6.5 s, and 5.6 s. 28 Hence, the sea conditions in East Sea of China is taken as experimental conditions and listed in Table 2. We hope that the regulation of the overtopping can be captured.
The wave condition used in the test.
The wave condition added in the test.
To monitor the overtopping discharge, the bottoms of the reservoirs were set to sense the gravity of the water in reservoirs. The change of the force is measurable. The quality of the liquid can be calculated by the gravity of the water.
There are four results we want to get, such as the optimal performances in the overtopping of the wave period and wave height, the difference between the original single-level device and the multi-level device, the consistency and difference between the various experimental value and the theoretical value, and the best efficiency of generating the power.
As shown in Figure 6, as the increasing of the wave period, the hydraulic efficiency will descend under the same wave height. Although the wave overtopping discharge will increase with the wave period, the interval time is too long to decrease the efficiency. By observing the result, we can find that q will be at the lowest position when the wave period T is 1.118 s. This is an interesting result that we will pay attention to.
In terms of the hydraulic efficiency, the efficiency
In order to figure out the feature of the wave height’s influence on the average wave overtopping discharge per width, the extra wave conditions are added into the tests (Table 3).
During the calculation of wave overtopping discharge, we found that the first overtopping discharge is the least. The reason which cause this result is the initial effect of generating wave. The first wave overtopping discharge needs to be discarded when we calculate the discharge. As shown in Figure 8. The overtopping discharge per width has a linear growth relationship with wave height.
Figures 9 and 10 show the processing of the whole overtopping. The process can be divided into three parts. In the first part, the wave is approaching the device and it will meet with the backflow resulted by the previous wave. The backflow will have a negative influence on the coming flow, so the backflow needs to be reduced. The second part is the overtopping process. Wave will rush through the ramp and get into the reservoir, the water will fall into the reservoir and get mixed with the existing water in the reservoir. The final part is the detour flow. Wave will stream across the device and impact each other at the back of the device, some spray may rush into the reservoir and have a positive influence on the hydraulic efficiency.
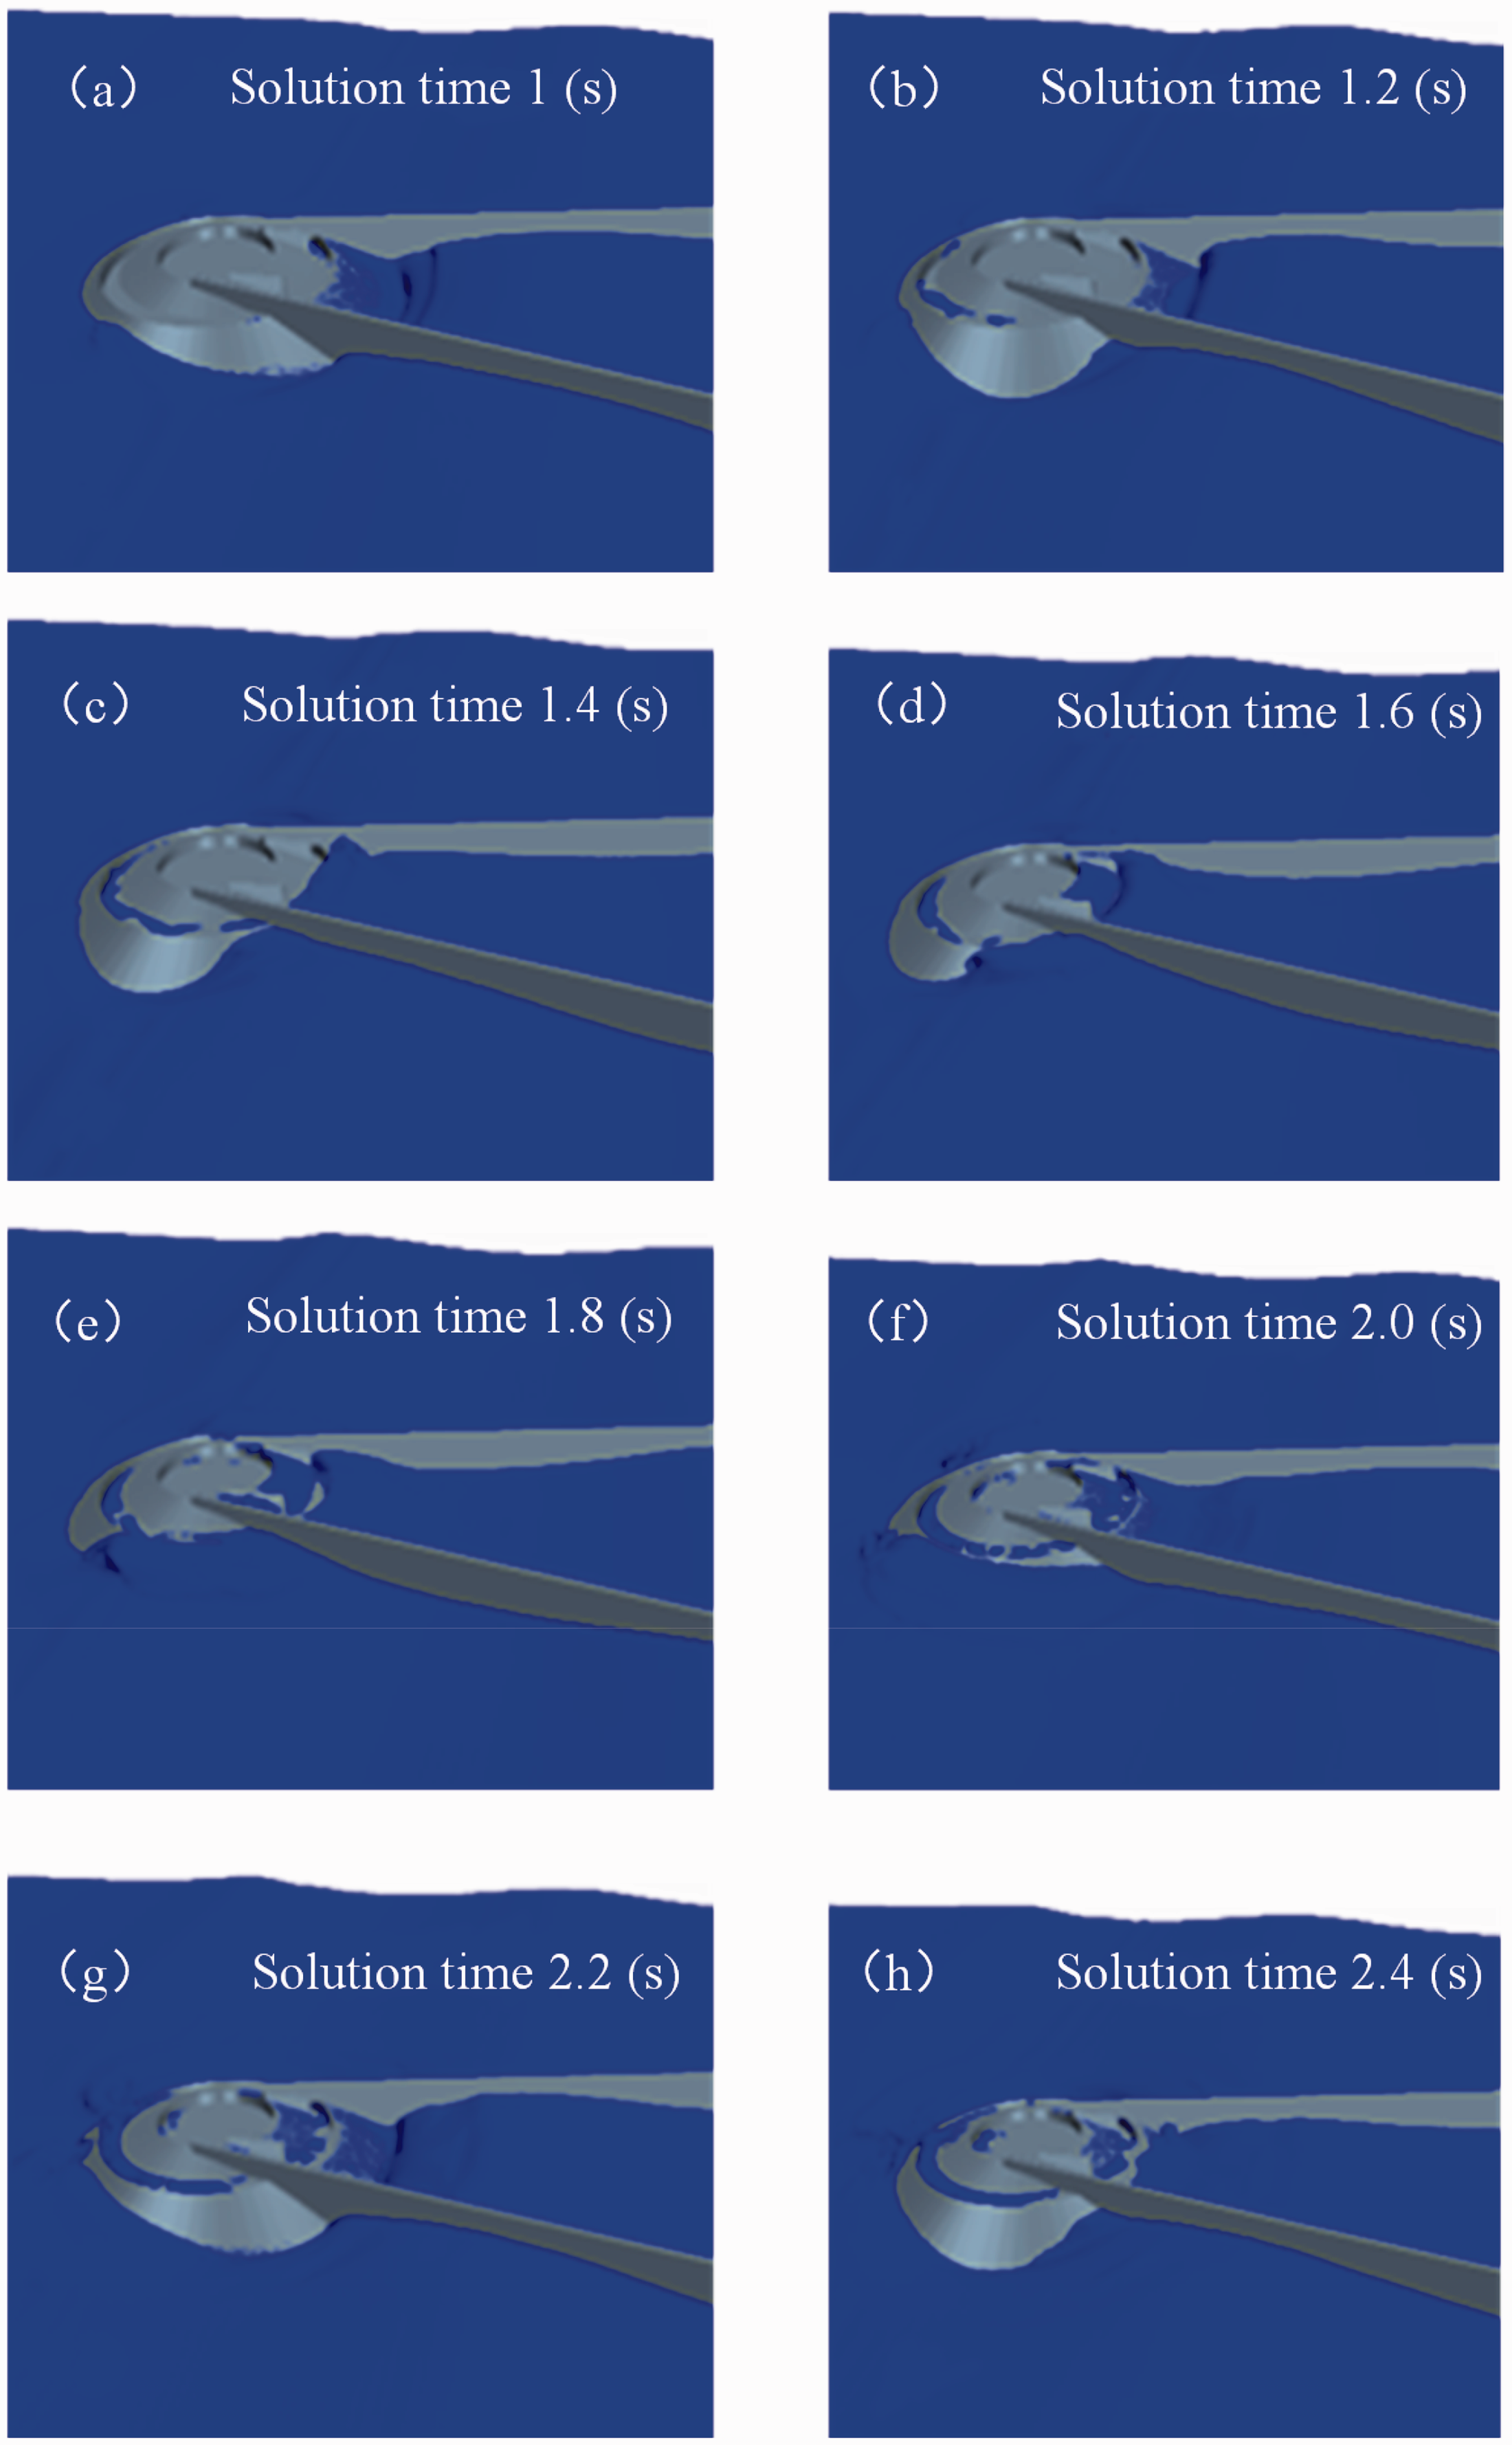
The overtopping processes of multi-level device in one period (H = 0.075 m, T = 1.342 s).
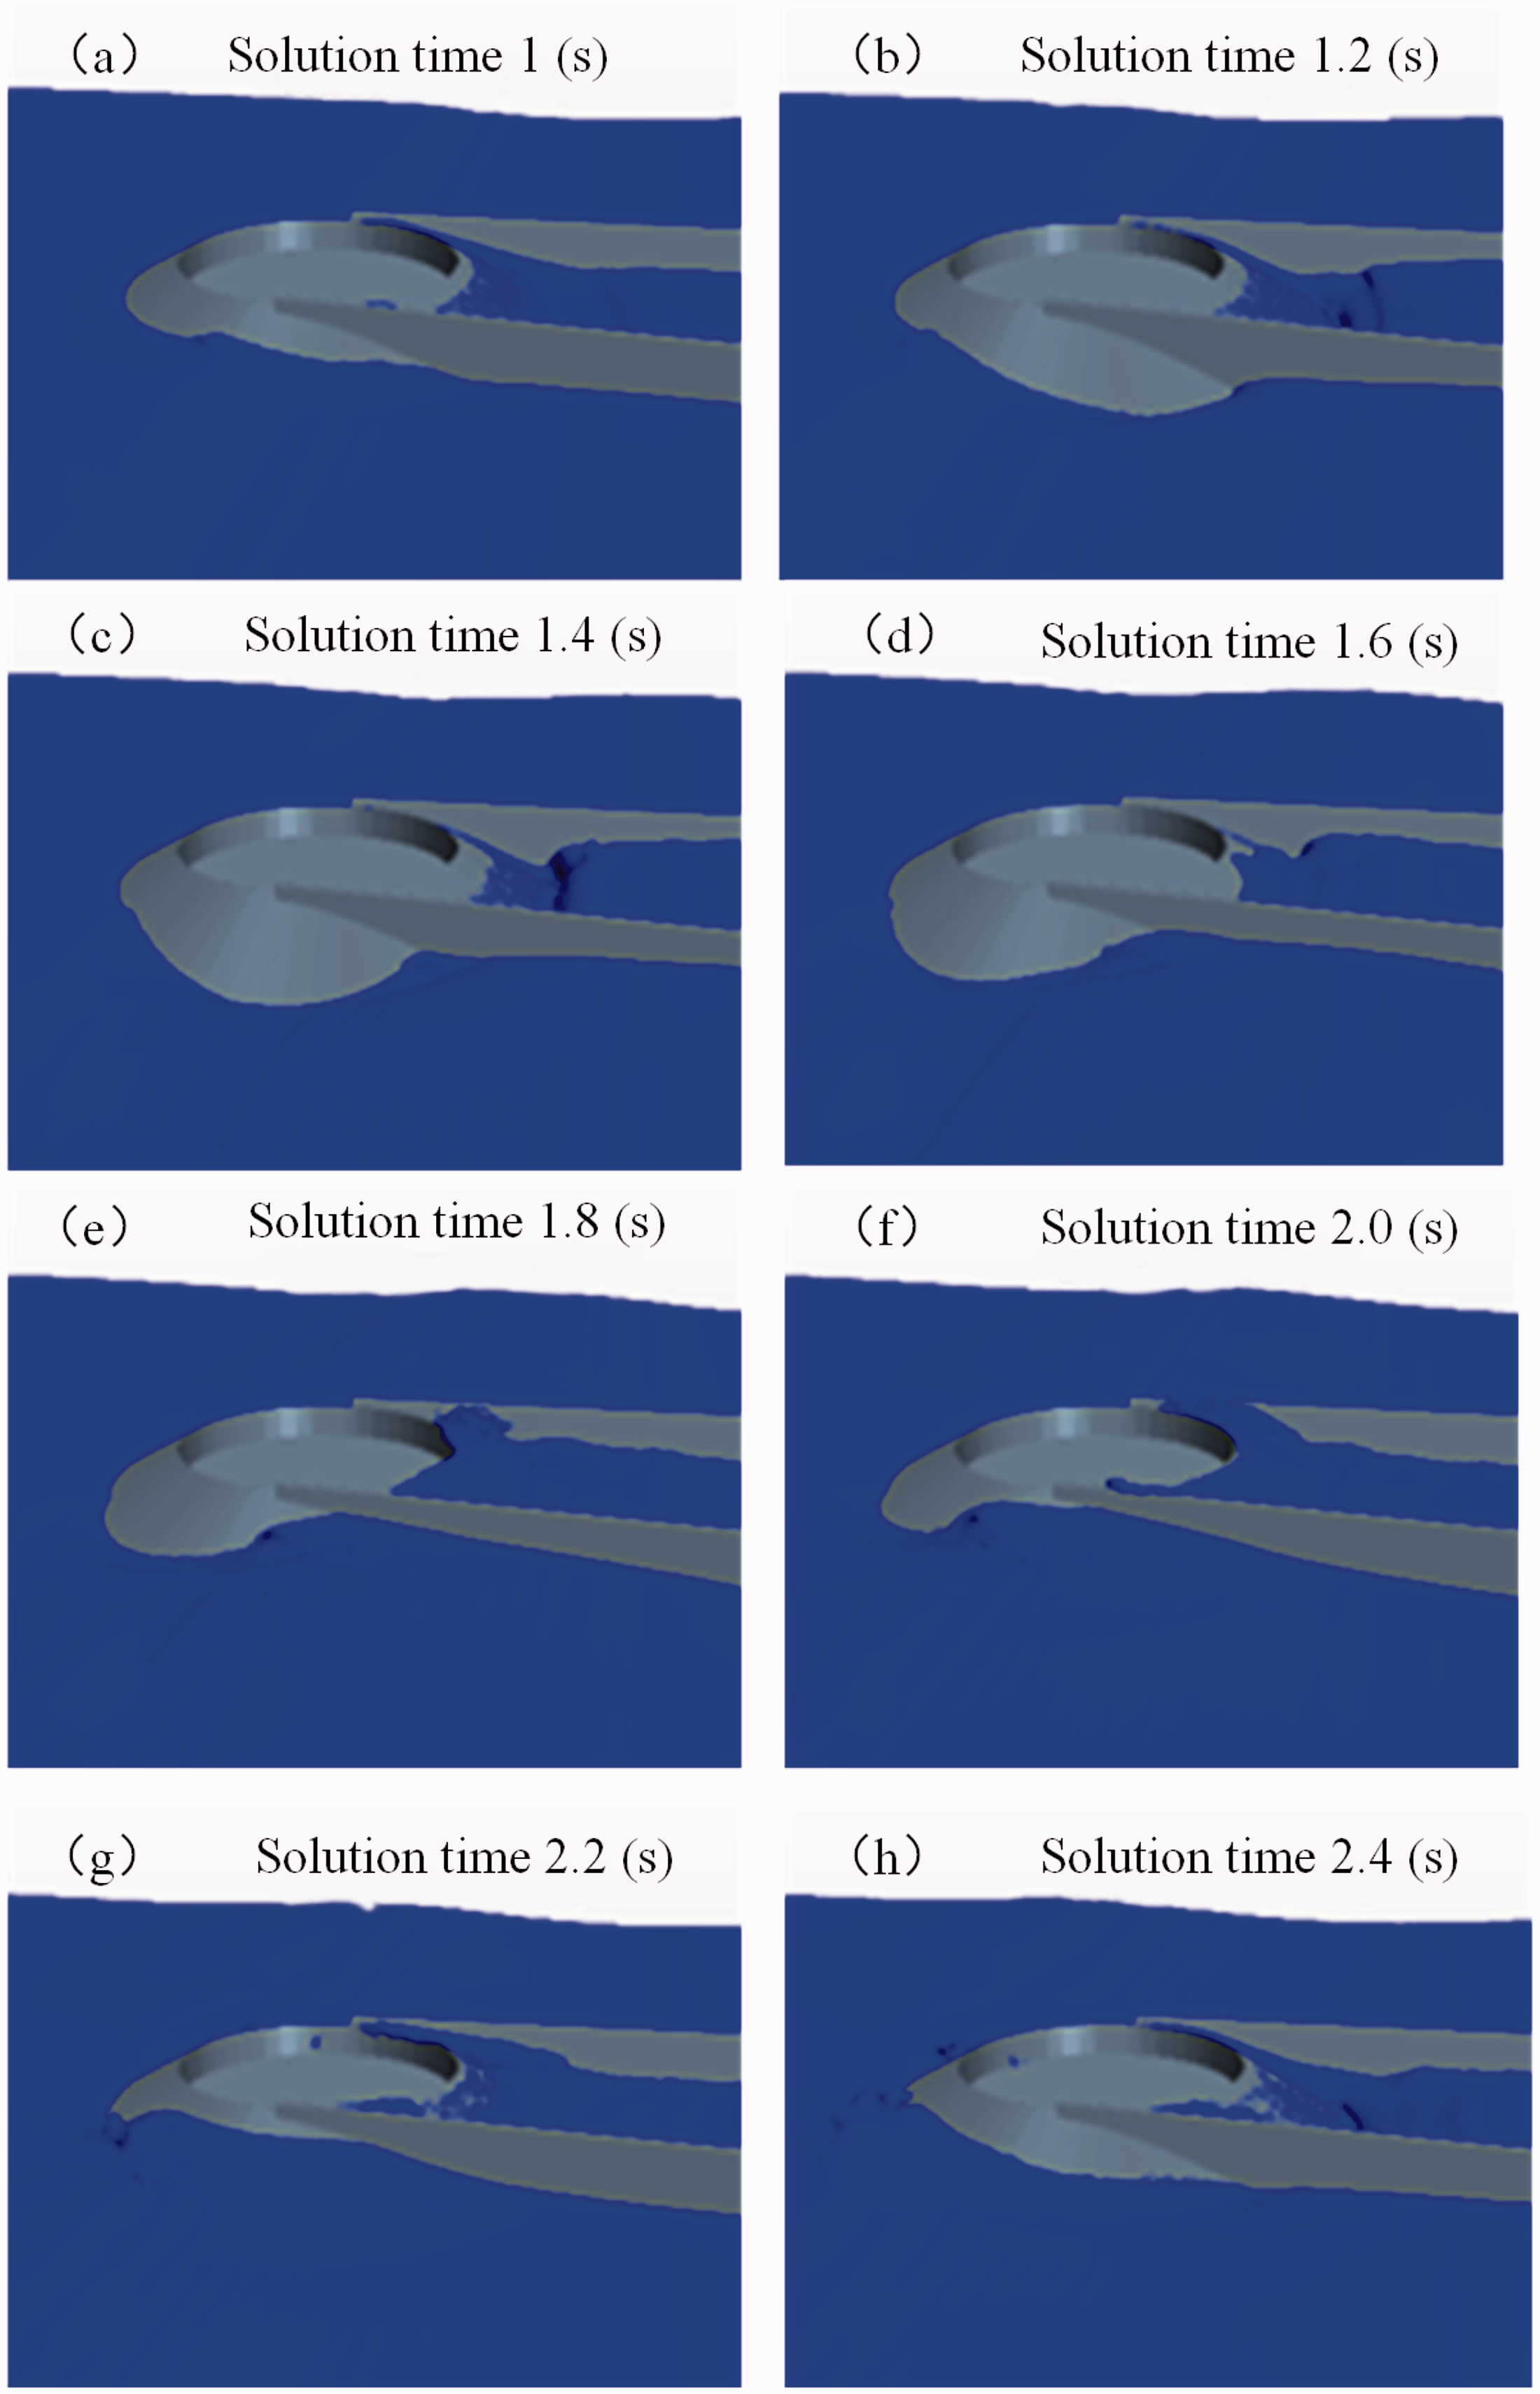
The overtopping processes of single-level device in one period (H = 0.075 m, T = 1.342 s).
Comparing the multi-level overtopping wave power device with the single-level one, we can find the same wave condition. The single-level overtopping wave power device is designed as the Figure 2(a). The MOWPD is a better one both on the average wave overtopping discharge per width q and the hydraulic efficiency (Figure 11). It can be understood that the MOWPD can adapt to a variety of wave conditions for its first-level freeboard height is lower. The backflow is decreased and the overtopping discharge is raised. The water which overtop to the second ramp but fail to get into the second reservoir will go back to the first reservoir.
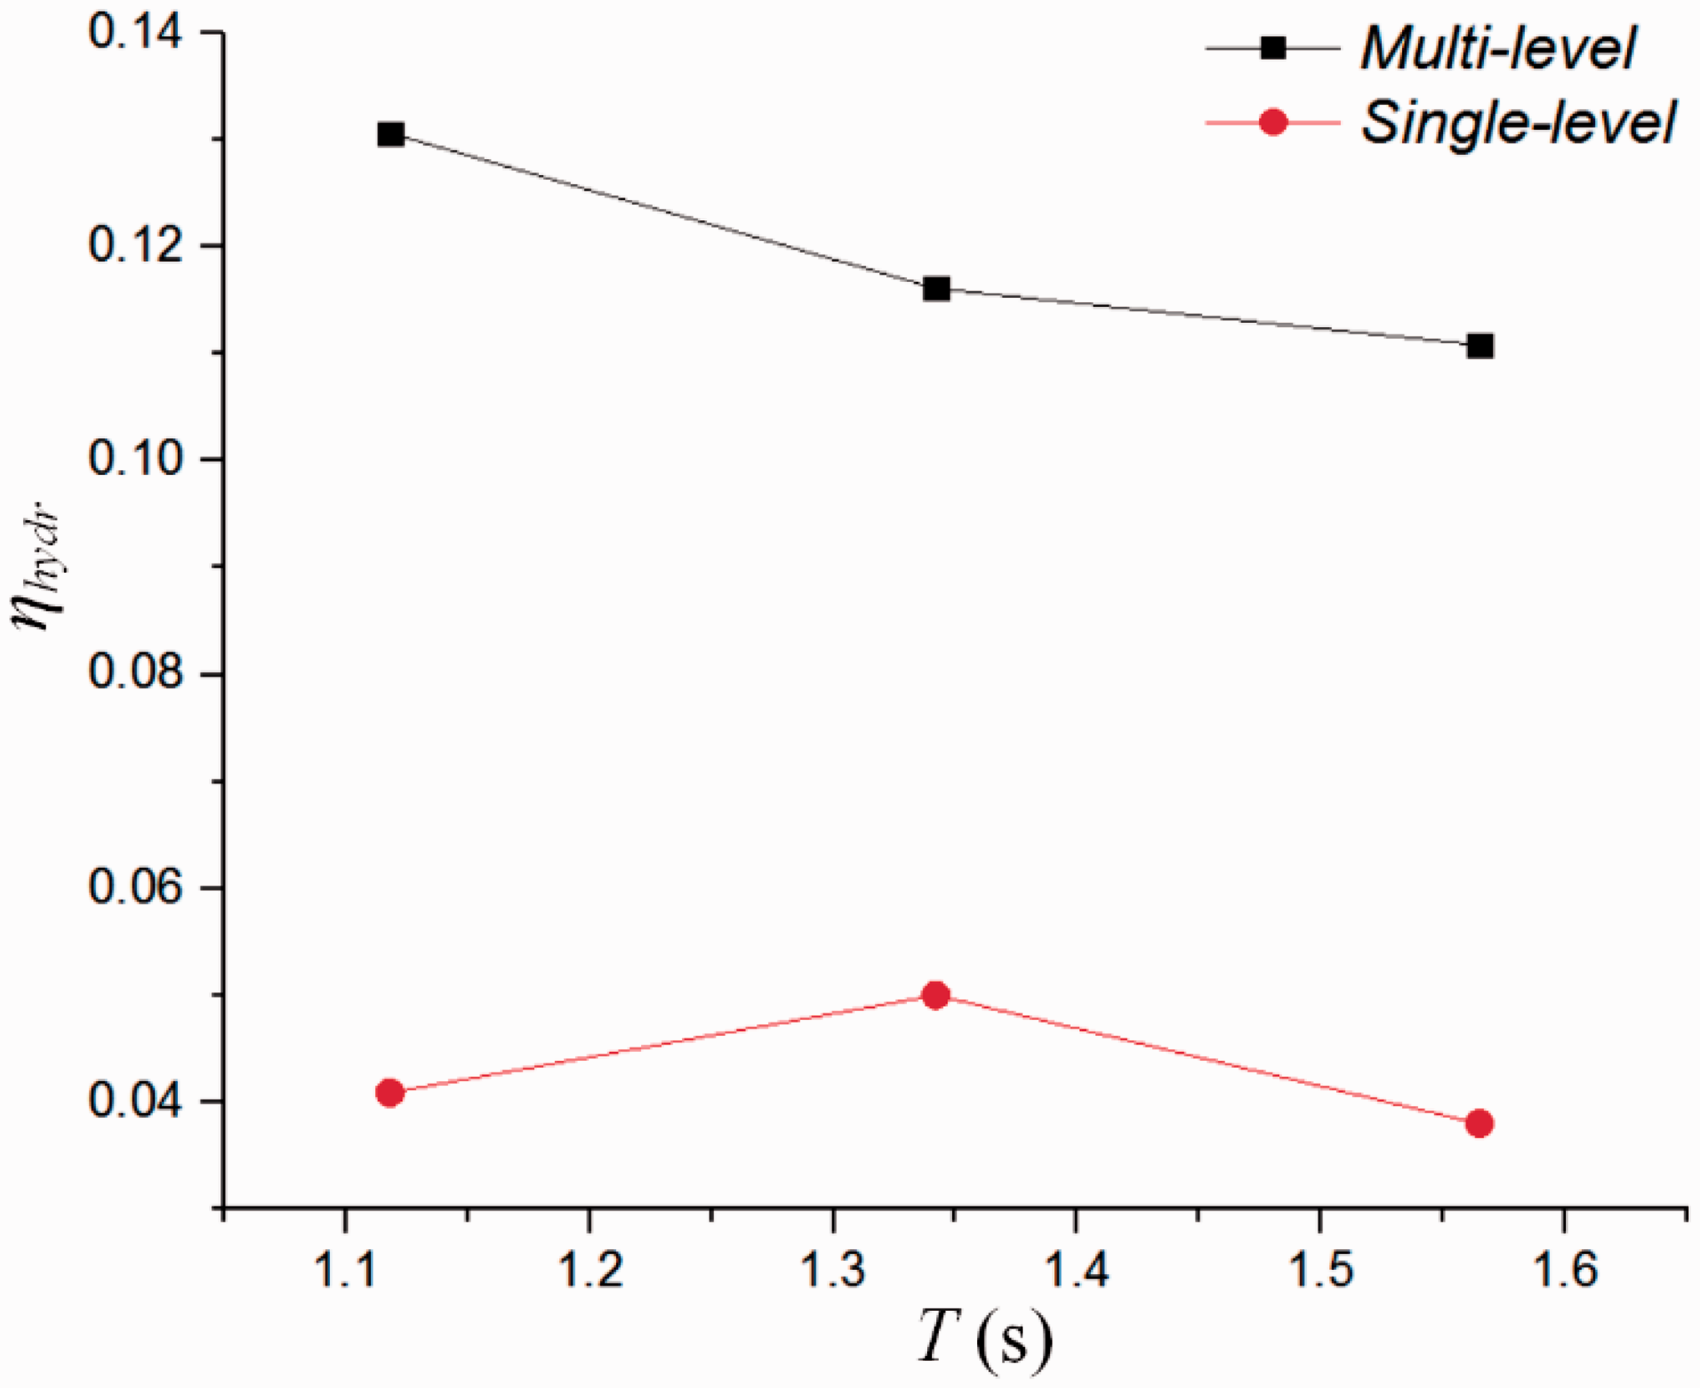
The comparison of the hydraulic efficiency of the multi-level and single-level device.
Finally, when we compare the theoretical value and the experimental value, the linear feature can be captured. Hence, the formula which fit to the theoretical value and the experimental value of the single-level device can be improved to fit the experimental value of the multi-level device.
According to Figure 12, in terms of the slope, the dimensionless discharge of the single level is similar to the theoretical. The intercept of single level is bigger than the theoretical value, the reason might be that the horizontal plate, the reflectors, and so on were added into the single-level device, and they would increase the overtopping discharge. But the result of the multi-level discharge is different from the theoretical value. As we can see, the intercepts of both situations are similar, so the slope is the main factor of the linear equation. Increasing factor 
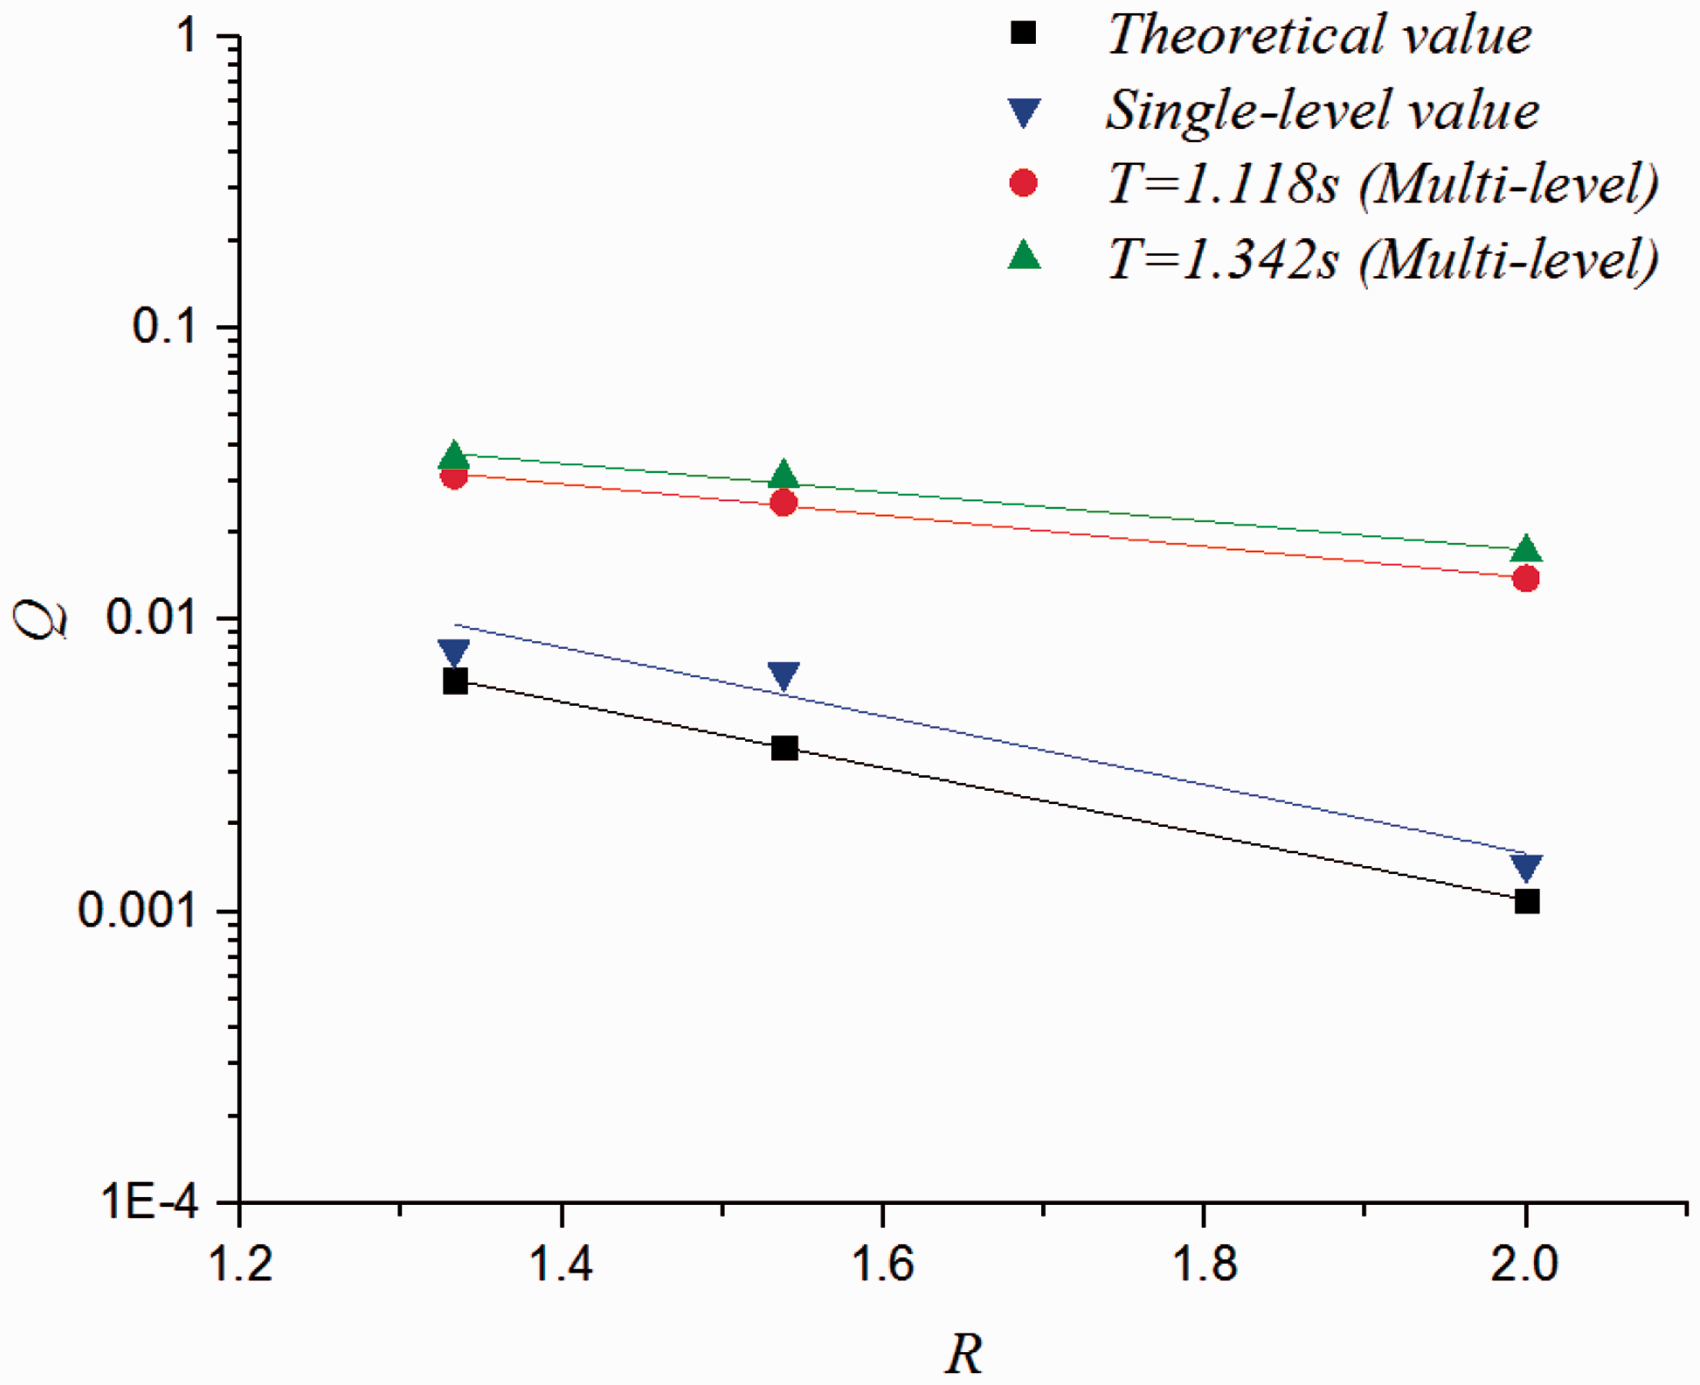
The dimensionless freeboard’s relationship with the dimensionless discharge.
Conclusion
The design of the WEC 29 has taken the angle of the slope, the crest freeboard, the draft, the linear converging guiding walls, and the vertical and horizontal distribution of the reservoirs into account. The final design refers to the conclusion of the previous research and is combined with the creative improvement of the multi-level structure which can have better performance for the complex wave condition.
By using CFDs tool, the model can be tested by computer. According to the design parameter, the 3D model has been constructed. The grid and the physical condition are set to precisely simulate the experiments. The Eulerian multiphase flow and the volume of fluid wave is used to present the fluid items. The turbulence model is К-ε model. The wave condition of the East China Sea is taken as the aiming sea area.
Observing the figures and the tables, we can find the relationship between the wave and the overtopping discharge. At the same wave height, the average wave overtopping discharge per width q is a minimum, and the hydraulic efficiency decreases with the change of the wave period. At the same wave period, both the average wave overtopping discharge per width q and the hydraulic efficiency will increase with the increase of the wave height. By comparing the multi-level device and the original single-level device, we find that there is an obvious improvement in the hydraulic efficiency. The previous equation of the overtopping discharge is improved by adding a factor
Footnotes
Declaration of conflicting interests
The author(s) declared no potential conflicts of interest with respect to the research, authorship, and/or publication of this article.
Funding
The author(s) disclosed receipt of the following financial support for the research, authorship, and/or publication of this article: This research is supported by Conservation Science and Technology Program of Administration of Cultural Heritage, Zhejiang Province (No. 2016010).