
Abstract
This work is aimed to develop a parameterized time–frequency analysis method combined with vibration and acoustic measurements for gear fault diagnosis. To achieve this aim, the work introduces the combined use of the residual method and general linear chirplet transform using acoustic and vibration measurements from a single stage spur gearbox. Experimental works were undertaken on a developed gearbox test rig. It was found from experiments that despite acoustic measurements were heavily corrupted by measurement noise, the use of the combined general linear chirplet transform method provided more accurate fault severity assessment compared to other commonly used diagnostic methods: continuous wavelet transform and pseudo Wigner–Ville distribution methods. The combined general linear chirplet transform method allows an accurate determination of the angular location of gear fault and a better representation of sidebands associated with the severity level of gear fault. The results demonstrate the potential of using non-contact acoustic measurement using the combined general linear chirplet transform method as an alternative sensing method for gear condition monitoring applications.
Keywords
Introduction
A gearbox is one of the main components in rotating machineries whose faults can cause major and expensive breakdown of machineries. There are a variety of signal processing methods that have been introduced for analyzing gearbox vibration signals to detect faults in gears. Time synchronous averaging,1,2 statistical analysis (e.g. kurtosis, RMS, signal-to-noise ratio, etc.) and fast Fourier transform (FFT) 3 methods are commonly utilized for gear fault diagnosis purposes. However, these methods are based on the stationary assumption of the underlying signal, whereas signals associated with a faulty gear tooth are considered as non-stationary signals.1,2 Hence, there are limitation of these methods in obtaining accurate information regarding the state-of-health of the gearbox, although they are commonly used for gear health monitoring purposes.3–8 Thus, signal processing methods with the capability of extracting the non-stationary characteristics of faulty gearbox are expected to be able to improve the accuracy of gear fault diagnosis.
Time–frequency methods have been well known for their ability to process non-stationary signals, which typically arise from a faulty gearbox system.9,10Among them, the continuous wavelet transform (CWT) and Wigner–Ville distribution (WVD) methods are the two most widely accepted time–frequency methods for gear fault diagnosis. Although they can offer a better time–frequency representation compared to other conventional time–frequency methods, such as the short time Fourier transform (STFT) method, 10 they have also limitations in analyzing complex signals generated from a faulty gearbox system. The CWT method has lower frequency resolution in the higher frequency region compared to the lower frequency region, whereas the fault features from a faulty gearbox are generally spread over a wide frequency bandwidth including the high frequency region.10 On the other hand, the WVD method suffers from interference terms that can mislead the interpretation of the time–frequency representation, particularly for analyzing multi-component signals associated with faulty gearbox signals. 10 Therefore, there is the need for a signal processing method that is not only capable to generate a satisfactory time–frequency representation of the underlying gearbox signals, but also capable of analyzing multi-component signals so that accurate fault diagnostics of a gearbox system can be achieved.
To address those challenges, one of the most appealing signal processing methods that has been proposed recently is the parameterized time–frequency analysis (TFA). By focusing on the identification of inherent signal features and construction of appropriate window functions, a remarkable time–frequency concentration can be achieved.11Several approaches have been utilized to achieve this goal, such as by utilizing a non-linear mathematical model to capture the instantaneous frequency (IF) component of the underlying signals, e.g. generalized Warblet transform, 12 polynomial chirplet transform, 13 and spline-kernelled chirplet transform. 14 These methods are known as generalized parameterized time–frequency analysis (GPTFA) methods. Although they have a superior time–frequency representation, to the best of authors’ knowledge, the application of parameterized time–frequency representation for specific gear fault diagnosis has not been found in the existing literatures. One of the reasons is related to the fact that a single mathematical model that the GPTFA method tries to construct is not sufficient to characterize multi-component signals with different IF features, which is the case for gear fault signals. 11 On the other hand, a generalized linear chirplet transform (GLCT) method has been proposed recently to solve the drawback from the existing parameterized TFA methods.11Its innovative algorithm has been claimed to be robust to measurement noise and also been able to capture the IF component of multi-component signals. 11 Hence, recognizing the potential of such methods, one of two objectives of this work is to propose the use of a parameterized TFA method, i.e. the GLCT method, for gear fault diagnosis. For comparison, the utilization of the CWT and pseudo WVD (PWVD) methods is also investigated in this study. Furthermore, this work does not rely solely on the use of a time-frequency method to process the raw signal measurements from a gearbox test-rig, but also considers the utilization of residual method as a pre-processing tool to remove the measurement noise and asynchronous signal components, which can corrupt the useful signal information for gear fault diagnosis. Hence, it is expected that more accurate fault diagnostic information regarding the state-of-health of the gearbox can be achieved.
Another main objective of the work is to investigate the use of non-contact measurement combined with the parameterized TFA method as an alternative fault diagnostic method. Regardless of the development of the time–frequency methods described previously, gear fault diagnosis has been heavily focused on the use of vibration-based measurements. Although acoustic measurements can also contain abundant information regarding the state-of-health of the gearbox and several studies have been shown promising results by using acoustic measurements, there is limited literature that has focused on acoustic-based fault diagnosis for gear health monitoring.8,15–17 In summary, this work proposes the use of a parameterized TFA method, using the combination of residual method with the generalized chirplet transform, with vibration and acoustic measurements for gear fault diagnosis. For this purpose, gear faults in terms of broken teeth with two different severity levels and double defects are investigated in this work to validate the proposed signal processing methodology.
Signal processing methods for gear fault diagnosis
There are various signal processing methods that can be utilized for diagnosing the state-of-health of gearbox systems, including the time–frequency based methods. As previously mentioned, the time–frequency method has the additional advantage in being able to analyze complex and non-stationary signals generated from a faulty gearbox. In this work, such a method using the combined GLCT method is proposed with a particular focus on the use of acoustic measurements, which has not been previously focused on for gear fault diagnosis applications. For evaluating the effectiveness of the proposed method, two most commonly used methods, the bilinear time–frequency distribution (PWVD) and the linear time frequency distribution (CWT) methods, are considered for the comparative analysis. The followings briefly describe the principles of those methods:
The Continuous Wavelet Transform (CWT) Method
The CWT method is considered as one of the most widely applied methods for gear fault diagnosis. One of the earliest gear fault diagnosis method using the wavelet transform was presented by Wang et al.18,19 In this work, the capability of the CWT method to display multi-scales features from a gearbox system in one plot, which is not possible to achieve with the classical STFT method, was demonstrated. However, the success of the CWT method primarily depends on the appropriate selection of the mother wavelet function used for the analysis. According to the literatures, the Morlet wavelet is generally the most appropriate mother wavelet function for gearbox application, 20 since its shape resembles the impulse signal associated with the type of non-stationary signal produced by gearbox with a particular gear fault. This type of mother wavelet is used in the present work and the CWT procedure used in this work is described in the followings, utilizing both vibration and acoustic measurements from the developed gearbox test rig.
Based on the vibration and acoustic measurements obtained from the test rig, the Fourier transform can be used to decompose the vibration and acoustic signals y(t) into their frequency components. The CWT method projects vibration and acoustic signals y(t) into a family of scaled and translated mother wavelet functions Ψ(t). In this case, the multi-scales features contained in signal y(t) can be represented in one plot and the CWT of the signal can be described as21,22


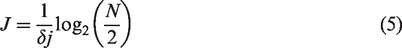
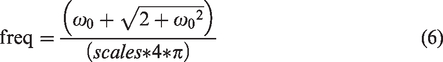
Here Δt is the sampling interval, δj is the parameter which influences the spacing interval for the scales, J is the total number of octaves, and N is the total number of acquired data. Finally, the relationship between the scales and frequency for Morlet wavelet is governed by equation (6)
21
The Pseudo Wigner–Ville Distribution (Pseudo WVD) Method
The WVD method is well known for its ability to provide a relatively accurate estimation of IF of signal compared to the conventional linear frequency transform methods, such as CWT and STFT. However, it can typically only be applied when the underlying signal is a mono-component signal, in contrast to multi-components signals observed in gearbox systems. Hence, the implementation of the WVD method to analyze such multi-component signals not only exacerbates the WVD time–frequency representations but also can provide a misleading interpretation for gear fault diagnosis. Introducing a smoothing time window function in the WVD method can help to reduce the interference phenomena to certain extent, although it cannot remove it completely. This method is called the pseudo Wigner–Ville distribution (PWVD).23Although this method can improve the accuracy of gear fault diagnosis, there is a trade-off of introducing the smoothing window function, i.e. the reduction of the WVD time–frequency resolution. Hence, the type and length of smoothing window function are crucial factors that need to be selected properly in the implementation of the PWVD method. Previous works have reported a successful application of the PWVD method in detecting gear crack faults in a gearbox system,
12
where the PWVD can be represented as follows
23

Here g is the frequency smoothing window with g(0)=1, whereas z(t) is the Hilbert transform of the vibration or acoustic signals y(t). A Hamming window of 31-samples length is used for PWVD analysis in this work.
The Generalized Linear Chirplet Transform (GLCT) Method
Although the CWT and PWVD methods can be considered as some of the most advanced time–frequency methods in gear fault diagnosis, they have particular drawbacks for analyzing gearbox signals as previously described. To address the drawbacks, a more advanced signal processing method that can analyze non-linear and multi-components signals associated with faulty gearbox signals, is highly desirable. It was mentioned briefly in the introduction that parameterized TFA was developed in an attempt to improve the existing joint TFA, such as CWT and PWVD. This is done by adding another signal-dependent parameter (e.g. chirp parameter), apart from the parameters related to the window length in PWVD or the scale in CWT. However, the drawback of this method is that it only works well with mono-component signals, although it can provide a better time–frequency representation compared to other conventional time–frequency methods. In contrast, the gearbox signals have multi-component signal characteristics. The signal is typically characterized by gearmesh frequency and its harmonics, with sidebands that are distributed over a wide frequency bandwidth. In this case, the ability of standard parameterized time–frequency methods in dealing with these multi-component signals will be limited. On the other hand, the GLCT method has been recently proposed to address this drawback. 11 The method is claimed to be a more advanced parameterized time–frequency method that is not only able to analyze non-linear and multi-component signals, such as the impulse signals from gearbox, but it is also robust to measurement noise contamination. 11 However, the GLCT method is a relatively new method with its limitation in dealing with real experimental data, whose investigation has not been focused on in the existing literature. Hence, this work attempts to investigate further its effectiveness to process the signals from the gearbox system. Moreover, this work also integrates the residual technique with the method so that better fault diagnosis can be achieved. The details procedure of GLCT is described in the subsequent paragraph. For this purpose, the GLCT procedure used in this work is described in the followings.
The well-known linear chirplet transform (LCT) of vibration and acoustic signals y(t) can be expressed by equation (8) below
11


Another parameter that needs to be chosen is the number of segments denoted by R which determines α as expressed in equation (10)


Equations (10) to (12) present the main novelty of the GLCT algorithm, utilizing a series of discrete demodulated operators, rather than trying to identify the IF feature of the signal by constructing a non-linear mathematical model as in the case of other parameterized TFA methods. Several chirp parameters will be utilized to identify the optimal value c that can capture the non-linear time-varying frequency signals. The optimal value of c, which is denoted as
Experimental results on a gearbox test-rig
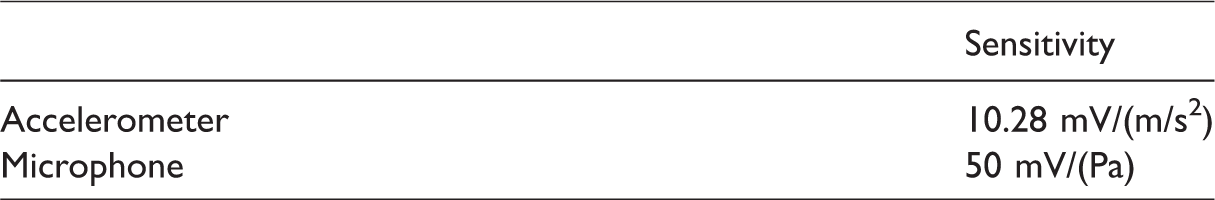
In this work, a gearbox test rig was assembled at The University of Nottingham Ningbo China to validate the proposed signal processing methodology as shown in Figure 1. A 1 HP dc motor acted as the driver of the gearbox system and a magnetic break was used to provide load. In this experiment, the speed of the DC motor was set at 500 round/min during the whole experiment. The constant speed was ensured by the torque and speed sensors located at the input and output of the gearbox. The Nexus Optical Table was utilized as the platform for the test rig for isolating external vibrations. A G. R. A. S microphone was used for the acoustics measurement and PCB Piezotronics accelerometer was used to measure the vibrations of the gearbox. The microphone was located 20 cm from the gearbox, whereas the accelerometer was located at the bearing attached at the right side of the gearbox input shaft as shown in Figure 2. The detailed specifications of the accelerometer and microphone are listed in Table 1. A Monarch Instrument tachometer was also used to provide phase-reference information for time synchronous averaging purposes.
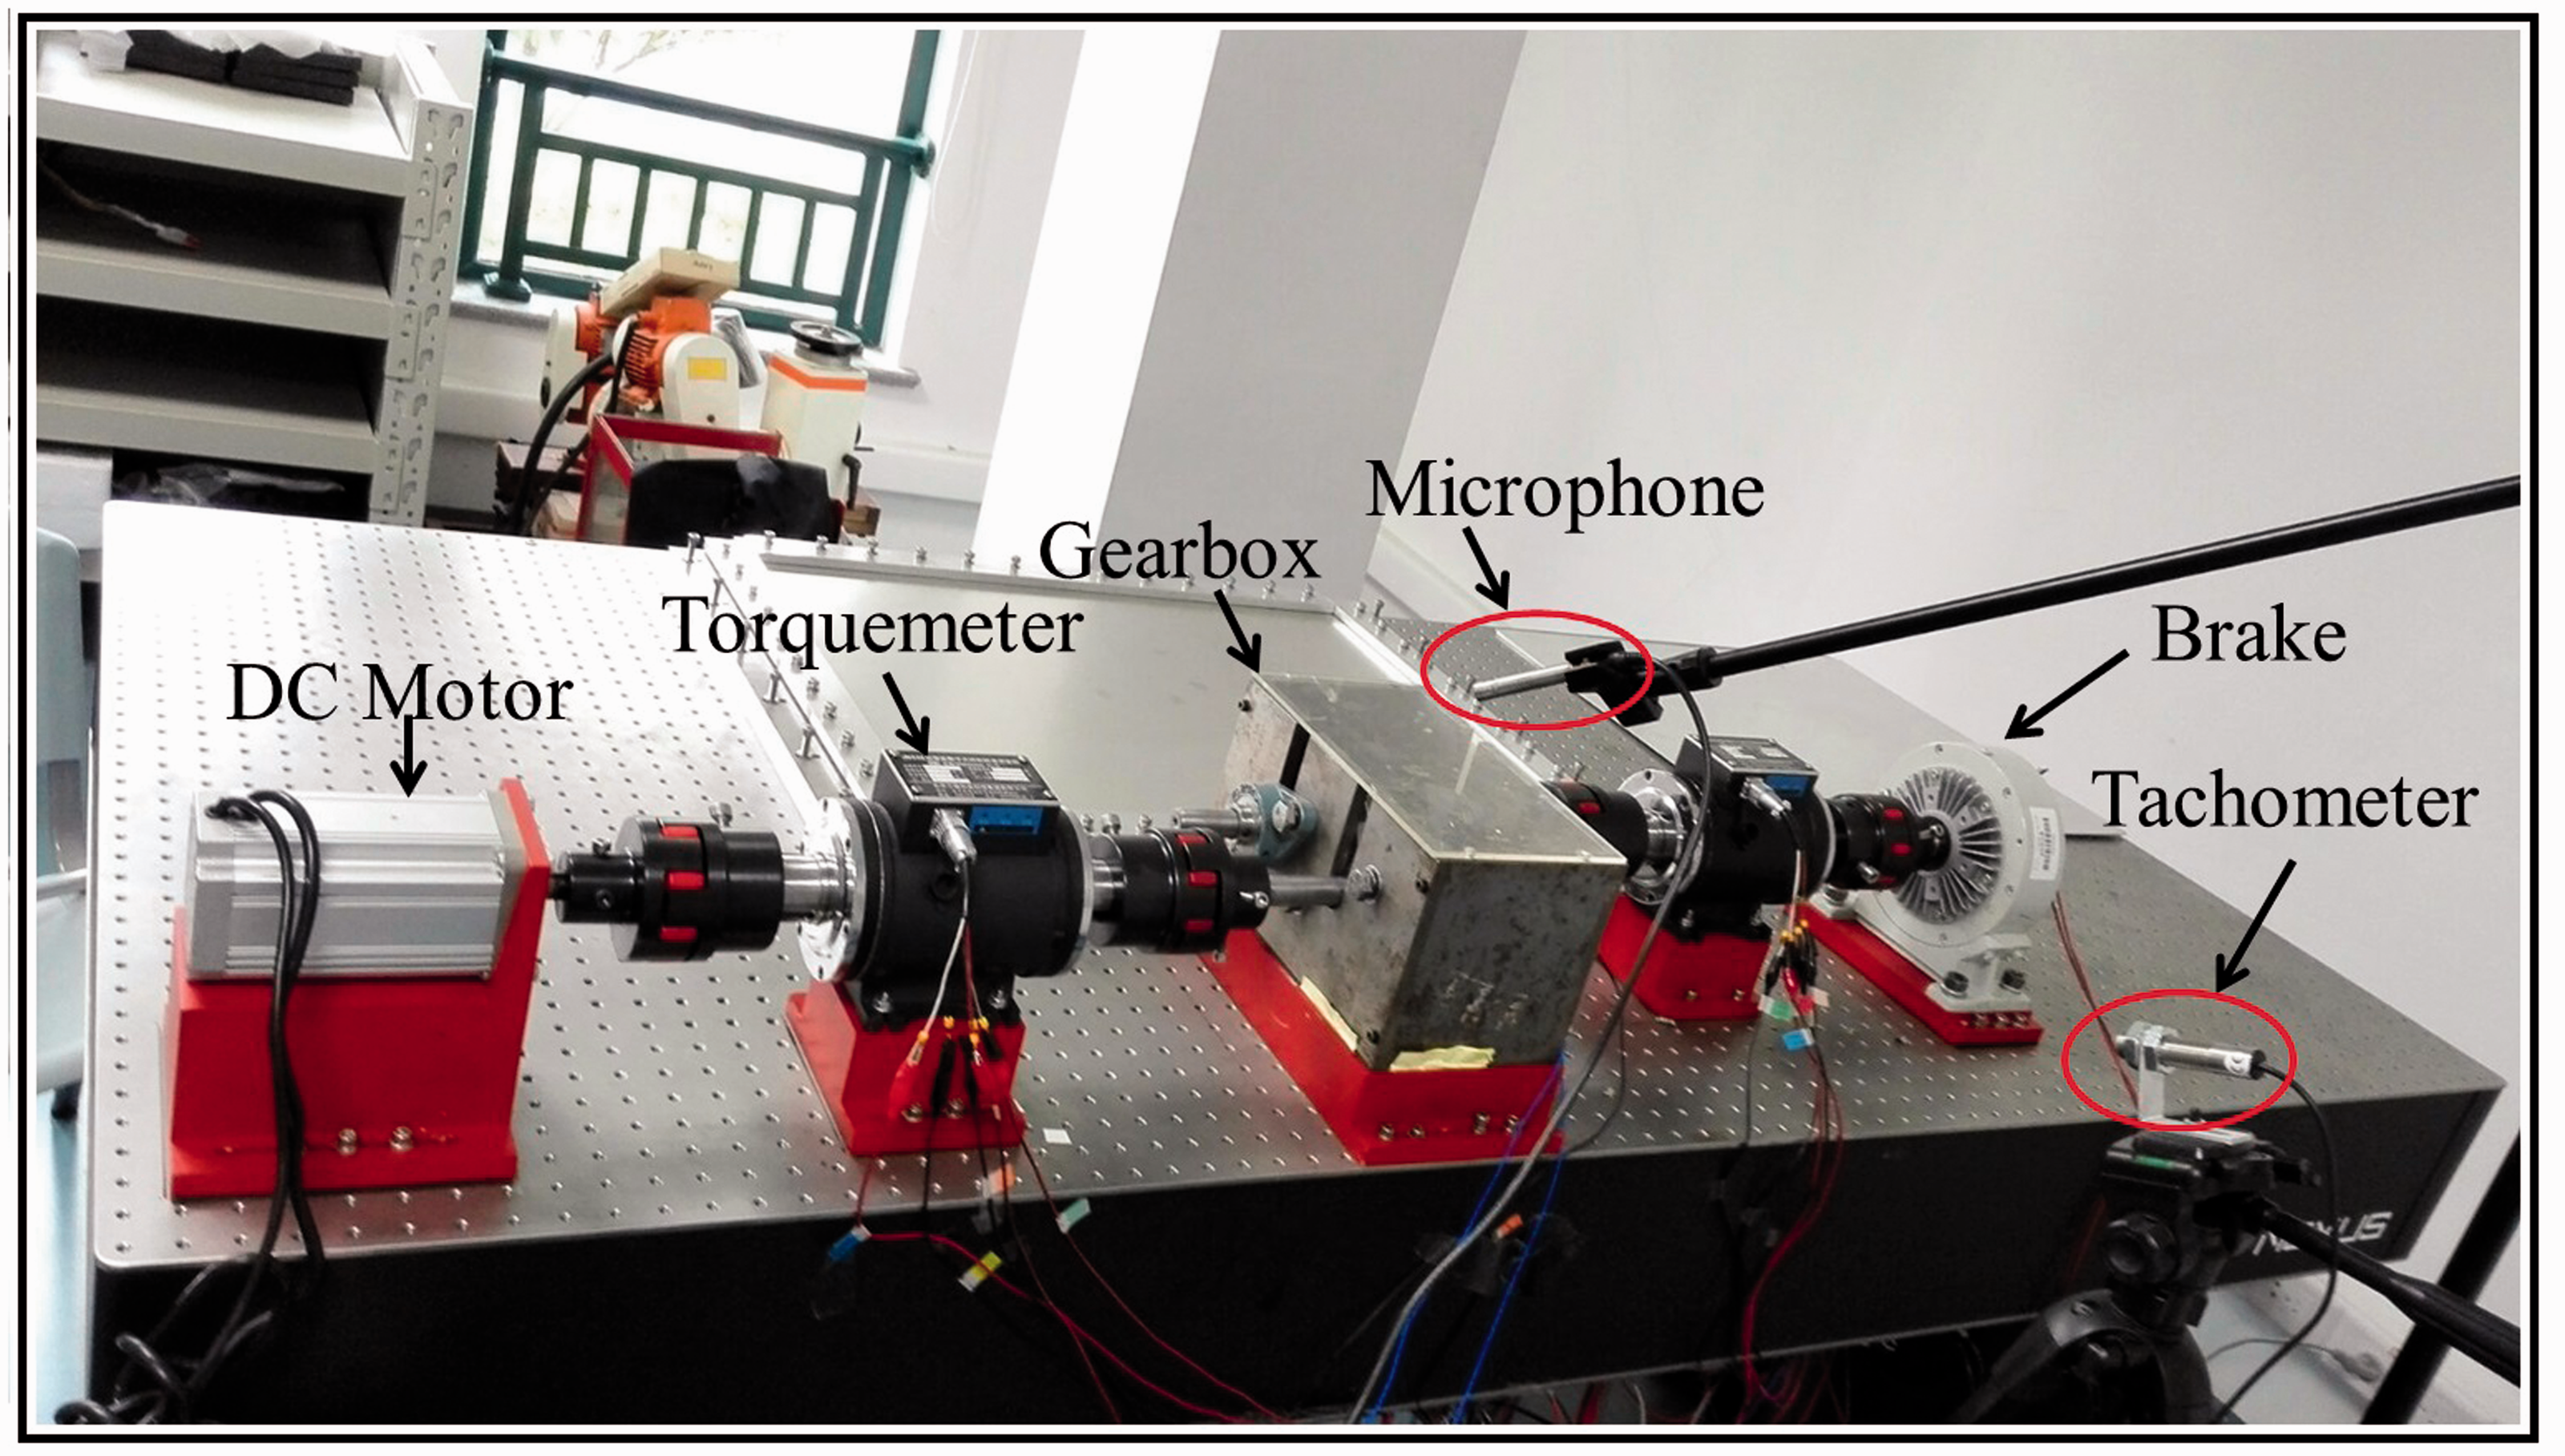
The gearbox test-rig.
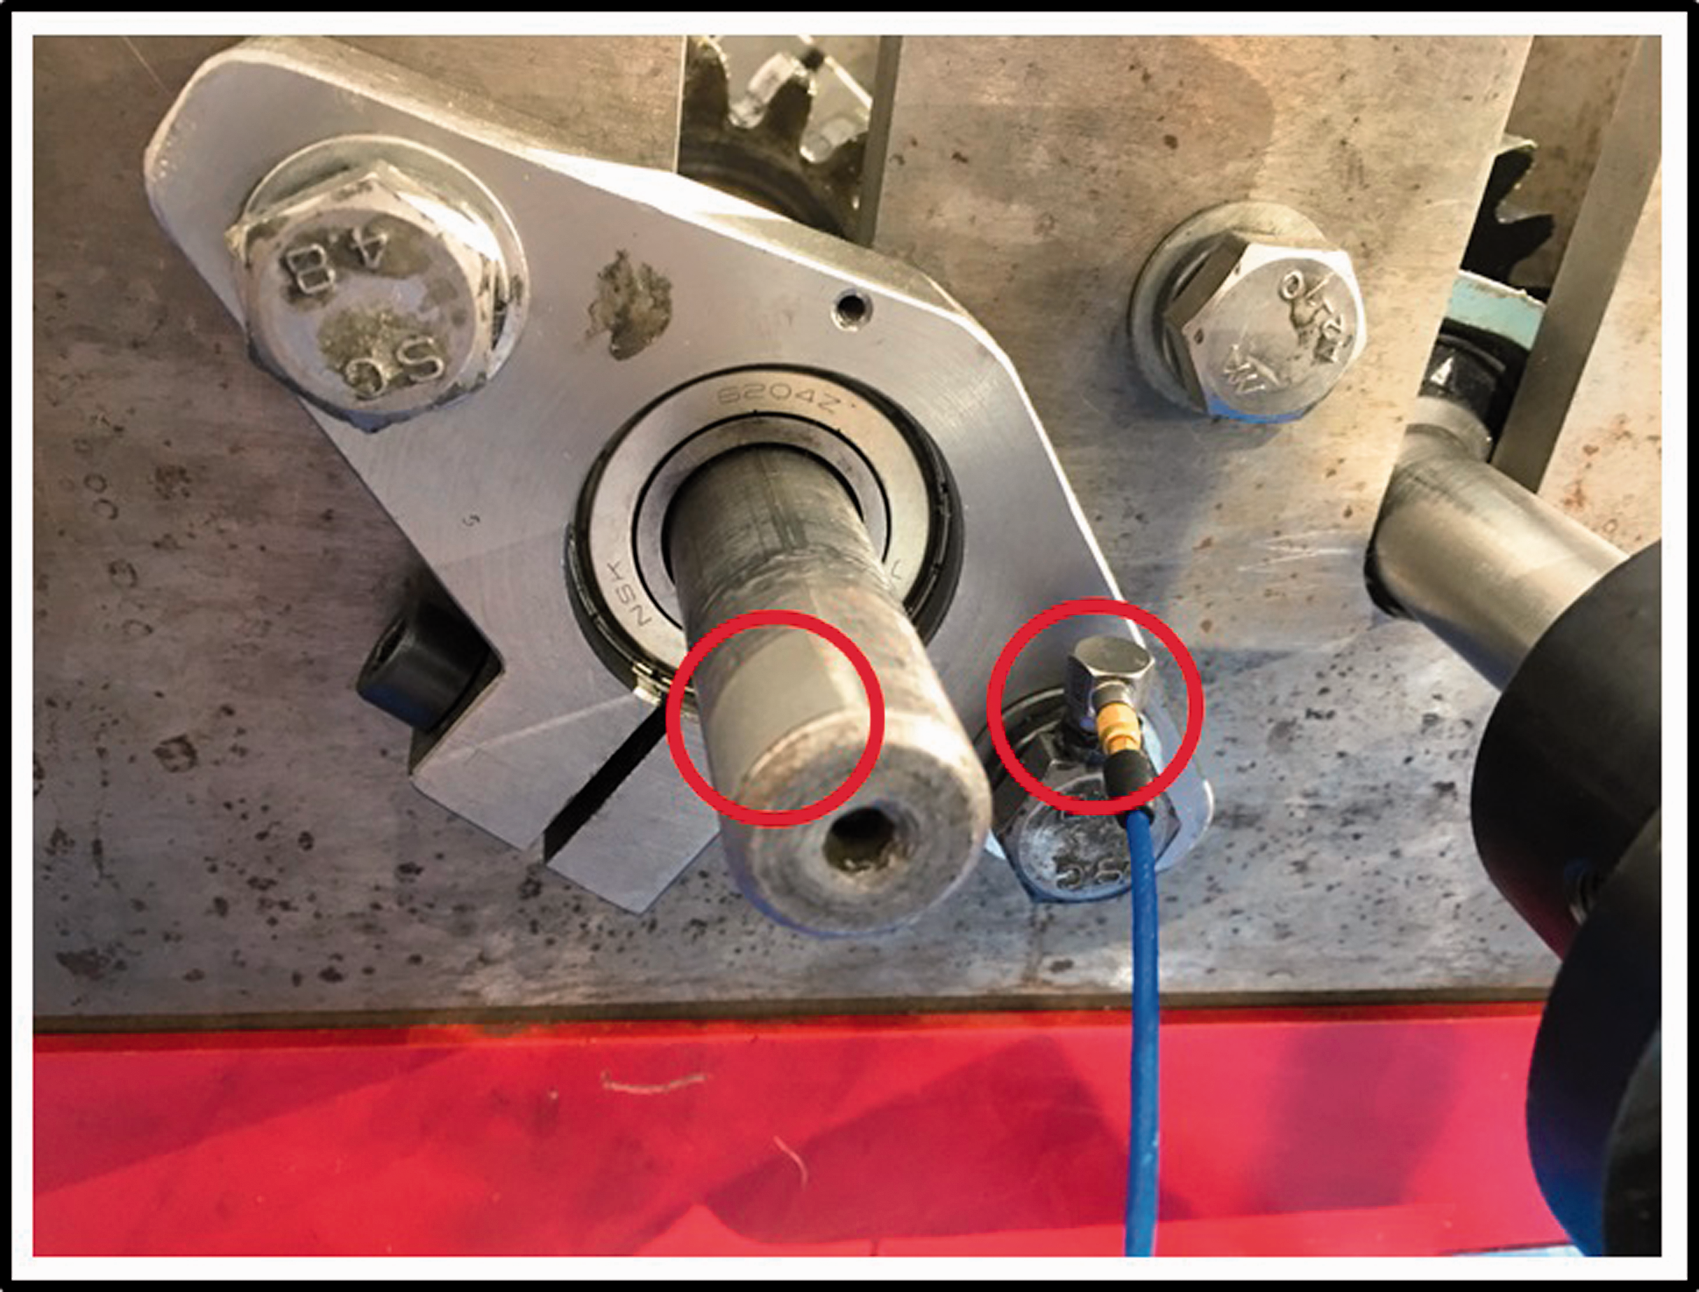
The location of the accelerometer and the tape used for tachometer sensing.
Transducer specification.
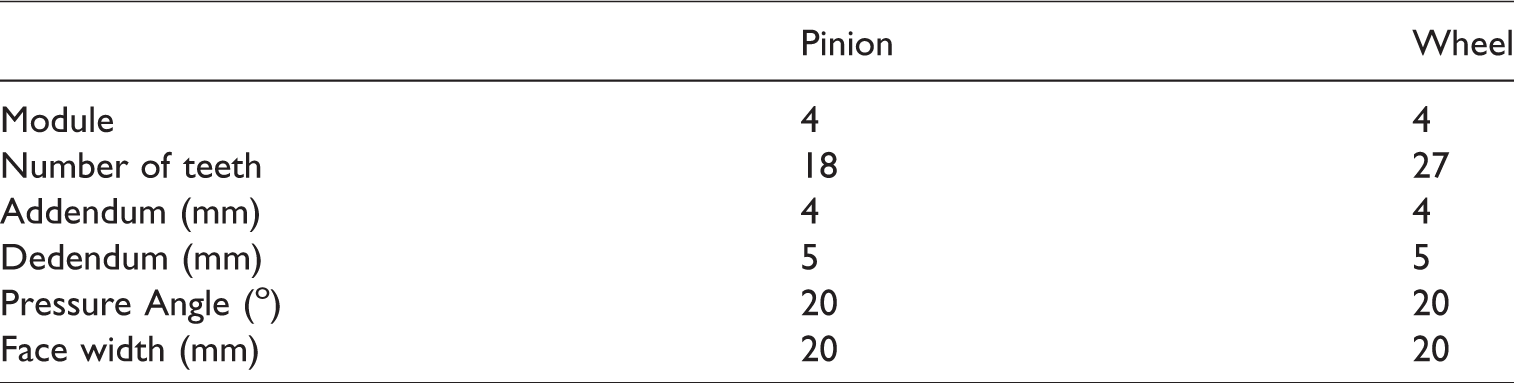
A single-stage spur gear was studied in this work with gear specifications presented in Table 2. The pinion was located at the input shaft to achieve a speed reducer gearbox configuration. The gear defects were artificially created with a milling process at the pinion where three types of defects were considered for further analysis. Figures 3(a) to (c) show the gears with three types of defects used in the experiment: the gears with partial tooth loss with two different fault severity levels and the gear with double defects, consisting of the partial tooth loss with the medium fault severity level and a chipped tooth. These defects were used in the experiment because the partial tooth loss and chipped tooth are considered as the most common types of fault in industrial gearbox applications. 24 The partial tooth loss was achieved by 5 mm and 8 mm depth-wise tooth removal along the face width to simulate the medium fault severity level and high fault severity level, respectively. The tooth removal in the partial tooth loss was done with respect to the total addendum and dedendum of the gear tooth as represented by the arrows in Figures 4(a) and (b). In addition, the chipped tooth in the double defect was done by removal from the pitch point to the top land of the gear tooth that is removed by 25% of its original thickness of 2 mm as shown in Figure 4(c). The tape that is used to obtain the phase information from the tachometer is located at the pinion’s shaft as shown in Figure 2. The position of the tape is adjusted so that the impulse response produced by broken tooth, both for medium and high severity levels were located at approximately 250°–260° of the gear angular location. For the double defects, the partial tooth loss was located at approximately 320°–330° and the chipped tooth was located at around 145°–155°. National Instruments CompactRio with NI 9234 module and LabView software were used for acquiring vibration and acoustic measurements from the gearbox test-rig, where the sampling rate was set to 5.12 kHz to obtain 30s of data.
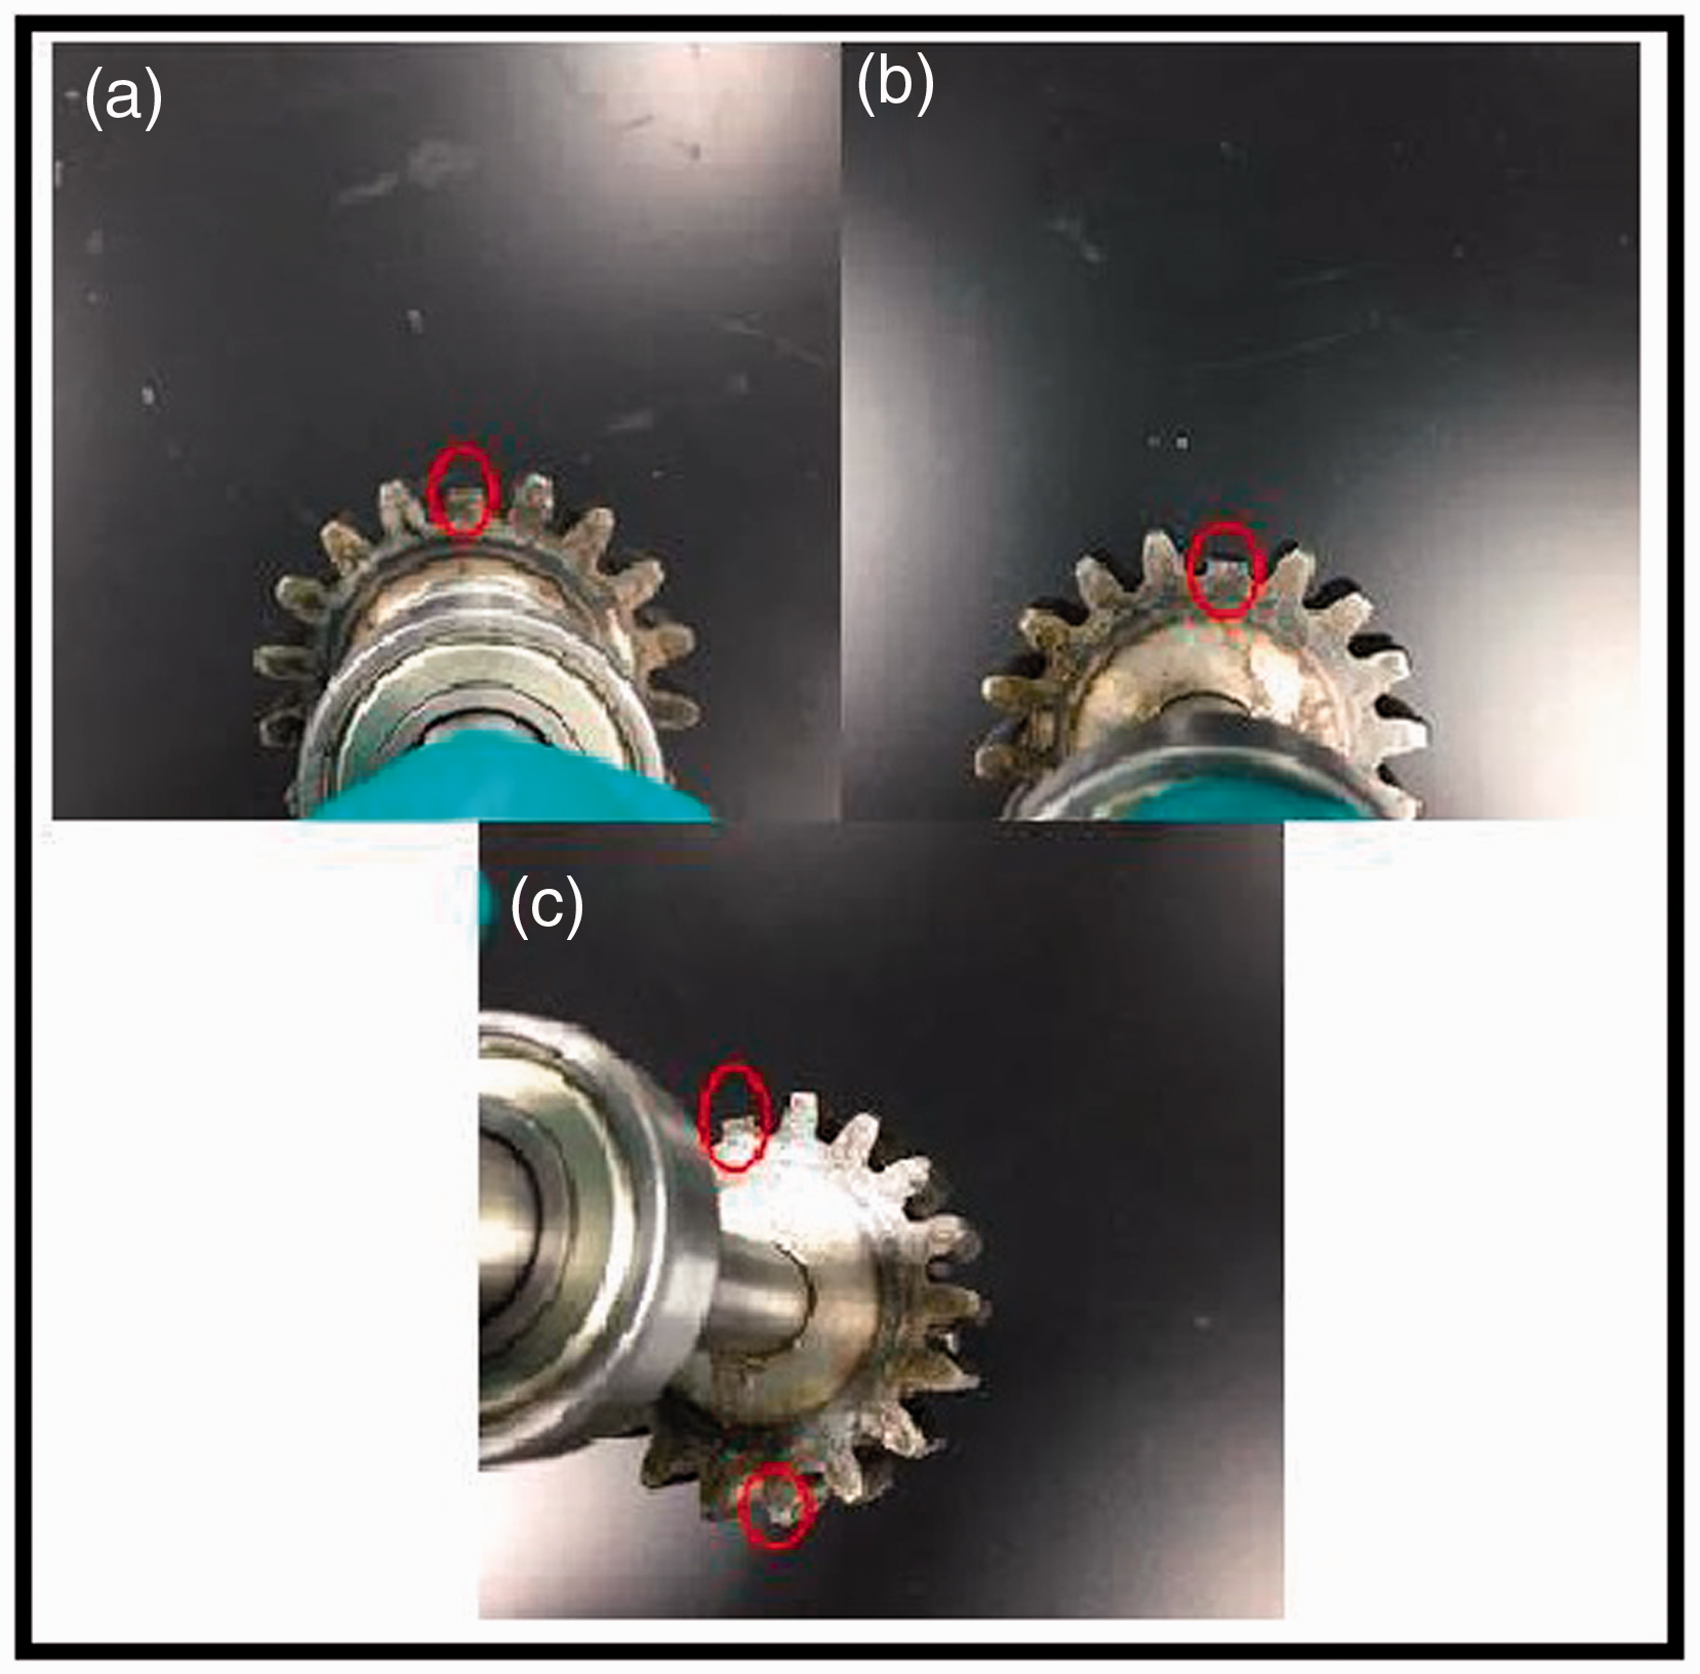
Views of: (a) the broken gear tooth with a medium severity level, (b) the broken gear tooth with a high severity level, and (c) double defects gear tooth.
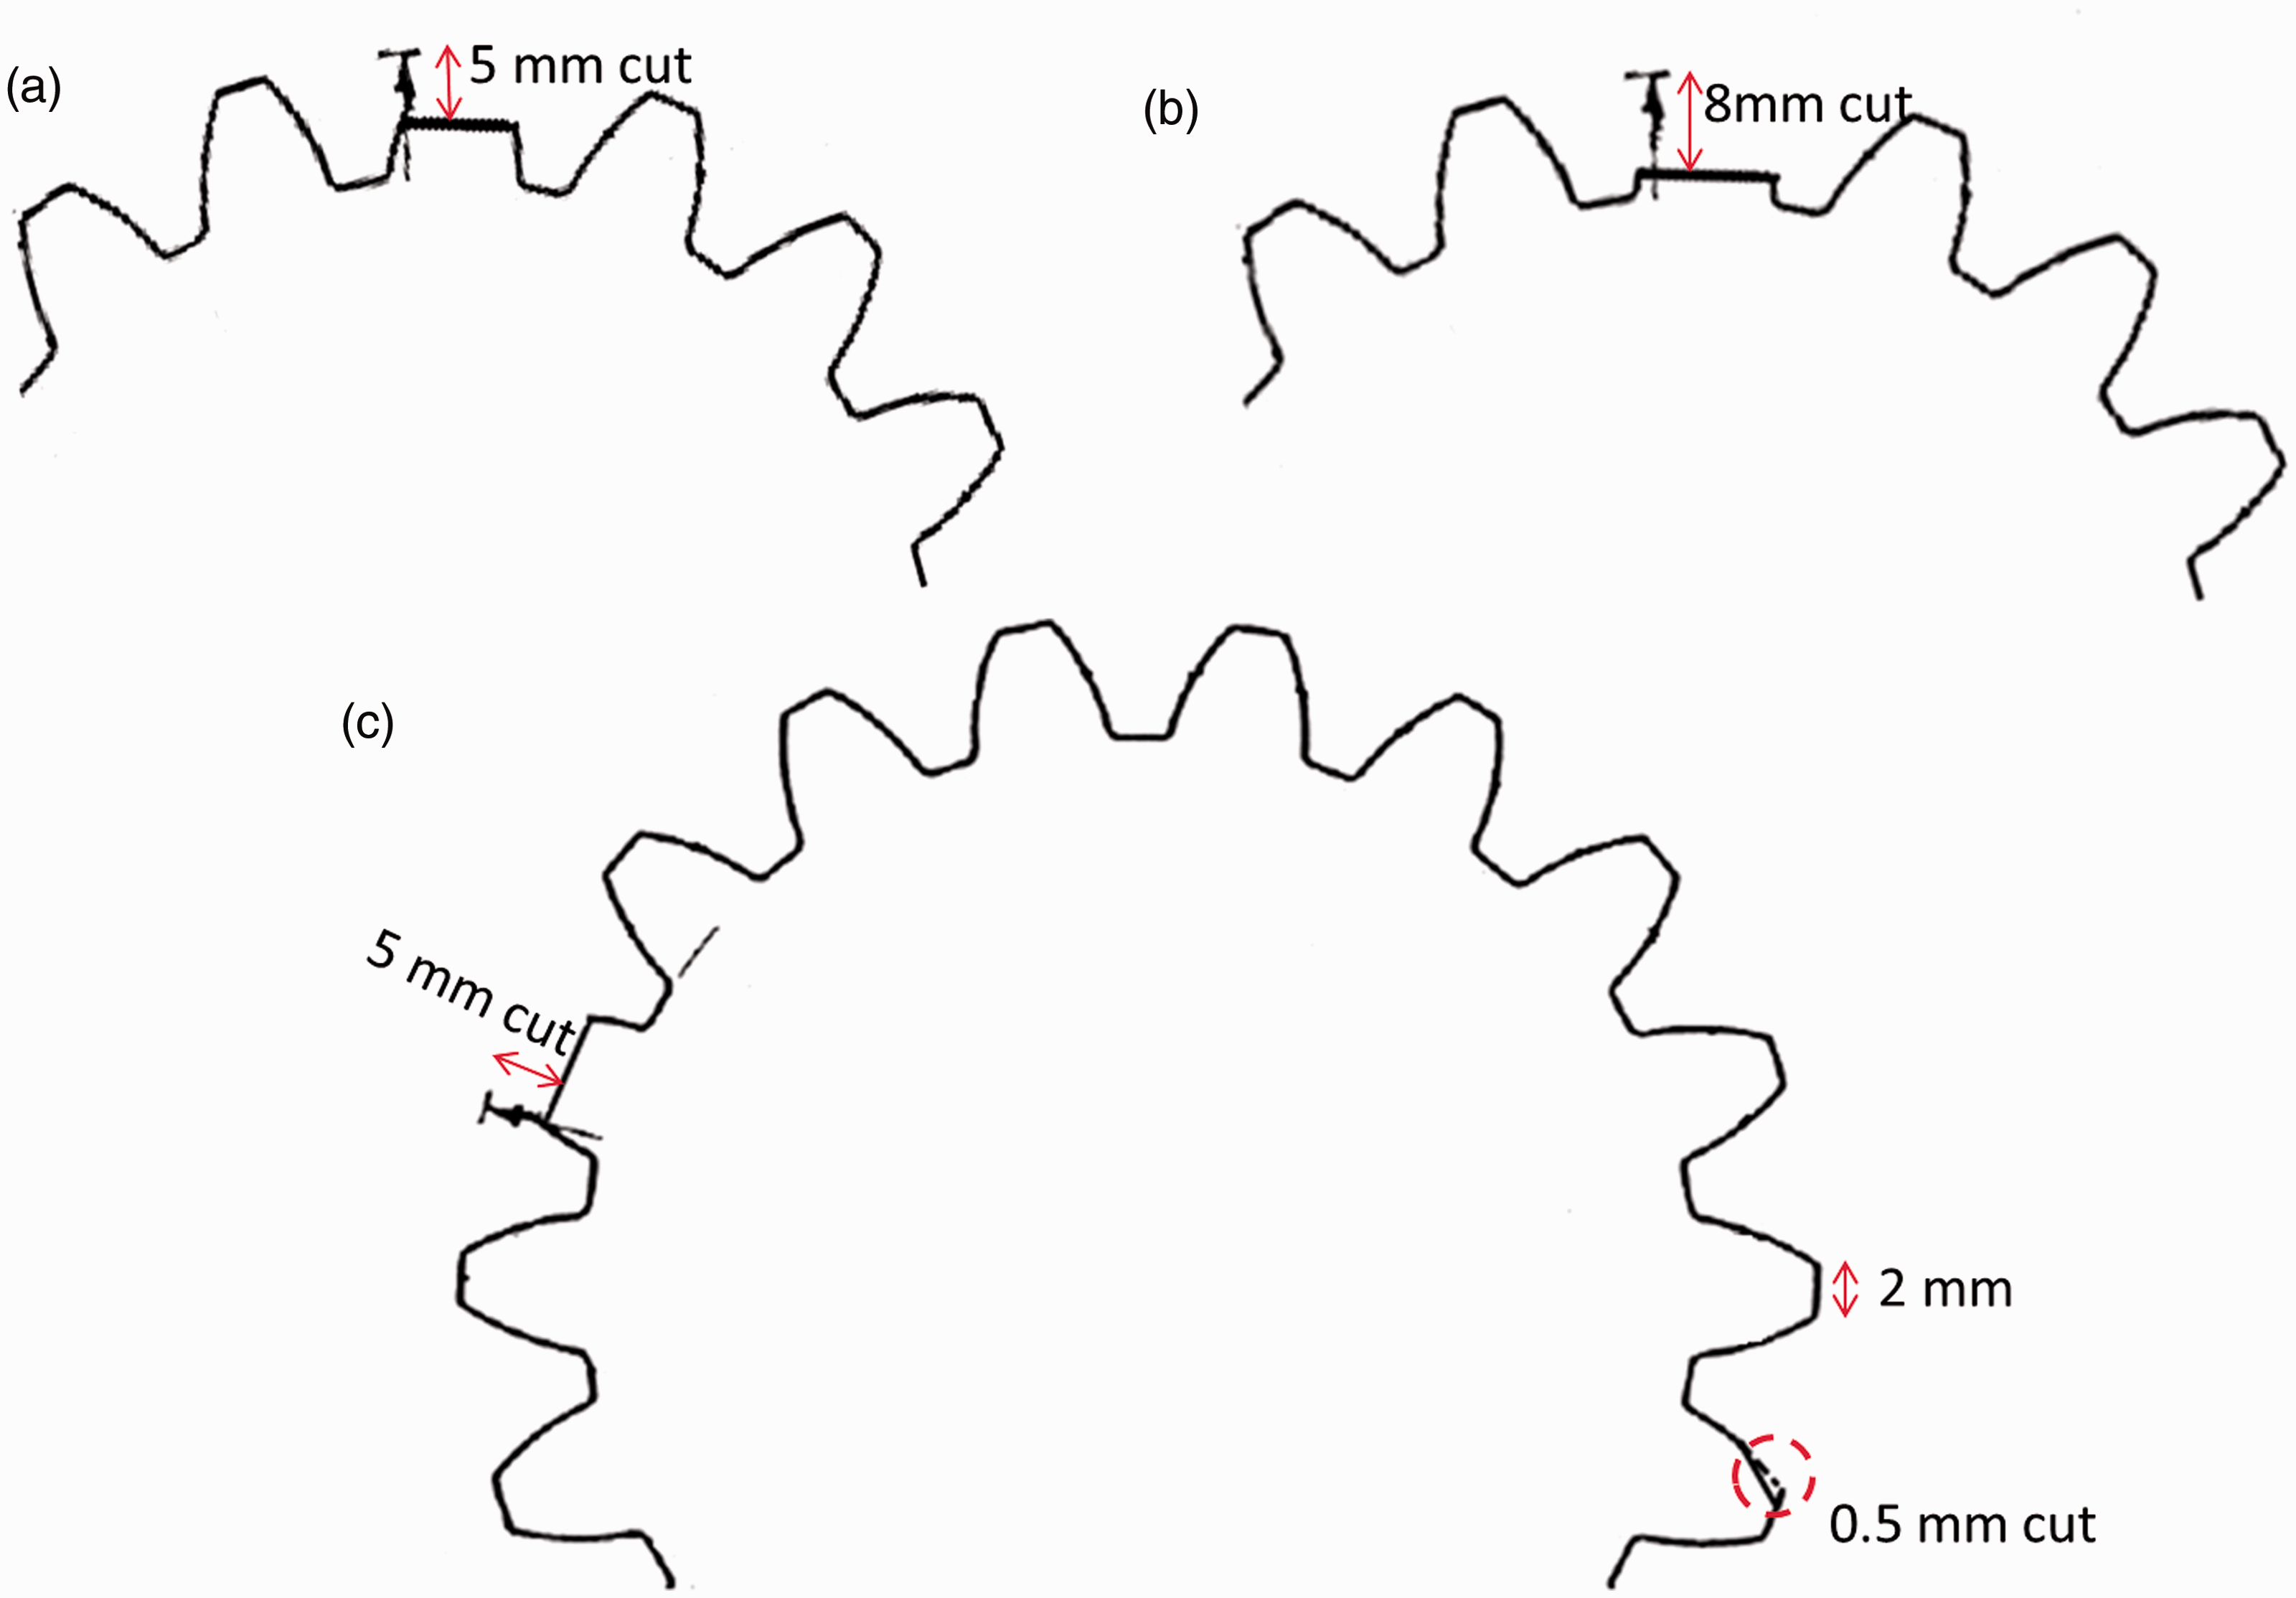
Diagrams of gear with: (a) a broken gear tooth with a medium severity level, (b) a broken gear tooth with a high severity level, and (c) double defects gear tooth.
Gear specifications.
Fault diagnosis using vibration and acoustic measurements
Vibration-based fault diagnosis
From the experiment, 10-s raw vibration measurements were obtained as shown in Figure 5. It can be observed that regardless of clear differences in the magnitude of vibration signals obtained from gearboxes with healthy and unhealthy gears, it is not possible to obtain specific information regarding the gear fault location merely from observing the raw measurement data. In this work, however, the Time Synchronous Averaging (TSA) method was first used to process the raw vibration data for eliminating random measurement noise and the asynchronous components of signals that are irrelevant for gear fault diagnosis. The TSA method transforms the time domain signals of raw vibration measurements into the angular domain signals by using the reference signals obtained from the tachometer. A cubic spline interpolation was implemented to resample the raw vibration data so that a constant sampling rate per revolution of the gear was achieved. 25 The TSA results from vibration signals of healthy gearbox are presented in Figure 6(a).
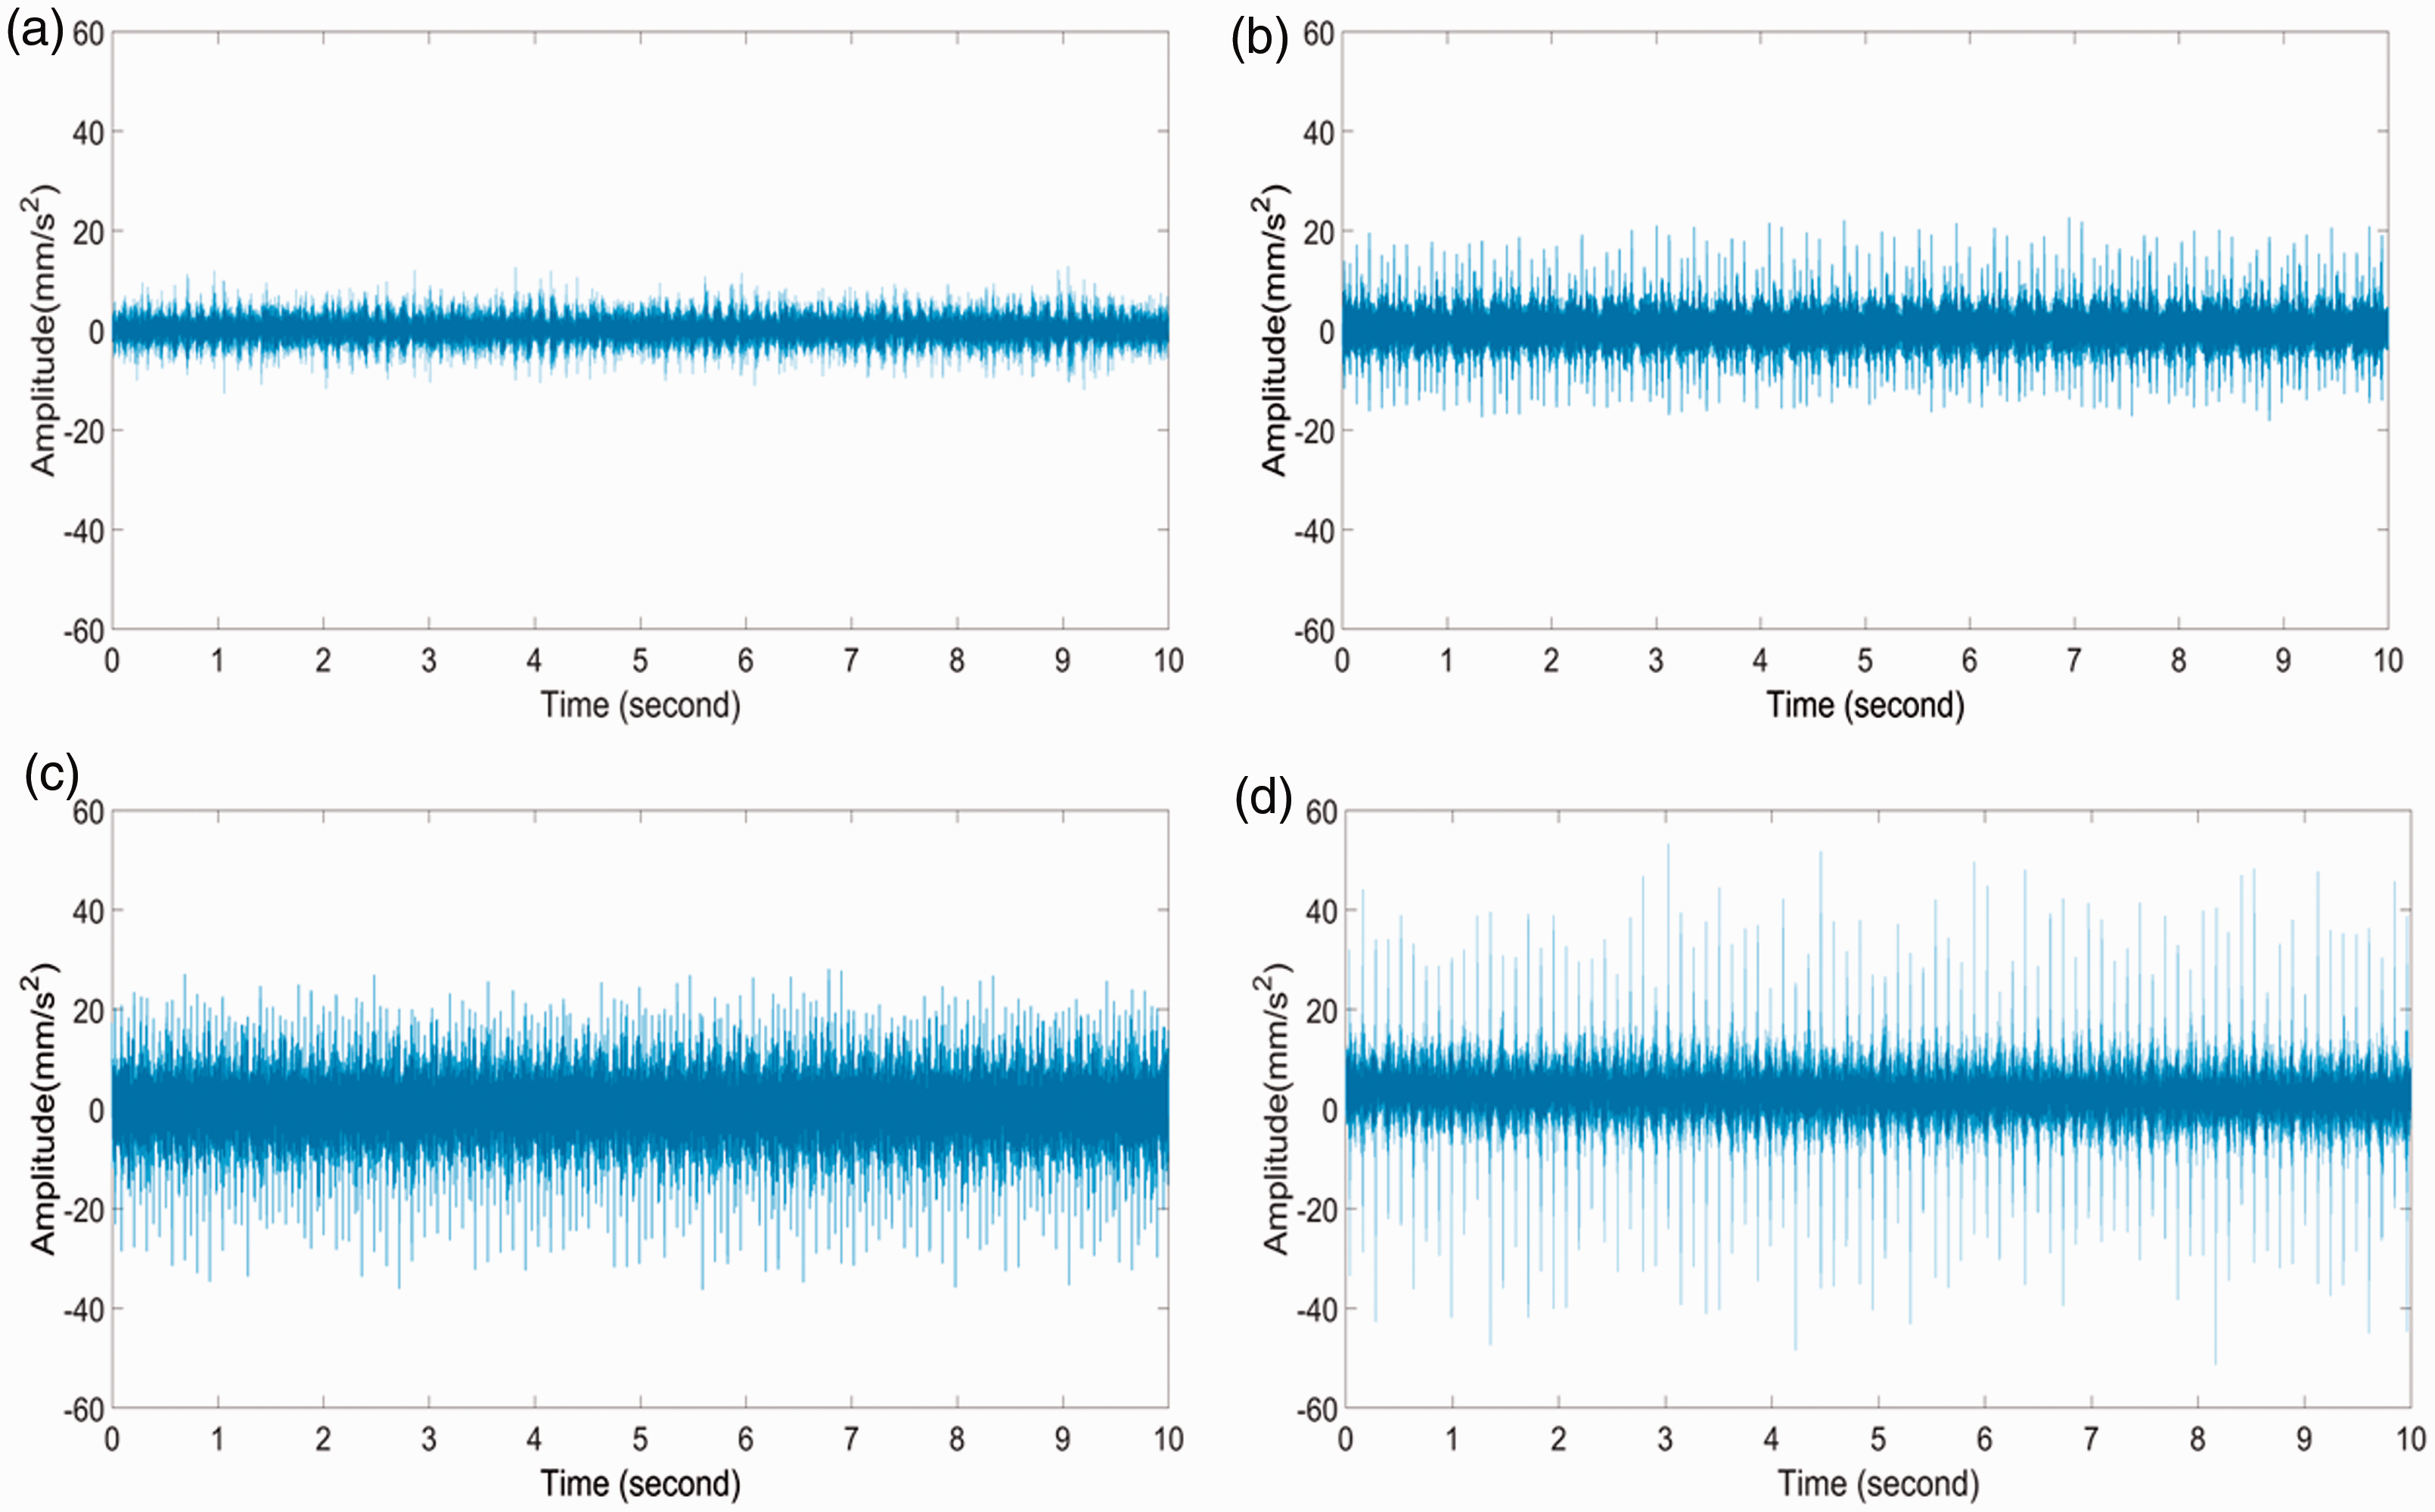
Raw vibration measurements of a gearbox with: (a) healthy gears, (b) a faulty gear with a medium fault severity level, (c) double defects gear, and (d) a faulty gear with a high fault severity level.
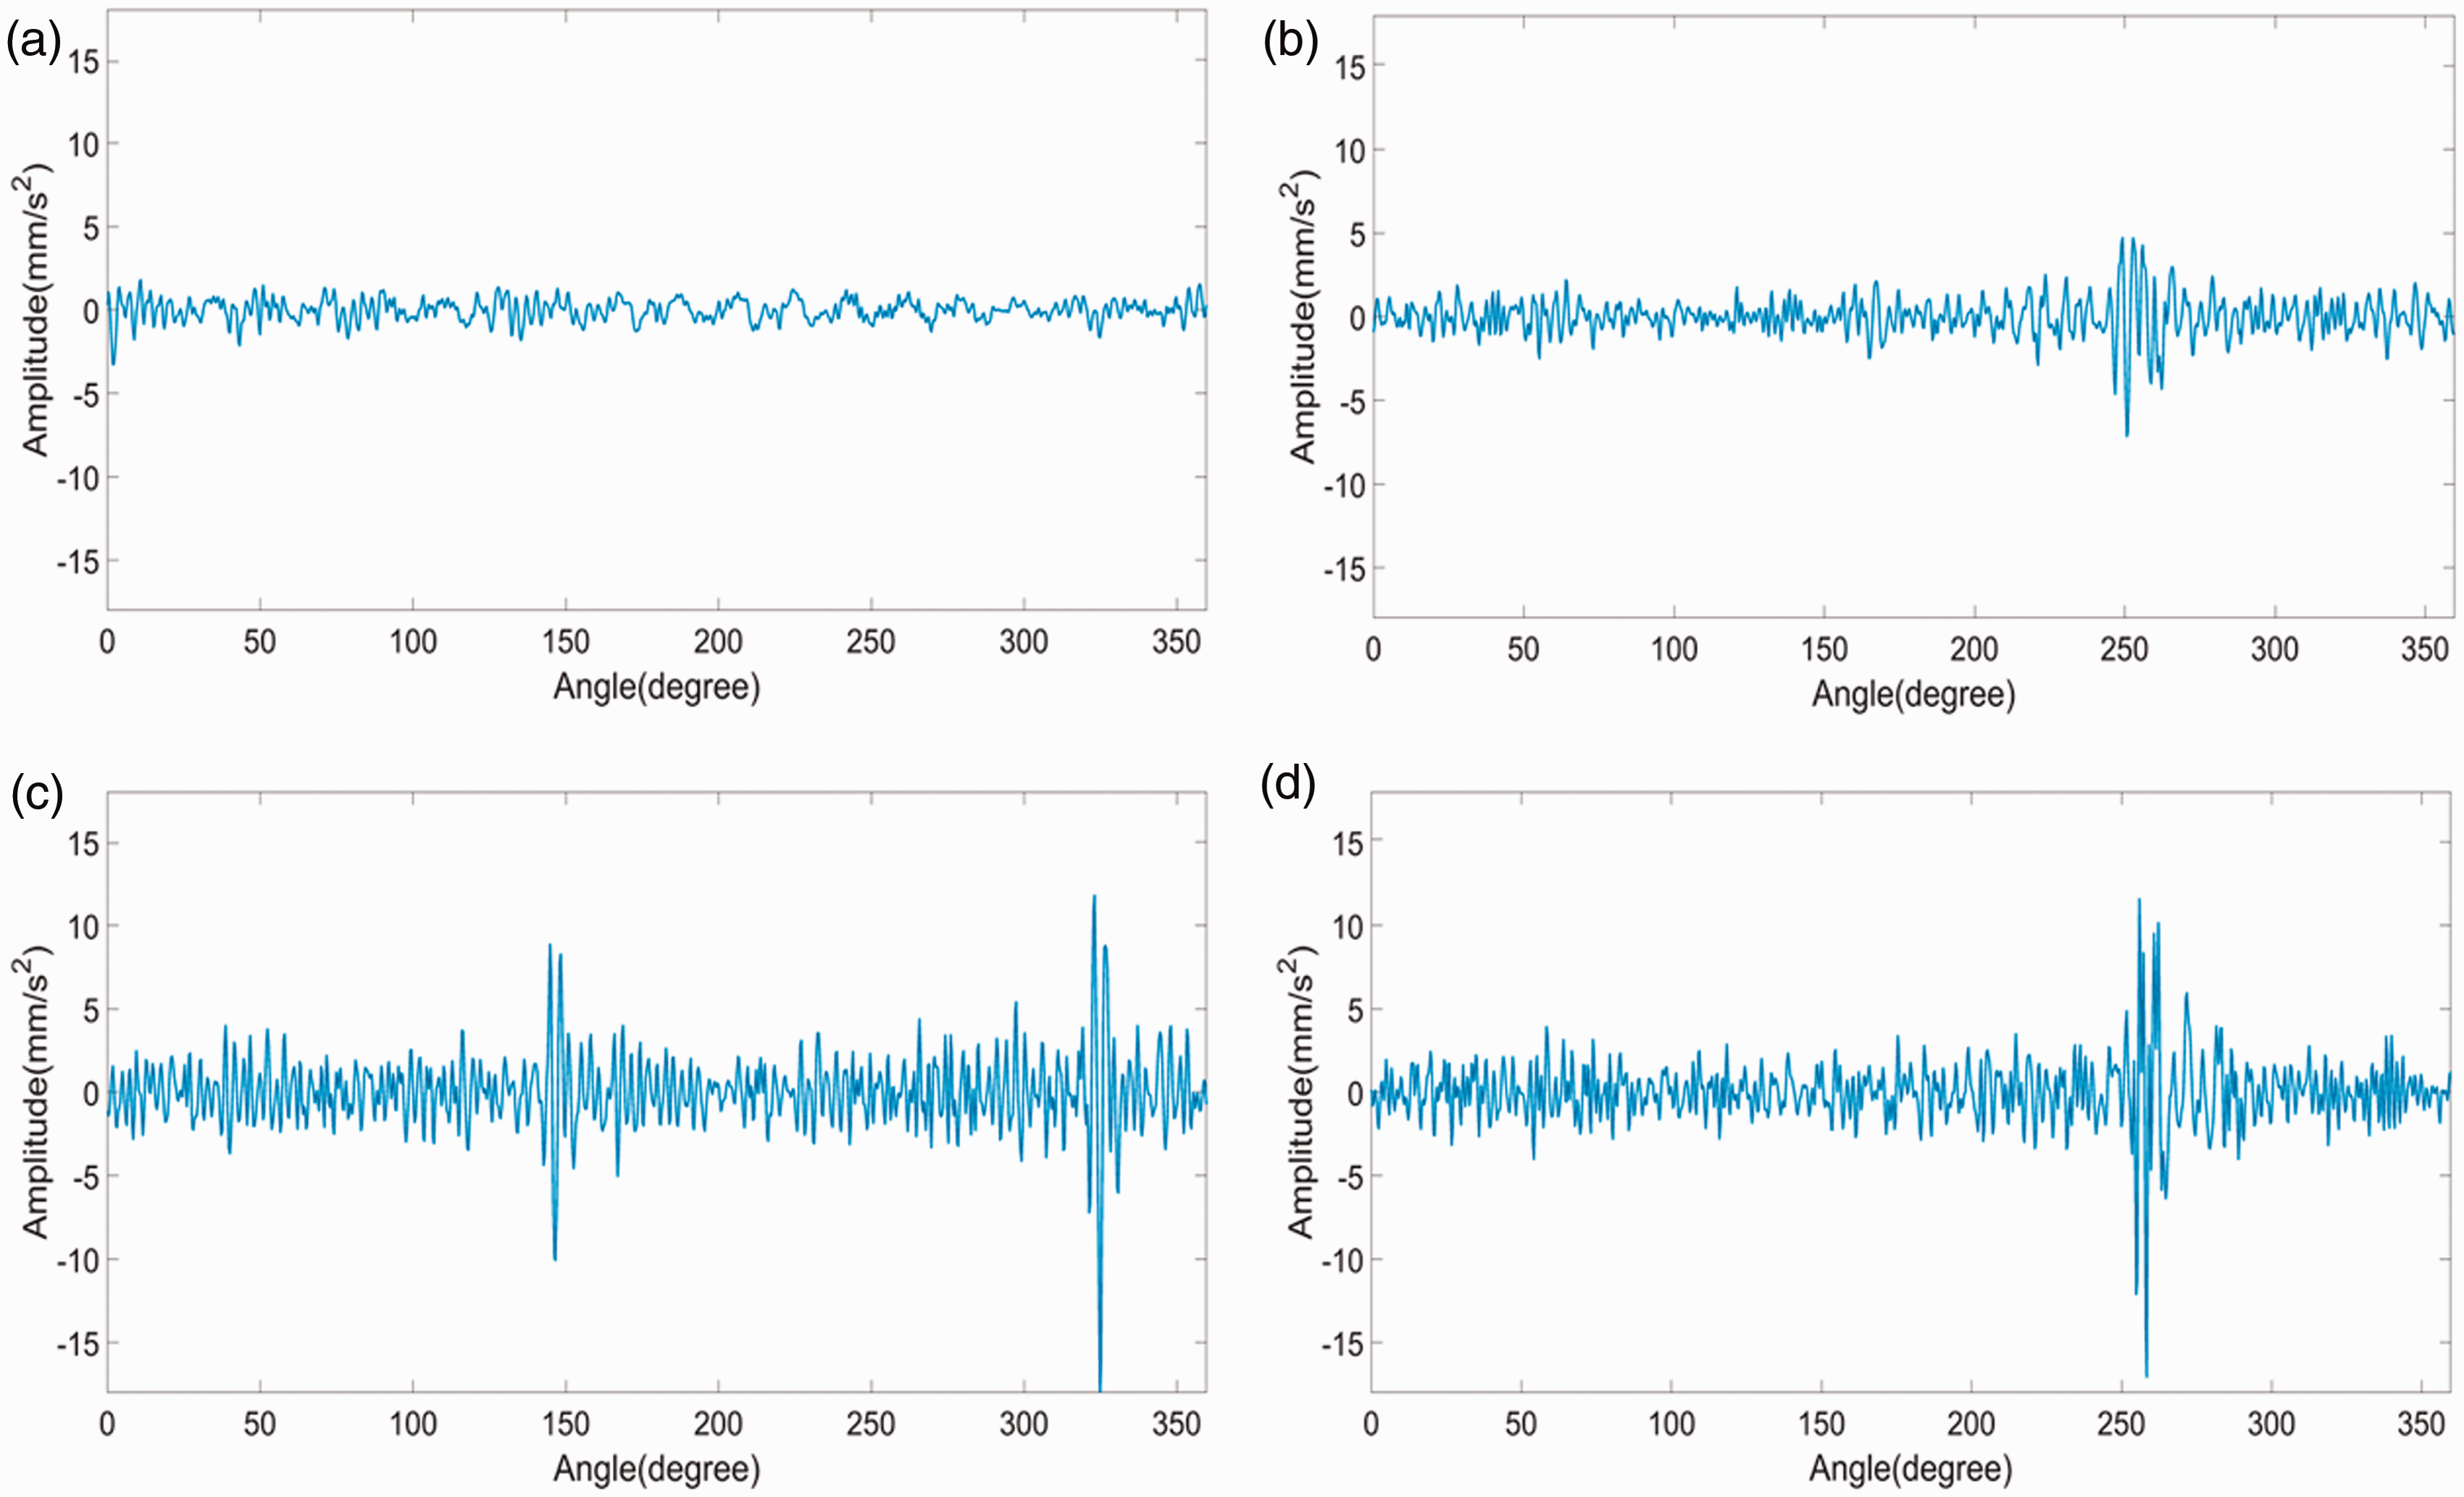
TSA vibration signal of a gearbox with: (a) healthy gears, residual vibration signals of a gearbox with: (b) a faulty gear with a medium fault severity level, (c) double defects gear, and (d) a faulty gear with a high fault severity level.
In the case of the faulty gear, the residual method was implemented in this work by eliminating the gearmesh frequency and harmonics from the spectrum of TSA signals of the unhealthy gears. The residual method aims to extract the weak fault features generated from the faulty gear, since in some cases the TSA method alone will not be sufficient to extract the weak signals from the faulty gear. 2 The result of the residual method from vibration measurements of a broken tooth with a medium severity level, double defects and a high fault severity level is presented in Figures 6(b) to (d), respectively. The changes in transient response in the angular domain that is caused by the faulty gear tooth can be observed clearly around 250°–260°, as expected from the medium and high fault severity level of a broken gear tooth. Furthermore, it can be seen that the residual method was able to show the severity level of the broken tooth as indicated by the increase in term of its signal magnitude. The residual method was also capable of extracting the impulse from the double defects located at 150°and 325°, as expected.
In the field of the gearbox fault diagnosis, the sidebands (associated with an integer multiply of rotational speed of faulty gear which is called the “order”) are the main indicator of faults in the gearbox and they are located around the gearmesh frequencies, which in this case is associated with an integer multiply of 150. These sidebands and gearmesh frequencies can be observed in the frequency domain which can be obtained using the FFT method. However, it was already mentioned previously that the conventional frequency domain method (e.g. FFT) is not suitable for analyzing the transient nature of the impulse signals generated by the faulty gear. Hence, the results from the residual method will be analyzed further in this work by using the time–frequency method, where the GLCT and CWT methods are used to process the measured signals. The GLCT algorithm used in this work was adapted from the work of Yu and Zhou 11 in MATLAB environment. Here, 18 segments that divide α was incorporated for this work because it provides the best time–frequency representation based on a number of trials undertaken in this work. A Hamming window with 31 samples similar to the one used in PWVD is also utilized for the implementation of the GLCT method.
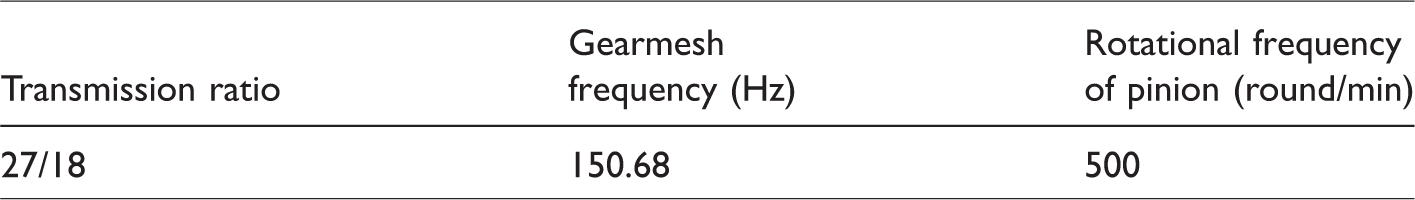
The time–frequency plot obtained from using the GLCT and CWT methods for the healthy gear is presented in Figures 7(a) and (b), respectively. Regular contour patterns can be observed from both figures, which are associated with the healthy condition of the gearbox. The first harmonics of the gearmesh frequency were captured by the CWT method from Figure 7(b). The gear mesh harmonic is formulated as (T*fs) where T is the total number of the gear tooth and fs is the rotational speed of the gear. In this case, with respect to the pinion with 18 teeth and rotating at frequency 8.33 Hz, the gear mesh frequency is determined to be 150.68 Hz as presented in Table 3.
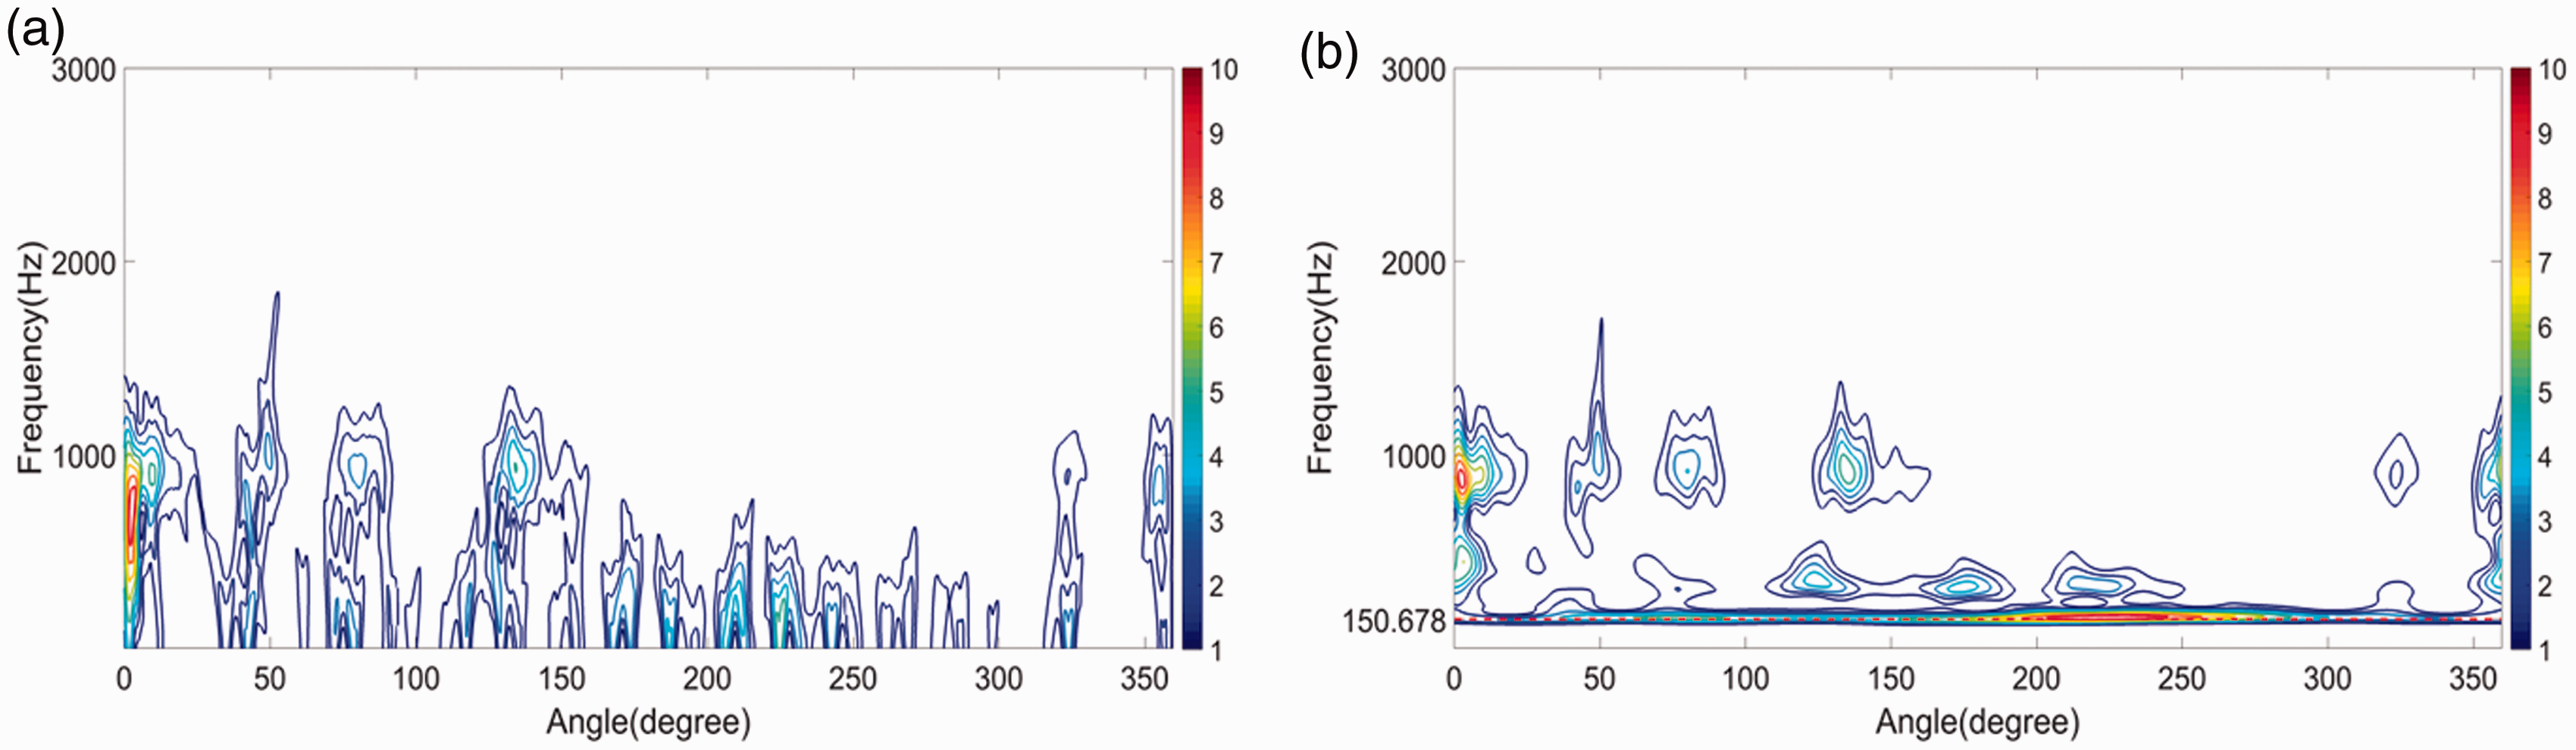
Time–frequency analysis of TSA vibration signal for a gearbox with healthy gears by: (a) GLCT and (b) CWT. GLCT: generalized linear chirplet transform; CWT: continuous wavelet transform.
Gearbox characteristic frequency.
Furthermore, the result of using the GLCT, CWT and PWVD methods for a gear with medium fault severity level based on vibration measurements can be seen in Figures 8(a) to (c), respectively. It is clear that the GLCT, CWT and PWVD methods were able to capture the impulse signal characteristics from the faulty gear tooth located approximately between 250° and 260°, as expected. On the other hand, the time–frequency results of vibration signals from a gearbox with the severe broken tooth using the GLCT, CWT and PWVD methods are shown in Figures 9(a) to (c), respectively. One aspect that distinguishes the medium and high fault severity level of the broken tooth is the band of the impulse generated by the broken tooth. From the GLCT plot of the broken tooth with a medium fault severity level in Figure 8(a), the fault feature is represented by a sideband at 88th order with the frequency band ranges between 120 Hz and 1200 Hz. On the other hand, for the broken tooth with a high severity level in Figure 9(a), another frequency band that ranges between 1400 Hz and 2250 Hz, representing a sideband at 219th order, can also be observed. The results can be regarded as a useful feature to assess the severity level of damage in the gear, where the occurrence of more sidebands and the increase of sideband magnitude in the frequency domain can be the main indication of the state of faults in the gearbox.2,6The implementation of the time–frequency methods allows the monitoring of how faults in the gear progress via a simultaneous signal representation in angular and frequency domains in one plot, so that more thorough fault diagnostics information can be obtained in terms of the gear fault progression. In this work, a normalization was conducted to each of the time–frequency plane so that the results from different time–frequency methods can be compared. When the TFA was conducted, the largest signal magnitude occurred in the vicinity of the broken tooth angular location (based on the information obtained from the tachometer) is shown in the time–frequency plot. Moreover, the largest signal magnitudes always reside in the frequency of the sideband that is associated with the speed of the faulty gearbox. In the case of the severe broken tooth, it can be observed that there are two sidebands instead of one as in the case for the medium severity broken tooth. Both of the sidebands in the severe broken tooth case correspond to the speed of the faulty gear, which can be observed by comparing Figures 8 and 9. However, it can be observed from Figure 9(c) that PWVD was not able to provide a clear time–frequency representation compared to GLCT and CWT. It is also suffered with the cross-term interferences that appear at 1259.84 Hz, which is at the midway of sidebands at 686.42 Hz and 1833.25 Hz. The PWVD method was supposed to alleviate the cross-term interference, but it was found out that is still limited in its ability to eliminate completely the interference as observed in Figure 9(c).
Time–frequency analysis of residual vibration signal for a gearbox with a broken gear with a medium severity level by: (a) GLCT, (b) CWT, and (c) PWVD. GLCT: generalized linear chirplet transform; CWT: continuous wavelet transform; PWVD: pseudo Wigner–Ville distribution.
Time–frequency analysis of residual vibration signal for a gearbox with a broken gear with a high fault severity level by: (a) GLCT, (b) CWT, and (c) PWVD. GLCT: generalized linear chirplet transform; CWT: continuous wavelet transform; PWVD: pseudo Wigner–Ville distribution.
Finally, the performance of the GLCT, CWT and PWVD methods in processing residual vibration signals of double defects is presented in Figures 10(a) to (c), respectively. As expected, the defects of the chipped and broken tooth are identified at 150° and 325°, respectively, from both GLCT and CWT plots. However, the PWVD method fails to capture the impulse generated from the chipped tooth located at 150° as shown in Figure 10(c). A small energy concentration can be observed at the chipped tooth region from the PWVD method compared to the GLCT and CWT representations in Figure 10. As previously explained in the theoretical background of WVD, the utilization of the smoothing window function in PWVD will decrease the time–frequency resolution of WVD although it can minimize the interference terms.
Time–frequency analysis of residual vibration signal for a gearbox with a double defects gear by: (a) GLCT, (b) CWT, and (c) PWVD. GLCT: generalized linear chirplet transform; CWT: continuous wavelet transform; PWVD: pseudo Wigner–Ville distribution.
Acoustic-based fault diagnosis
In addition to the use of vibration measurements, this work considers the use of acoustic measurements and their analysis to provide an alternative solution for gear fault diagnosis. For the purpose of acoustic analysis, the 10-s raw acoustic measurement is presented in Figure 11. Similar to the case for vibration signals, a typical increase in the magnitude of acoustic signal could be observed when the faults were introduced in the gearbox. However, it is not possible to detect the fault location or even the severity of faults by merely observing from the raw acoustic measurement itself. Using the same procedure as for vibration measurements, TSA method was initially incorporated to the raw acoustic measurements. Figure 12(a) shows the TSA result from the healthy gear where the signal is much less affected by the measurement noise, particularly when compared to the raw signal shown in Figure 11(a).
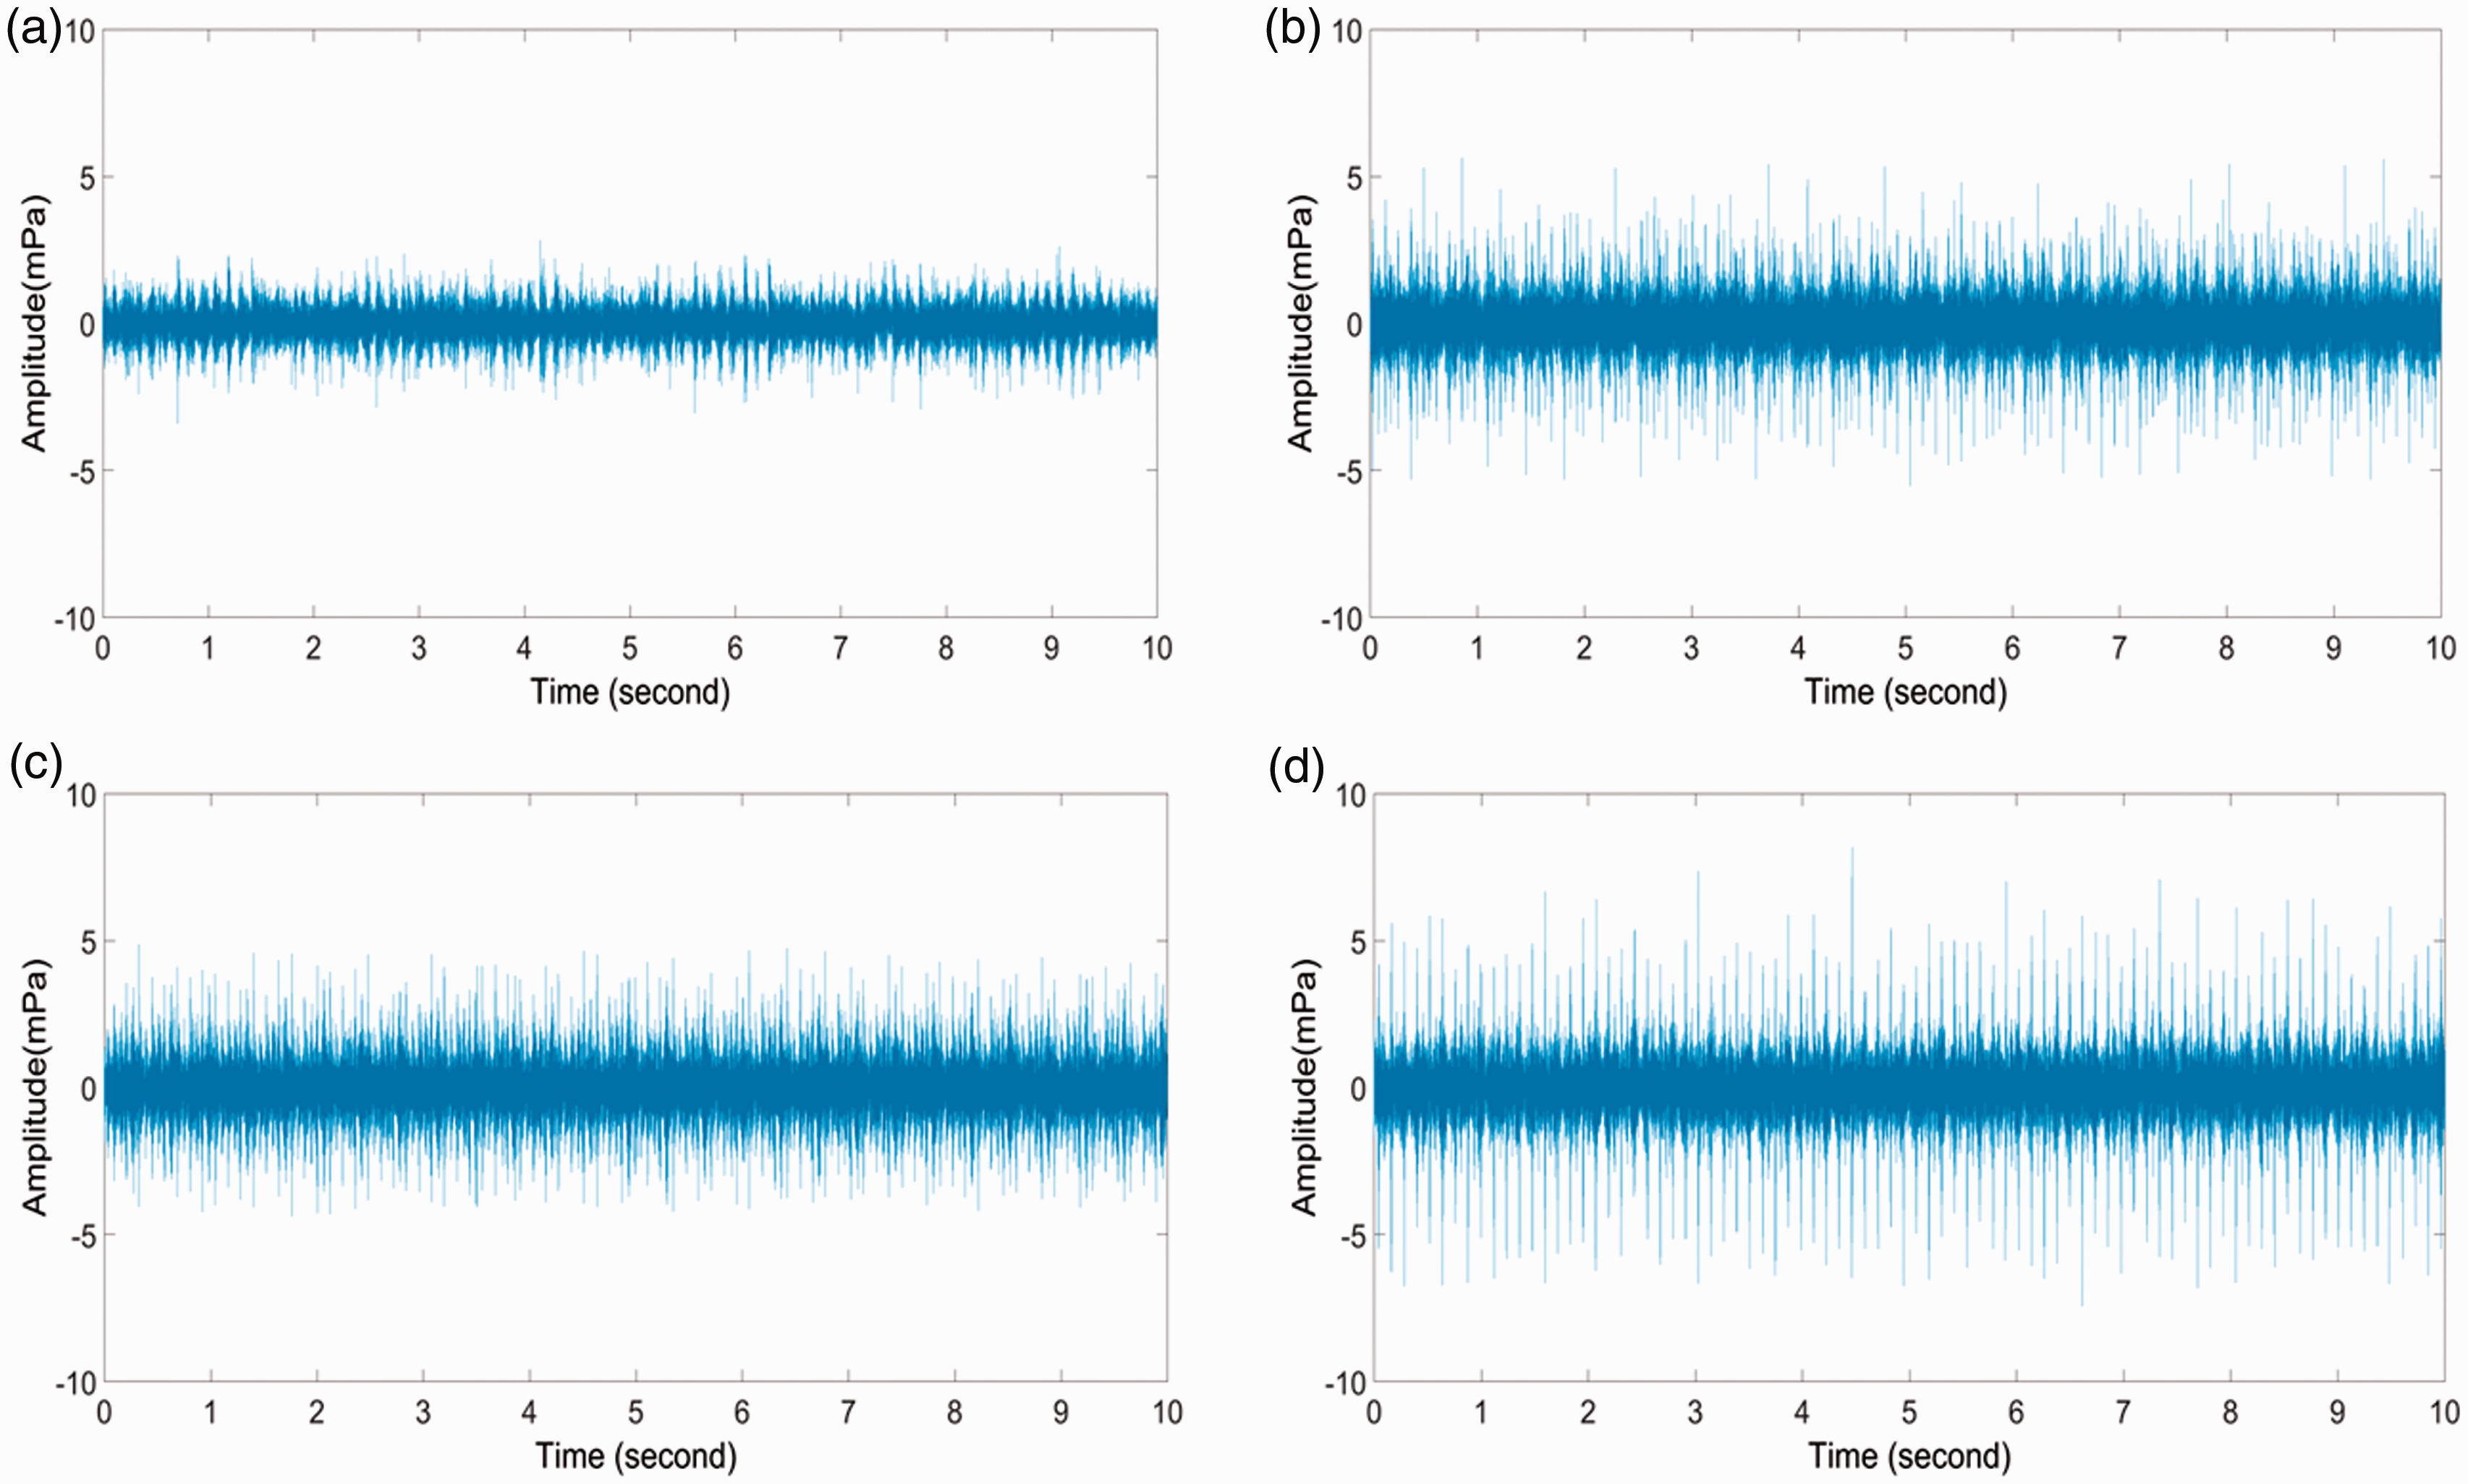
The raw acoustic measurements of a gearbox with: (a) healthy gears, (b) a gear with a medium fault severity level, (c) double defects gear and (d) a gear with a high fault severity level.
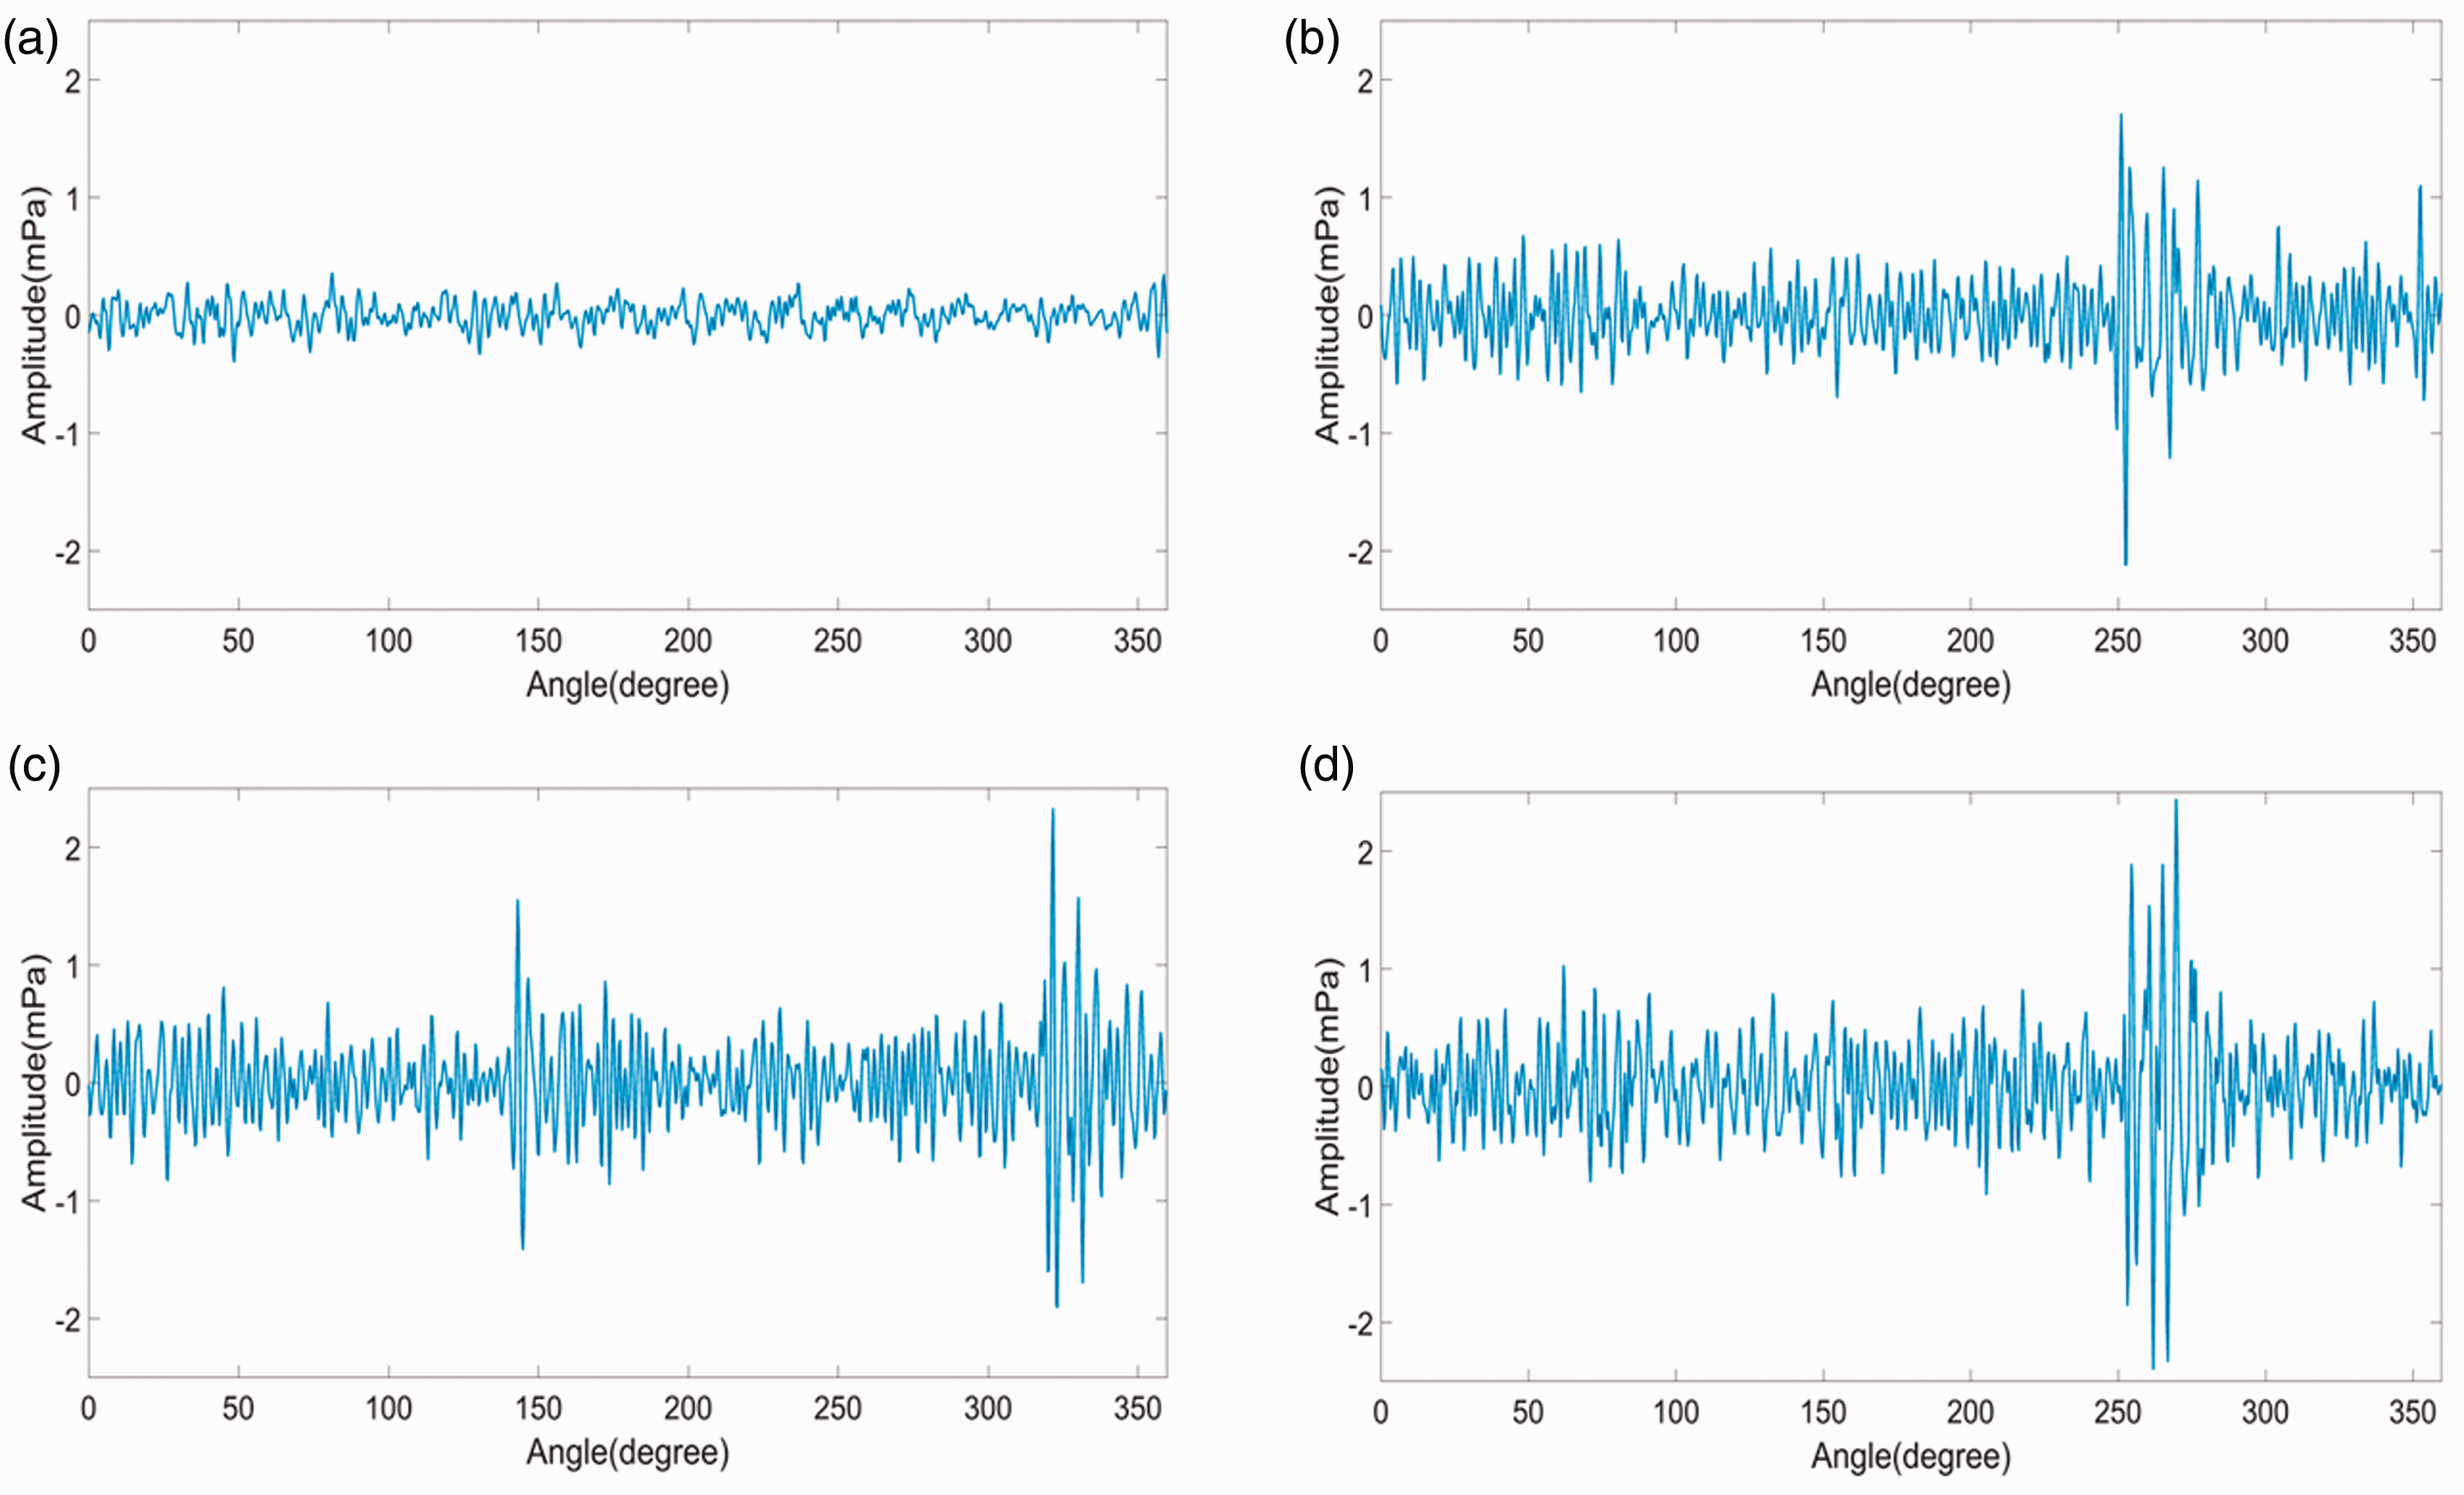
(a)TSA acoustic signal of a gearbox with healthy gears. Residual acoustic signal of a gearbox with: (b) a gear with a medium fault severity level, (c) double defects gear, and (d) a gear with a high fault severity level. TSA: time synchronous averaging.
On the other hand, the results of residual method from acoustic measurements of a gearbox with a medium fault severity level, double defects and a high fault severity level are presented in Figures 12(b) to (d), respectively. An agreement with the result from vibration measurements can be observed based on the identified location of the impulse generated around 250°–260°. Furthermore, the severity assessment can also be verified by comparing Figures 12(b) and (d) where an increase in the amplitude is clearly observed. The residual method was also capable of extracting the impulse from the double defects located at 150° for chipped tooth and 325ofor broken gear tooth with a medium fault severity level as shown in Figure 12(d). However, regardless the clear impulse indication from the gearbox with faulty tooth, there is still measurement noise contamination in acoustic measurements so that the localization of the defect is not as clear as that of vibration measurements. Hence, the effect of noise contamination in the TFA will be further investigated in this work using three different time–frequency methods.
Similar results from vibration measurements can be observed from both GLCT and CWT methods applied to residual signals of acoustic measurements as described in Figure 13. The time–frequency representation generated by the GLCT method for the healthy gear did not show any dominant energy concentration during the full rotation of the gear, indicating a healthy state of the gearbox. On the other hand, the CWT method once again captured the fundamental gear mesh frequency at 150.68 Hz, which is presented in Table 2. It is observed that there are several uneven weak frequency components outside the fundamental gear mesh frequency caused by the amplitude-modulation generated by the imperfect meshing although the gear is in the healthy condition. This result is mainly caused by the manufacturing error of the gears. 15 The same phenomenon also can be observed from time–frequency plot of the TSA vibration signal of healthy vibration signals in Figure 7.
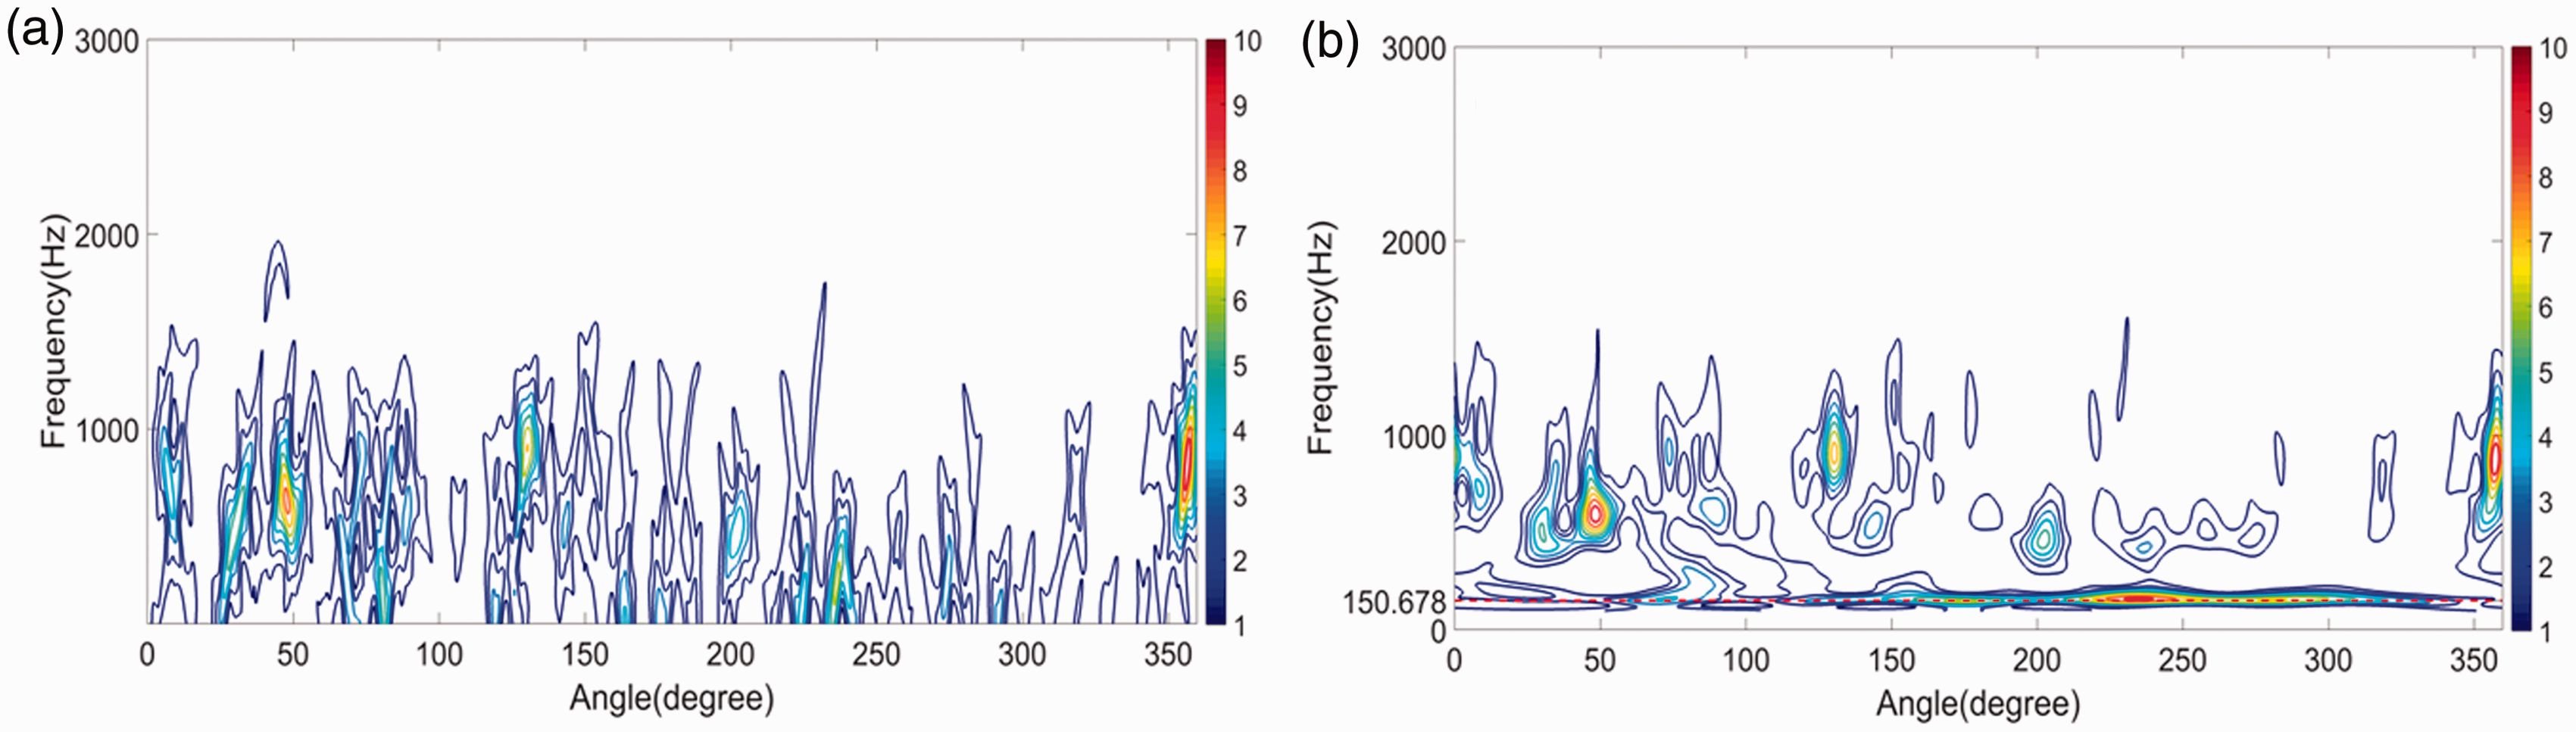
Time–frequency analysis of TSA acoustic signals for a gearbox with healthy gears by: (a) GLCT and (b) CWT. GLCT: generalized linear chirplet transform; CWT: continuous wavelet transform.
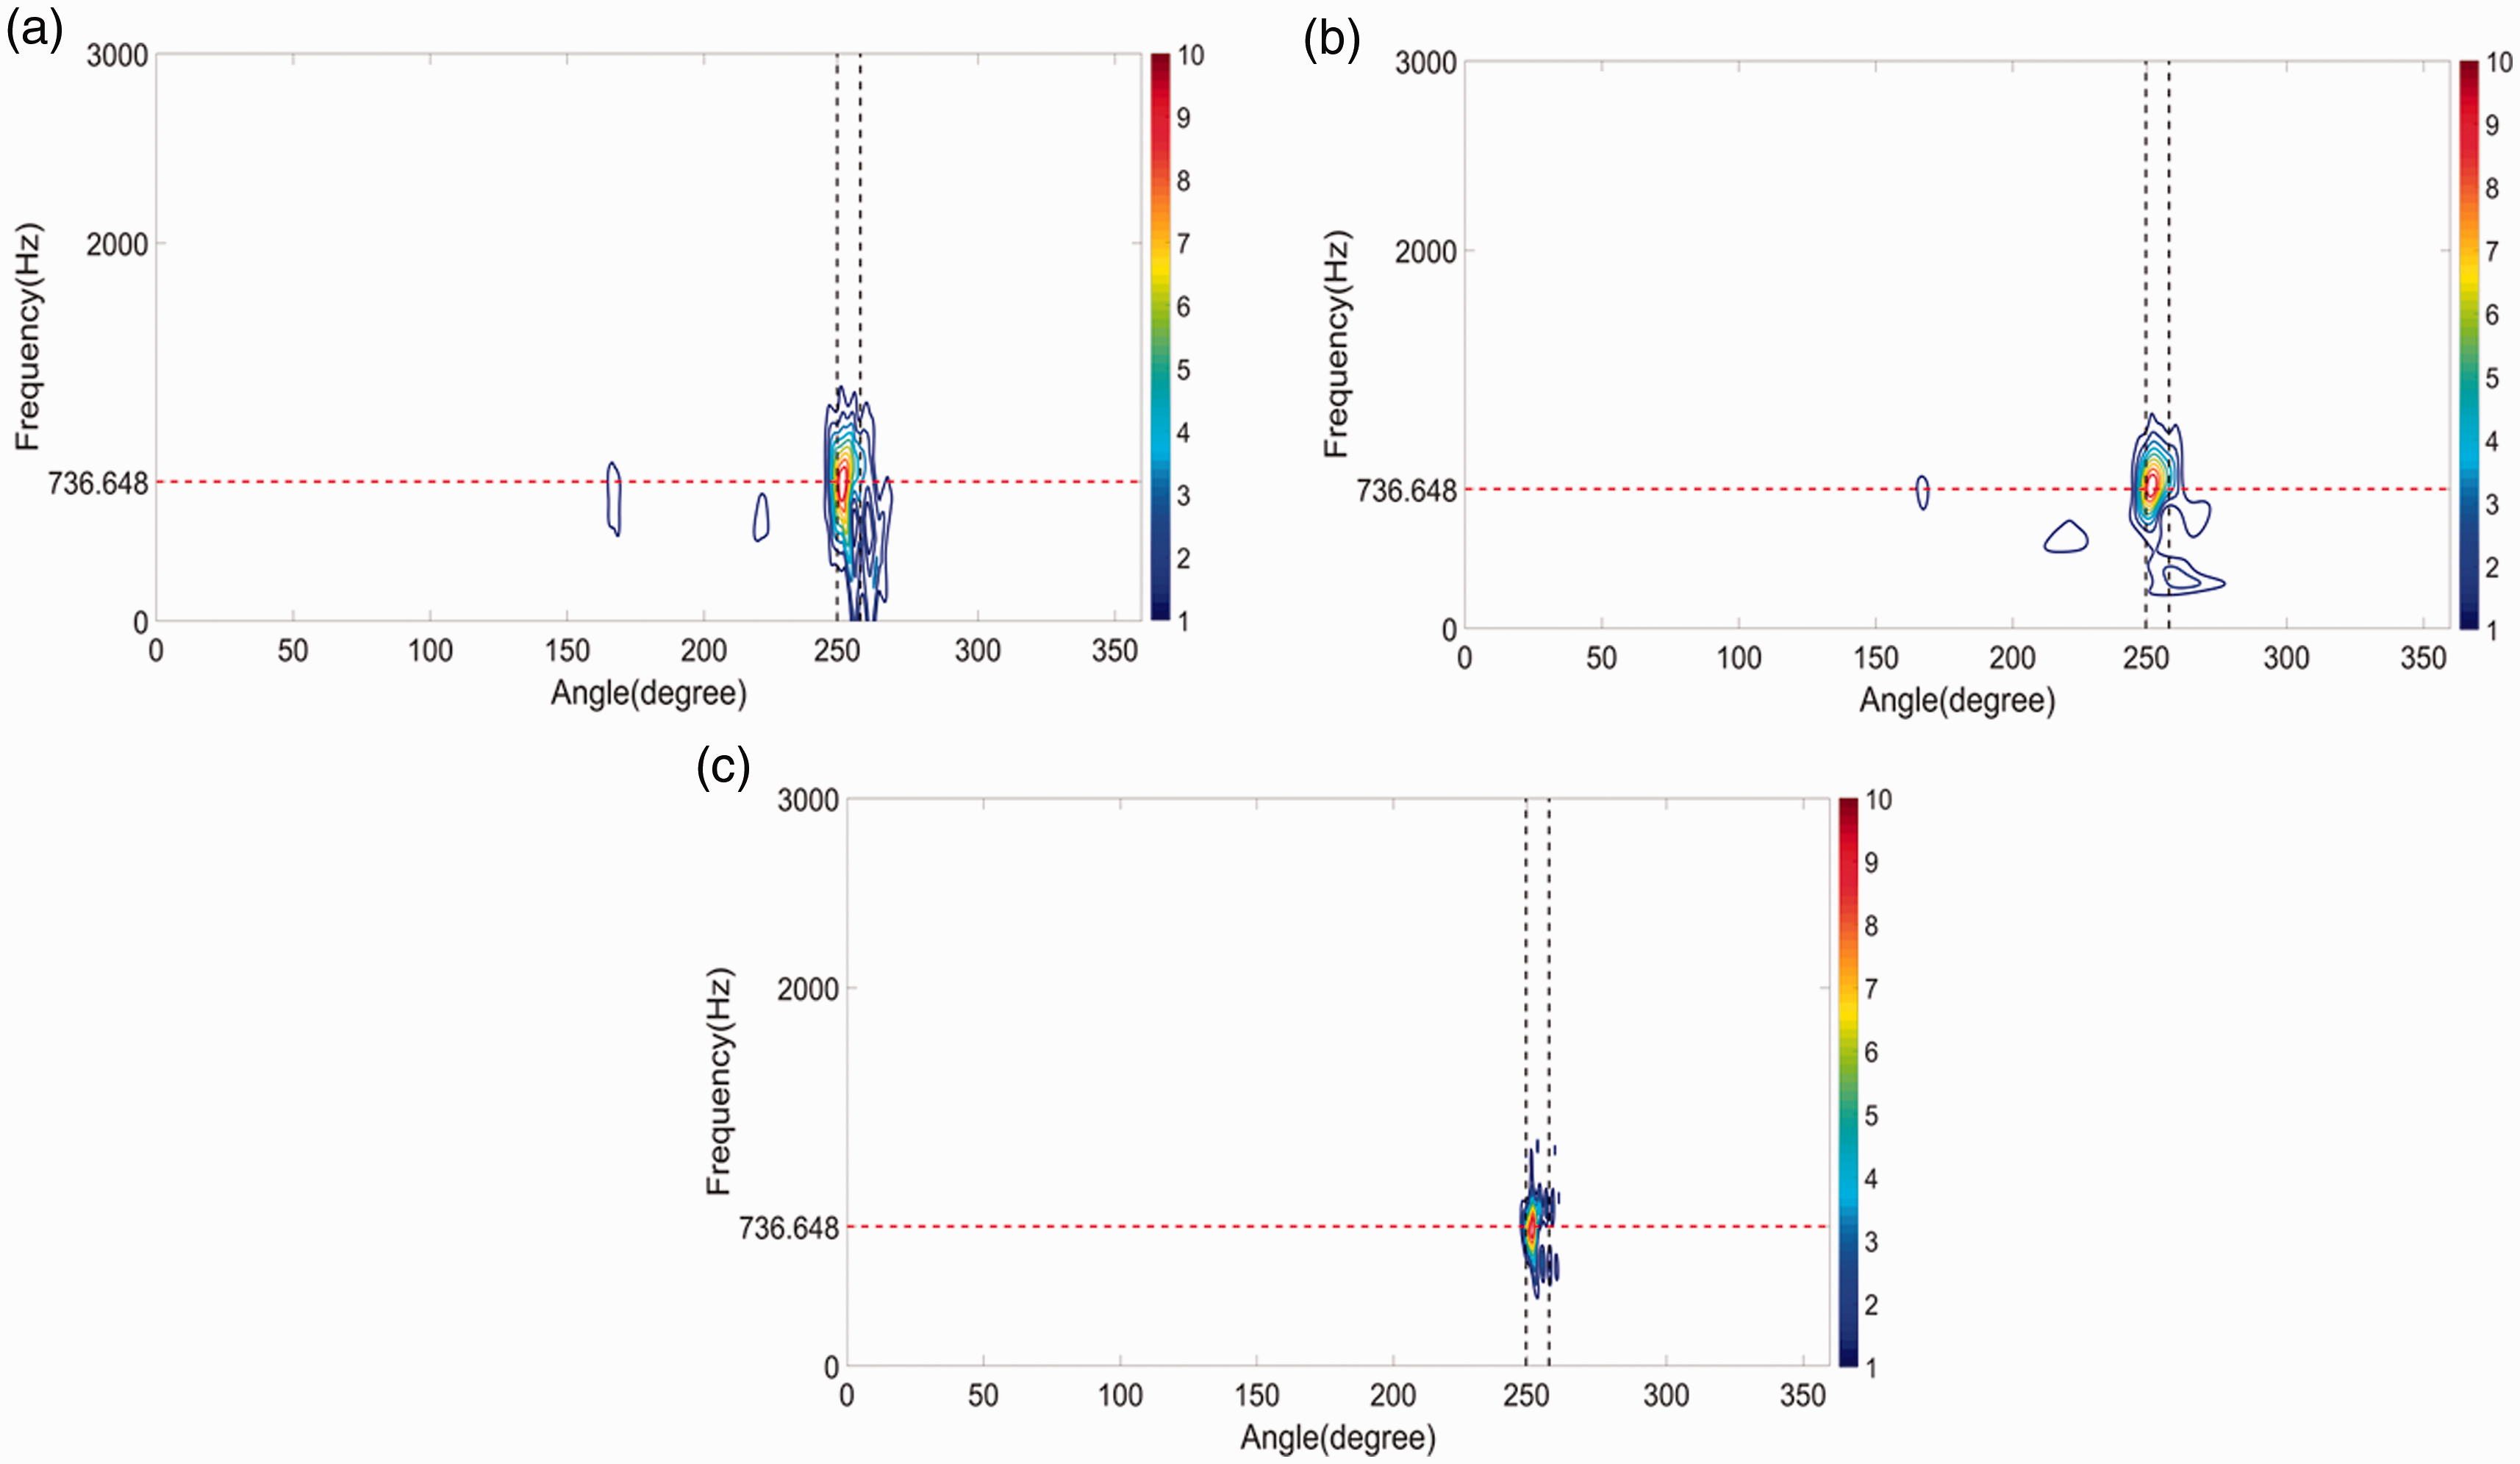
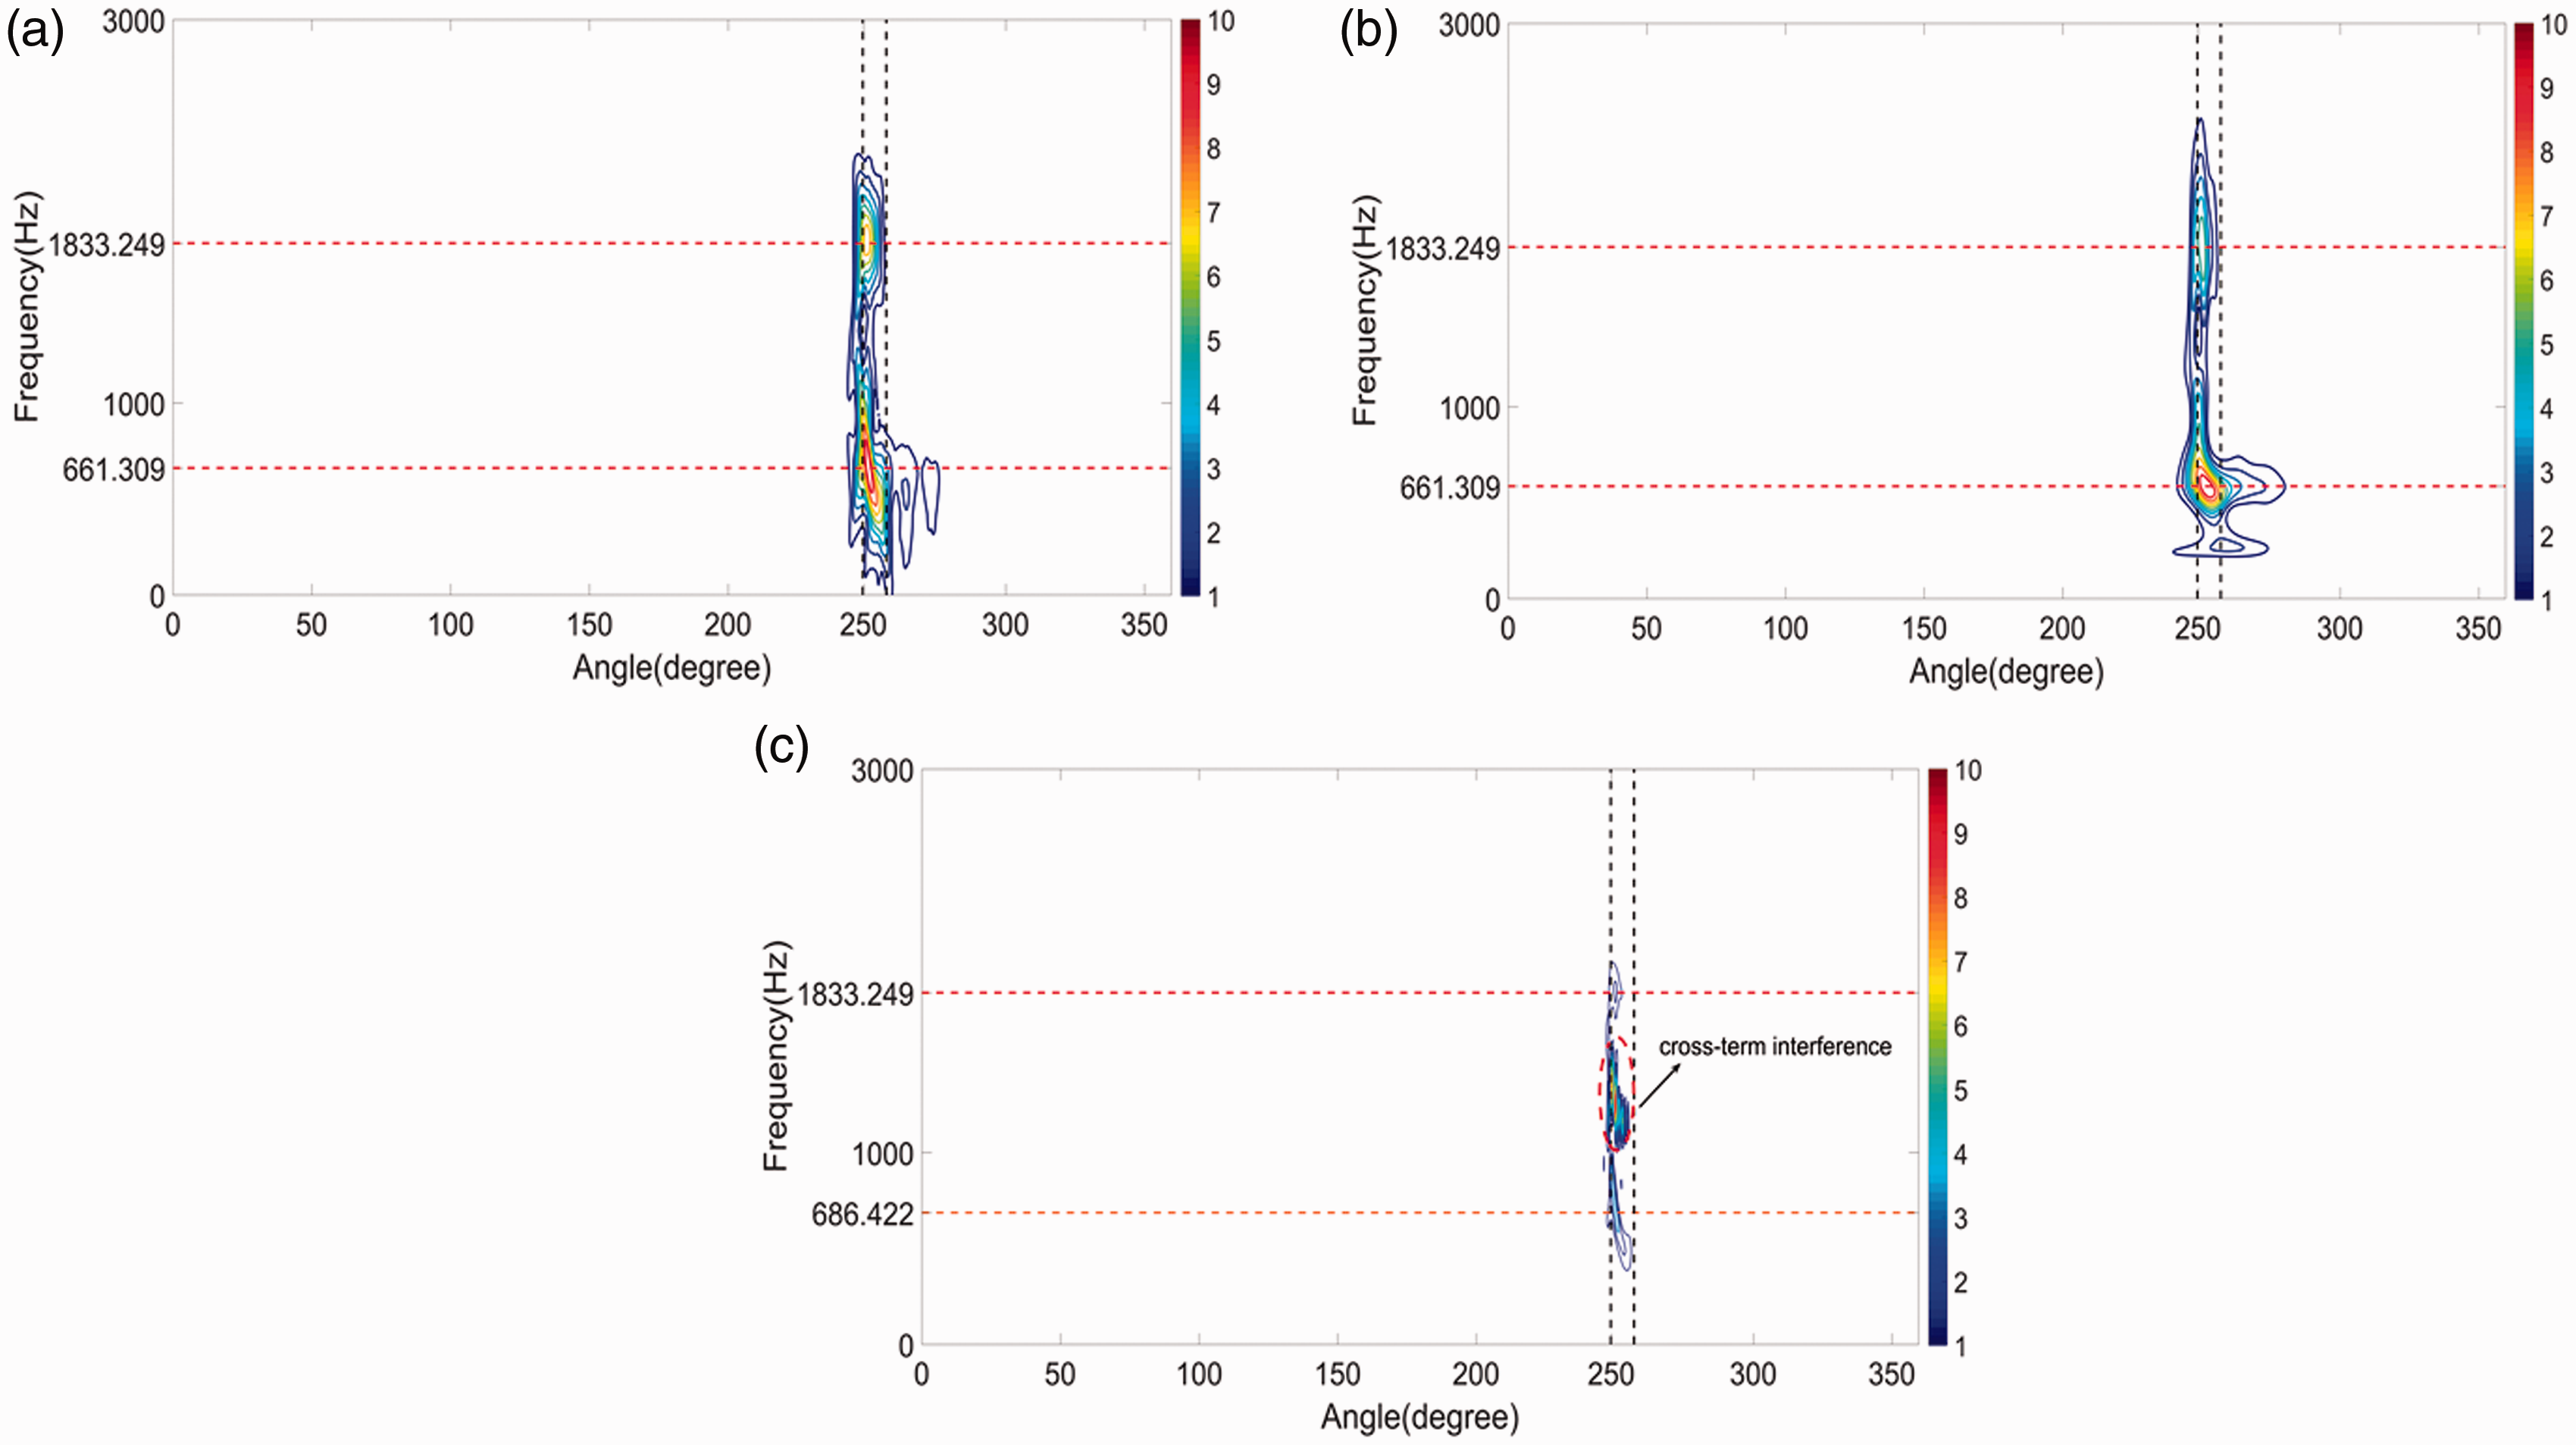
Furthermore, the time–frequency plots of the residual acoustic signals from the broken tooth with medium and high fault severity levels are shown in Figures 14 and 15, respectively. As expected, the impulse associated with the faulty tooth can still be captured by CWT, GLCT and PWVD methods with the impulse that is located around 250°–260°, for both medium and high fault severity levels of the broken gear tooth. By comparing the time–frequency plots in Figures 9 and 15, the time–frequency representations from the acoustic measurements are not as clear as those from vibration measurements. This is mainly caused by the higher noise contamination from non-contact acoustic sensing compared to contact-based vibration measurements, which is one of main reasons why there are not many previous works have been undertaken for gear fault diagnosis via acoustic measurements. 15 This is also further evidenced by comparing the results of residual method from raw vibration and acoustic measurements in Figures 6 and 12. It is observed that compared to the residual signal from vibration measurements, the residual signal from acoustic measurements is contaminated by a higher level of measurement noise. In addition, it is observed from Figure 15 that the CWT method was not as effective as the GLCT method in terms of extracting fault features from acoustic measurements that are contaminated with a higher level of noise, compared to the case for vibration measurements. The second fault signatures located in the region of 1000–1700 Hz, that represents a sideband at 154th order in the time–frequency representation, are not indicated clearly by the CWT method in contrast to that generated from the GLCT method, as indicated by the red arrow in Figure 15. The zoomed-in plot of the associated sideband is depicted in Figure 15(b) for the 154th order and the plot has less contrast according to the magnitude of the color scale compared to that of the sideband in Figure 15(a). This result is also affected by the noise associated with the angular location between 240° and 250°, which influences the contrast of the contour in this particular sideband. The use of both vibration and acoustics sensors together with a tachometer sensor can further enhance the accuracy of the fault diagnosis through the comparison of both vibration and acoustics measurements. It could be observed that the noise contamination in acoustic measurements was associated with an angular location 240°–250° from Figure 15, compared to the results from vibration measurements presented in Figure 9. Although it was previously stated that the GLCT method was more robust to noise contamination compared to the STFT method, 11 it was found in this work that the GLCT method was also less sensitive to the noise contamination compared to the CWT method. This is mainly due to the algorithm of the GLCT method that does not only incorporate the demodulated operator but also optimizes the most suitable chirp parameter in the demodulated operator, as expressed in equation (11). The utilization of the demodulated operator and the optimization to its parameter helps to efficiently identify the non-linear IF from the acoustic measurements contaminated with severe noise measurements. On the other hand, the CWT method could not offer satisfactory performance as good as the GLCT method because it solely relies on the similarity between the faulty features of the gearbox and the scaled-version of the Morlet wavelet. Finally, in the same case of vibration measurements, the PWVD method offers the worst performance with the cross-term interference that appears in the midway between the sideband at 593.34 Hz and 1230.54 Hz as shown in Figure 15(c).
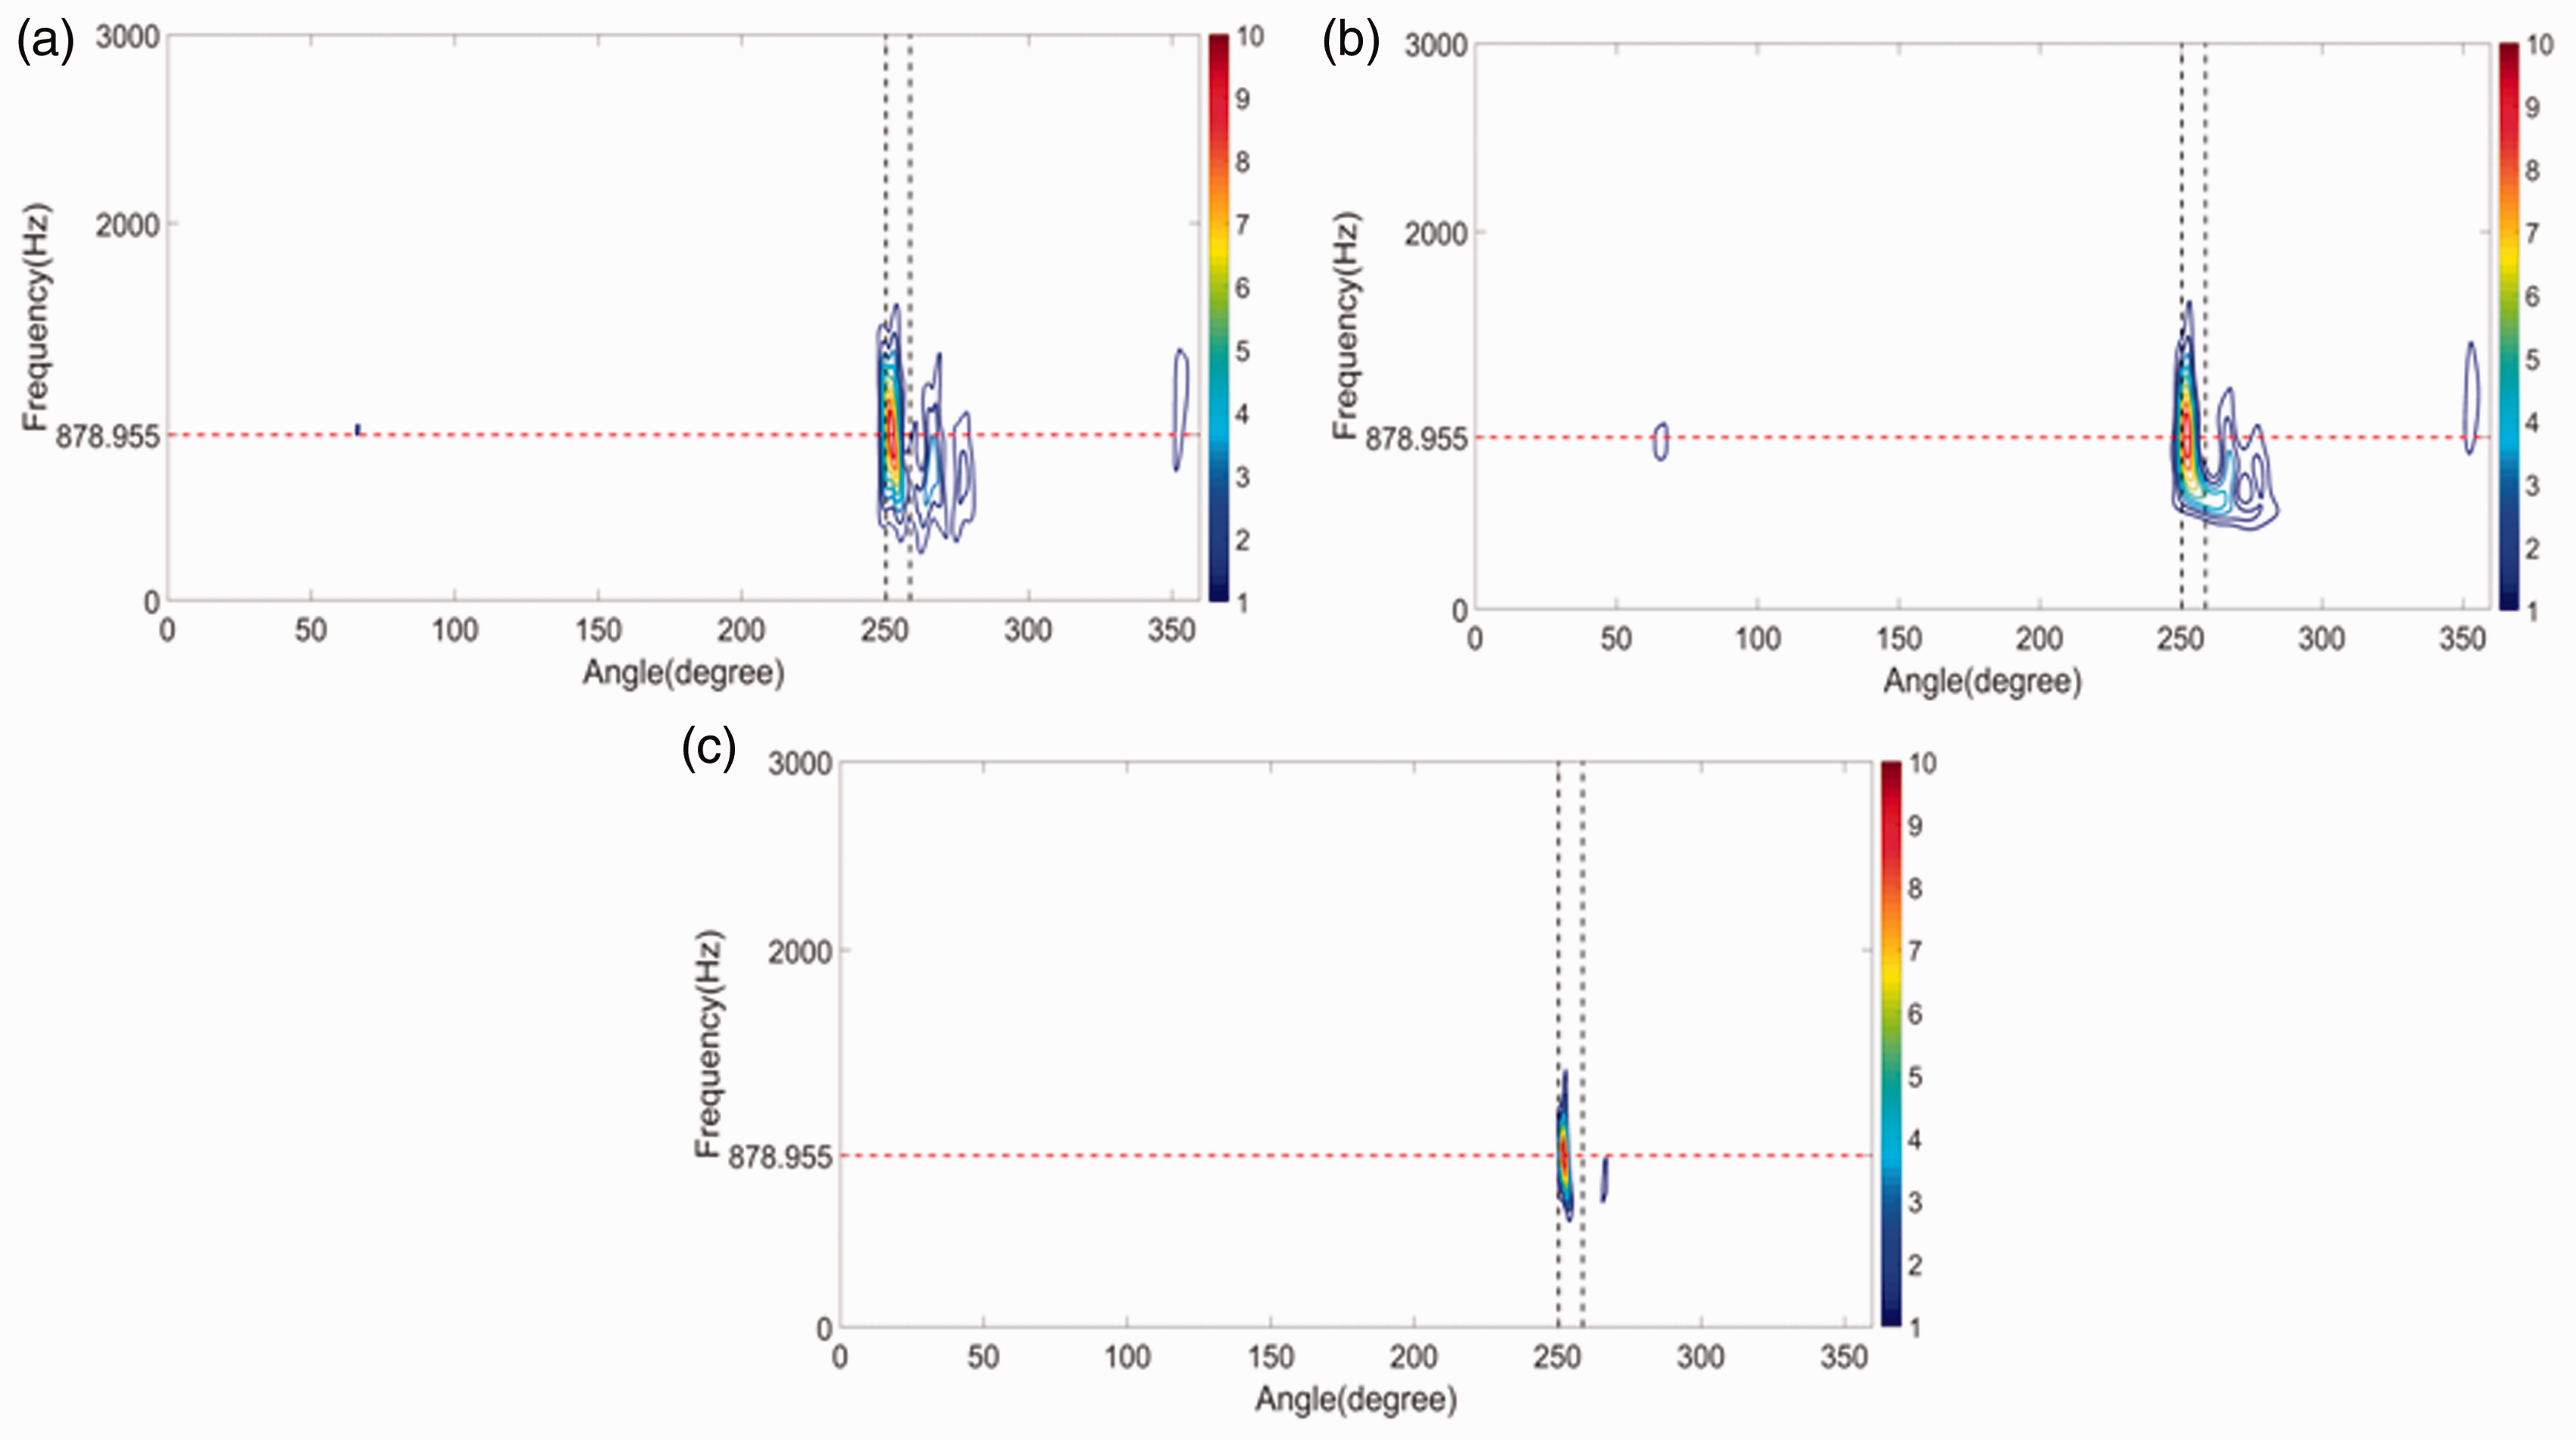
Time–frequency analysis of residual acoustic signals for a gearbox with a broken gear with a medium severity level by: (a) GLCT, (b) CWT, and (c) PWVD. GLCT: generalized linear chirplet transform; CWT: continuous wavelet transform; PWVD: pseudo Wigner–Ville distribution
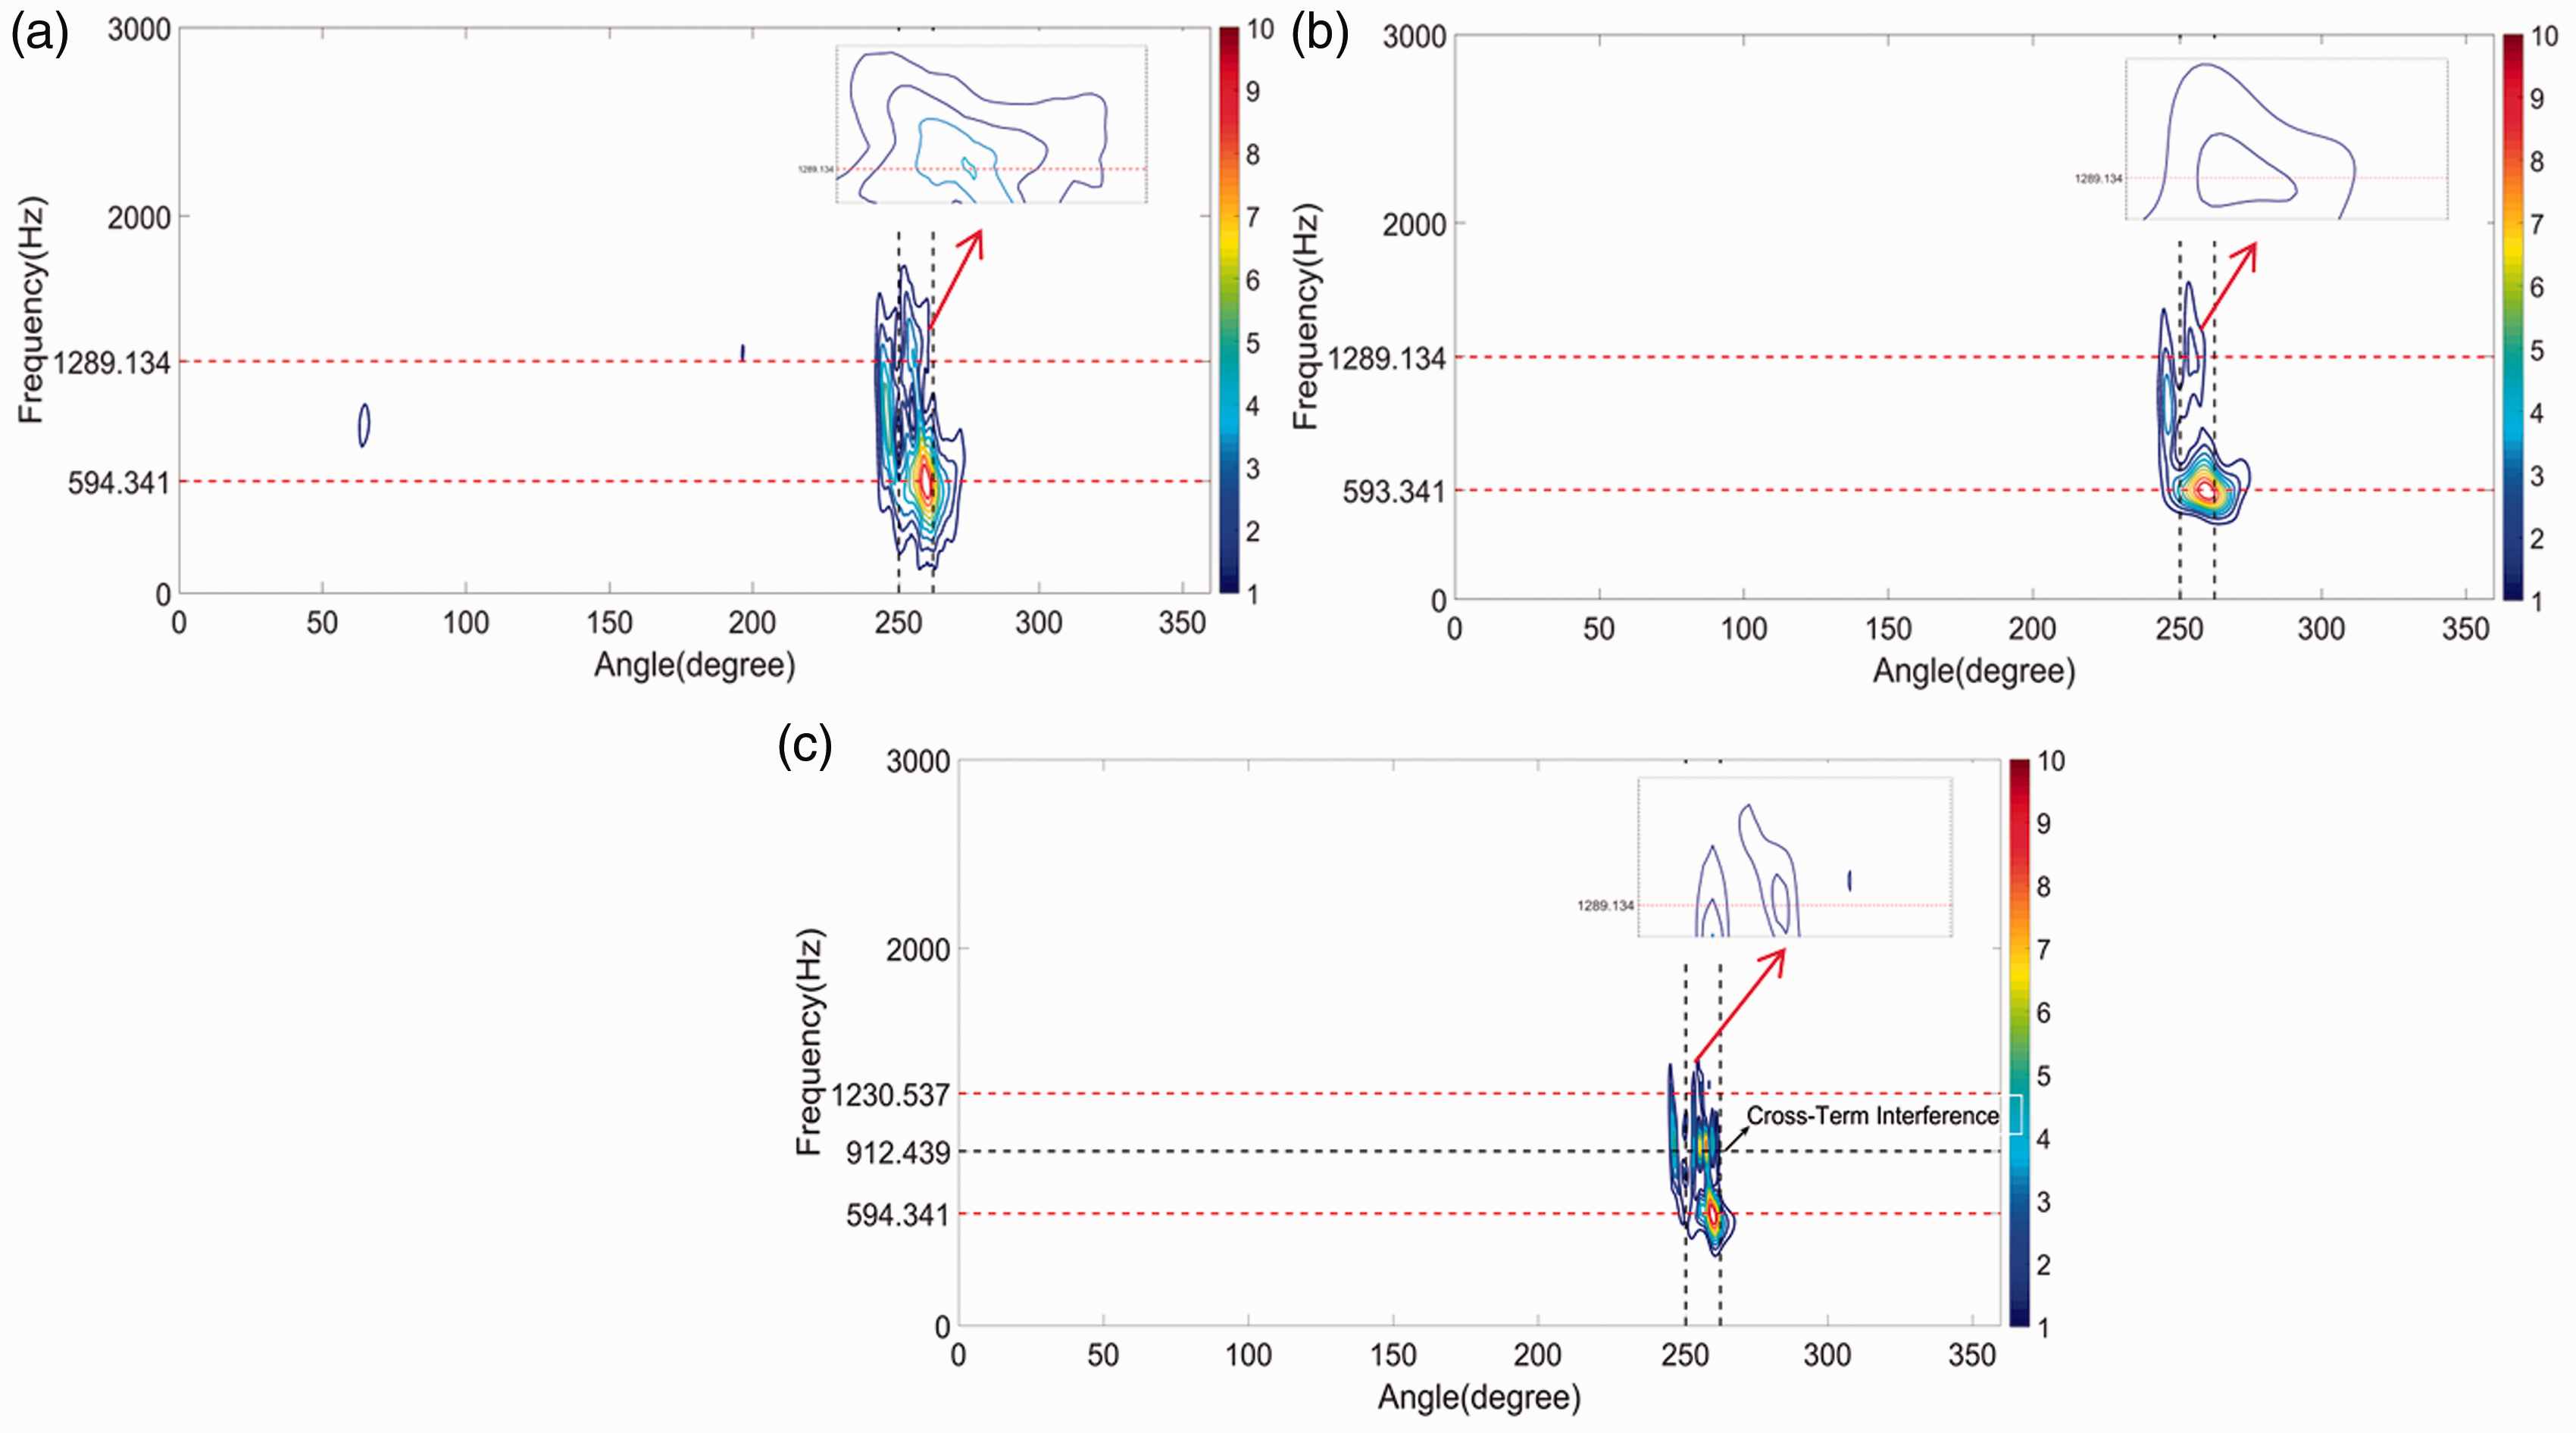
Time–frequency analysis of residual acoustic signal for a gearbox with a broken gear with a high fault severity level by: (a) GLCT, (b) CWT, and (c) PWVD. GLCT: generalized linear chirplet transform; CWT: continuous wavelet transform; PWVD: pseudo Wigner–Ville distribution
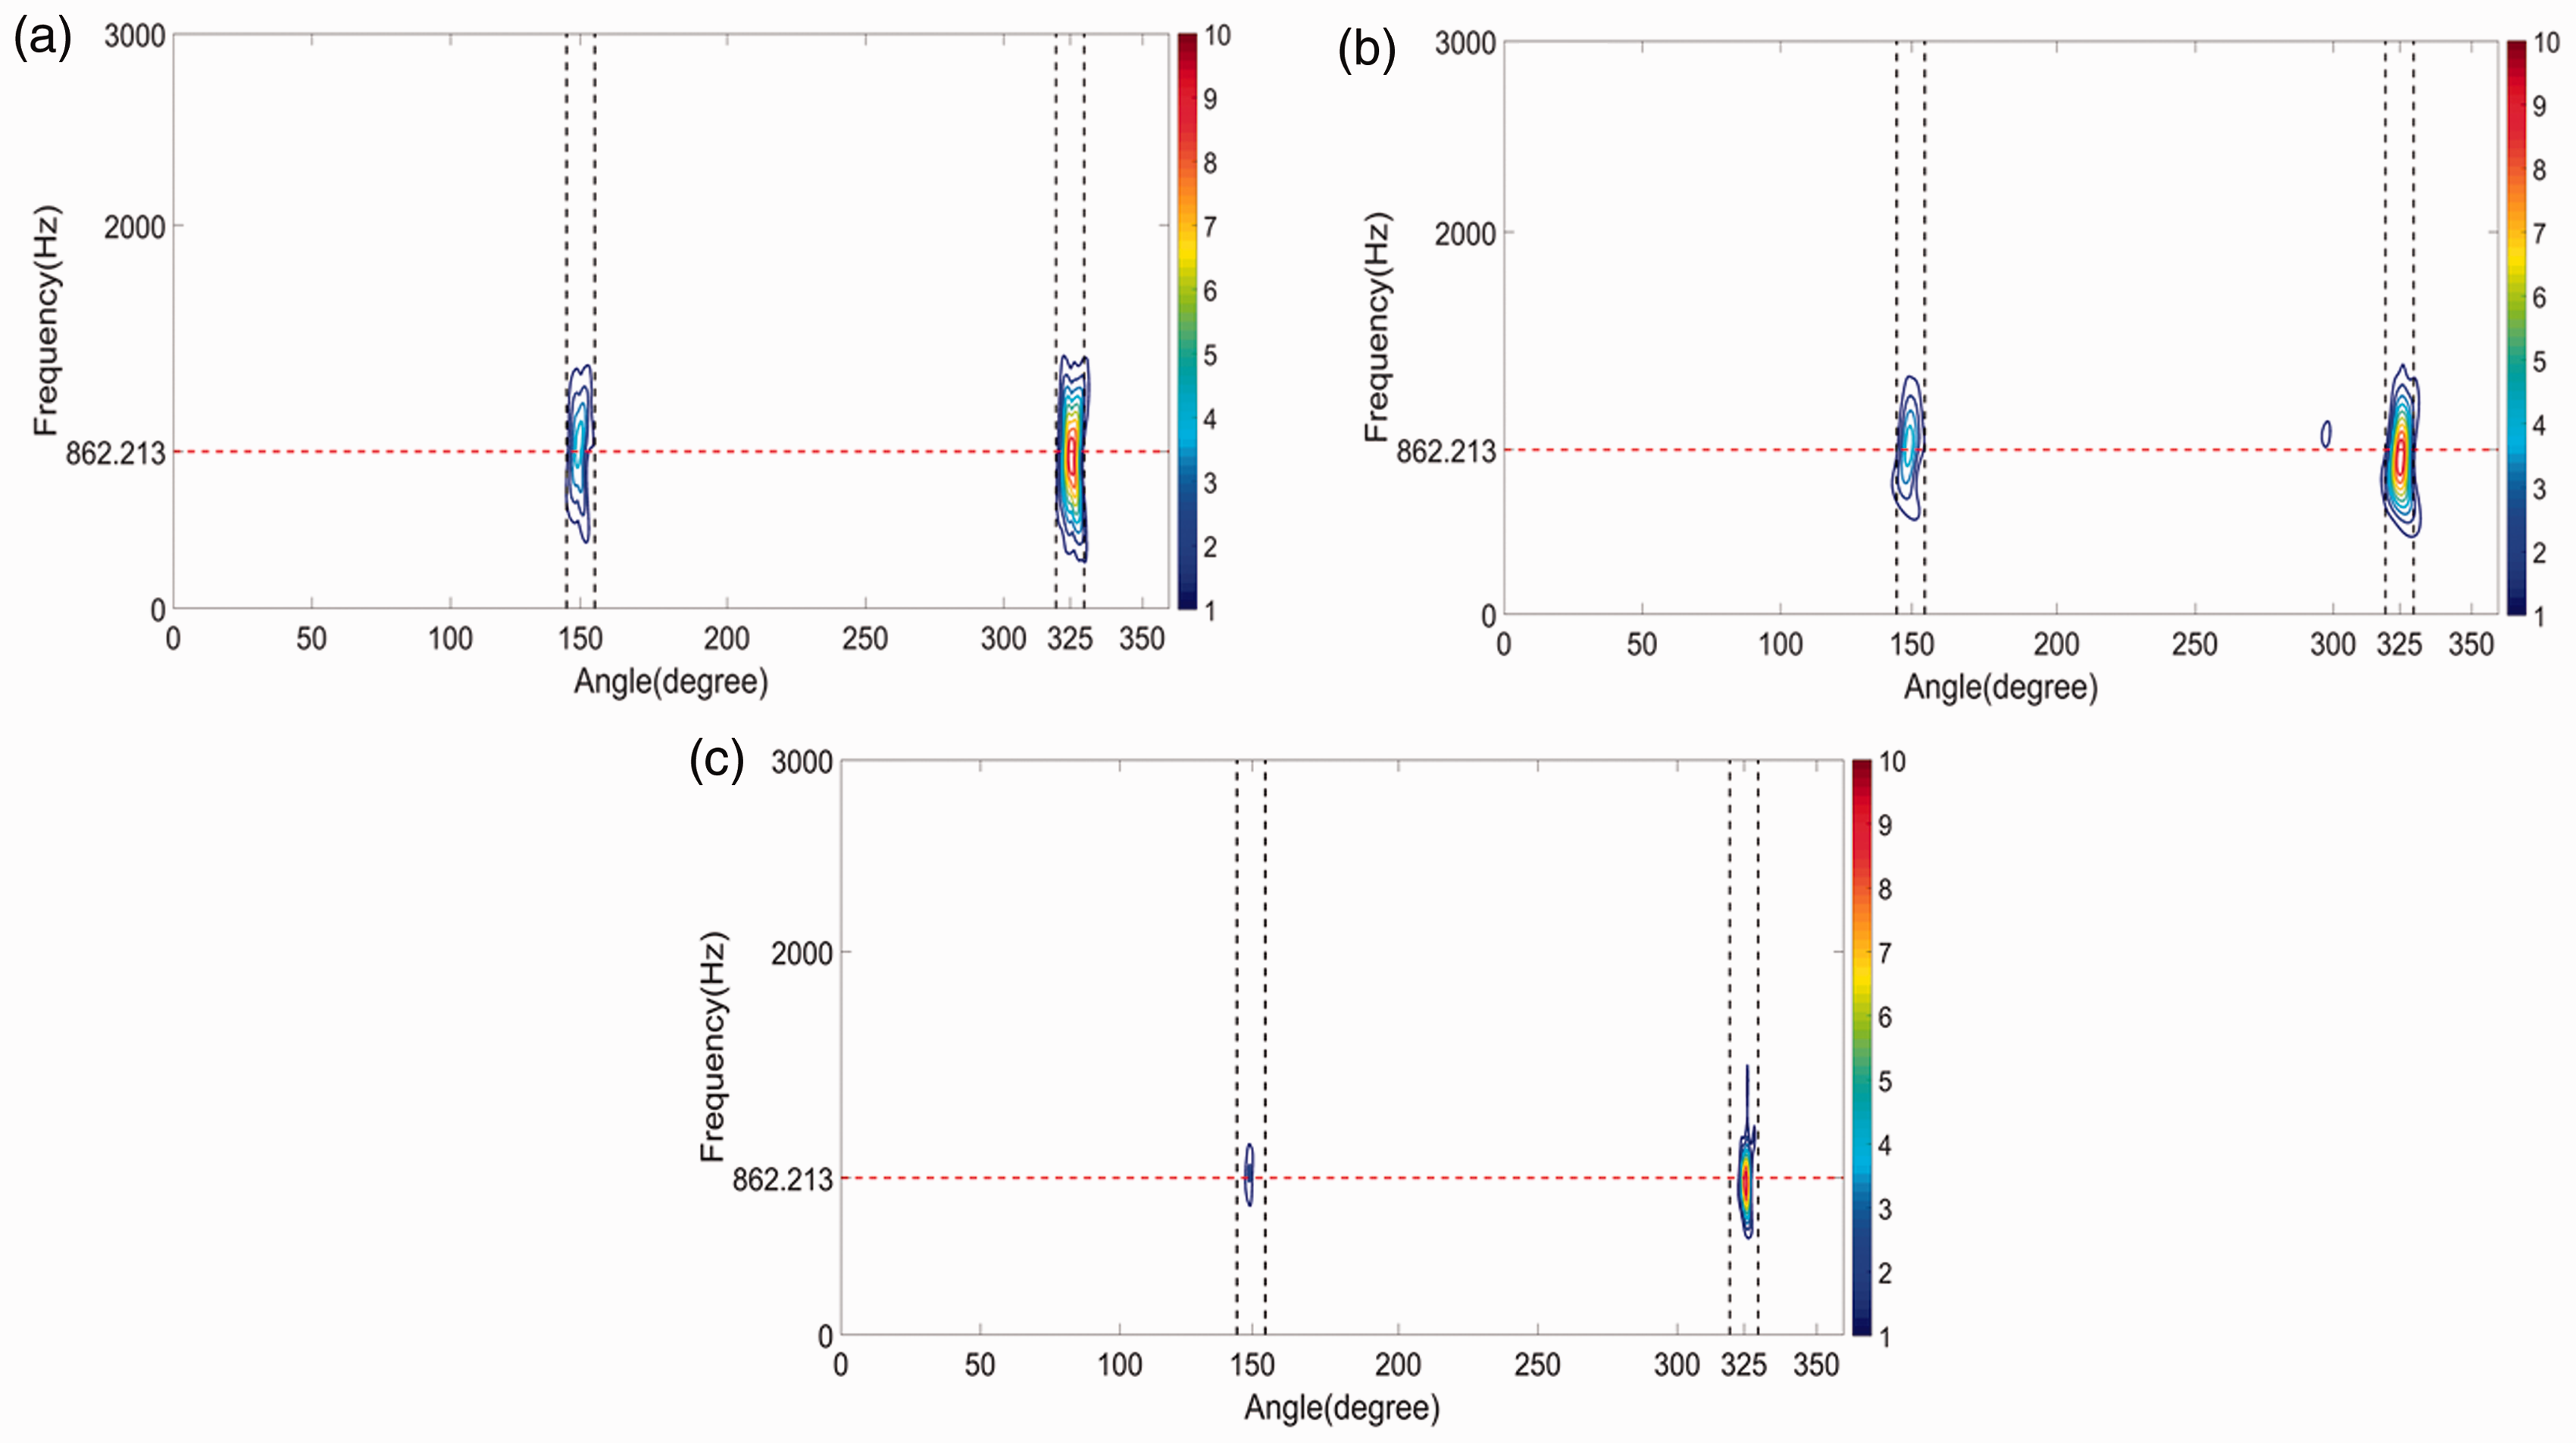
Finally, the results of TFA from the residual acoustic signals of double defects are presented in Figure 16. Both GLCT and CWT methods were able to capture the impulse generated by the double defects in the gear. However, the PWVD method once again could not capture the impulse generated by the chipped tooth as indicated by the black arrow in Figure 16(c). Based on the same reason as in the case of vibration measurements, it is caused not only by the weaker signals generated by the chipped tooth but also by the effect of the smoothing window function implemented in the PWVD method. This affected its time–frequency resolution although it could alleviate the interference terms from the WVD method. However, as observed in Figures 9 and 15 for the case of severe fault severity level, the PWVD method has its limitation in eliminating the cross-term interference.
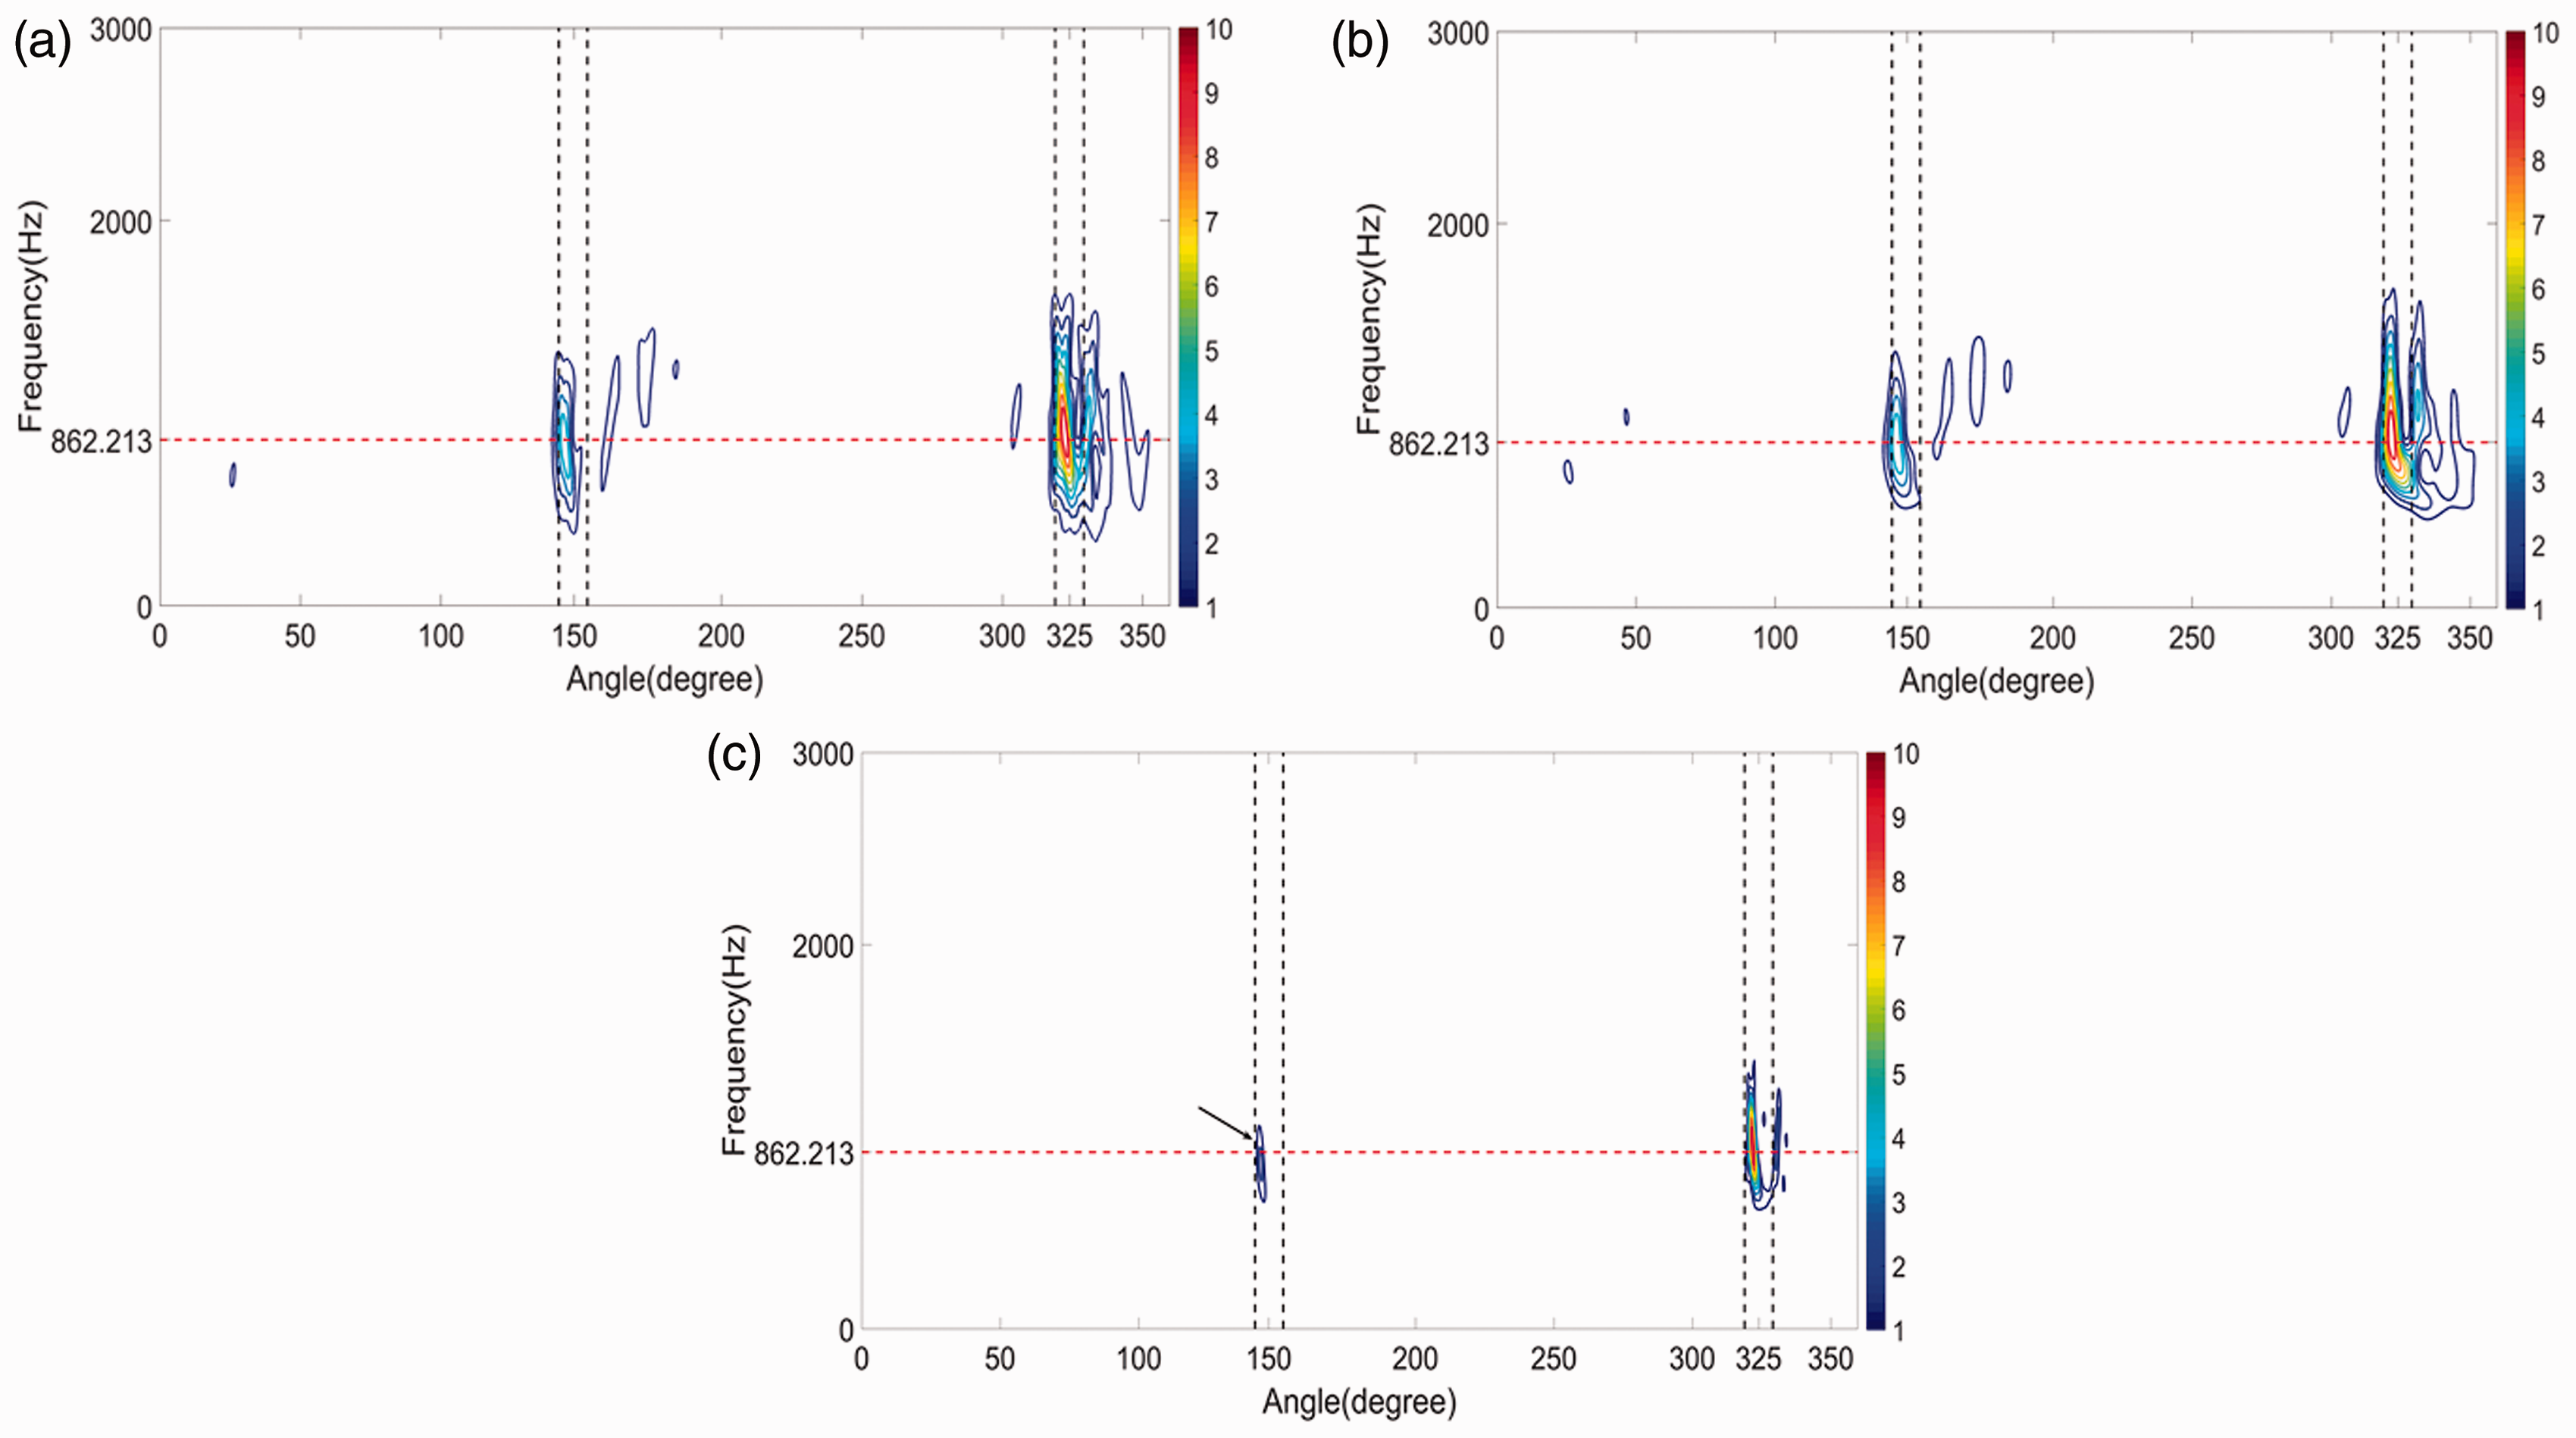
Time–frequency analysis of residual acoustic signals of double defects gear by: (a) GLCT, (b) CWT, and (c) PWVD. GLCT: generalized linear chirplet transform; CWT: continuous wavelet transform; PWVD: pseudo Wigner–Ville distribution.
Therefore, acoustic measurements are generally affected by more significant measurement noise compared to vibration measurements. This can be expected due to the nature of the acoustic sensing that is more prone to measurement noise associated with not only the structure-borne noise but also the air-borne noise. However, with the proper signal processing methodology proposed in this work, it is demonstrated that acoustic measurements were also able to provide useful diagnostics regarding the state-of-health of the gearbox.
Conclusions
The main results of the work can be summarized as follows:
It was shown that the residual method was capable of providing accurate fault diagnostics information obtained from a gearbox. This method could not only reveal the severity level of the faults in the gearbox but also identify the double defect type of faults from both acoustic and vibration measurements. Based on the experiments using vibration measurements, it can be concluded that the combination of the residual method with time–frequency methods, GLCT or CWT, can provide an accurate fault diagnostics information for various gear faults considered in this work. Both CWT and GLCT methods were capable of diagnosing the state-of-health of the gearbox in terms of the severity level and the angular location of the faults. Compared with the other two methods, the PWVD method gave the worst fault diagnostic performance, particularly in its inability to identify the fault feature associated with the chipped tooth in the double defects gear. Moreover, the PWVD method also experiences the cross-term interference with the severe fault severity level. Based on the experiments using acoustic measurements, the work has demonstrated that the GLCT method was superior in detecting faulty gears with the high severity level, compared to the other two methods, CWT and PWVD. Although the residual method was implemented as a pre-processing method to raw acoustic measurements, the CWT method still cannot capture accurately another sideband at 154th order that appears for the gear with the high fault severity level, in contrast to the GLCT method. The PWVD method was also unable to capture the signals generated by the chipped tooth in the double defects gear, as in the case for vibration measurements. Similar to the case of using vibration measurements, the cross-term interference also can be observed in the PWVD method. This work has demonstrated the feasibility of using non-contact acoustic measurements together with the combined GLCT method as an alternative solution for gear fault diagnosis. With the proper signal processing analysis, acoustic measurements can be used to provide accurate fault diagnostics for a gearbox, with the accuracy that is comparable to that from vibration measurements.
Footnotes
Declaration of conflicting interests
The author(s) declared no potential conflicts of interest with respect to the research, authorship, and/or publication of this article.
Funding
The author(s) disclosed receipt of the following financial support for the research, authorship, and/or publication of this article: This work was supported by Ningbo Science and Technology Bureau - Ningbo Natural Science Foundation Project (project code 2017A610080), China.