
Abstract
Ground motions induced by strong, distant earthquakes may contain extremely long-period seismic waves that have a dominant period of up to 10 s. In general, these long-period seismic waves have small amplitudes and do not endanger the safety of building structures and civil infrastructures. However, they may bring unexpected shutdown of some vibration (displacement)-sensitive equipment (such as the wafer scanners in high-tech fabs), which can cause production loss. In this study, seismic waveforms collected from broadband seismometers distributed in Taiwan were used to investigate the ground motion characteristics of the collected distant earthquakes (with an epicenter distance of over 1000 km). The time-variant dominant frequency was extracted using moving window wavelet packet transform to monitor significant long-period seismic waves from the preevent data of each seismic event. The slope of the Arias intensity and the slope index of the recorded seismic waves were also developed to detect the potential accumulation of vibration energy increasing with respect to time and amplitude. The proposed index was used to detect the features of significant distant earthquakes, and it provides a mechanism to prevent unexpected shutdown of displacement-sensitive equipment. Finally, the proposed approach is discussed in relation to the damage severity of high-tech fabs.
Keywords
Introduction
Earthquake monitoring systems have attracted significant attention recently and they can issue timely warnings to minimize damage.1–4 However, most earthquake monitoring systems focus on predicting large ground motion amplitudes. Taiwan is located on the circum-Pacific seismic belt where the Eurasian plate and the Philippine Sea plate contact in this region, and it experiences frequent seismic activity. From the viewpoint of seismic hazard analysis, this kind of earthquake-prone area needs specific provisions for earthquake prevention and mitigation. Generally, the seismic design code specifies that the building shall meet some criteria. However, for the areas located far from the epicenter, it may be insufficient. For example, on 19 September 1985, Mexico City suffered extensive damage due to the Michoacan earthquake, whose epicenter was located 350 km away. 5 Different from the local seismicity, the ground motions generated by some distant earthquakes originating from major seismic fault sources in the area around Taiwan have to travel long distances before they reach Taiwan. Although the high-frequency seismic waves are damped out rapidly as they propagate away from the sources, long-period seismic waves undergo less energy dissipation and hence can carry energy over longer distances. Typically, these ground motions have very low peak ground amplitudes but long dominant periods. Owing to their inherent properties, the long-period seismic waves can be very destructive to displacement-sensitive structural systems.6–8
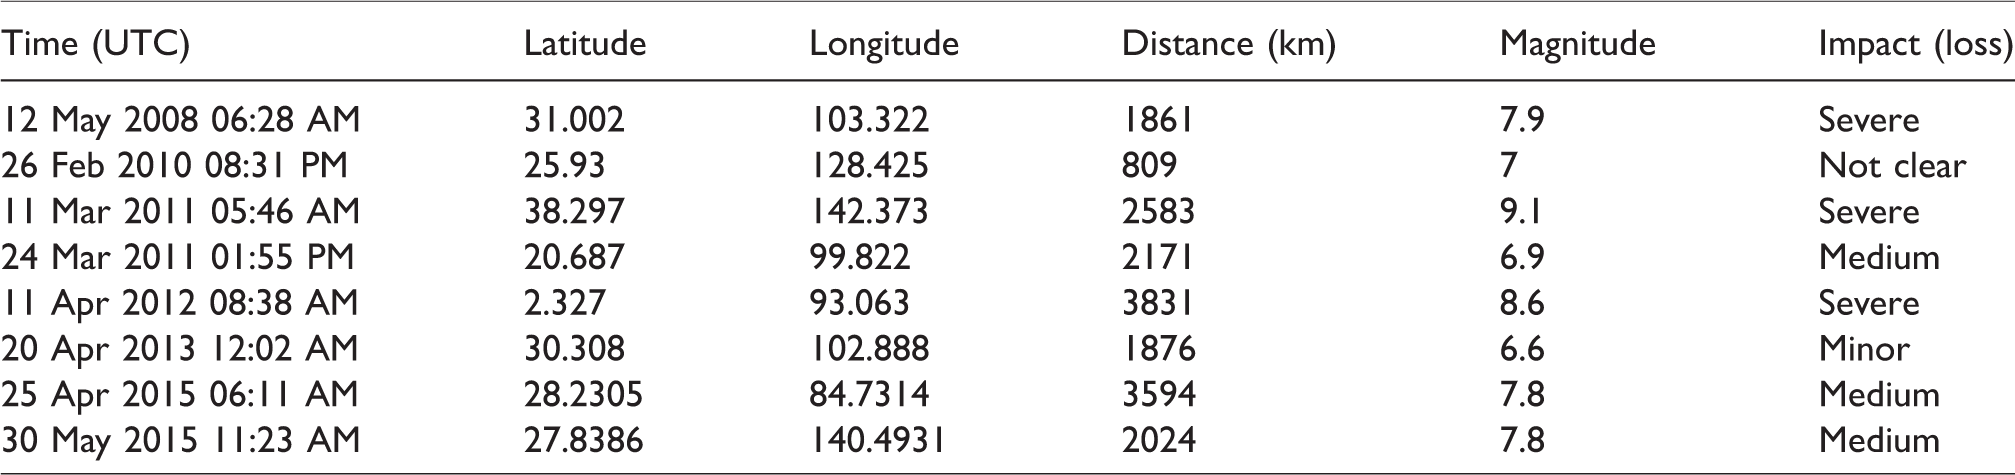
Because the seismic intensity of distant earthquakes is considerably small, it will not endanger traditional buildings and bridges. However, high-precision facilities (or, in particular, vibration-sensitive equipment) are susceptible to damage by distant earthquakes due to their significant long-period seismic waves with considerable amount of displacement. 9 Taking the wafer scanners used to fabricate nanometer-scale ICs in high-tech fabs as an example, they equip with vibration isolation devices, called air mounts, that dominates their dynamic response. 10 Typically, the air mounts provide an isolation mechanism with a very low natural frequency, amplify the long-period seismic waves generated by distant earthquakes, and eventually bring excessive displacement. For example, on 11 April 2012, a magnitude 8.6 earthquake, with an epicenter located in Sumatra, Indonesia, 3831 km away from Taiwan, produced a huge shutdown to the wafer scanners in the Taiwan Science Parks. This earthquake was followed by several distant earthquakes that caused further unexpected shutdown in the Taiwan Science Parks.
Table 1 lists the earthquake information and the impact of these earthquakes. It is important to note that not all distant earthquakes bring impact to vibration-sensitive equipment. Admittedly, there are some features in the recorded seismic waveforms that cause the shutdown and need to be extracted and identified.
Information of eight distant earthquakes with impact on high-tech fabs.
To study the ground motion characteristics of distant earthquakes, earthquakes with magnitudes larger than 6.6 and epicenters located within a radius of 4000 km of the center of Taiwan (during the period from early 2008 to early 2017) were collected from the database of the United States Geological Survey. Figure 1(a) shows the distribution of epicenters of the selected 166 seismic events. Among them, a total of 38 events were used in this study (Figure 1(b)). The earthquake information of the selected seismic events is listed in Table 2. The objective of this study is to investigate the ground motion characteristics from these distant earthquakes. An attempt is made to develop an index for early warning of the vibration-sensitive equipment in high-tech fabs.
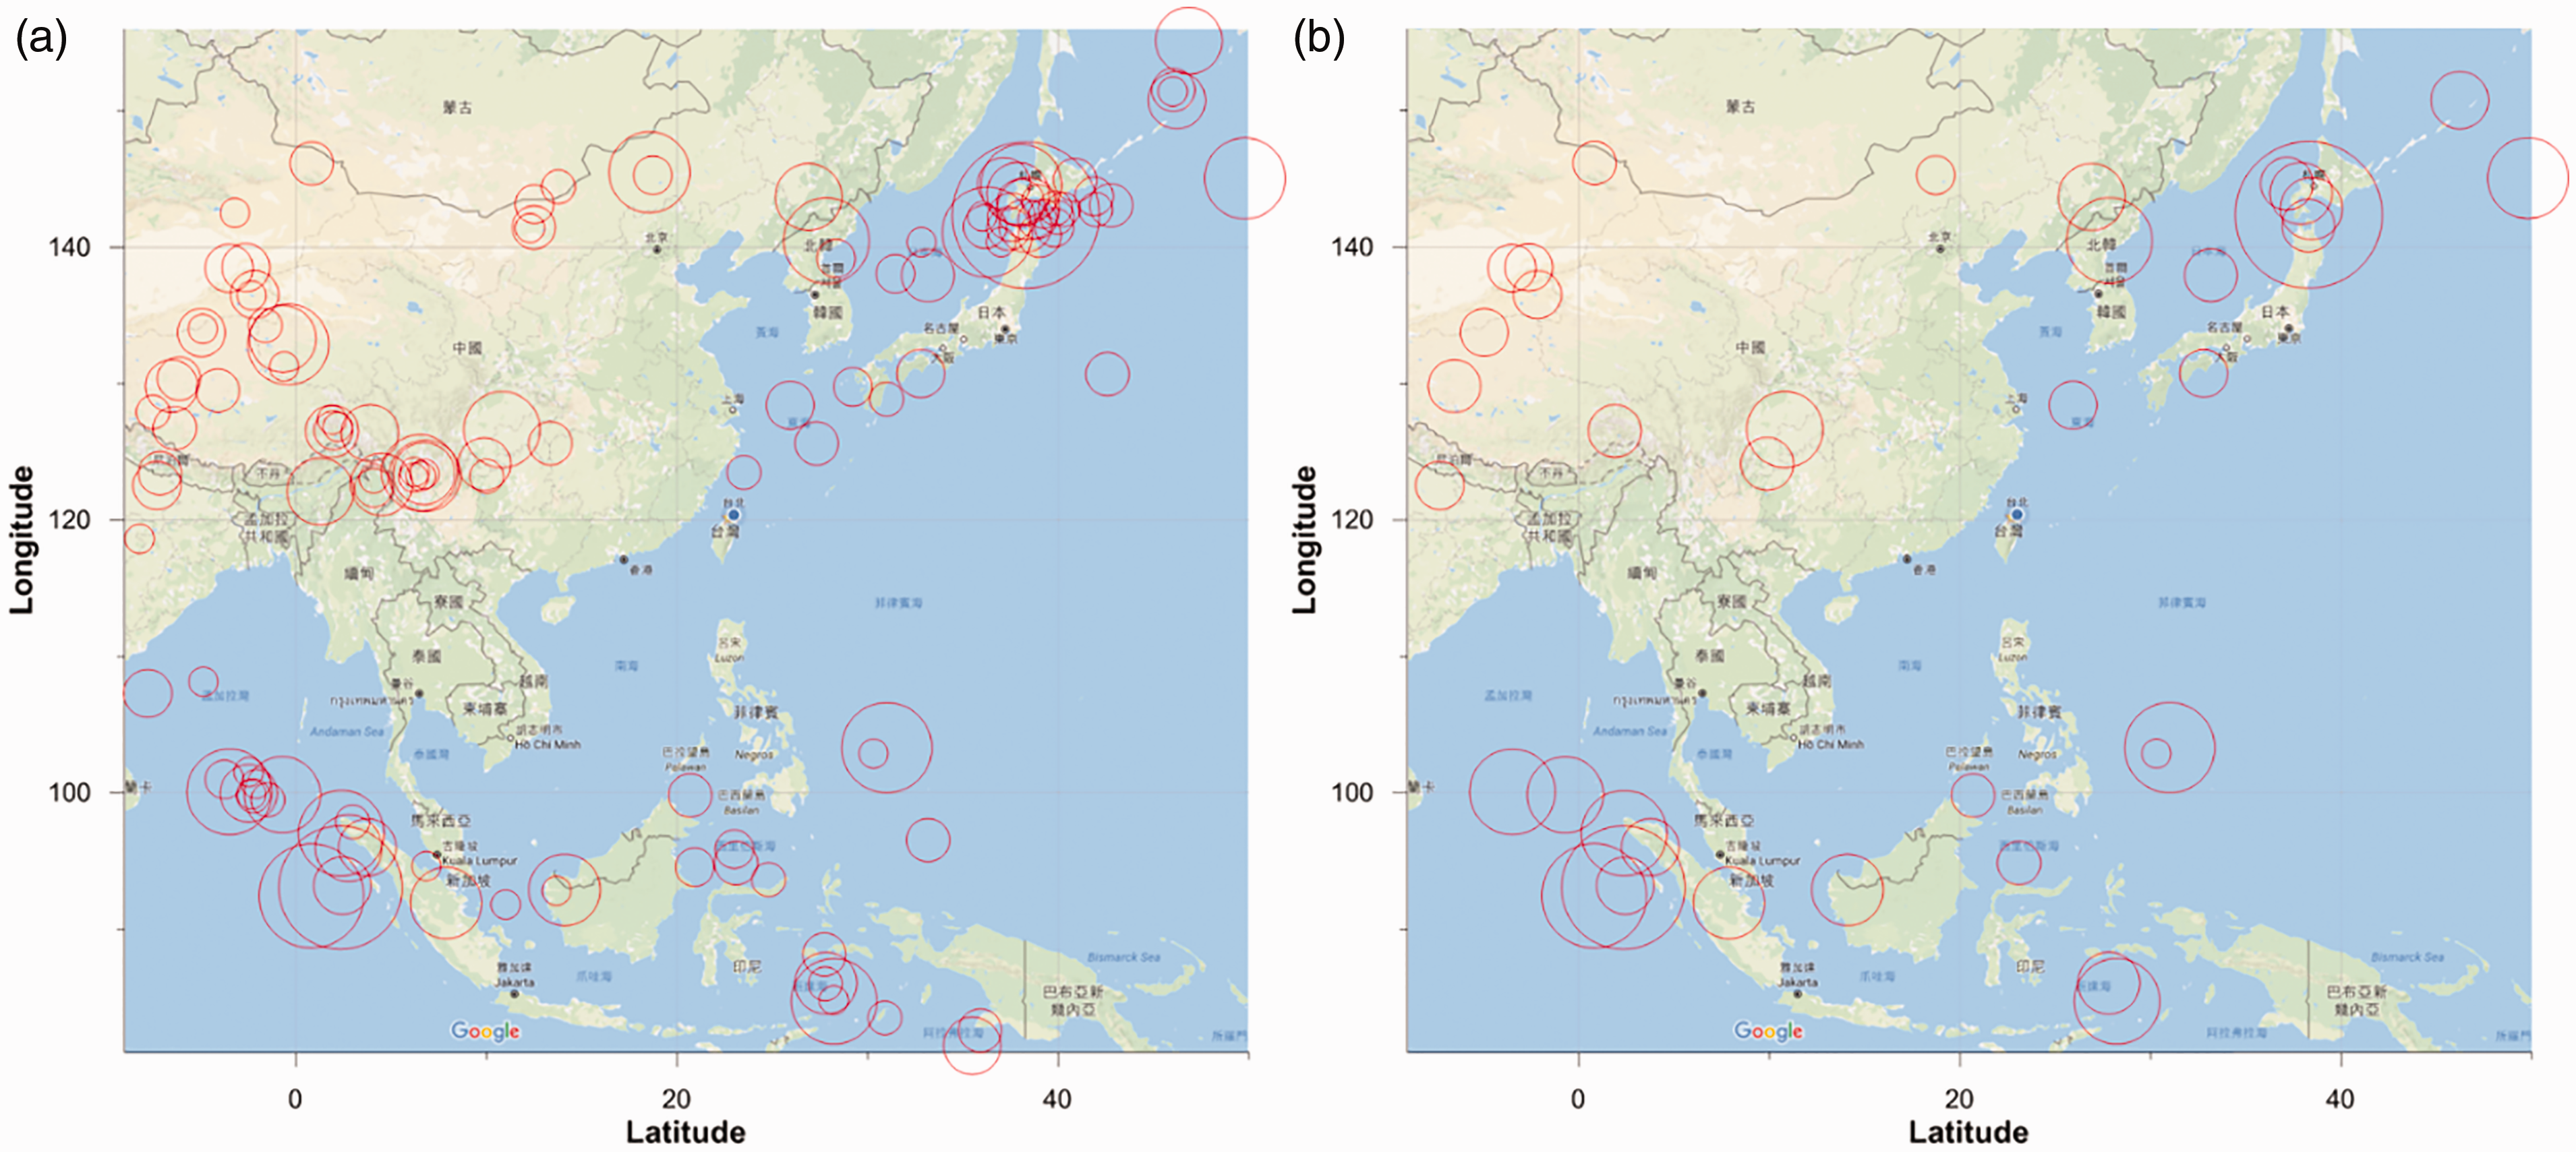
Epicenter of 166 distant earthquakes and selected 38 distant earthquakes.
Information of selected 38 distant earthquakes.
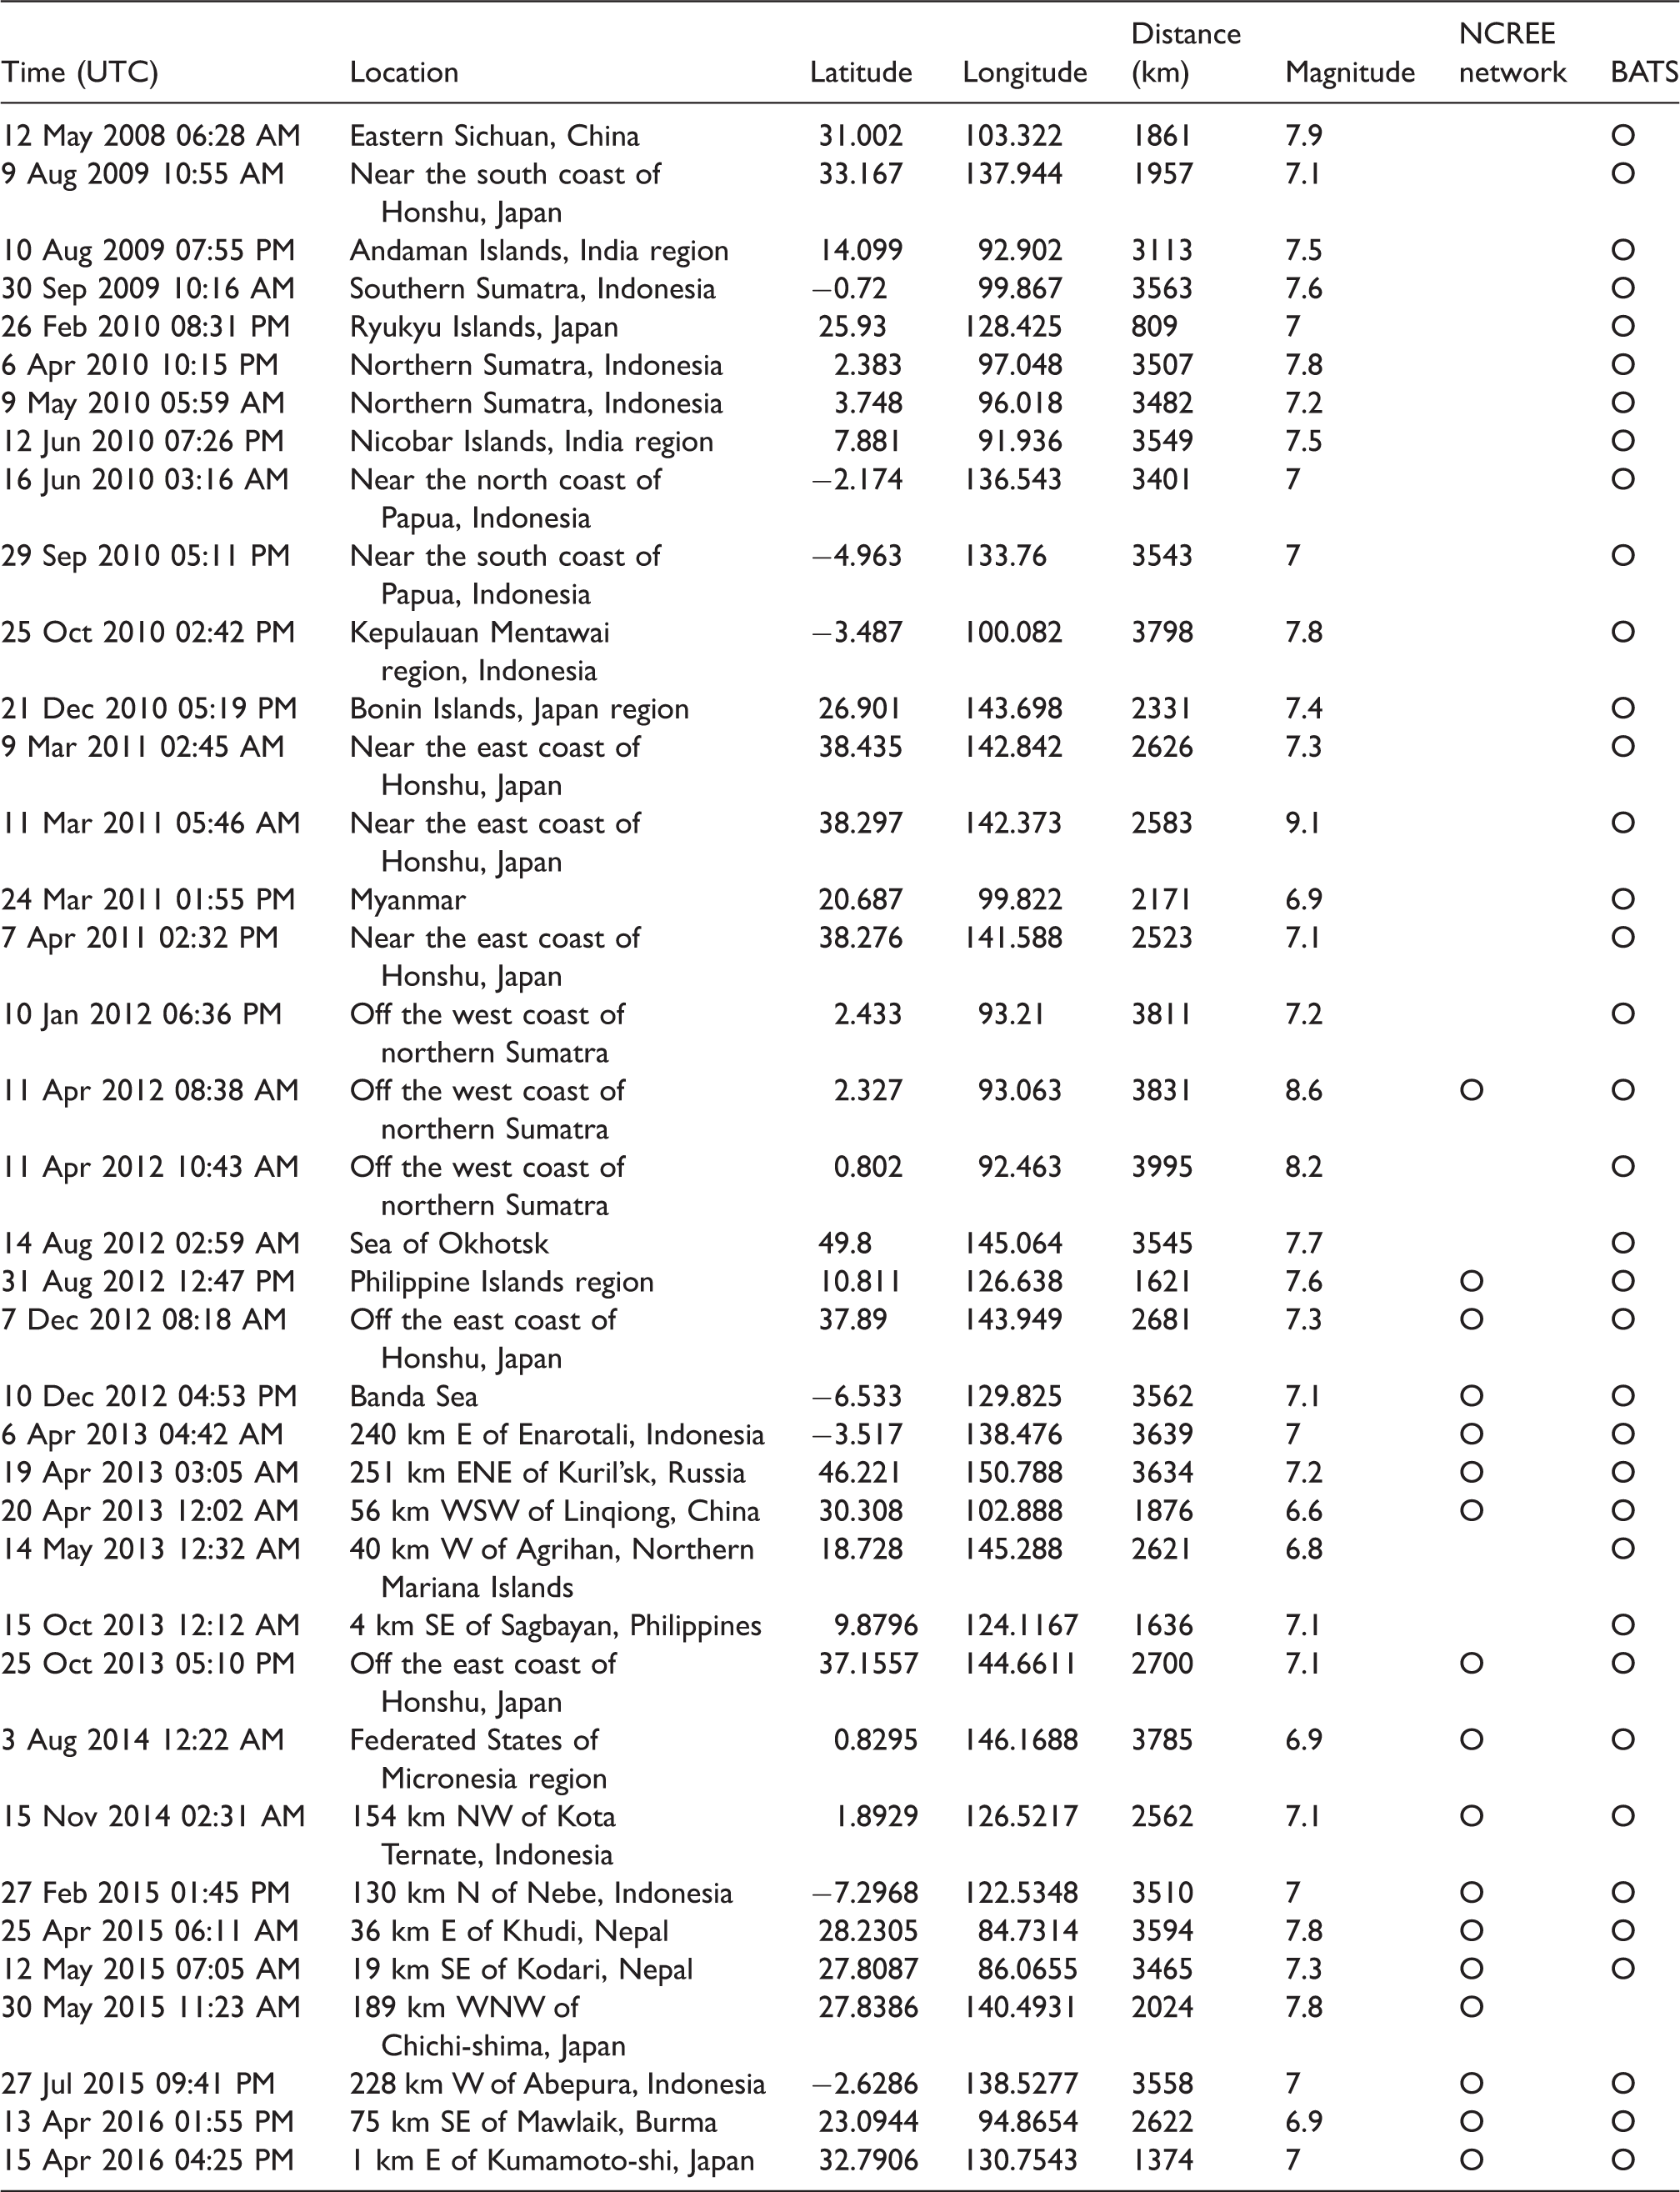
BATS: Broadband Array in Taiwan for Seismology; NCREE: National Center for Research on Earthquake Engineering.
Impact of distant earthquakes on vibration-sensitive equipment
Some high-precision facilities in high-tech fabs are classified as vibration (displacement)-sensitive equipment since they are prone to damage from its inertial loading. With broadband seismometers distributed in Taiwan, the ground motion characteristics of distant earthquakes can be studied. Besides, the impact of distant earthquake on the vibration-sensitive equipment will also be examined.
Strong motion arrays in Taiwan and recorded seismic waveforms
There are four different island-wide earthquake monitoring systems in Taiwan. They are briefly described below:
Taiwan Strong Motion Instrumentation Program (TSMIP), Central Weather Bureau: Starting in 1992, TSMIP connects over 800 strong motion stations (including borehole stations) that consist of 110 real-time stations and 60 building arrays.11,12 It is not a real-time monitoring system. Taiwan Rapid Earthquake Information Release System (TREIRS), Central Weather Bureau: This system starts to operate since 1996. It is used to determine the location and magnitude of earthquakes in the Taiwan region within 1 min of their occurrence.13,14 Broadband Array in Taiwan for Seismology (BATS), Institute of Earth Sciences, Academia Sinica: The system started in 1992 and has produced high-quality data in sufficient quantity since early 1996. The number of permanent broadband stations is 28, including two that are located in the South China Sea.
15
National Center for Research on Earthquake Engineering (NCREE) network: This system started its operation in early 2012. It has 33 permanent broadband stations. This network system has produced data for earthquake engineering research.
Both BATS and NCREE network are equipped with state-of-the-art broadband seismometers and are therefore used in this study. Figure 2 shows the seismometer distribution of these two earthquake monitoring systems. In addition to the above-mentioned island-wide earthquake monitoring systems, some high-tech fabs in Taiwan have also installed their own earthquake monitoring systems. Since the Great East Japan earthquake (11 March 2011), many systems were set to the 24 h recording mode rather than the trigger mode. Thus, the systems have sensed and recorded several distant earthquakes. The specifications of seismometers are listed in Table 3.
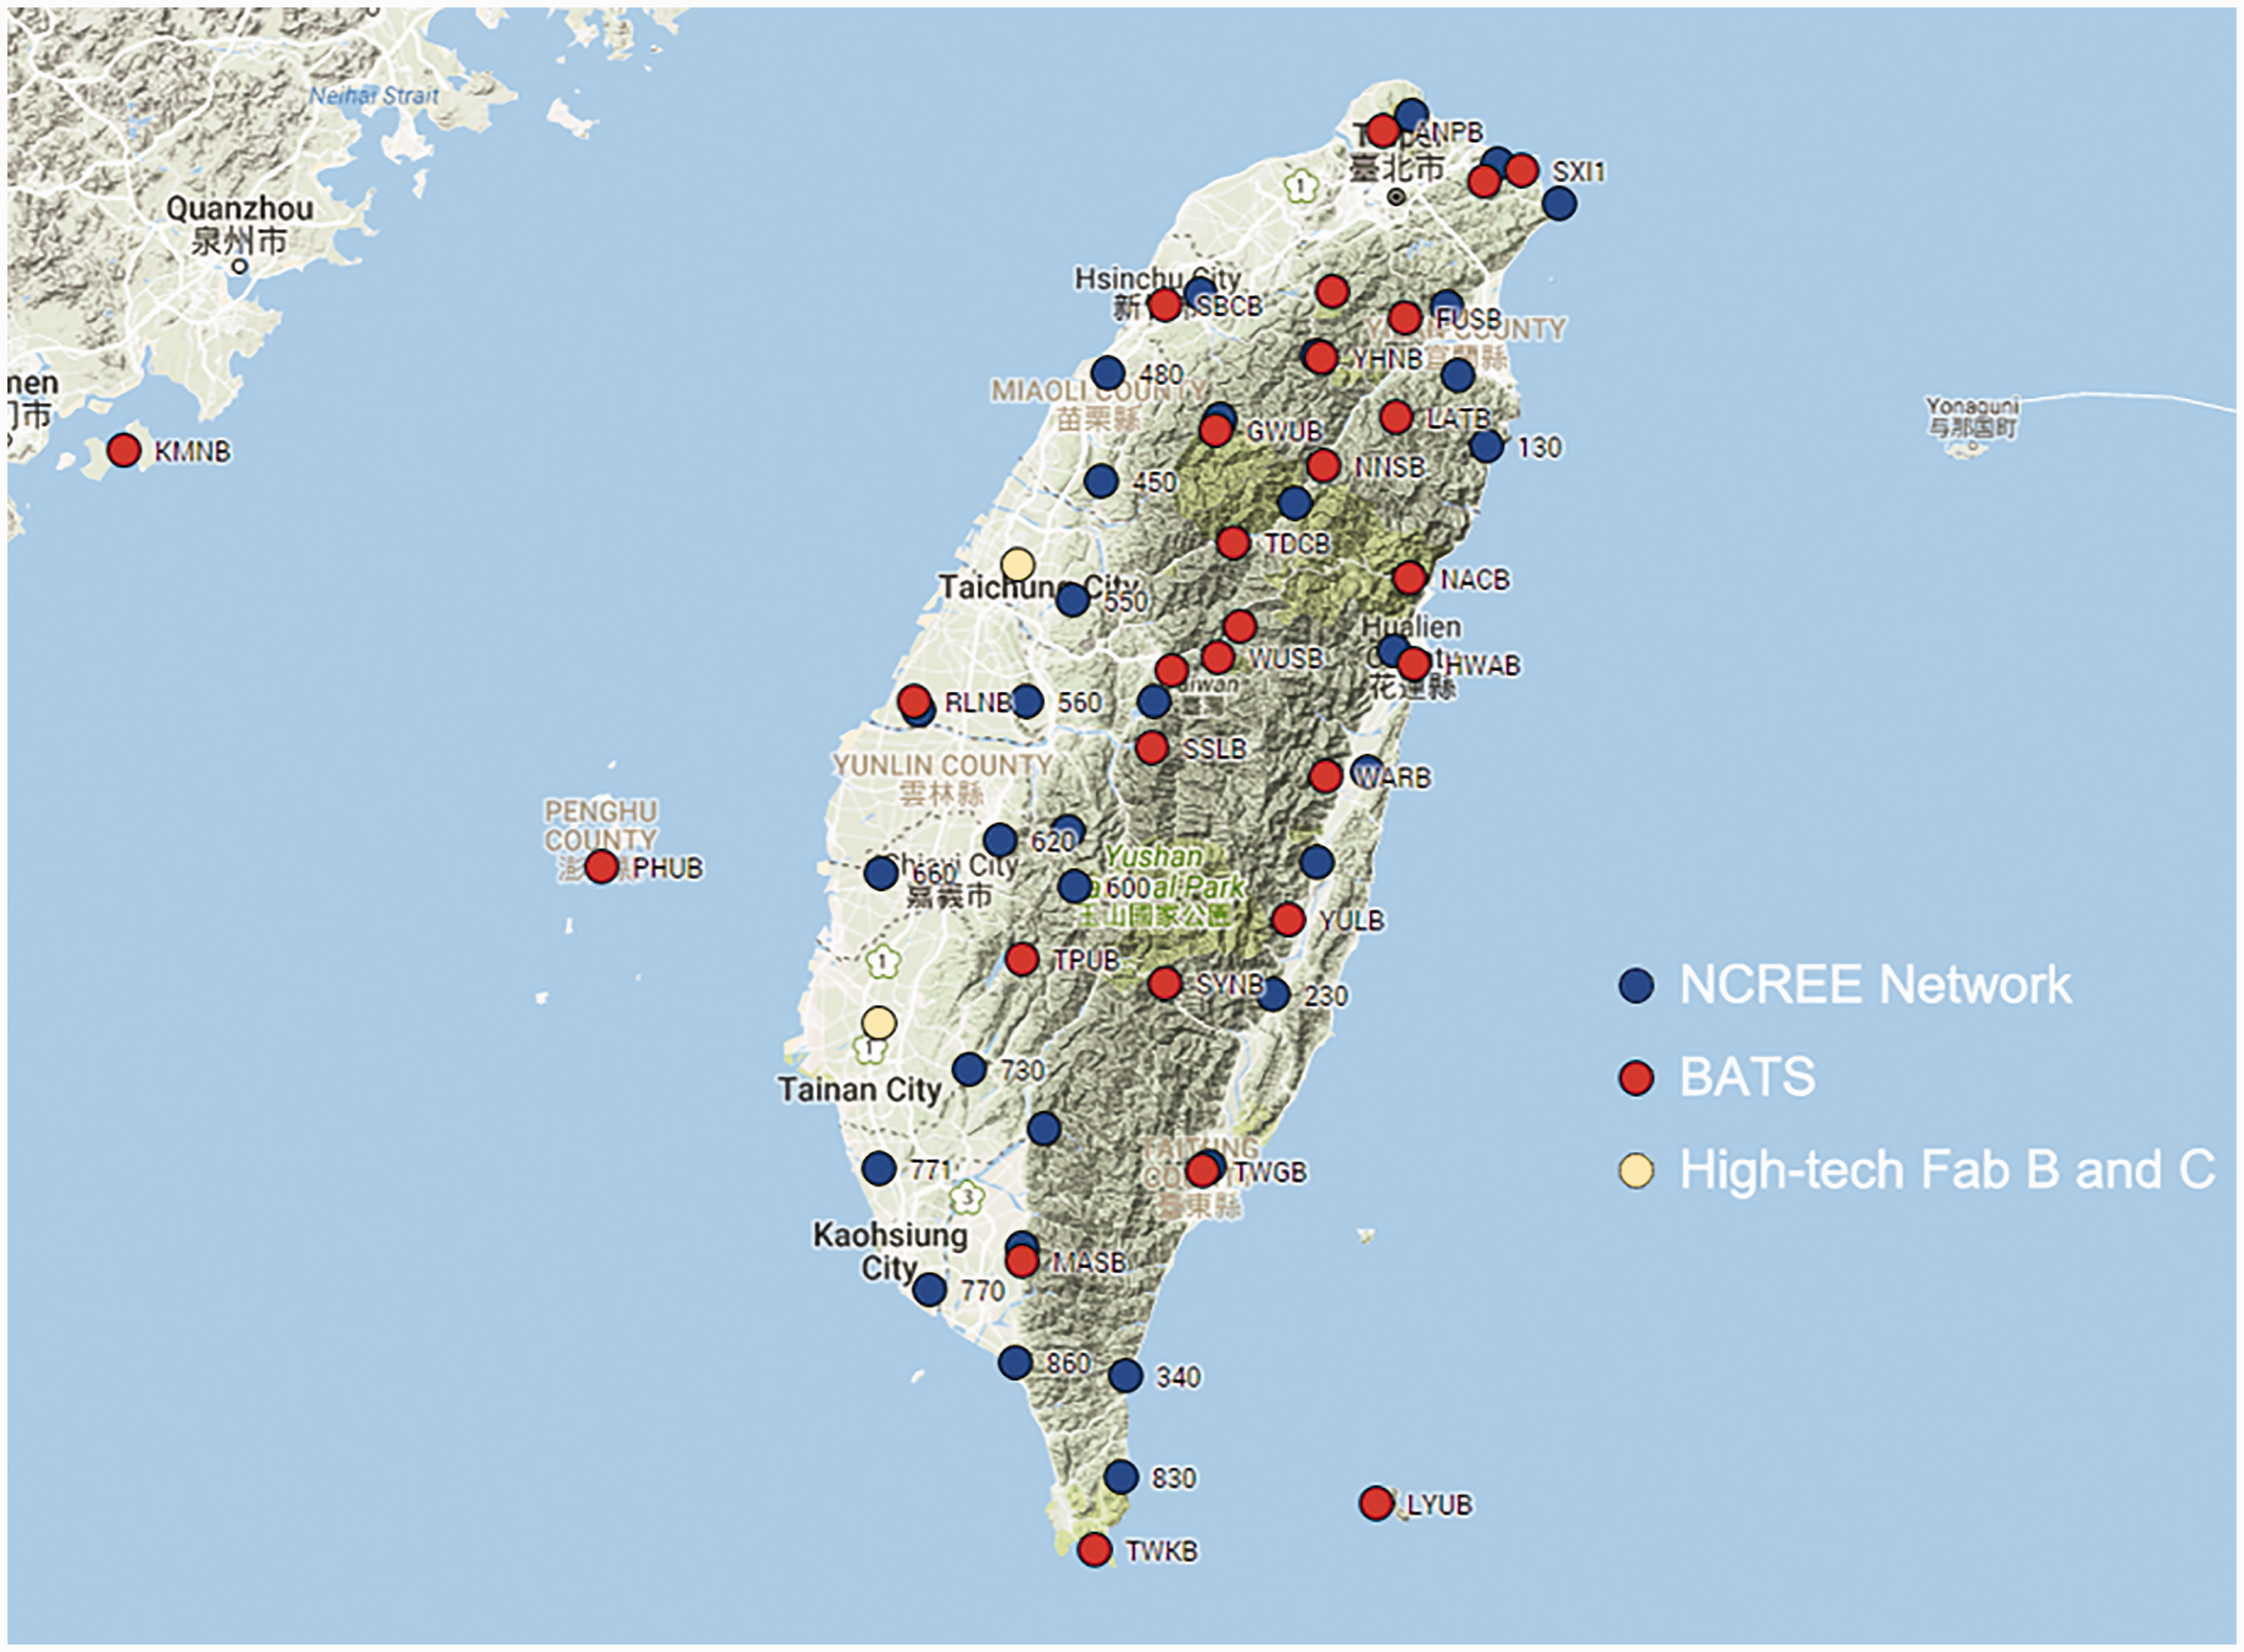
Broadband seismometers distributed in Taiwan. BATS: Broadband Array in Taiwan for Seismology; NCREE: National Center for Research on Earthquake Engineering.
Specification of seismometers.
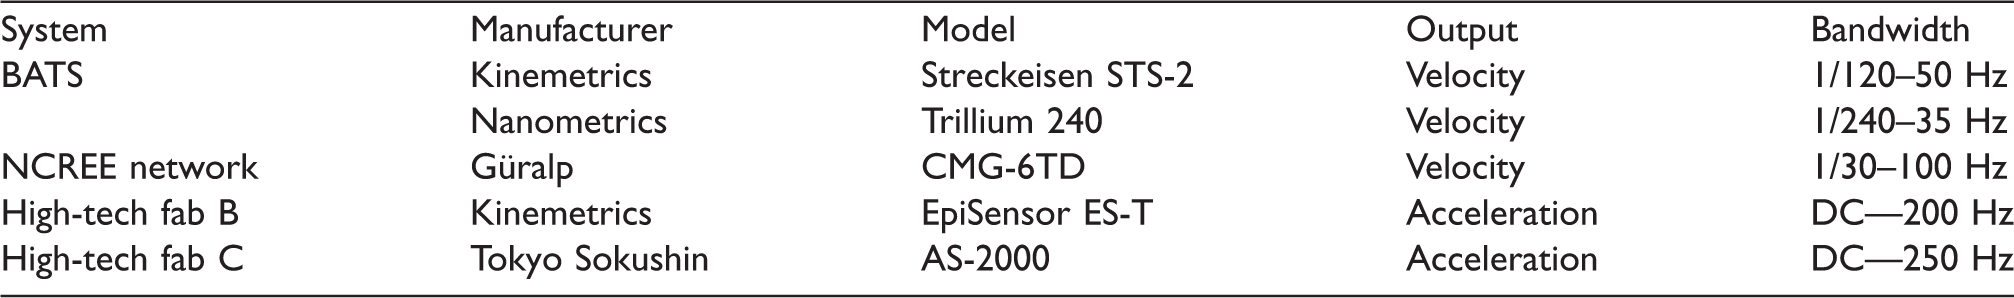
BATS: Broadband Array in Taiwan for Seismology; NCREE: National Center for Research on Earthquake Engineering.
To compare the ground motion data collected individually from earthquake monitoring systems, the recorded seismic waveforms and their frequency contents from the RLNB station (BATS) and the B550 station (NCREE network) during the Indian Ocean earthquake (11 April 2012) are shown in Figure 3. (The Fourier amplitude only shown the data from 0.0 to 915 s so as to avoid the clipped signal in NS direction for the NCREE data.) These two stations are only 47.5 km apart and the result displays no significant difference across these two systems, except that the B550 station has a saturation level of 0.3 cm/s. It is observed that the dominant frequency in the specific time window is about 0.04–0.05 Hz which confirms the existence of long-period seismic wave in the distant earthquake. The seismic waveforms across Taiwan during the Indian Ocean earthquake recorded by the NCREE network are shown in Figure 4. It is observed that the recorded maximum ground velocity was less than 1.0 cm/s and the duration between the trigger time and the time of maximum velocity was over 1100 s. Figure 5(a) presents three different seismic waveforms recorded from the B550 station, including the Indian Ocean earthquake, Lushan (China) earthquake (20 April 2013), and Samar (Philippine) earthquake (31 August 2012). It is noticed that the ground motion duration was considerably long and the amplitude was extremely small. Figure 5(b) also shows a comparison of the velocity response spectrum between 10 distant earthquakes collected from the BATS station. The dominant frequency of these ground motion data is observed to be between 0.02 and 0.12 Hz, which indicates the existence of the long-period seismic waves in the velocity records.
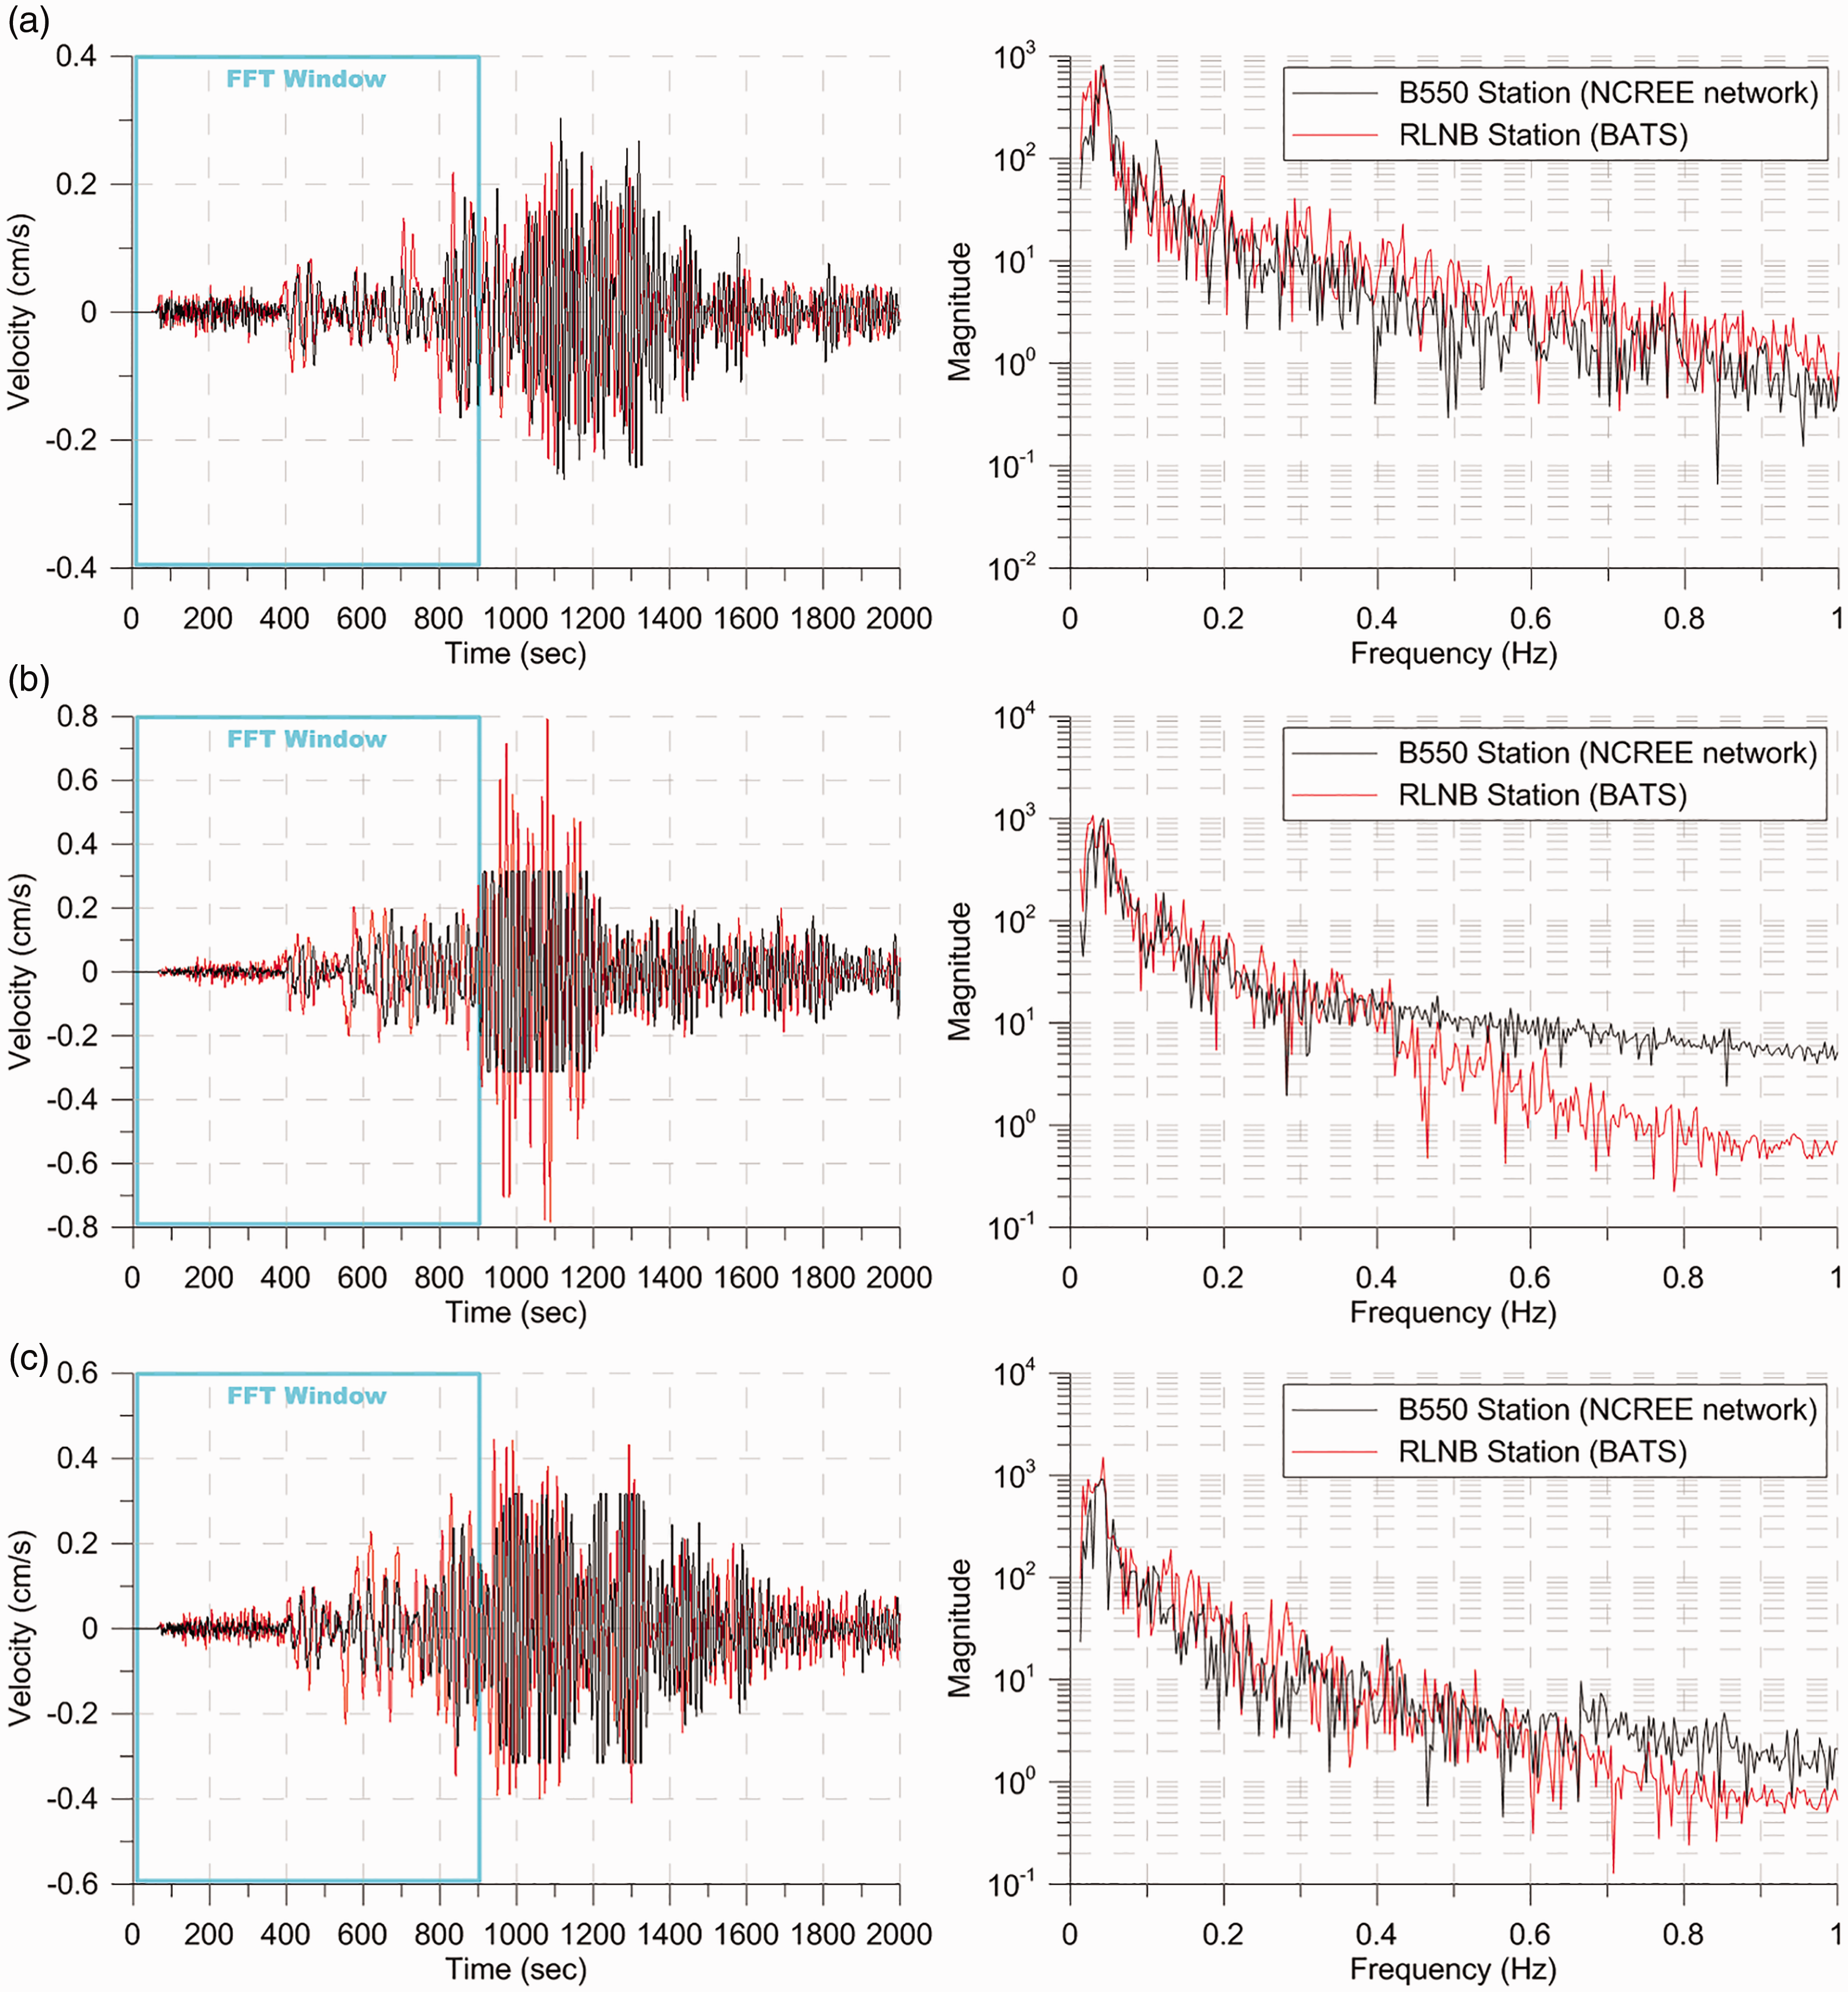
Comparison on the recorded seismic waveforms and its Fourier amplitude spectrum (for time window 0.0–915 s) between the RLNB station (BATS) and the B550 station (NCREE network): (a) up–down direction, (b) North–South direction, (c) East–West direction. BATS: Broadband Array in Taiwan for Seismology; NCREE: National Center for Research on Earthquake Engineering.
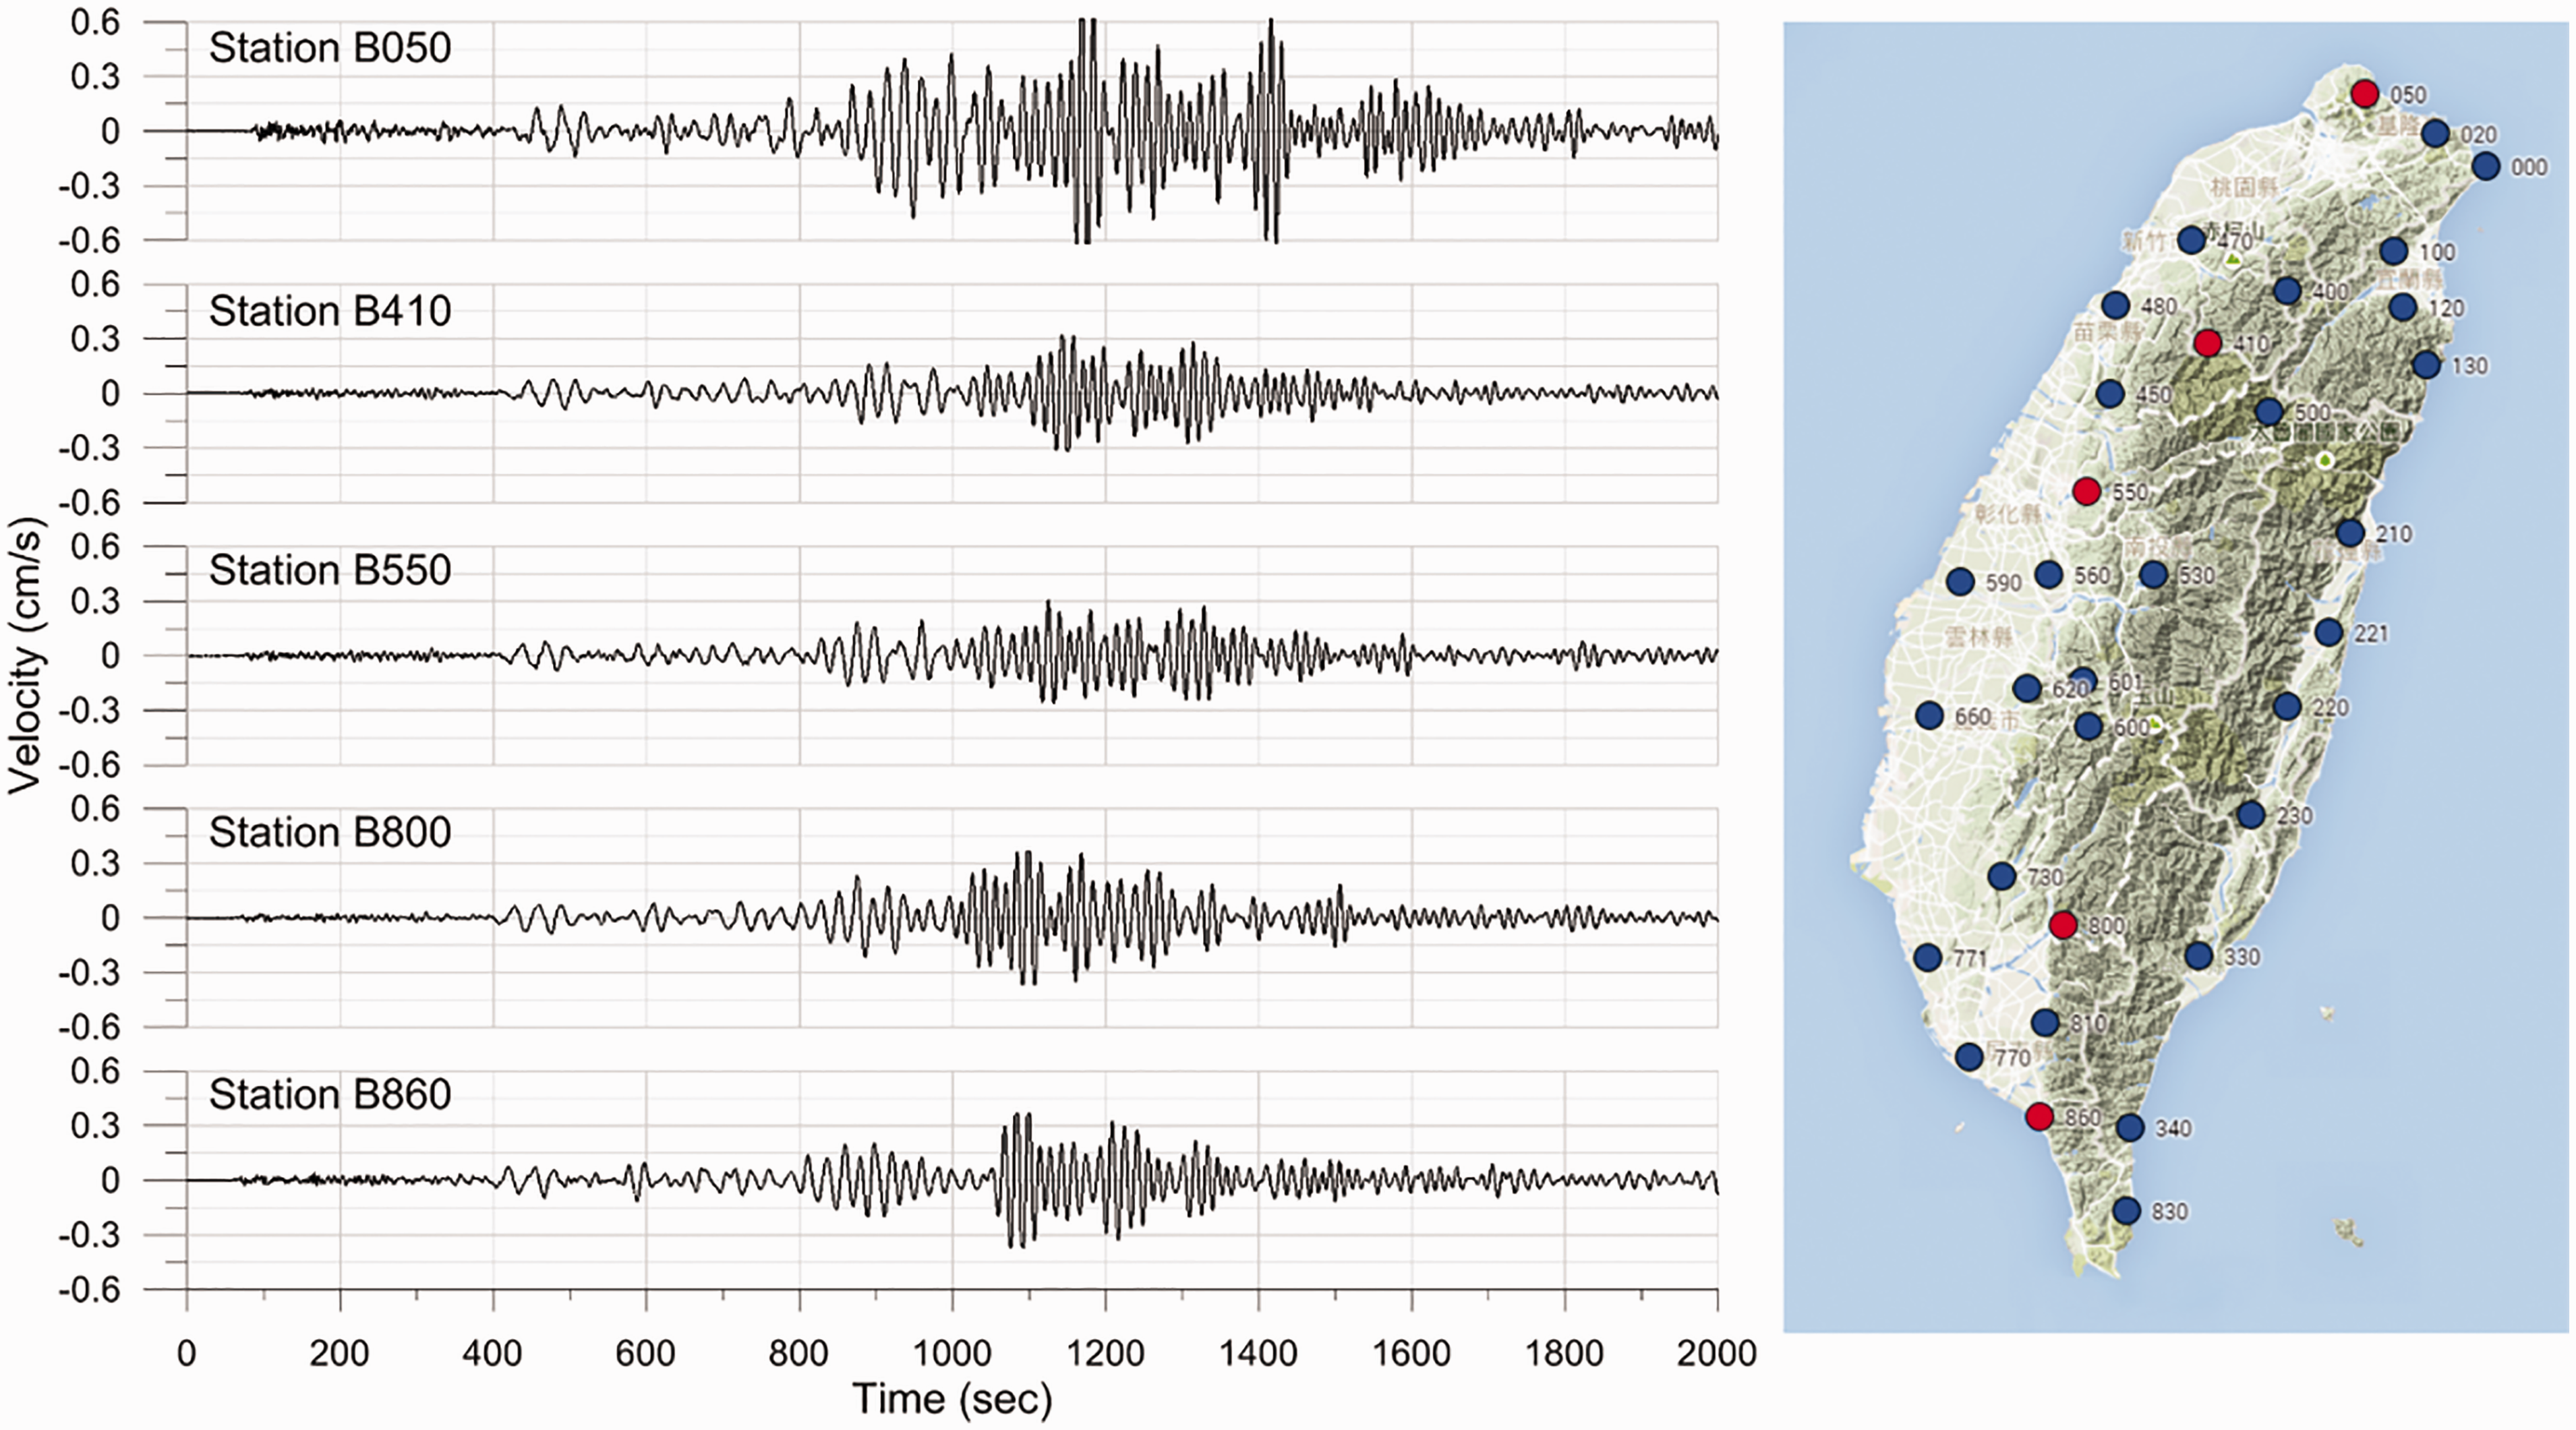
Recorded seismic waveforms from different broadband stations on 11 April 2012 (the Indian Ocean earthquake).
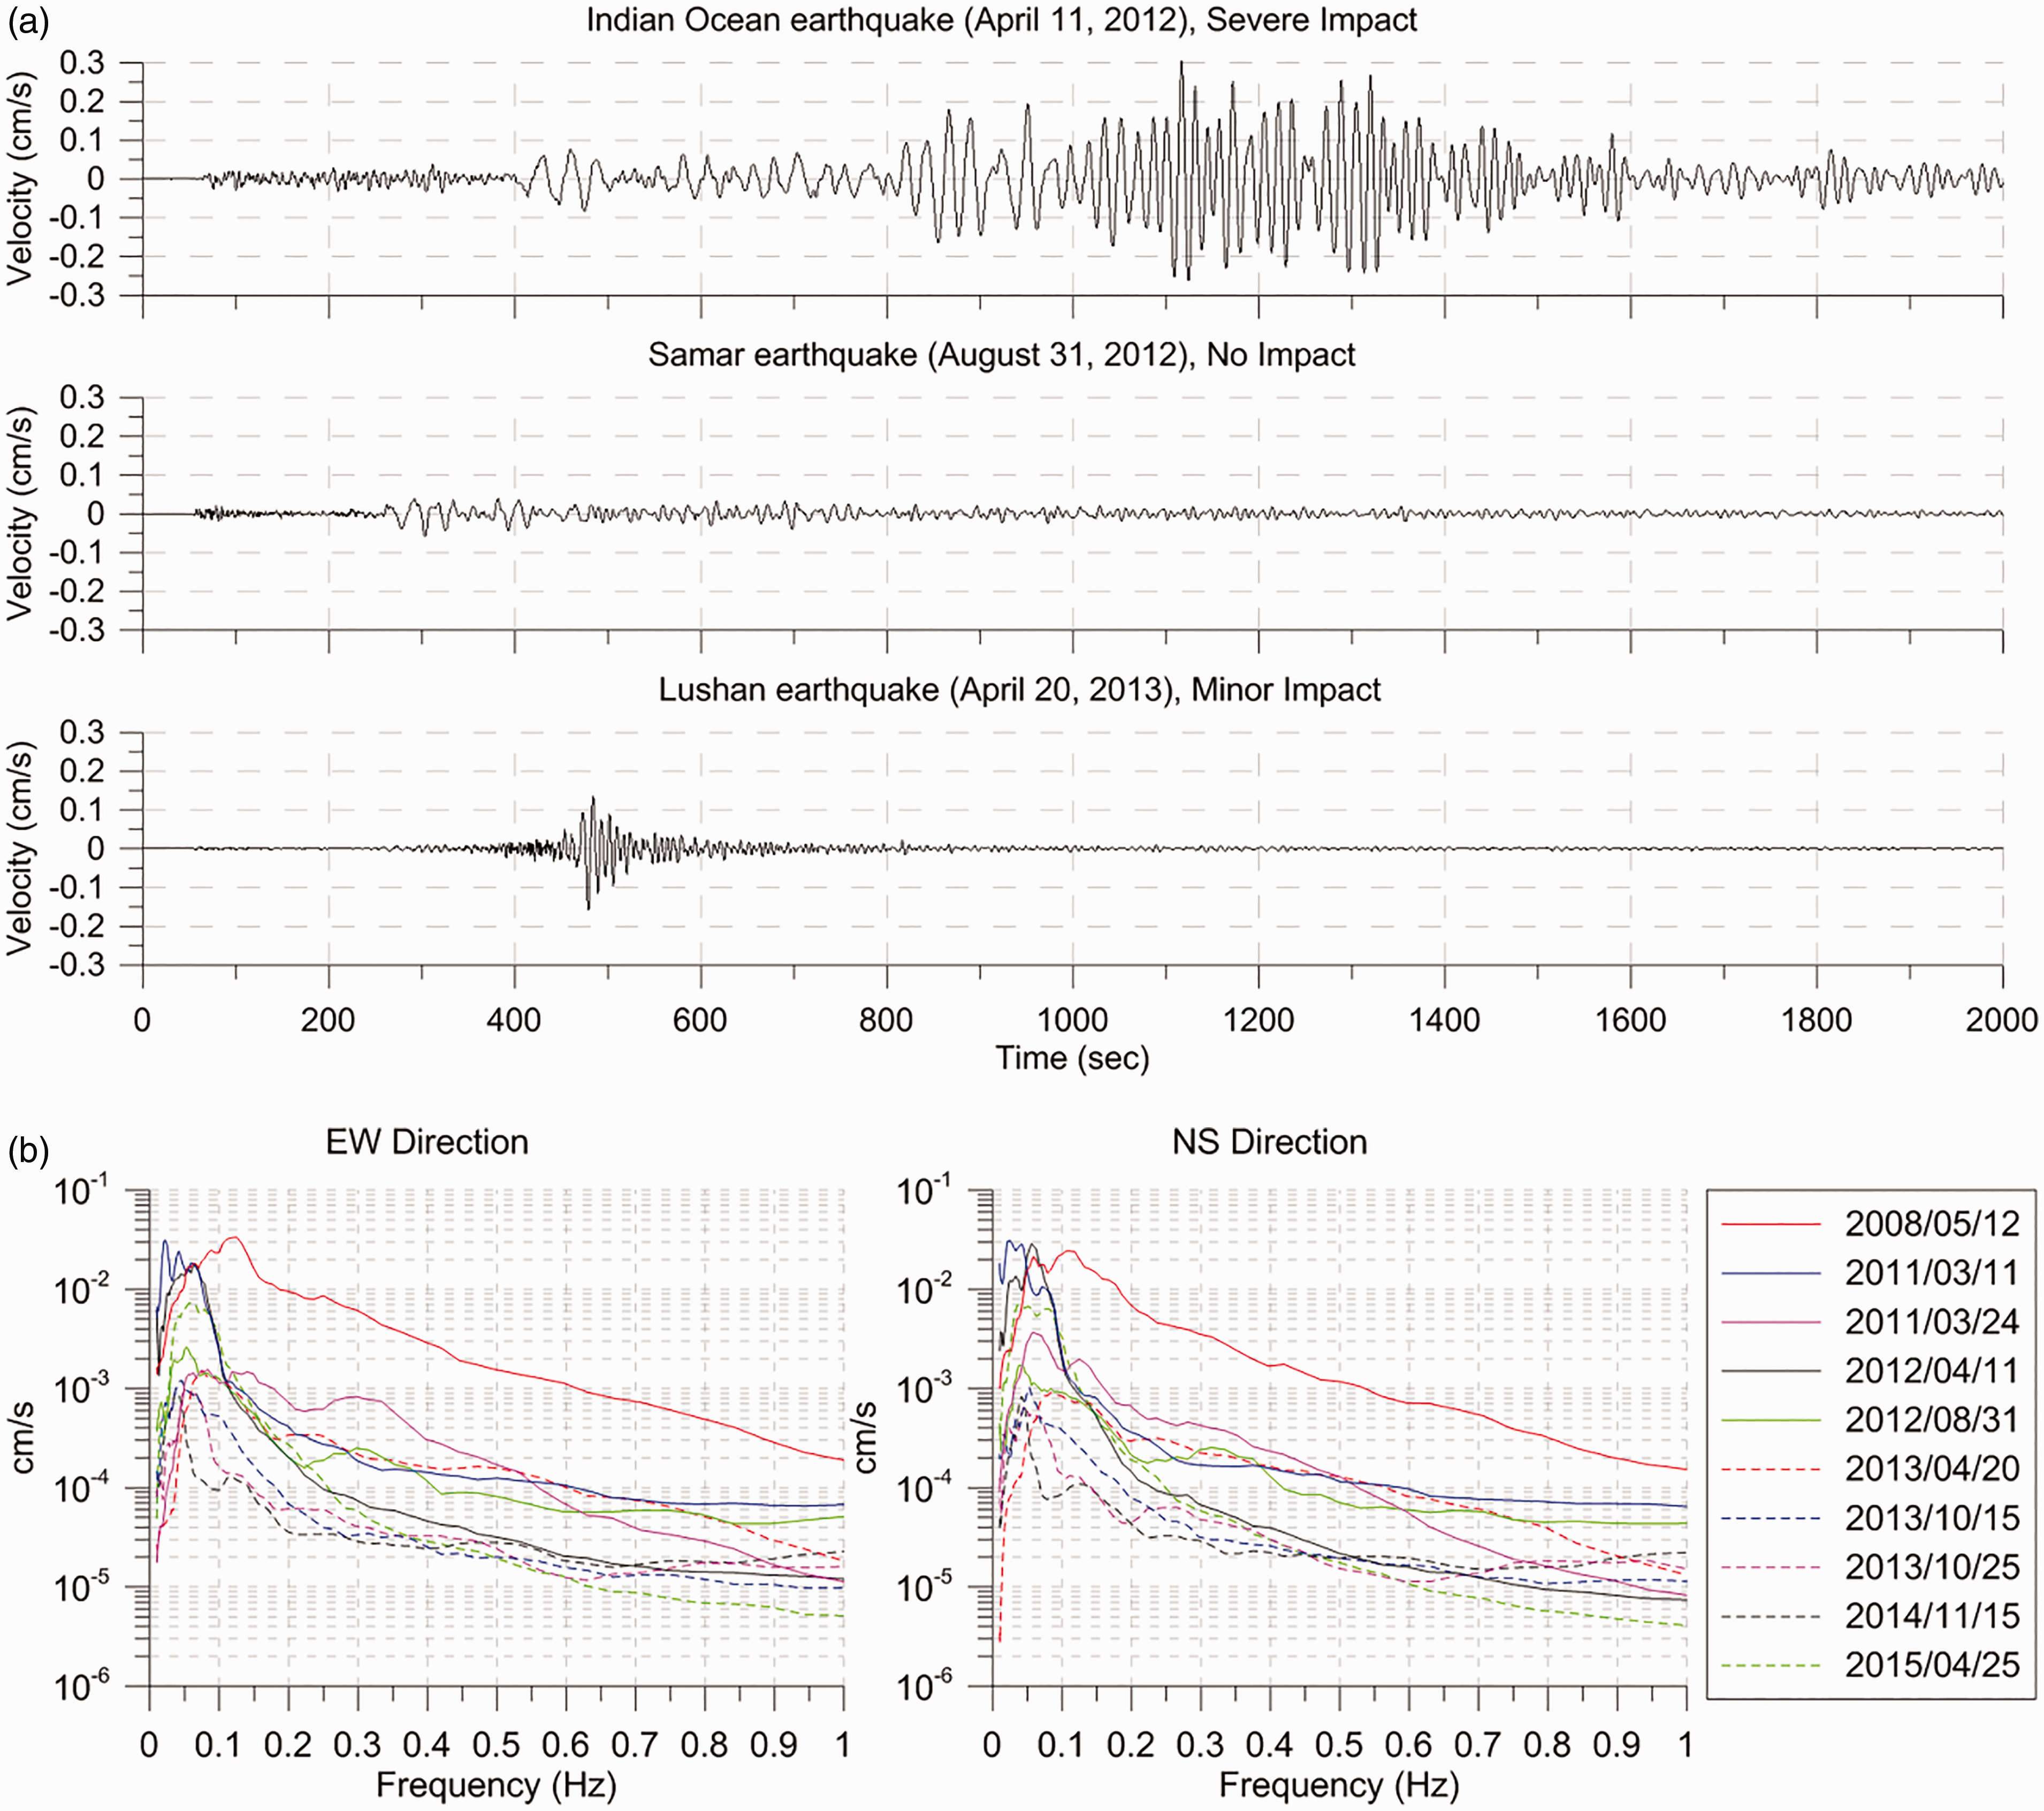
(a) Recorded seismic waveforms of different seismic events from B550 station (NCREE network) and (b) comparison on the Fourier amplitude spectrum between 10 distant earthquakes from BATS station in EW direction (left) and NS direction (right).
Vibration-sensitive equipment
The vibration (displacement)-sensitive equipment, such as wafer scanner, in high-tech fabs usually equips with isolation systems to suppress the ambient vibration. The wafer scanners, used to fabricate the nanometer-scale ICs, are vibration (displacement)-sensitive equipment with built-in vibration isolation devices called air mounts that support the lens and the metrology frame upon the base frame and the machine pedestal.
10
The tolerance of scanners to vibration is much stringent, not only on the vibration amplitude but also on the frequency range, hence the state-of-the-art wafer scanners equipped with air mounts that was designed with a natural frequency around 0.5 Hz. With the corresponding feature size reduction of ICs following the rule known as Moore’s law, the vibration control in the wafer scanners is increasingly difficult because of the accuracy levels in the nanometer scale. Based on the vibration theory, the air mounts can attenuate vibration with frequency greater than 0.7 Hz
To study the seismic response of vibration-sensitive equipment installed in the isolation system with a dominant frequency of 0.5 Hz numerically, Figure 6(a) shows the frequency response function of isolation system with natural periods of 2 s. Seismic waveforms of several distant earthquakes collected from high-tech fabs in the Central Science Park of Taiwan are used as input excitations. Figure 6(b) shows three acceleration data (in the NS direction) collected on-site at the basement of a high-tech fab from three distant earthquakes. By considering the ground motion at the basement as input excitations with spectral density function, 
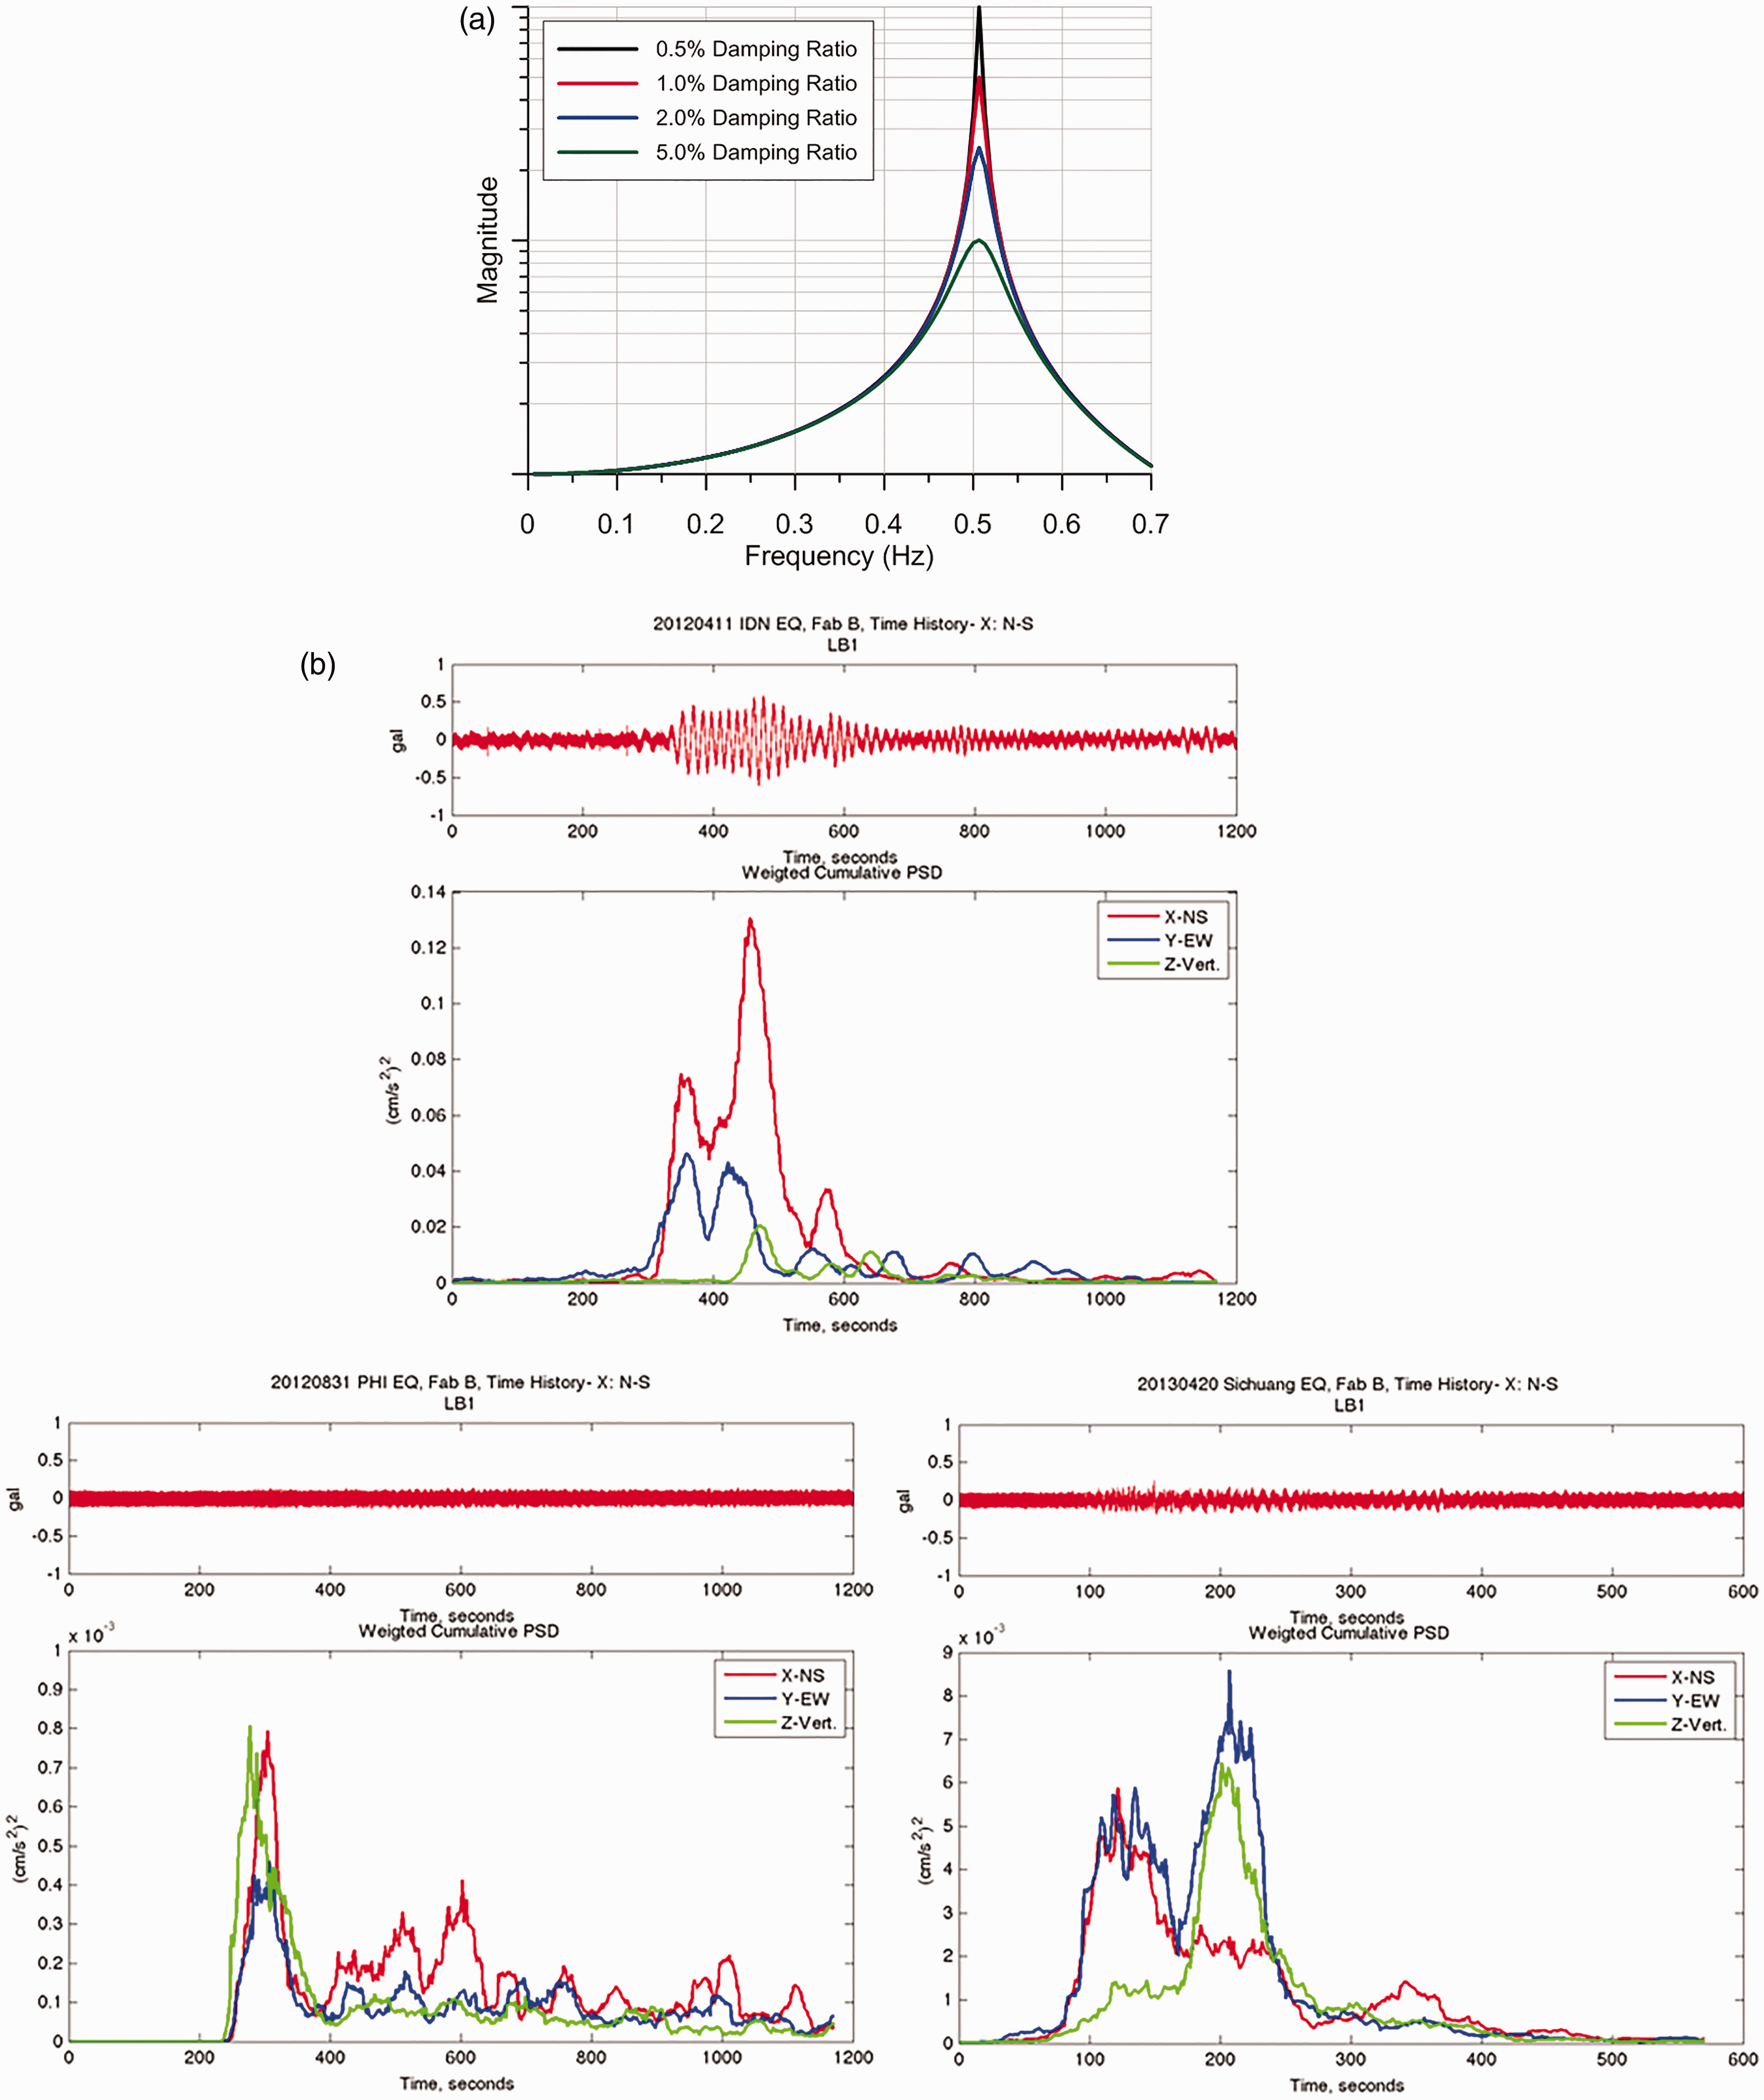
(a) The frequency response function of isolation system with natural periods of 2 s and (b) three seismic waveforms collected from the basement of a high-tech fab (above) and the time-varying variance of equipment from the excitations of three distant earthquakes (below).
Since the duration of the recorded ground motion is quite long (over 1000 s), the moving window technique is used to estimate the equipment response. A time window of 30 s is selected with a 1 s appended data length. The variance of the equipment response can be estimated as follows

The time-varying variance of vibration-sensitive equipment from the excitations of three distant earthquakes is also shown in Figure 6(b). The result demonstrates that the Indian Ocean earthquake produced a more significant response to the equipment than the other two distant earthquakes, not only because of the long-period seismic waves but also their relatively large amplitude. This is why the Indian Ocean earthquake forced many equipment to shut down without any warning.
Furthermore, considering that the vibration-sensitive equipment is not located at the ground level but on the third floor, Figure 7 shows a comparison of the Fourier amplitude spectrum of the recorded seismic waveforms between the basement and the third floor of a high-tech fab. The result shows that there was no amplification produced by the building, particularly for frequencies lower than 1.0 Hz. This indicates that these long-period seismic waves cannot be filtered out by the building’s structure. Consequently, two major factors may cause the shutdown of equipment: extremely long-period seismic waves and high vibration amplitude.
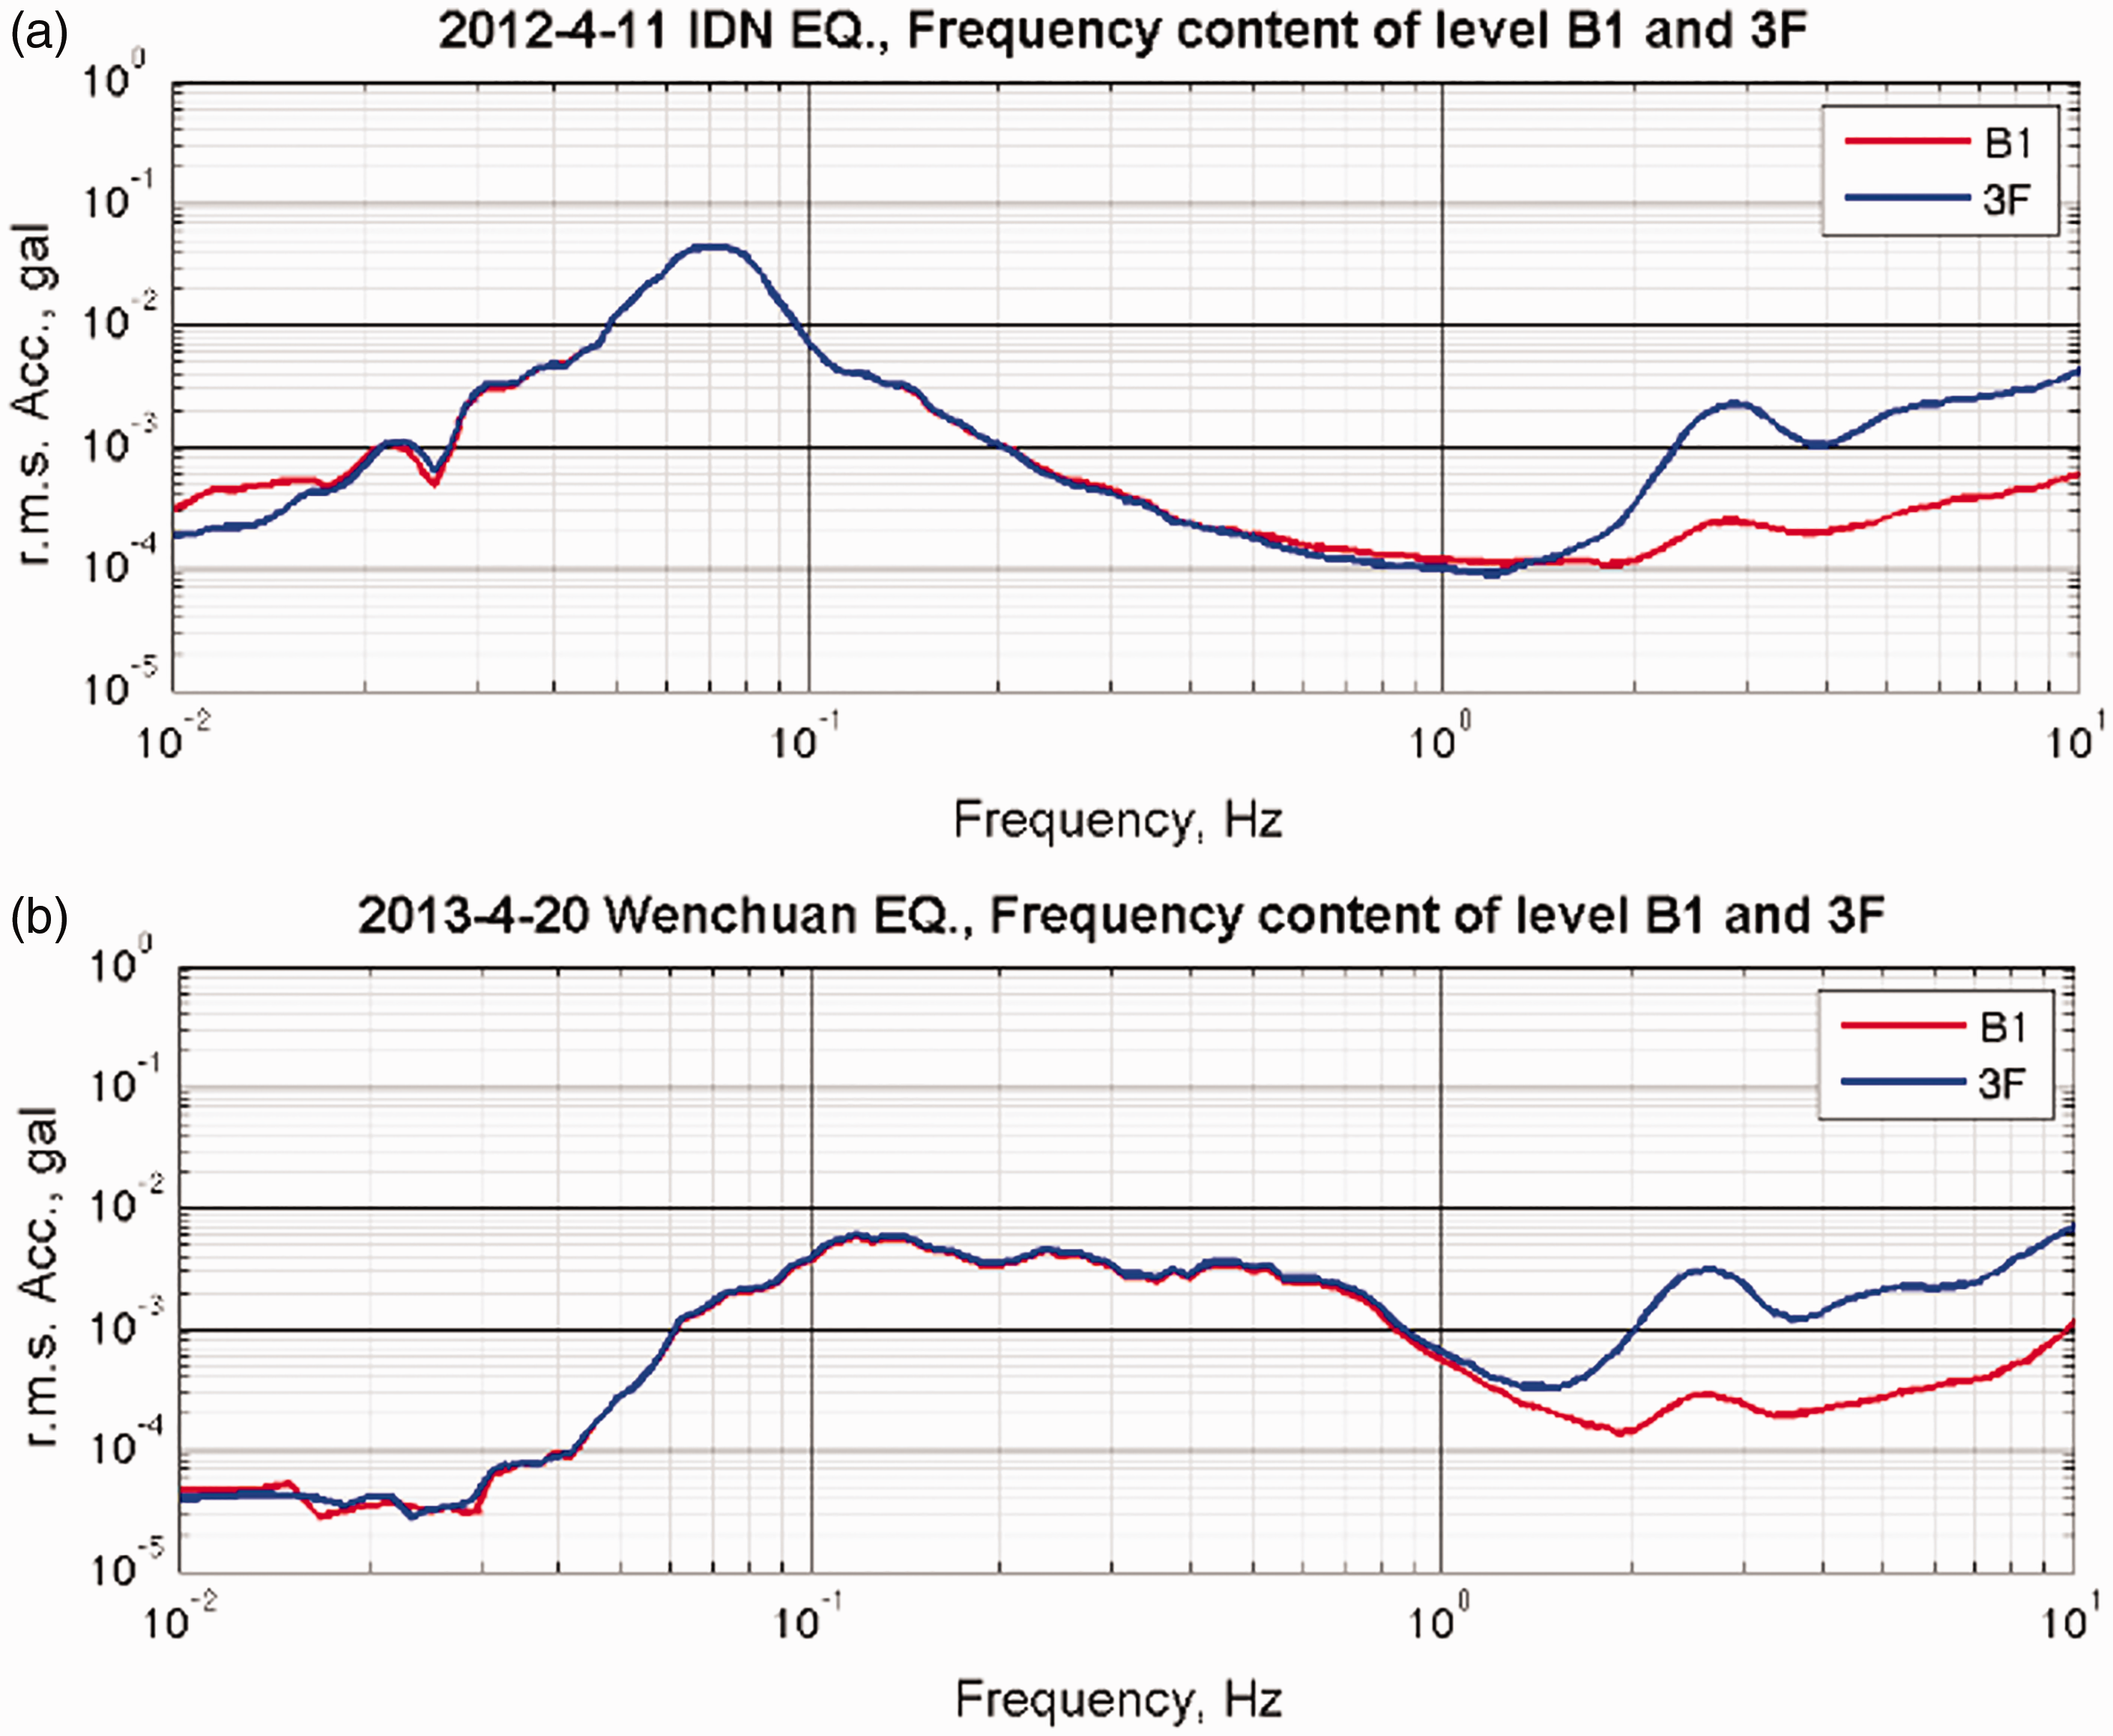
Comparison of time-varying root-mean-square acceleration response between the basement and third floor of (a) the Indian Ocean earthquake and (b) the Lushan (China) earthquake.
Signal processing and feature extraction techniques
To develop an index for early warning of the vibration-sensitive equipment after the arrival of P-waves, two major concerns need to be addressed: (a) the existence of extremely long-period seismic waves in the preevent data needs to be detected before the arrival of the main shock (S-waves) so as to have enough time to avoid the shutdown of equipment, and (b) the potential of significant large amplitude, which may have a significant impact on vibration-sensitive equipment, needs to be identified. To solve these two problems, signal processing and feature extraction techniques are used in this study to identify the ground motion characteristics. The moving window wavelet packet transform (WPT) is used to study long-period seismic waves from the preevent data recorded by the broadband seismometers.
WPT and energy entropy
WPT is able to decompose the time series in both time and frequency with an adaptive resolution; therefore, it provides an effectively diagnosing tool for the main frequency component and local information.16–18 WPT is an extension of discrete wavelet transform (DWT) where only the previous approximation is passed through the dyadic filter bank, the discrete-time low- and high-pass filters, in each level. 19 Both the details and approximations are decomposed to create the full binary tree in WPT. Hence, WPT developed from the wavelet packet is a natural extension of multiresolution analysis. 20 The resulting frequency band of each component is similar to DWT. Thus, with the use of wavelet packet analysis, the frequency resolution of the decomposed component with high-frequency content can be increased. As a result, wavelet packet analysis provides better control of frequency resolution of the decomposition of the signal.
In WPT, there are a total of 2
J
components with a bandwidth equal to FN/2
J
after J levels of decomposition and FN is the Nyquist frequency. Arranging these component functions in ascending order, the central frequency of the ith component function, Fi, can be expressed as

Note that the wavelet packet decomposition described above does not result in a WPT tree displayed in increasing frequency order because of aliasing, which exchanges the frequency ordering of some nodes of the tree. A simple swapping of the appropriate nodes results in the increasing frequency ordering referred to as the Paley ordering of the tree.
21
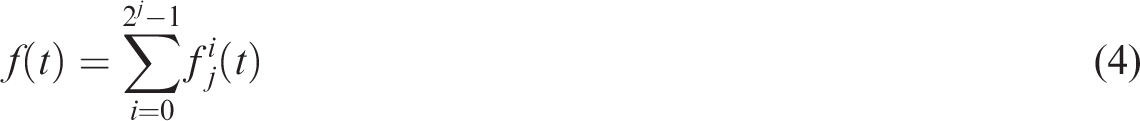
The original signal f(t) can be expressed as
The wavelet packet component signal fji(t) can be expressed by a linear combination of wavelet packet function 
The wavelet packet coefficients 
It is important to point out that the node energy representation can provide a more robust signal feature for classification than using the wavelet packet coefficients directly. Here, the wavelet packet component energy 
Physically, equation (7) illustrates that the total signal energy can be decomposed into a summation of wavelet packet component energies that correspond to different frequency bands, called a wavelet packet node energy. The feasibility of applying wavelet packet node energy to the vibration signals has been proposed and the result provides a more robust signal feature than other features. 22 This technique can be applied to the seismic data (after the arrival of P-waves) to extract the component energy of extreme long-period signals.
Identification of long-period seismic waves
To detect the existence of long-period seismic waves from distant earthquakes, the WPT approach was used. Four seismic events, including one distant earthquake without impact to the high-tech fabs, were selected to extract the long-period signal features from the recorded seismic waveforms. The moving window technique was also adopted in this study; for data from the NCREE stations the window length was 2560 points (25.6 s) and every 512 points (5.12 s) were appended, and for data from the BATS station the window length was 512 points (25.6 s) and every 112 points (5.6 s) were appended. Moreover, the biorthogonal 6.8 wavelet function was selected and the reference level of decomposition, J, in WPT was selected as 6 and 4 so that the frequency band in the first decomposed component ranged approximately from 0 to 0.781 Hz and from 0 to 0.625 Hz for NCREE and BATS stations, respectively. The wavelet packet node energy entropy was evaluated using equation (7). The energy entropy from the selected earthquakes is shown in Figure 8. It showed that the four distant earthquakes possessed a large amount of long-period component energy entropy. The results of the other two distant earthquakes of 19 April 2013 and 15 November 2014 from the NCREE station are also presented in Figure 8 for comparison. These two recorded seismic waveforms had a much smaller portion of long-period components as compared to the others and had no impact on high-tech fabs.
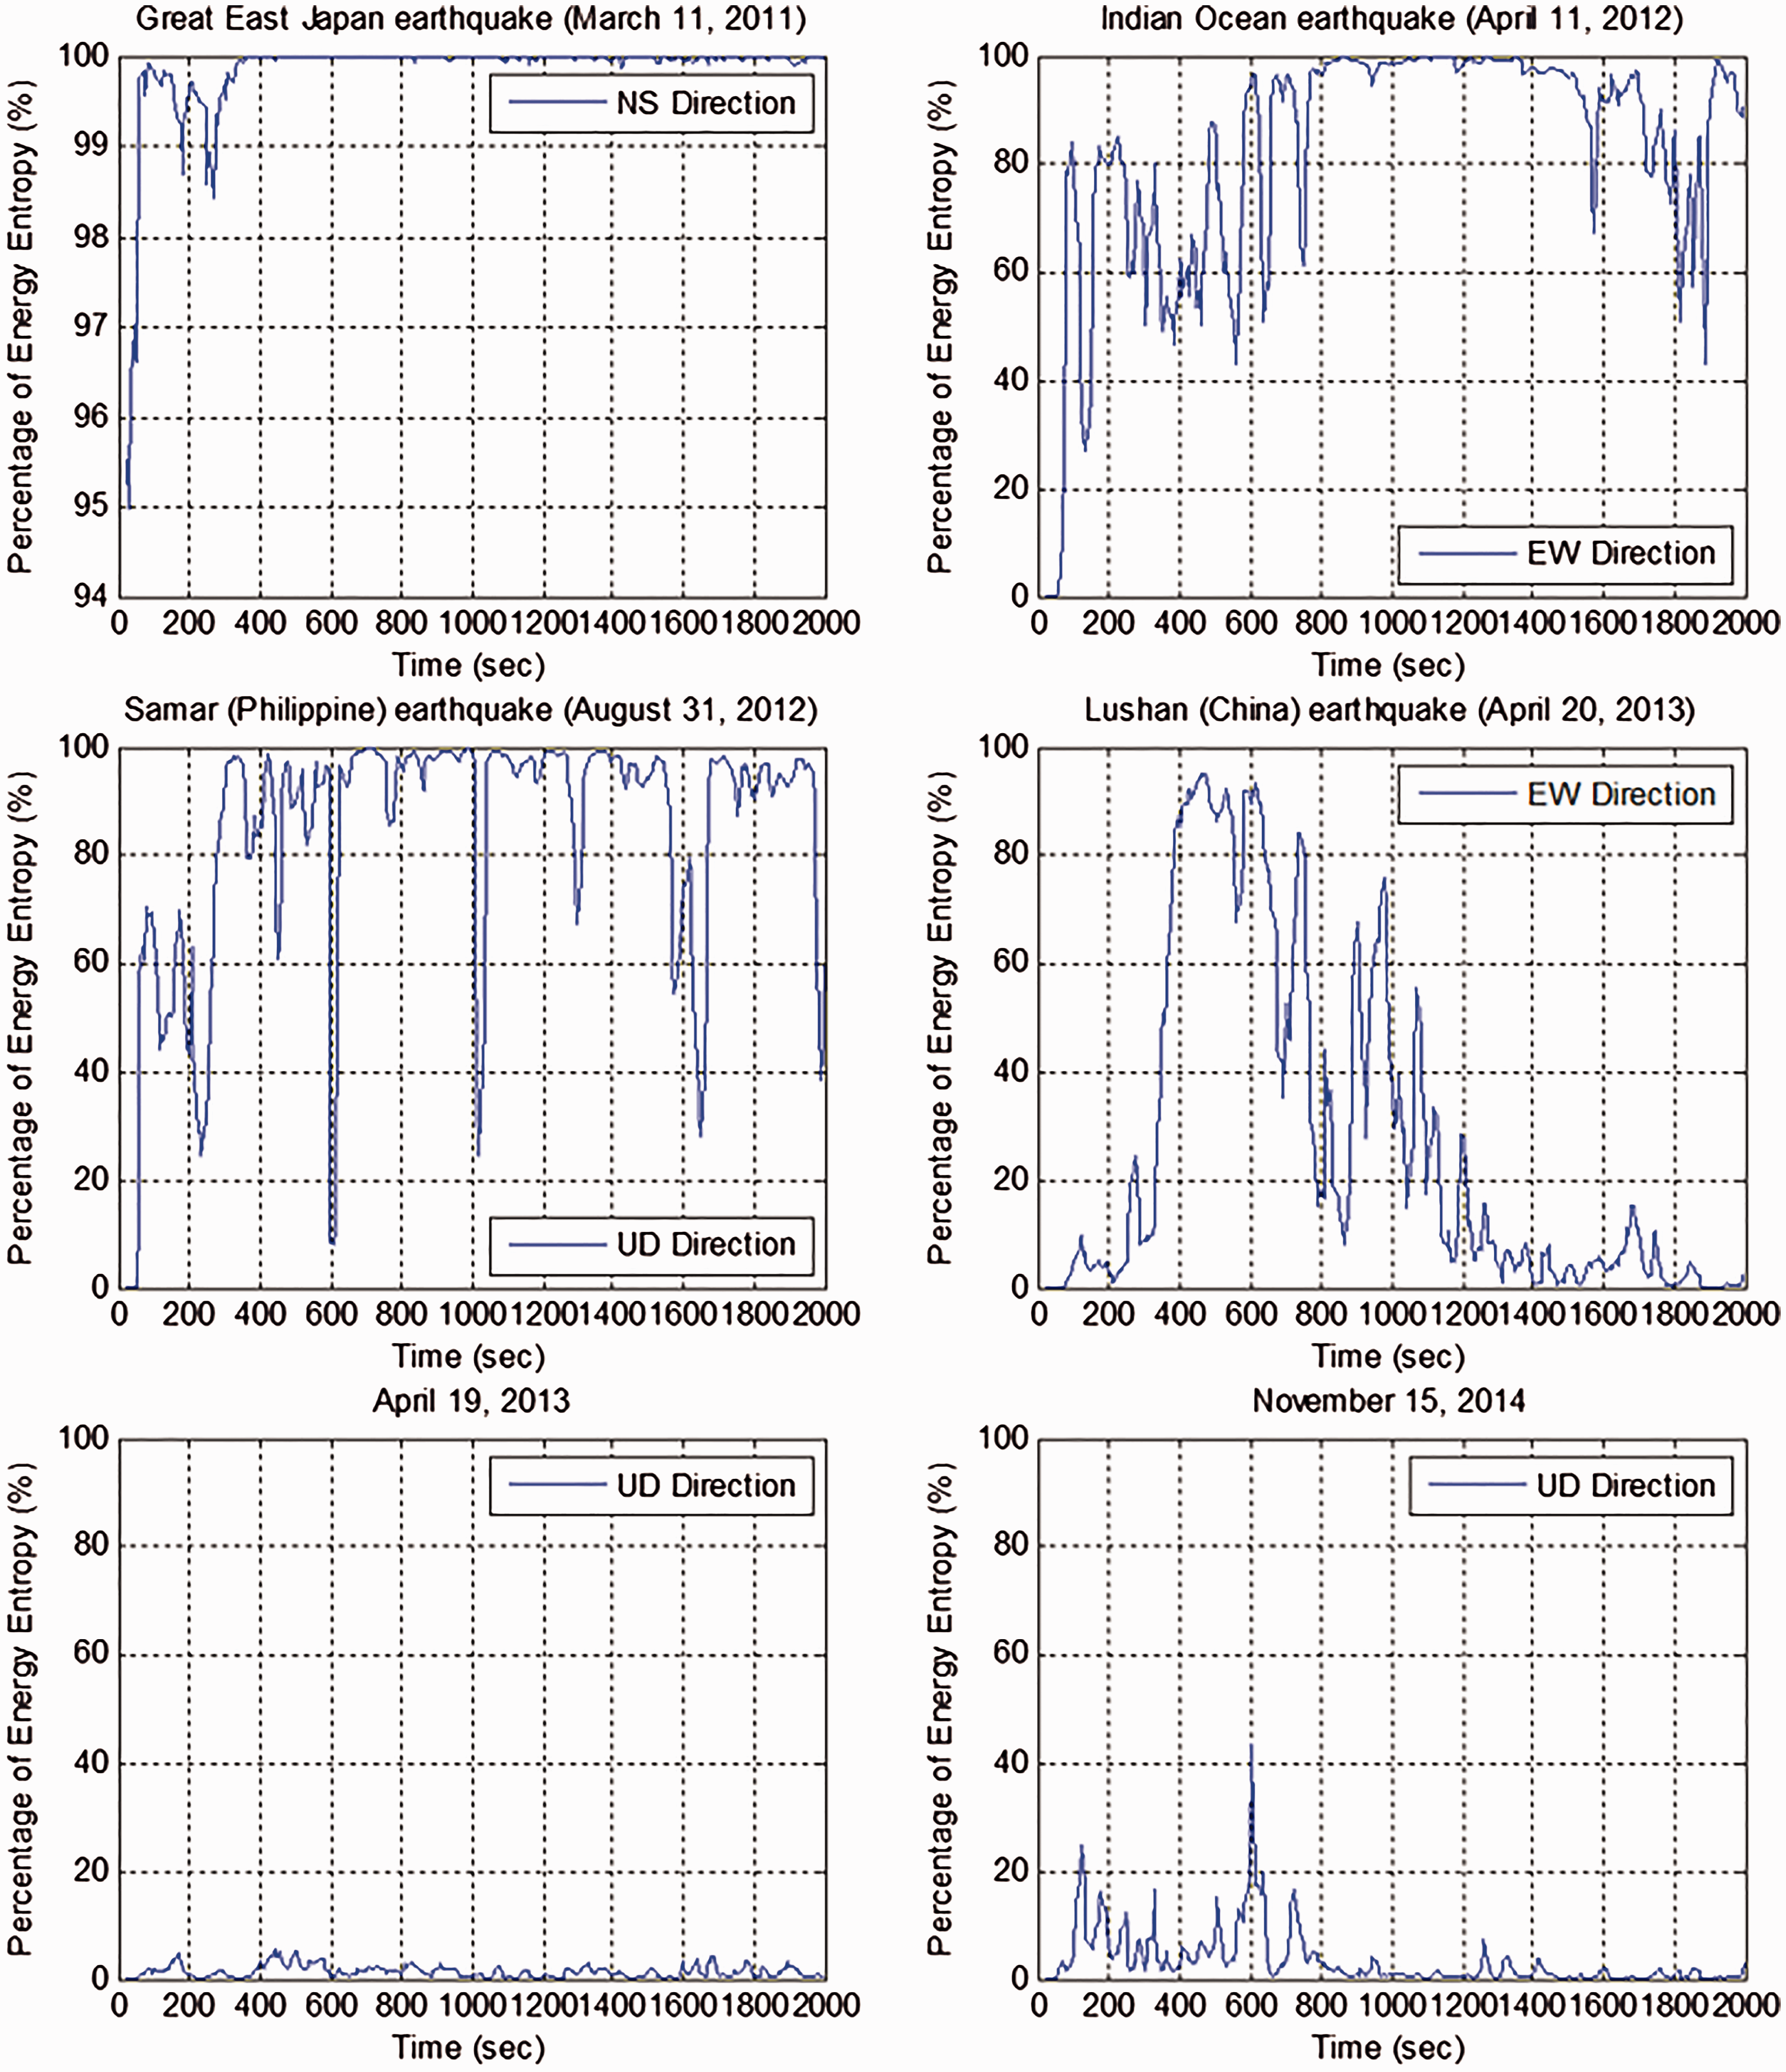
Evaluated time-varying percentage of energy entropy from six seismic events using moving window WPT.
Development of slope index for impact avoidance
Based on the discussion in the previous sections, sequential detection of the potential of significant large amplitude in the long-period seismic waves before the arrival of the S-waves is an important issue. A method to identify the sequential increase of amplitudes can be developed by evaluating the speed of vibration energy accumulation, as described below.
Arias intensity and slope index
In this study, a measure related to the strength of ground motion was used to evaluate the energy of ground motion contained in the long-period seismic waves. The Arias intensity, IA(t), is defined as23,24


Here, α is a preassigned positive value used to adjust the nonlinear mapping process. Figure 9 shows the relationship between I(t) and m(t) for a particular α-value. It maps the m(t) to I(t) with a range between 0.0 and 1.0. Clearly, the change of the slope of the Arias intensity, m(t), between 0.01 and 0.1 is more obvious on the slope index, I(t), if α is 10 rather than α is 1. Besides, through numerical study, the slope index did not change much for signal with dominant frequency less than 1.0 Hz (for a specific amplitude). The result indicated that the proposed index does not change much with respect to time for a frequency range less than 1.0 Hz. Therefore, it can provide useful information for observing the trend of time-dependent amplitude of long-period seismic waves. The α value used in this study for different earthquake monitoring systems is shown in Table 4.
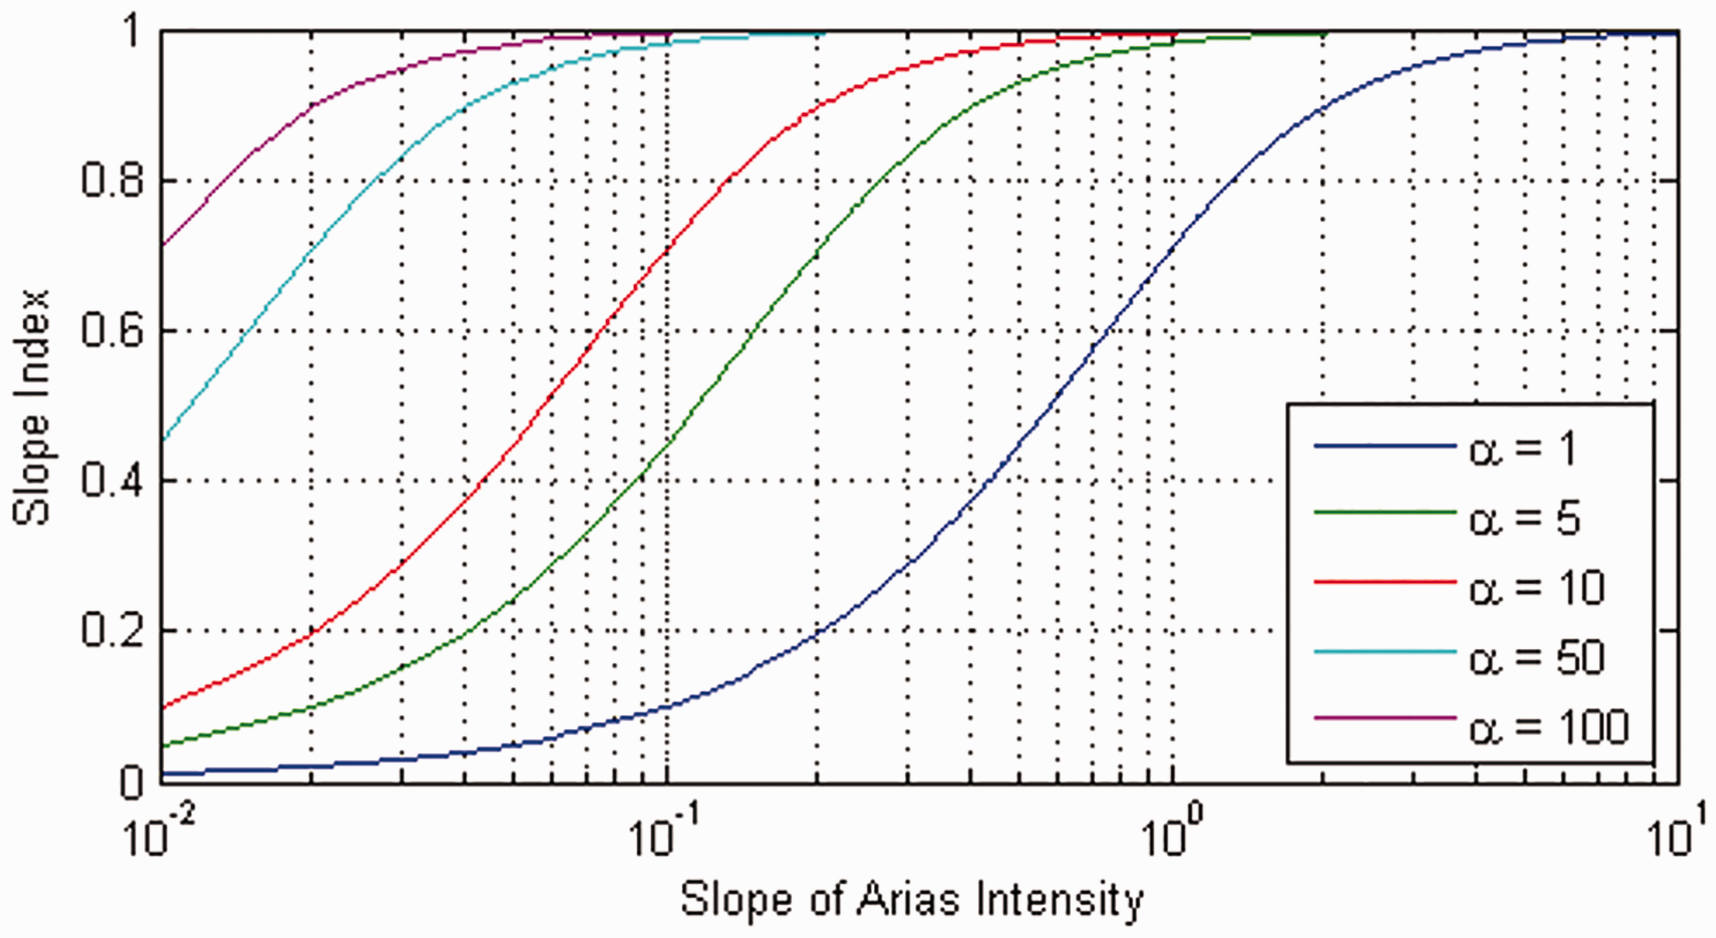
Comparison of different α values for the nonlinear mapping process.
Different α values used for different earthquake monitoring systems and approaches in Taiwan.

BATS: Broadband Array in Taiwan for Seismology; NCREE: National Center for Research on Earthquake Engineering; SSA: singular spectrum analysis.
Cardinal direction and principal direction of seismic waves
To compare the result of using cardinal direction and principal direction, the calculated slope index using different directions from recorded seismic waveforms is shown in Figure 10. During the Indian Ocean earthquake, the slope index in the direction of the epicenter was slightly larger before 600 s because the major principal component was contributed by P-waves. Then, the slope index in the perpendicular direction of the epicenter increased dramatically, representing the fast energy accumulation, and the response of isolation systems was amplified to bring the impact to the equipment. However, in in the Great East Japan earthquake, the slope index in the direction of the epicenter jumped significantly before 400 s, meaning the impact can also be produced by P-waves. Hence, performing detection in a particular direction is unsound.
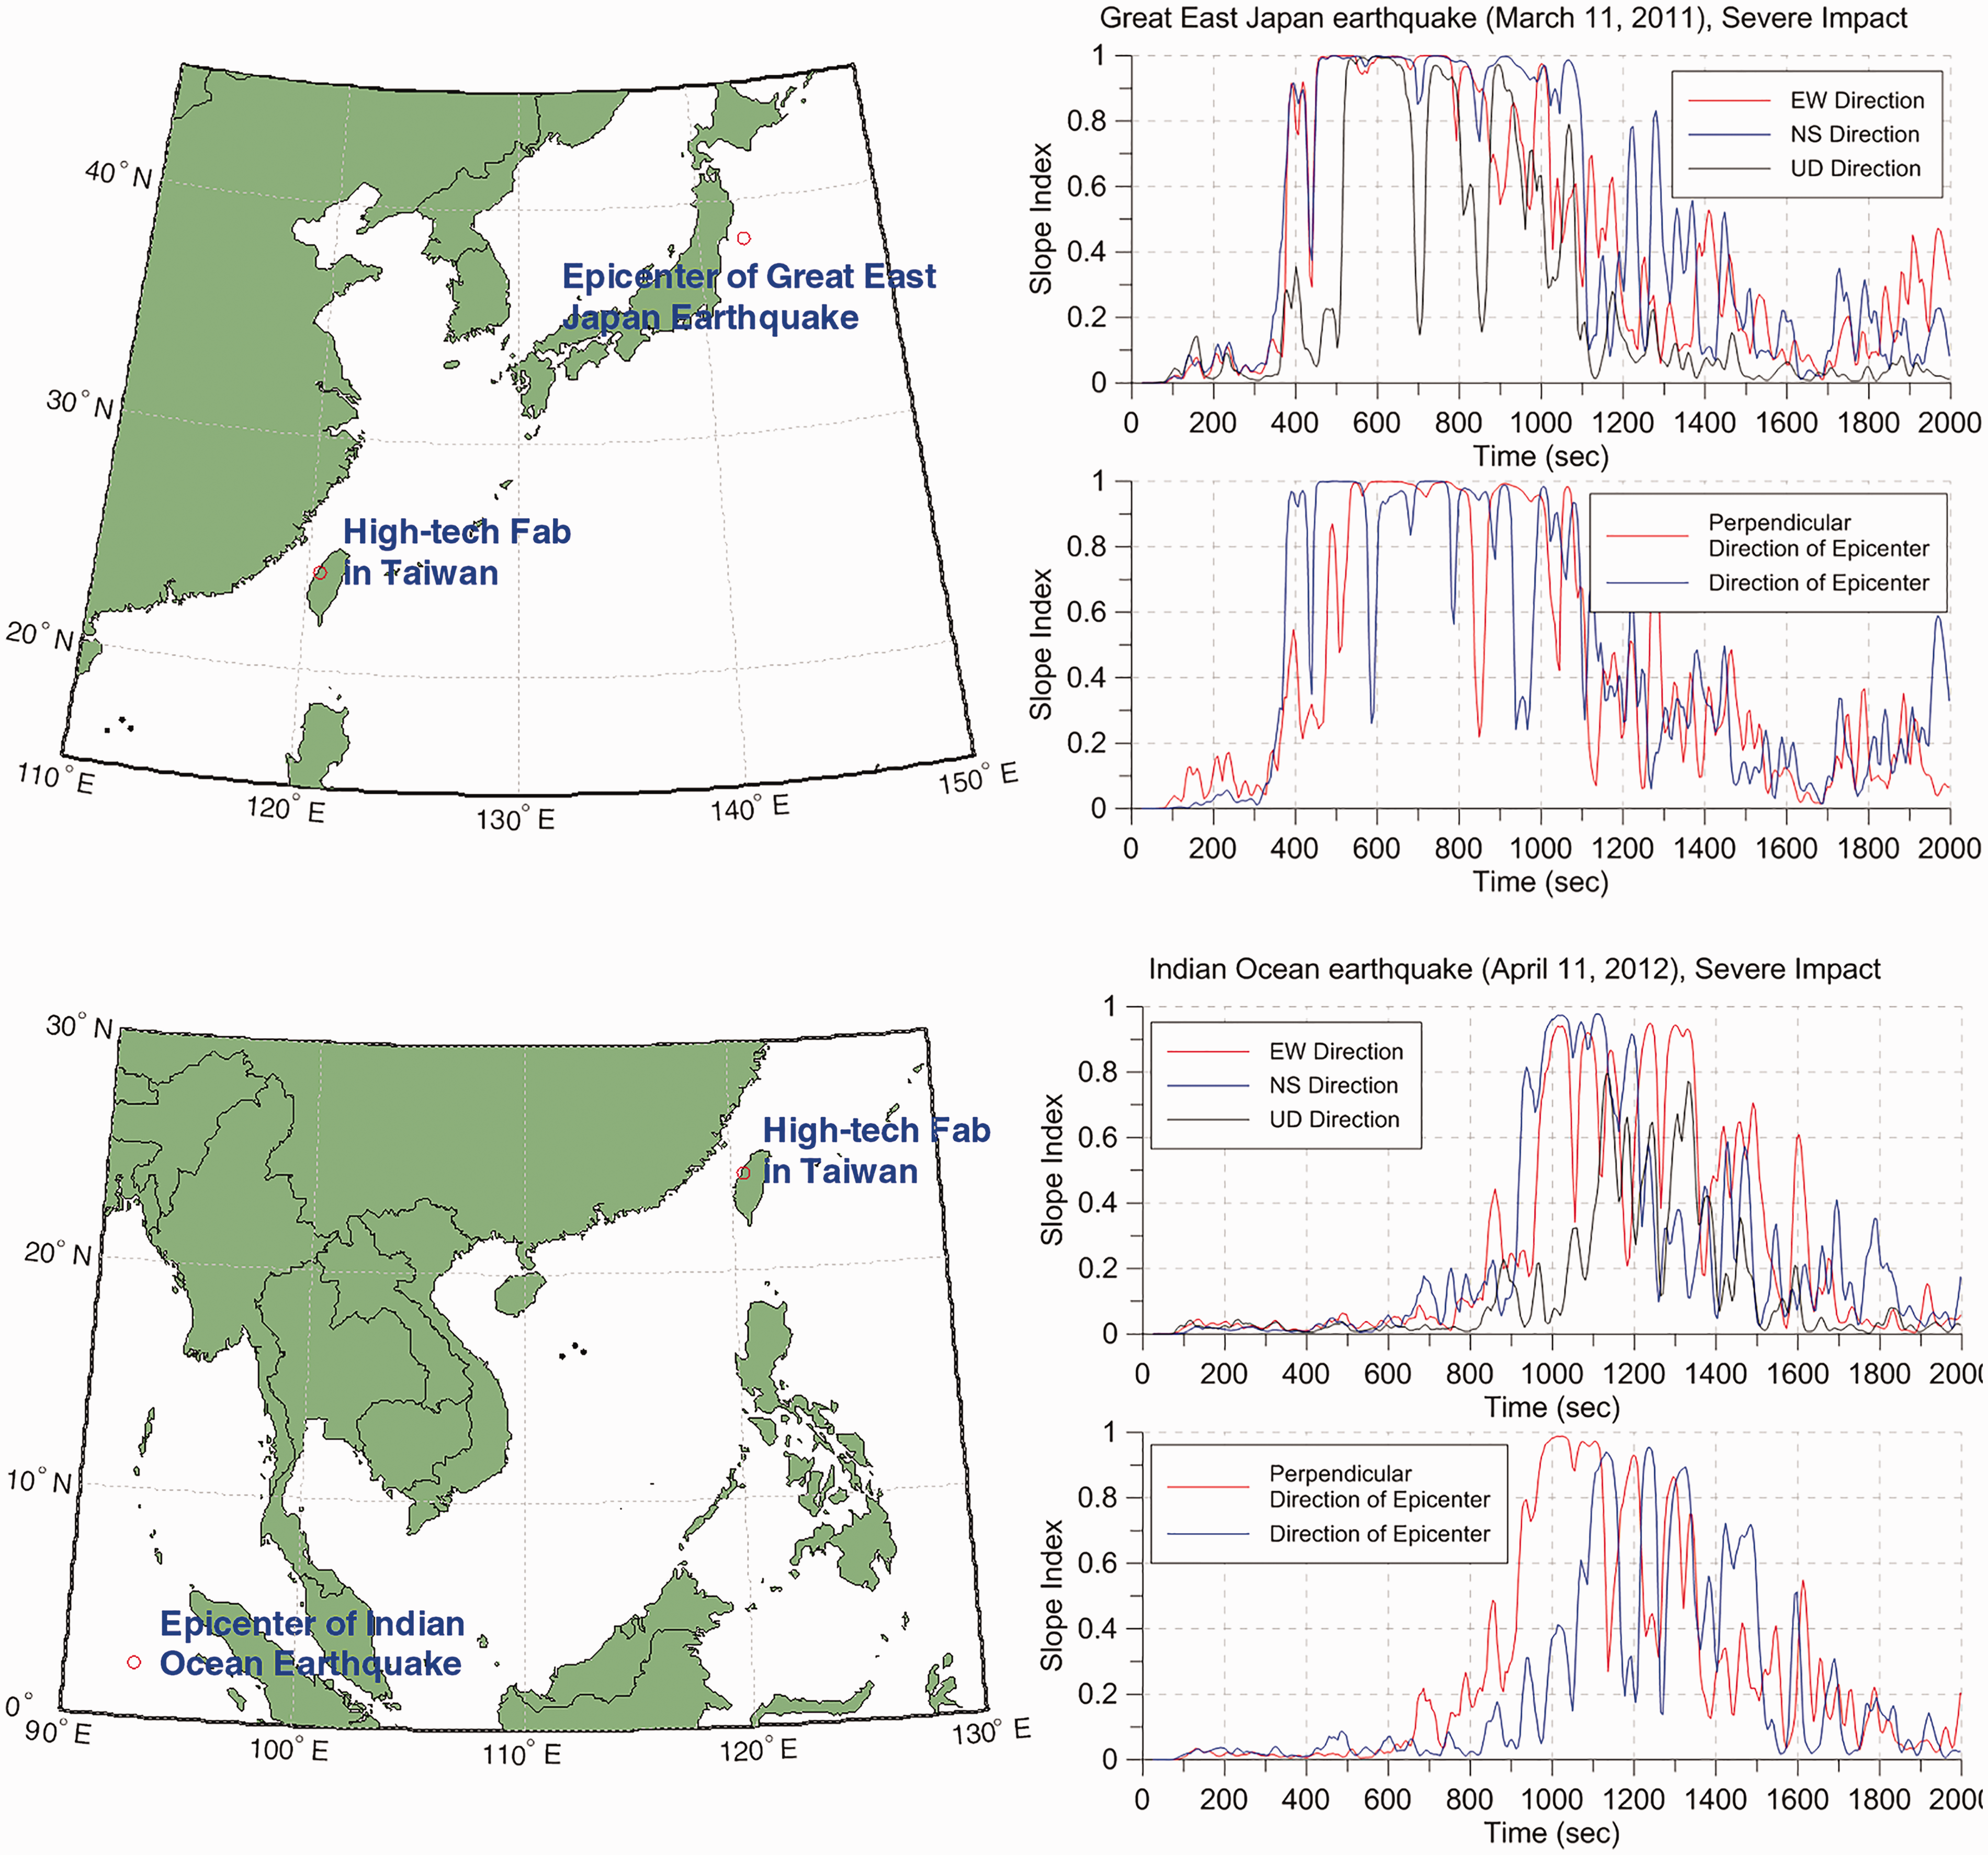
Location of distant earthquakes and calculated slope index from different directions.
Although monitoring the normal or perpendicular direction of the epicenter has shown the ability to issue an alarm regardless of the impact from P-waves or S-waves, the identification of principal component using multi-variate singular spectrum analysis (M-SSA) needed large computational effort and takes a lot of computation time. The result shown in Figure 10 displays that there was no significant delay using cardinal direction or principal direction. For example, the time delay between monitoring the NS direction and the direction of epicenter was only 11.2 s during the Great East Japan earthquake and the time delay between monitoring the EW direction and the perpendicular direction of epicenter was 20.5 s during Indian Ocean earthquake. Considering the window length and the computation time, the recorded seismic waveforms in the cardinal direction were directly used to detect the large amplitude without preprocessing from M-SSA.
Slope index calculated from the wavelet approach
The approach using wavelet packet node entropy was shown to be capable of detecting long-period seismic waves. Therefore, in the wavelet approach, the Arias intensity and slope index were calculated only using the first decomposed component to ensure that the significantly large amplitude can be identified in the long-period component. First, the 17 seismic waveforms from the B550 station (NCREE network) were used to calculate the Arias intensity and slope index. Again, the moving window technique was used. The window length was 25.6 s and was appended every 5.12 s. Keeping in view that the sampling rate of records is 100 Hz and the critical frequency of isolation systems is 0.5 Hz, the decomposition level in WPT was selected as 6 so that the frequency band in first decomposed component was lower than 0.781 Hz. The phenomenon of increasing slope index was observed once again for 11 April 2012, 20 April 2013, 25 April 2015, and 30 May 2015 seismic events. These four distant earthquakes had different impacts on high-tech fabs, as shown in Figure 11(a) and Table 1, while the other 13 distant earthquakes had no impact. The three (of 13) distant earthquakes, namely 31 August 2012, 7 December 2012, and 15 April 2016, had relatively large slope index with a maximum value near 0.04; however, the slope index of 11 April 2012 seismic event easily exceeded 0.04 after 100 s and increased sharply after 800 s. This observation is also consistent with damage survey of high-tech fabs.
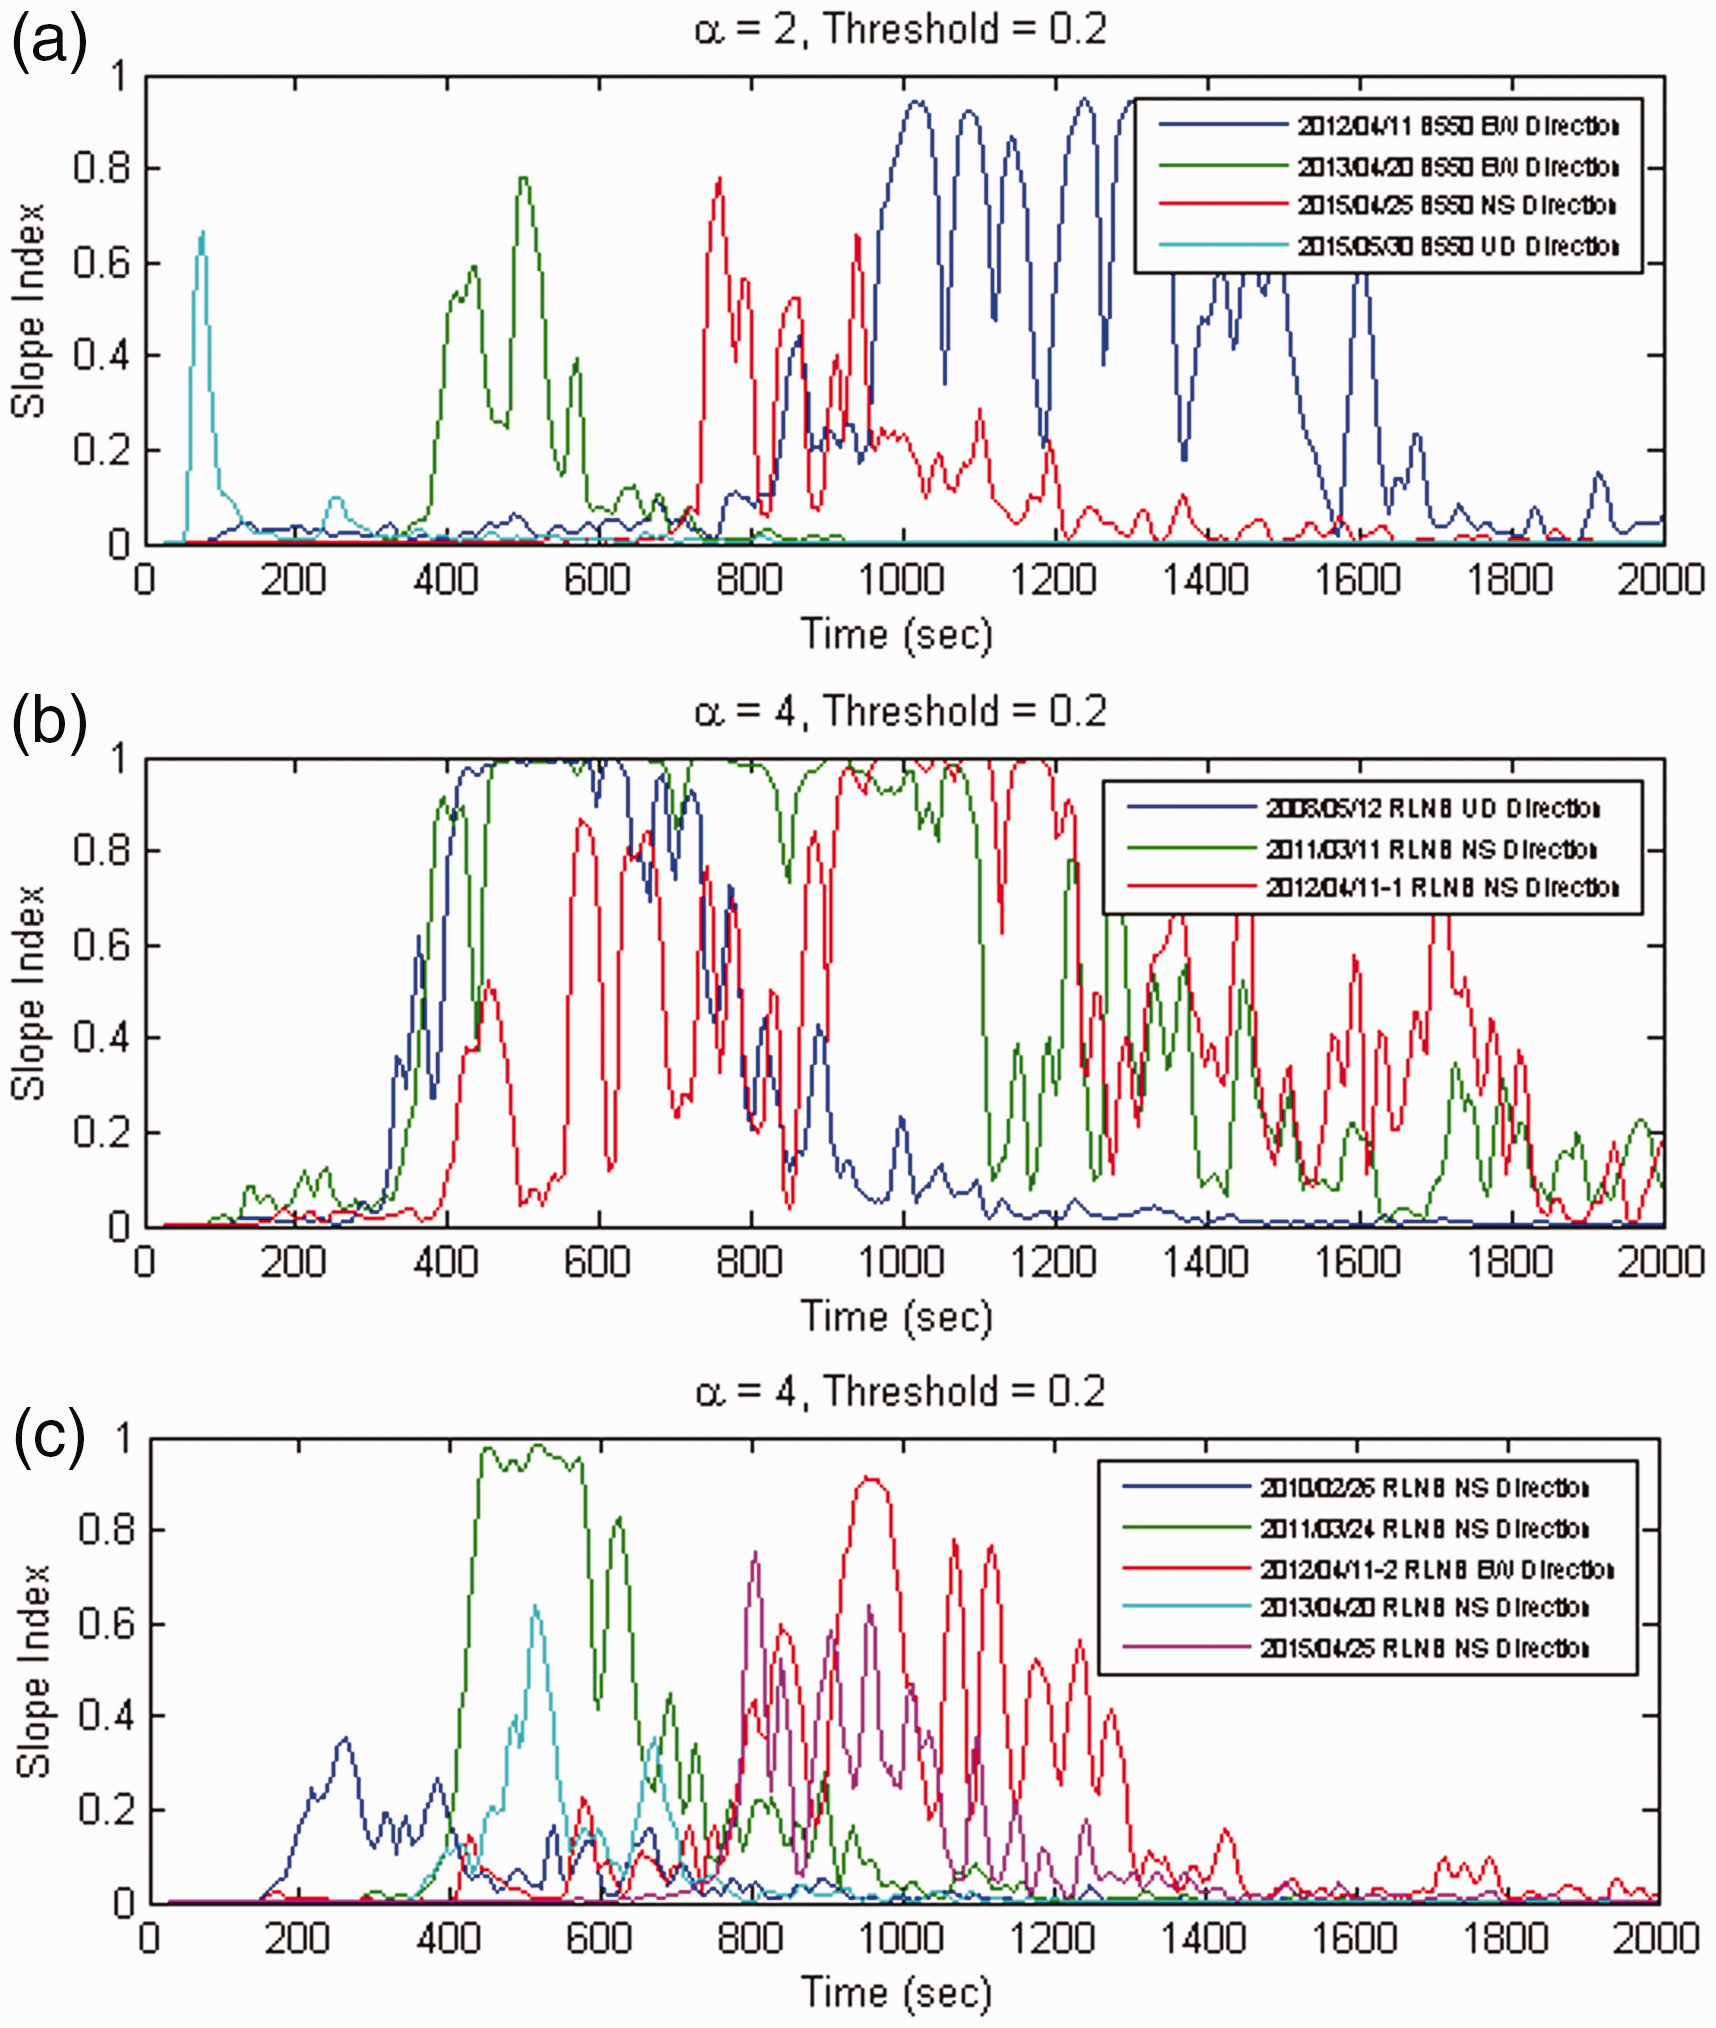
Calculated slope index through wavelet analysis using the recorded eight seismic waveforms; (a) from B550 station (NCREE network) and (b) and (c) from RLNB station (BATS).
A similar approach was also applied to the data collected from the RLNB station (BATS). Only 35 seismic waveforms were applied in this study because the station missed 13 April 2016 and 15 April 2016 seismic events. Considering that the sampling rate of records is five times smaller than that of the data from the NCREE stations, the reference level of decomposition in WPT was selected as 4 so that the frequency band in the first decomposed component was approximated between 0 and 0.625 Hz. Figure 11(b) and (c) shows the calculated slope index. It can be seen that a total of eight distant earthquakes had the slope index larger than 0.2. Most of these distant earthquakes had caused different levels of damage in high-tech fabs. Among them, 12 May 2008, 11 March 2011, and (first) 11 April 2012 seismic events showed large slope index with a significantly long duration. On the other hand, 24 March 2011, 20 April 2013, and 25 April 2015 seismic events had smaller slope index with a corresponding short duration. The second seismic event on 11 April 2012 happened just 2 h after the first seismic event. Therefore, it consequently produced no impact because most equipment in high-tech fabs had not recovered from the first impact generated at 8:38 PM. The impact of 26 February 2010 seismic event was not clearly documented because of the initial ignorance about the relationship between the impact on high-tech fabs and the distant earthquakes.
To prove that the proposed index can be used as an early warning index to turn off the vibration-sensitive equipment, ground motion data from the Nepal earthquake (25 April 2015) at the basement of a high-tech fab were collected for testing and plotted as shown in Figure 12. The recorded maximum velocity amplitude was 0.5 cm/s. Based on the damage report from the high-tech fab, the equipment was shut down at the time when the S-waves arrived at about 700 s (the thick dotted line in Figure 12 indicates the time the equipment shut down). Based on the proposed slope index, a significant value of the index is observed at 700 s. Figure 12 also shows plots of the calculated slope index using two different α values (100 and 500, respectively). It was observed that, with a carefully selected threshold of the slope index, such as 0.2 (α = 500), an early warning message can be issued at 600 s. Therefore, it is possible to provide enough time (100 s) for an early warning to be issued before the significant amplitude of the S-waves arrives.
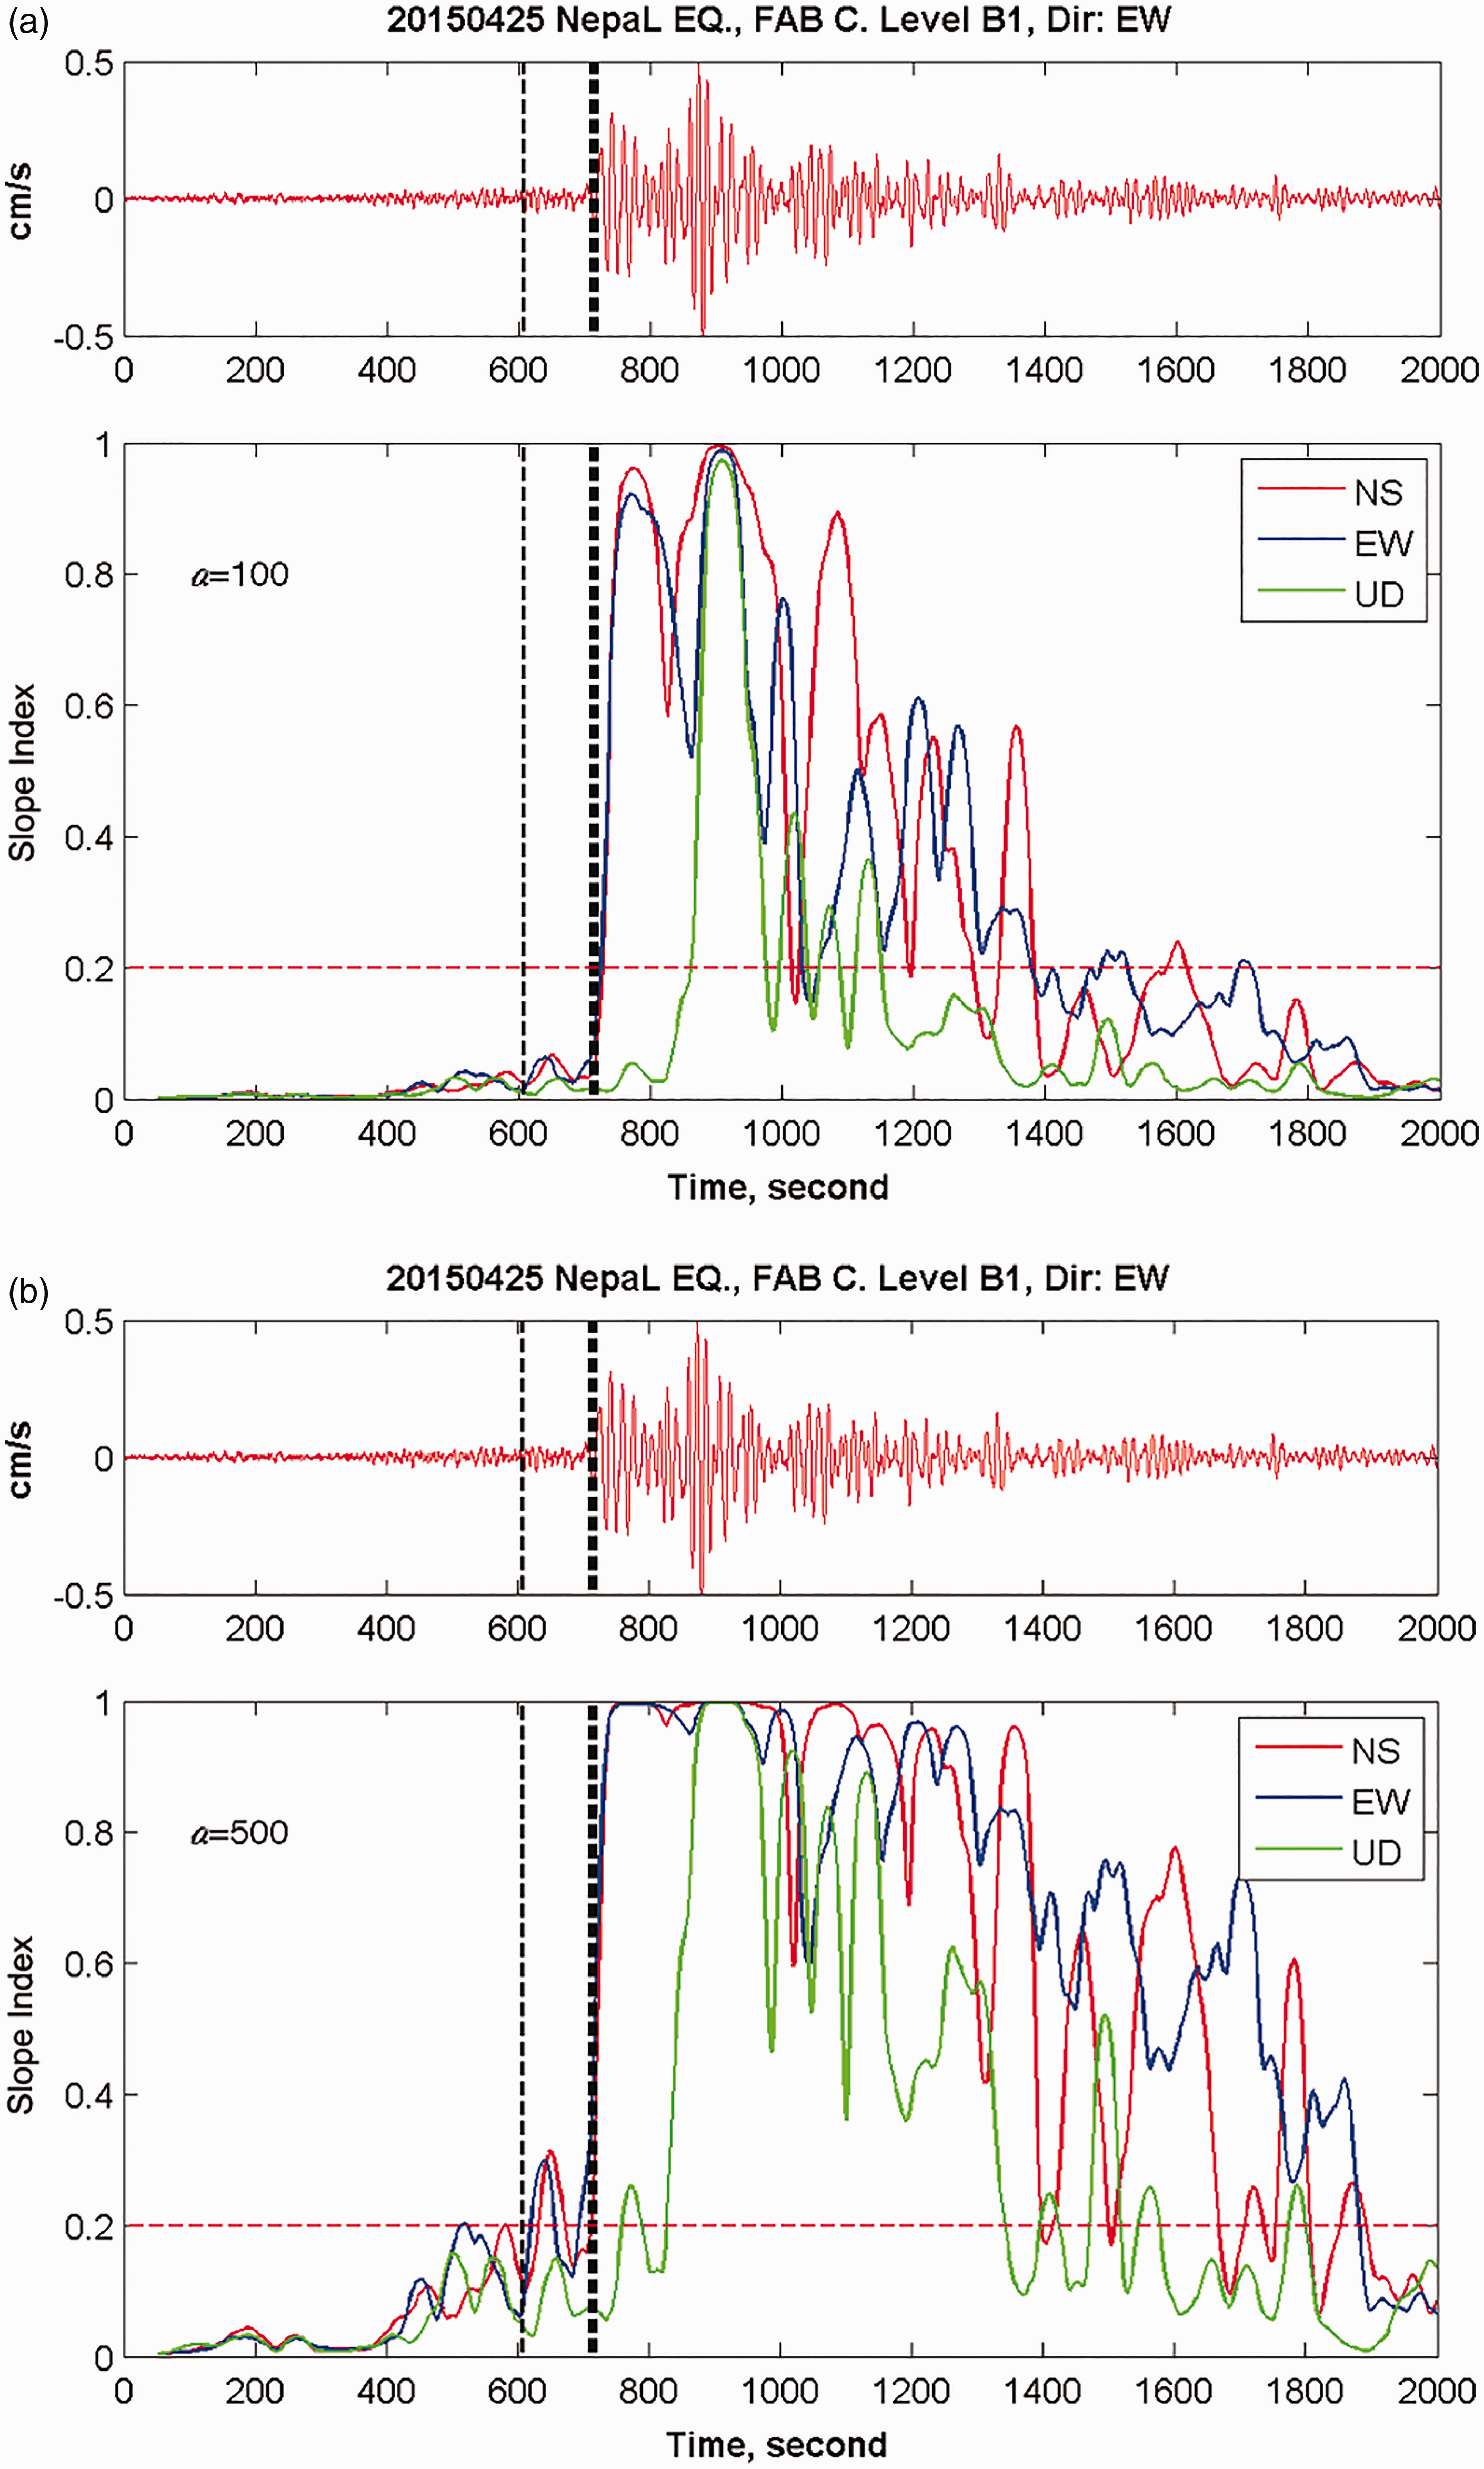
Recorded seismic waveforms and calculated slope index of Nepal earthquake (25 April 2015) with (a) α = 100, (b) α = 500.
To further prove the applicability of the proposed slope index as an early warning index for the vibration-sensitive equipment, the recorded seismic waveforms at B550 station (NCREE network) were also analyzed using the wavelet approach. Figure 13 shows the percentage of energy entropy and slope index of 11 April 2012 seismic event. The energy entropy sharply jumped after around 75 s and further increased (over 95 percentages) after around 800 s. The slope index also illustrated that the energy accumulation of the earthquake slightly increased at around 75 s and was significant after around 800 s, which is the highly likely start point of S-waves. This observation shows that the percentage of energy entropy and slope index in the wavelet approach can be used as the features to detect low frequency content and the significant amplitude of long-period seismic waves before the arrival of the main shock (S-waves).
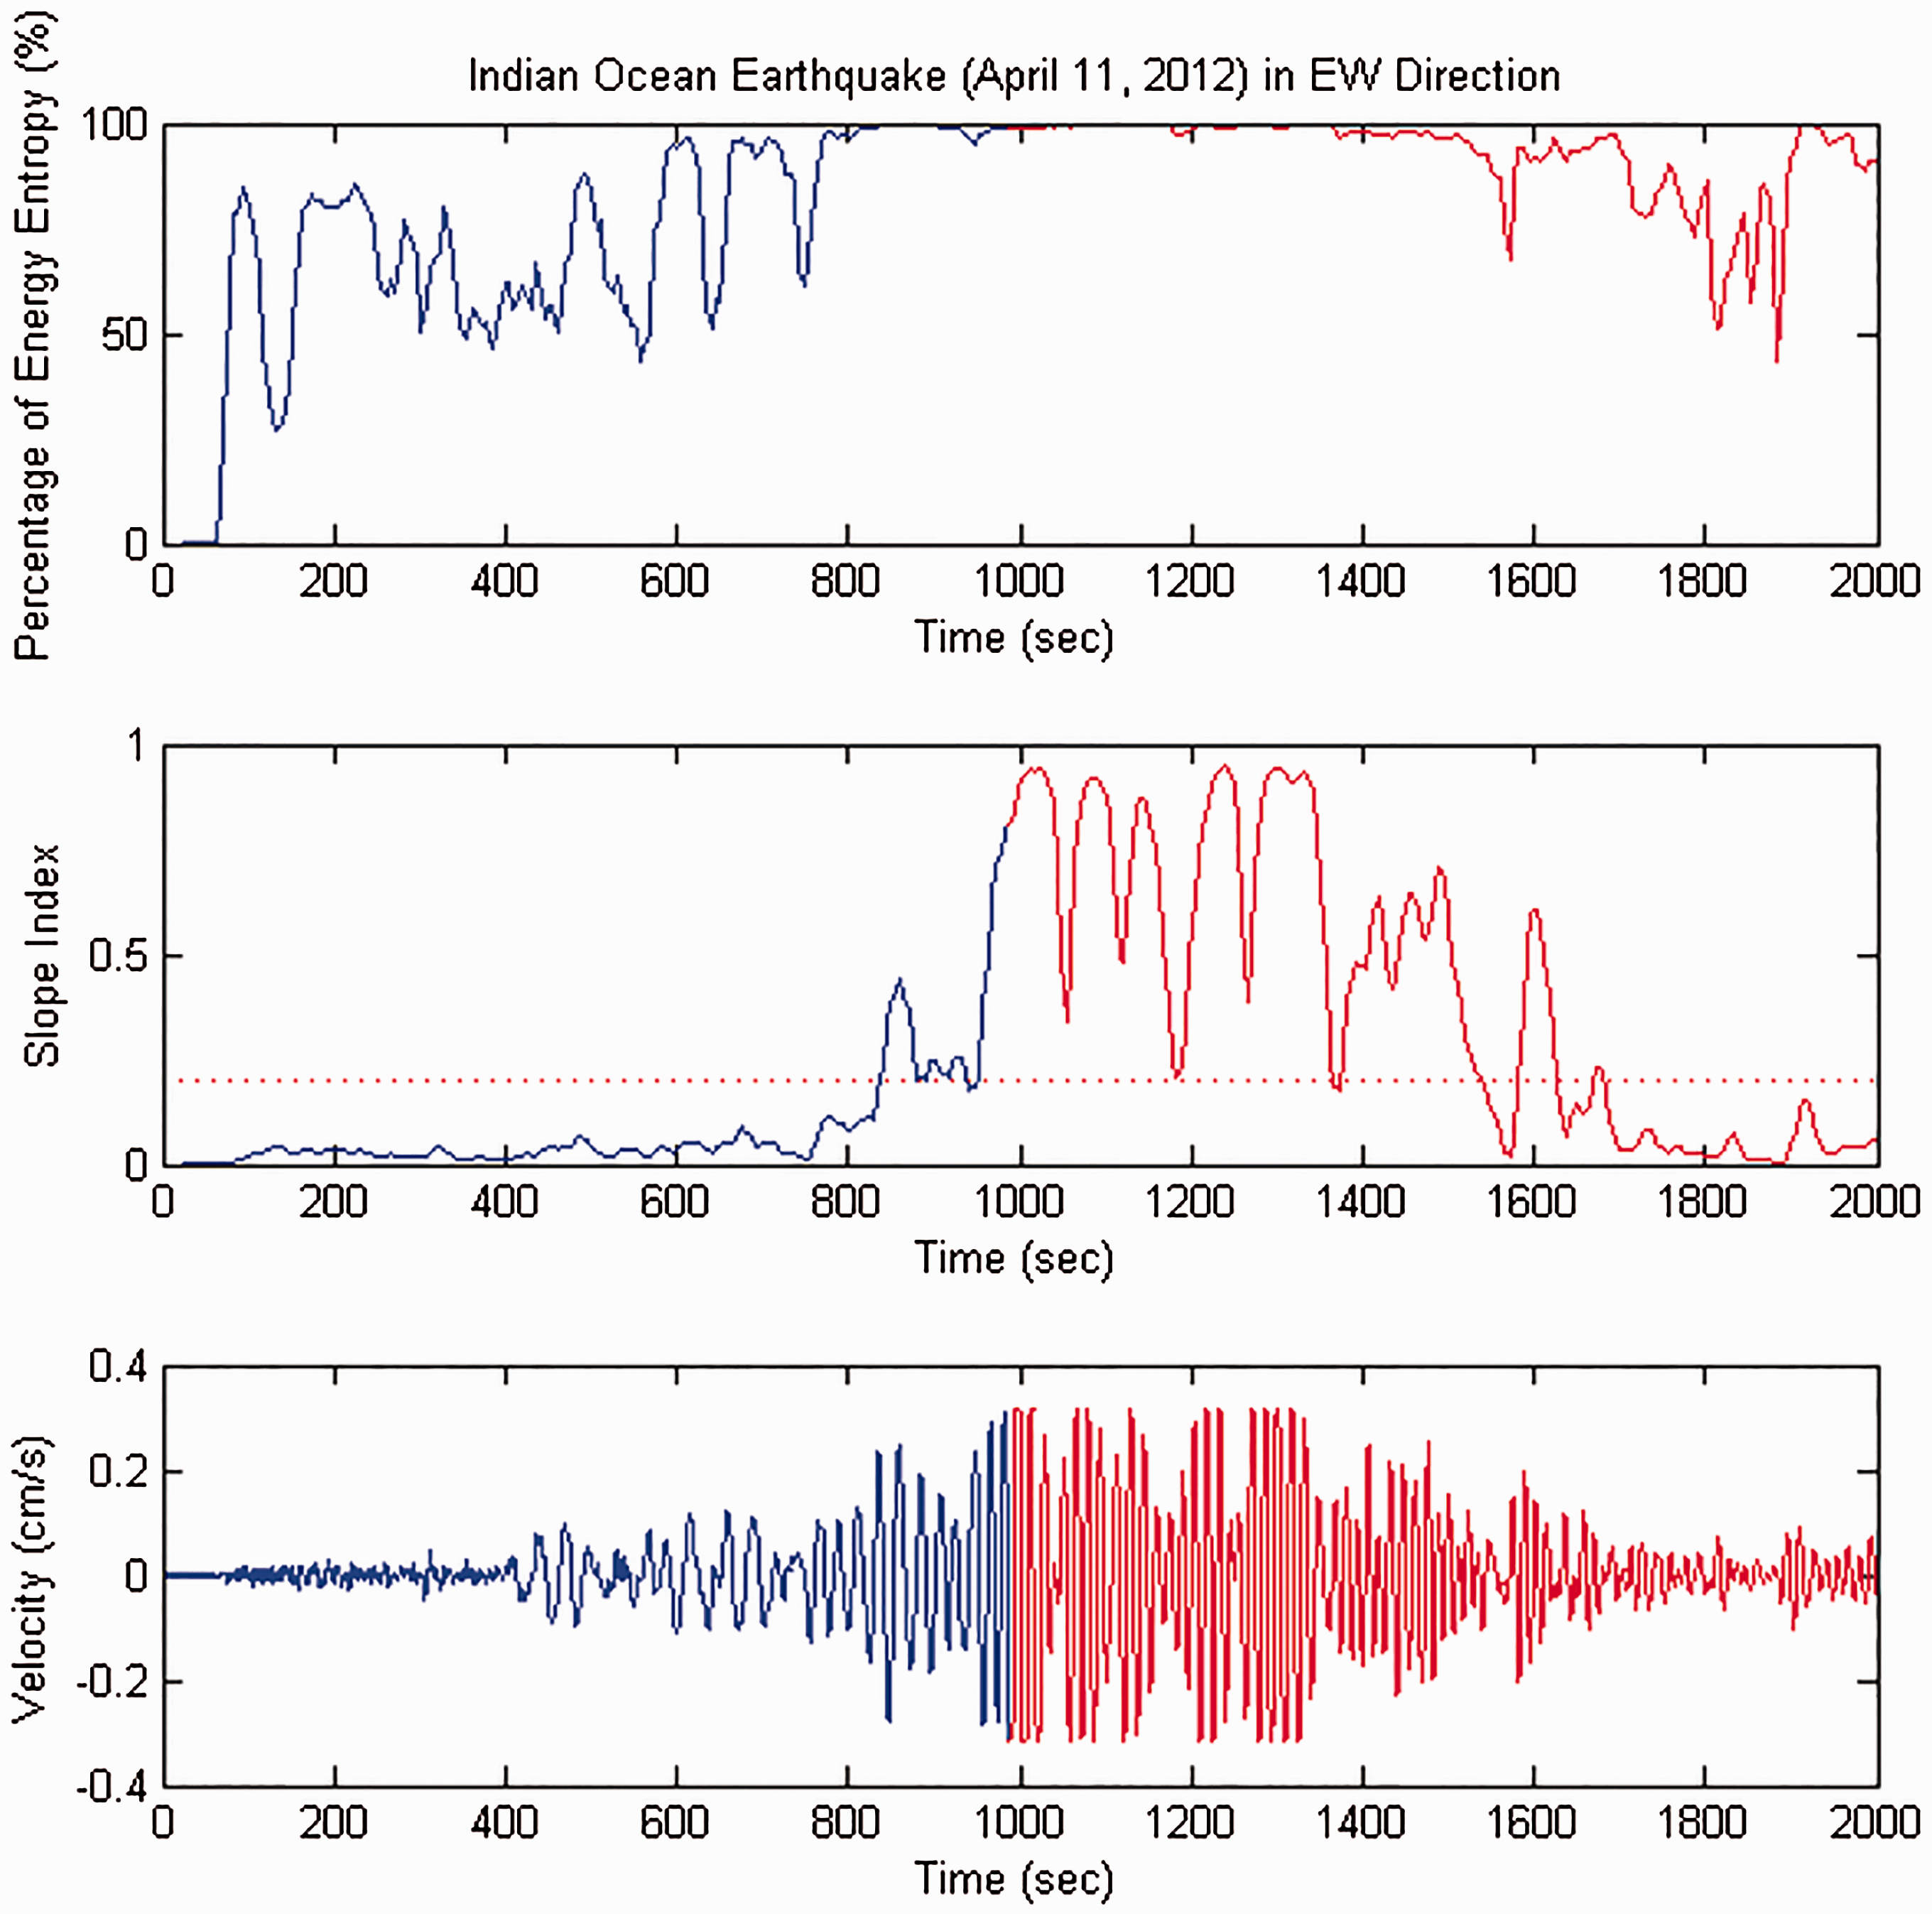
The results of energy entropy percentage and slope index compared to recorded seismic waveforms of 11 April 2012 seismic event (red line represents the signal has been saturated).
Discussions on the existence of long-period seismic waves from distant earthquakes
As discussed in the previous section, the identification of long-period seismic waves was extracted after the arrival of P-waves. In order to confirm and verify whether the existence of the long-period seismic waves did propagate across the island, not the local site effect, M-SSA was used by using the seismic waveforms after the initial P-waves arrival to identify the principal direction using ground motion data collected from the broadband stations (including both BATS and NCREE network).
SSA is a nonparametric spectral method combining the elements of classical time series analysis, multivariate statistics, and signal processing, and is usually used in time series analysis.25–28 It can decompose time series into the sum of meaningful components and can extract information from time series without prior knowledge of the dynamics affecting the time series. 29 SSA can be applied to single or multiple time series. This latter application is referred to as multivariate (or multichannel) SSA or abbreviated as M-SSA.
The basic procedure of SSA comprises four steps: embedding, singular value decomposition, grouping, and skew-diagonal reconstruction. Generally, the first two steps are considered as the decomposition stage and the final two steps the reconstruction stage.30–32 SSA seeks to decompose the original series into a sum of a small number of interpretable components such as trend, oscillatory components, and noise. It is based on the singular value decomposition of a specific matrix constructed upon the time series. Reconstruction is the second stage of SSA technique and it includes two separate steps: grouping (identifying signal component and noise) and diagonal averaging (using grouped eigentriples to reconstruct the new series without noise). Usually, the leading eigentriple describes the general tendency of the series. Through SSA, the lowest period of the dominant seismic waves after the arrival of P-waves can be extracted. The direction of the dominant wave propagation can also be detected.
Identification of principal direction
The M-SSA approach was used to identify the principal direction of the P-waves and S-waves of two distant earthquakes from the broadband stations in Taiwan. First, the waveforms recorded from SSLB station (BATS) located at central Taiwan were used, as shown in Figure 14(a) and (c). Two different time windows were selected from the records: the first time window started with the arrival of the P-waves, while the second time window started with the arrival of the S-waves. With these time windows, and all the records collected from the BATS stations in Taiwan during the seismic events, M-SSA was applied to determine the first major principal component of ground motion from these time windows. Figure 14(b) shows the velocity trajectory of the major principal component in the first time window across the BATS. It indicated that the direction of the major principal component in the first time window, starting with the arrival of the P-waves (containing 58.7% of total eigenvalues), was consistent with the direction of the epicenter. In contrast, the major principal component in the second time window, starting with the arrival of the S-waves (containing 73.3% of total eigenvalues), was perpendicular to the direction of the epicenter. This result demonstrated that the major principal component (P-waves contribution) can be identified clearly through M-SSA by using data from the first time window. Besides, the principal component is similar for all recorded stations which indicated that the motion from the major principal component is propagated across the island. A similar approach was also applied to the data collected from the Indian Ocean earthquake, as shown in Figure 14(d). On the contrary, the data of Samar (Philippine) earthquake were used, and it is a distant earthquake without any impact to high-tech fabs. The identified principal component across the island is not clear and without a consistent principal component among stations. Two important observations can be made: first, the principal direction of the seismic waves with long period from different recorded stations is very consistent across the island; and second, significant long-period ground motion between the arrival of the P-waves and S-waves do exist for far distant earthquake and can be identified with enough time to extract the long-period seismic waves.
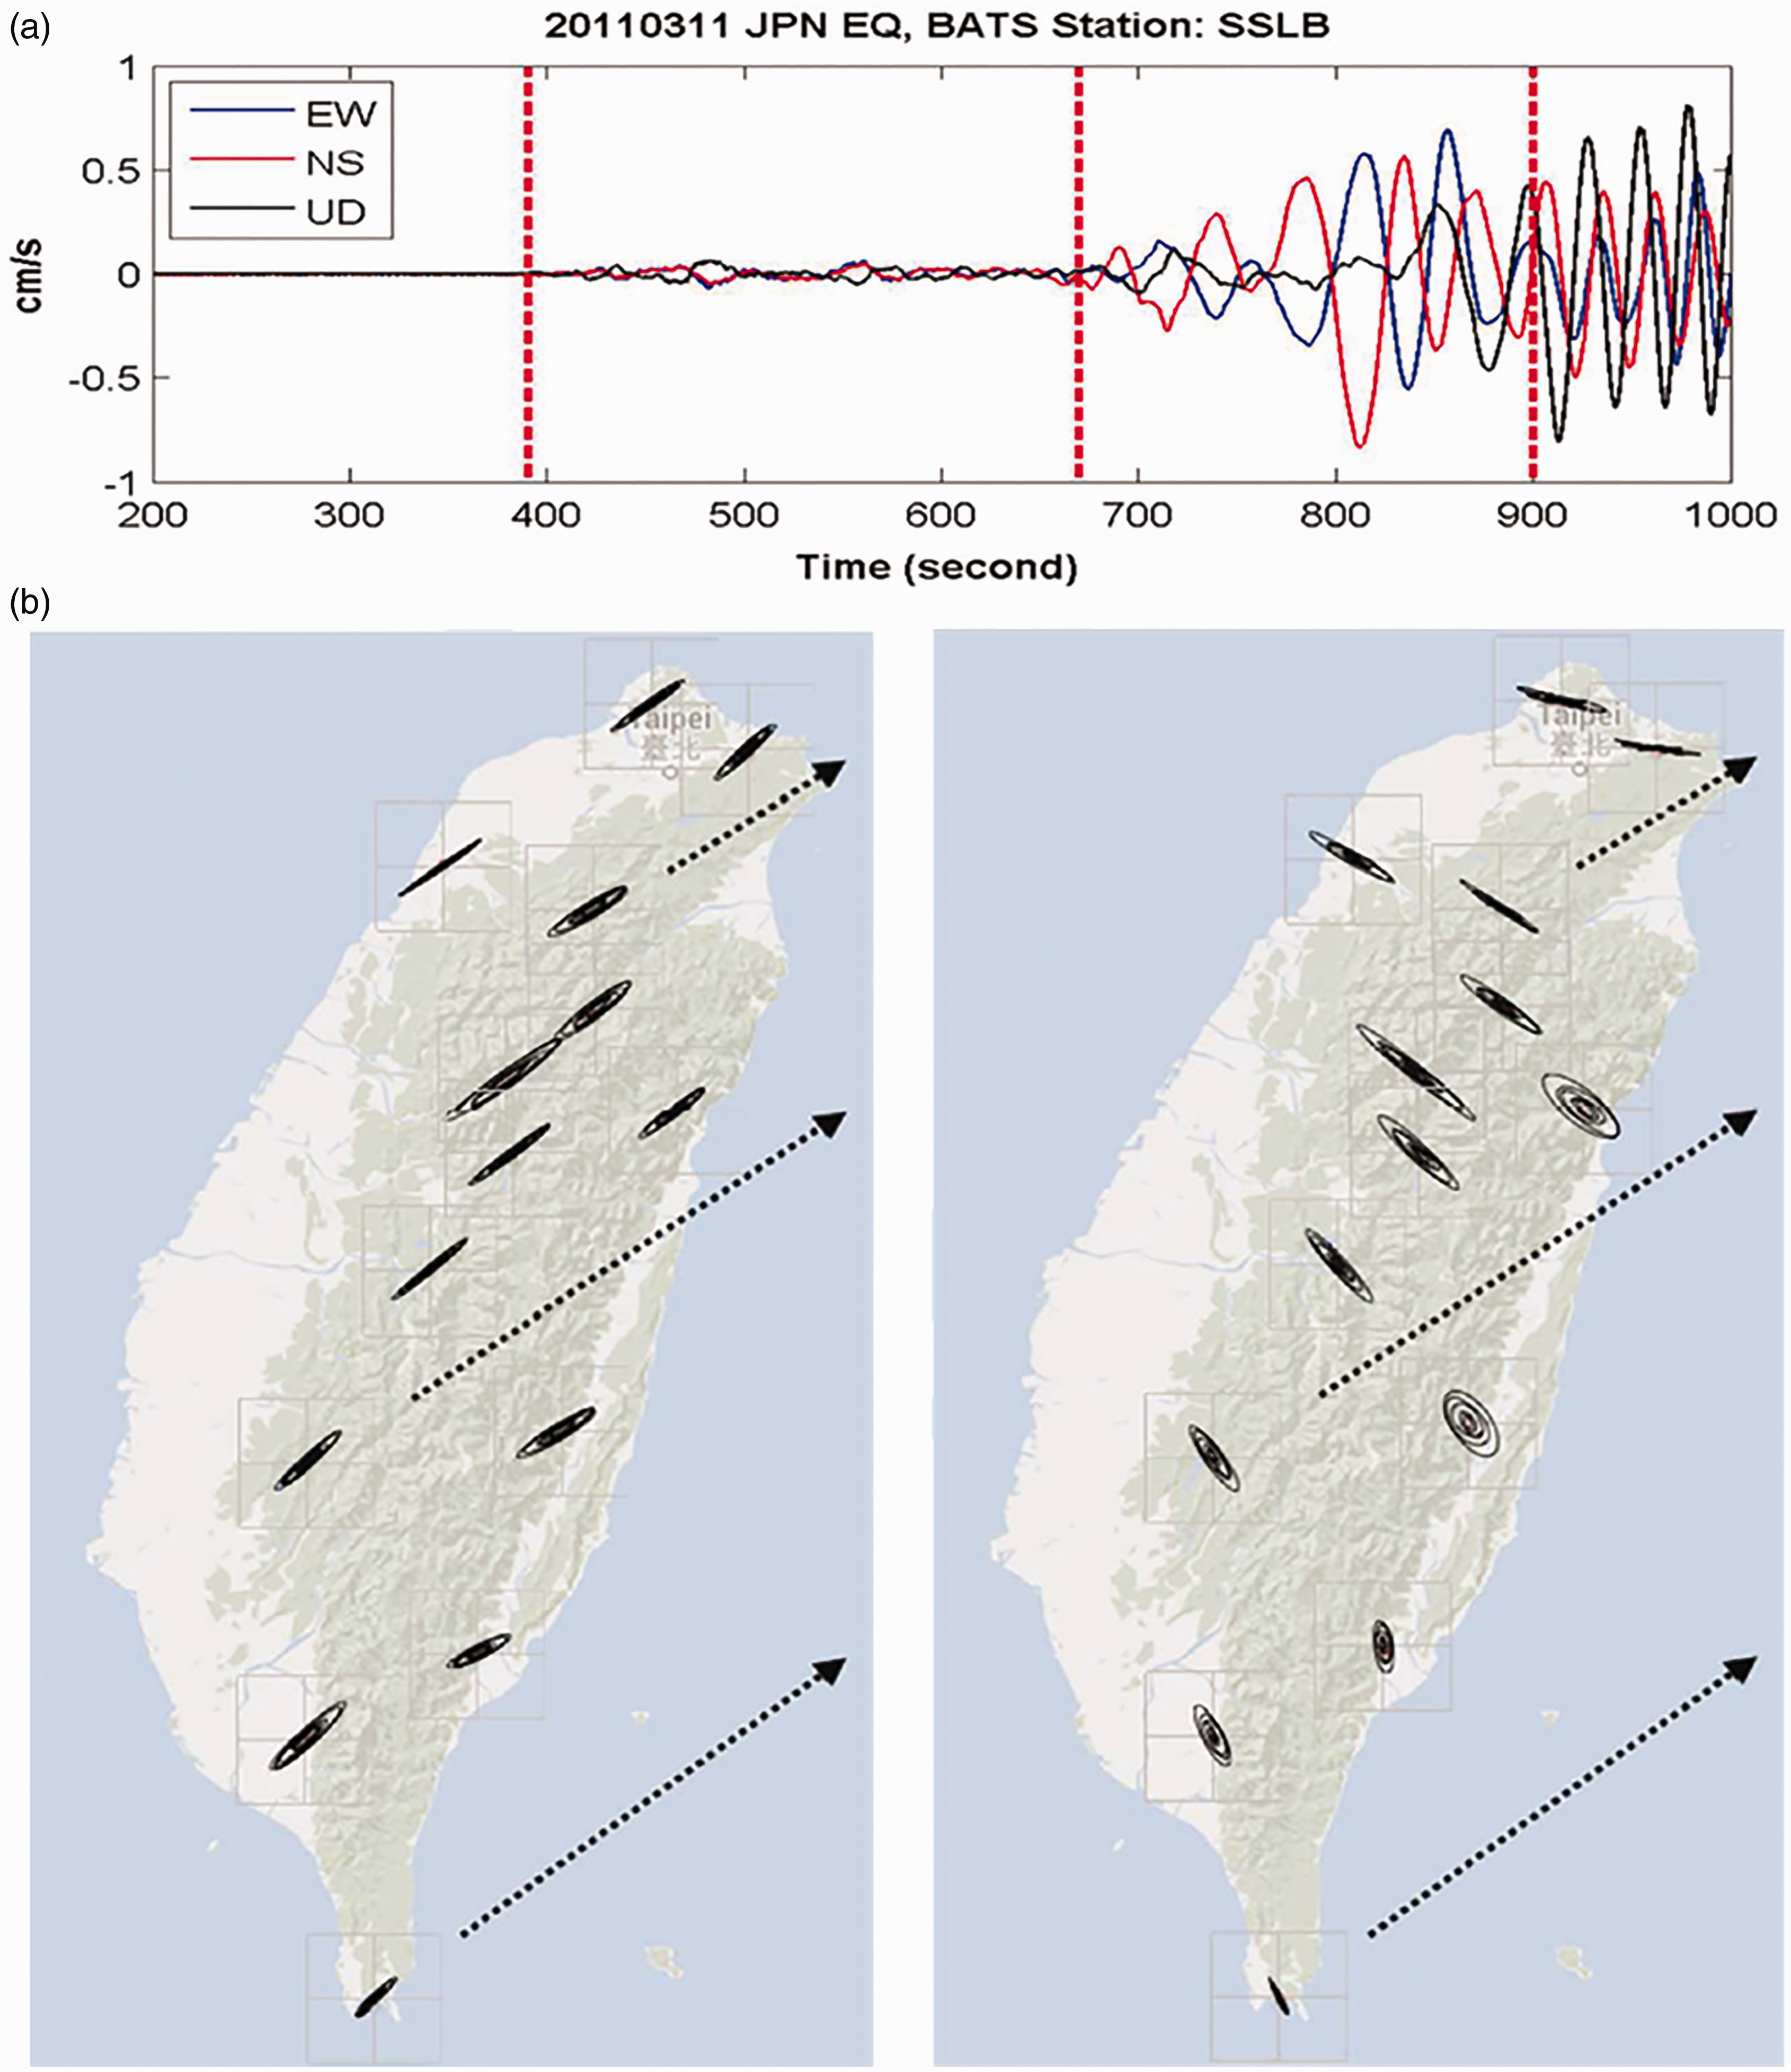
(a) Recorded velocity seismic waveforms from SSLB stations of BATS on 11 March 2011 (the Great East Japan earthquake). Two time windows with P-wave and S-wave arrival time are also indicated. (b) Velocity trajectory of first principal component on 11 March 2011 (the Great East Japan earthquake). (i) Duration starts with P-waves arrival and (ii) duration starts with S-waves arrival. The arrow indicated the epicenter direction. (c) Recorded velocity seismic waveforms from SSLB stations of BATS on 11 April 2012 (the Indian Ocean earthquake). Two time windows with P-wave and S-wave arrival time are also indicated. (d) Velocity trajectory of first principal component on 11 April 2012 (the Indian Ocean earthquake). (i) Duration starts with P-waves arrival and (ii) duration starts with S-waves arrival. The arrow indicated the epicenter direction. BATS: Broadband Array in Taiwan for Seismology.
Automatic P-waves arrival detection and picking
Since the BATS or NCREE network is a 24 h continuous recording system, an automatic P-waves arrival detection method needs to be considered. The DWT was used in single-component seismograms through a series of sliding time windows. In each window the Akaike information criteria (AIC) auto-picker was applied to the threshold absolute wavelet coefficients at different scales, and then compare the consistency of those picks to determine whether a P-waves arrival has been detected in the given time window. The arrival time was then determined using the AIC picker on the time window chosen by the wavelet transform. 33 Figure 15 shows an example by using automatic P-waves arrival detection technique to identify the initial arrival of P-waves. Data after P-waves arrival will be used for this analysis.
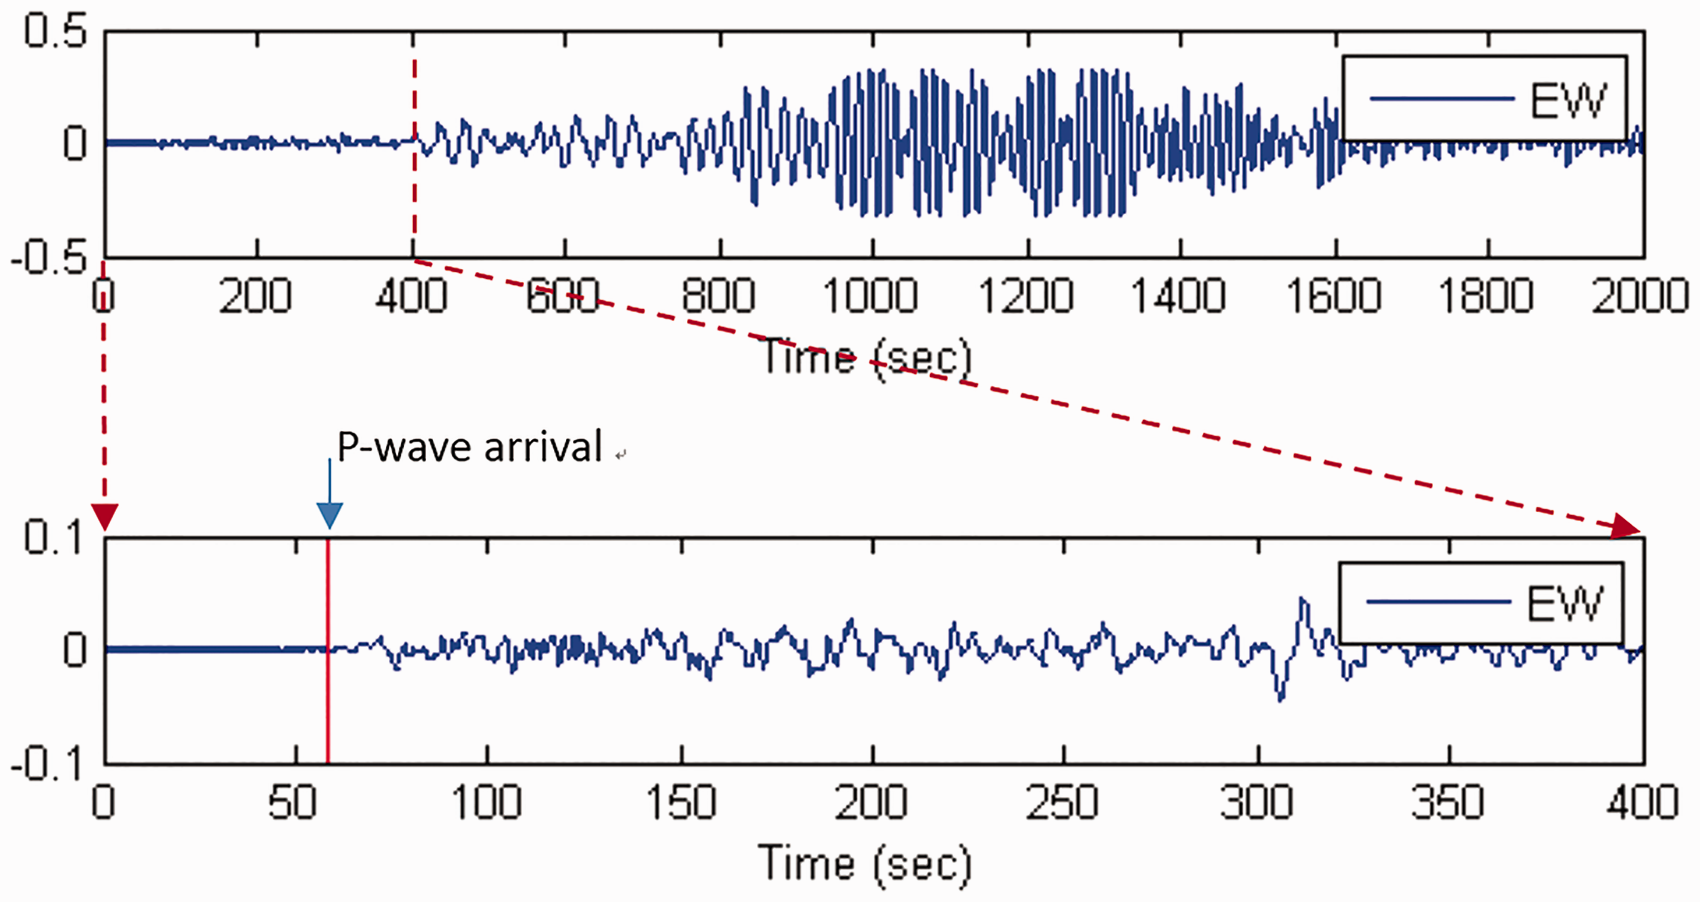
Identification of P-waves arrival from the seismic data recorded by the broadband seismometers.
Conclusion
Vibration (displacement)-sensitive equipment, such as the wafer scanners in high-tech fabs, may be subjected to shut down without warning due to the excitation of long-period seismic waves with large amplitudes. From the damage survey of high-tech fabs, a lot of equipment was reported as faulty and broke down under several distant earthquakes. This study aimed to investigate the ground motion characteristics of these distant earthquakes recorded in Taiwan in relation to the impact on vibration-sensitive equipment in high-tech fabs and to develop an informative index for the possibility of impact avoidance. Signal processing and feature extraction techniques, such as WPT and SSA, were implemented to detect the long-period seismic waves. With the selected 38 distant earthquakes, the slope index (in relation to the slope of Arias intensity), together with the indicator of long-period seismic waves was examined. The proposed index, as well as the algorithms of detecting long-period seismic waves, correlated well with the impact on high-tech fabs. In this study, the slope of Arias intensity and the slope index were proposed to provide useful information to detect the change in energy and amplitude in the recorded seismic waveforms. To issue an early warning for the high-tech fabs to turn off the vibration-sensitive equipment so as to prevent an unexpected shutdown, it is believed that the proposed index can be used as an early warning tool. The schematic procedures of detecting long-period and large-amplitude distant earthquakes for impact avoidance using the wavelet approaches are shown in Figure 16.
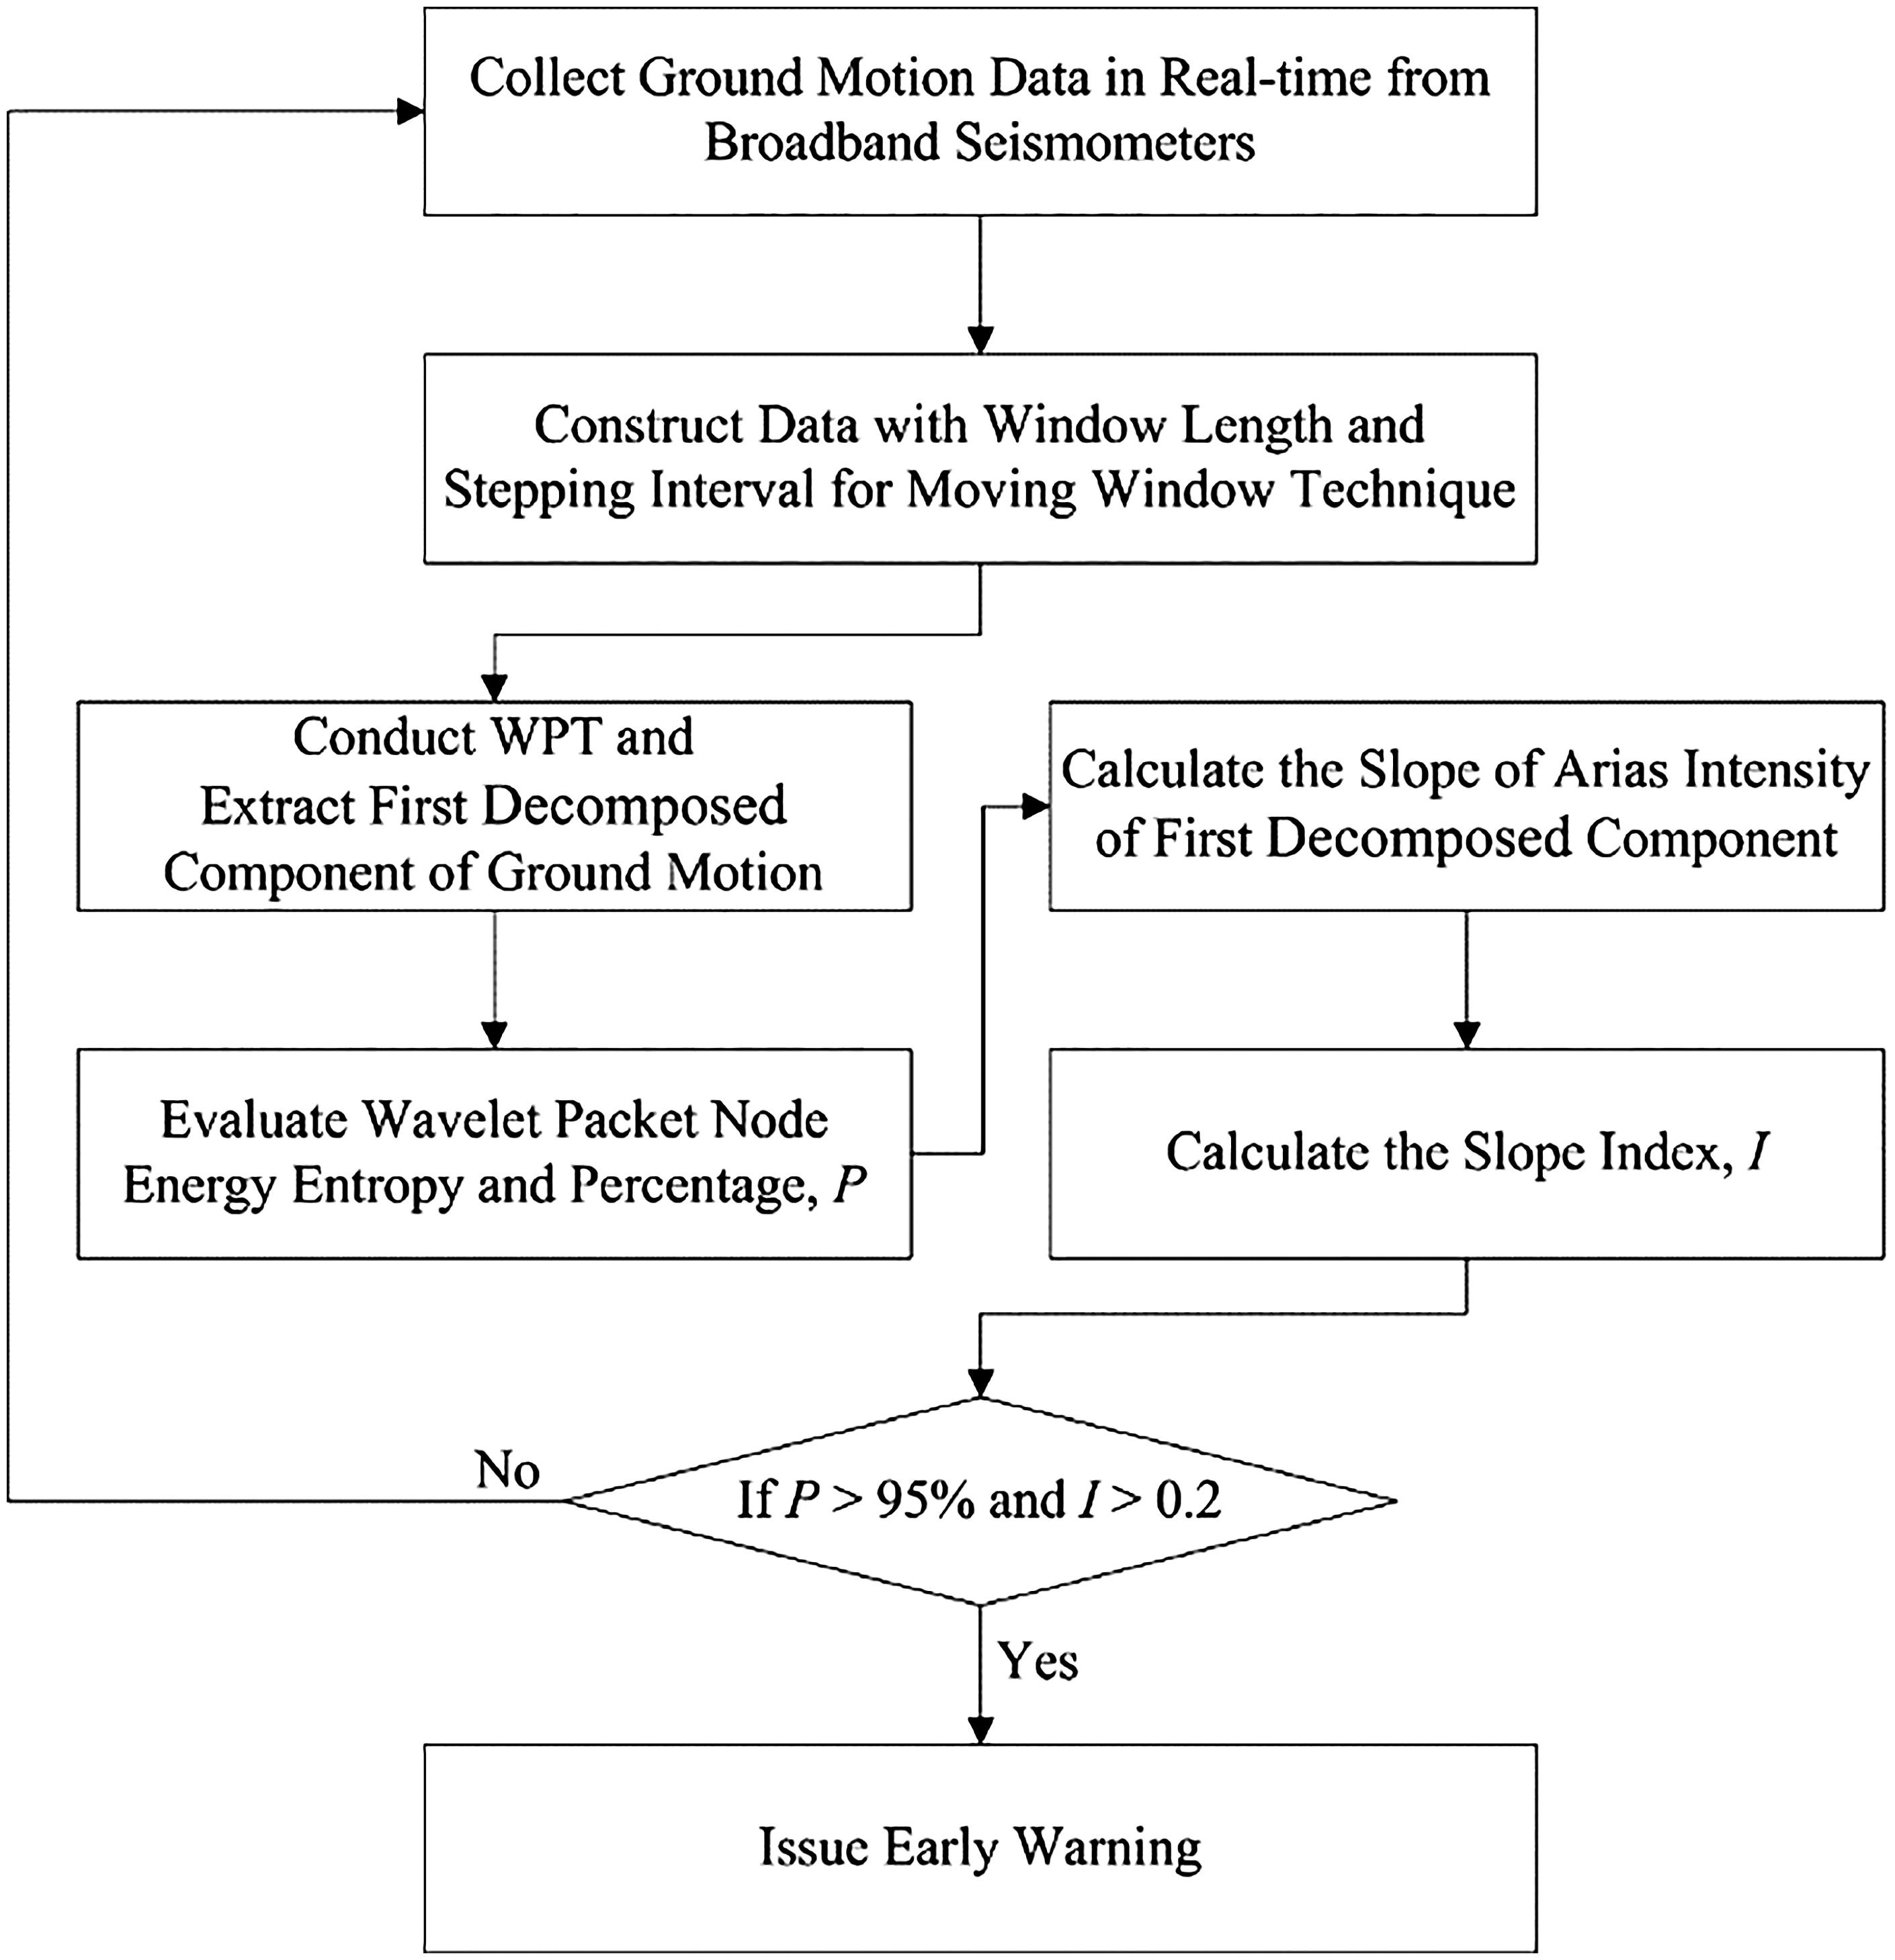
Procedures of detecting long-period and large amplitude far distance earthquake for early warning using wavelet approach. WPT: wavelet packet transform.
SSA and WPT have the advantage of developing an informative index for impact avoidance. Furthermore, the wavelet approach also provides computational efficiency according to the study of average computation time under the same software and hardware environment. In conclusion, for high-tech fabs that are equipped with their own broadband seismometers, the wavelet approach can be more applicable for real-time detection. In the SSA approach, the M-SSA can be used to identify the principal components of seismic waves and generate a shake map in conjunction with the regional seismic networks for high-tech fabs that have no broadband seismometers in their vicinity.
Footnotes
Declaration of conflicting interests
The author(s) declared no potential conflicts of interest with respect to the research, authorship, and/or publication of this article.
Funding
The author(s) received no financial support for the research, authorship, and/or publication of this article.