
Abstract
Sound is one of the most important problems in industrial environments, and it causes hearing loss at different frequencies in the workforce. Incorrect fitting of hearing protector has a negative effect on noise reduction. The present study was conducted with the aim of determination of the effective frequencies on hearing loss and variations of the sound level in different frequencies after placing the earplug. A model of ear canal with different materials was simulated. Sound pressure sensors and earplugs were placed in both sides of the ear canal. The rates of sound reduction in octave frequency signals were calculated for the simulated canal of different materials, in different distances between the microphone and the earplug with Labview software. The results of sound simulation in octave frequency signals showed that by increasing the frequency, the rates of sound reduction in different conditions also had an increasing trend. The obtained peak rates for all the situations coincided with each other at fixed frequencies. In most cases, a noise reduction in the frequency of 4000 Hz showed a high number. The maximum sound reduction was observed at 25.5 mm at frequencies below 250 Hz, which was similar to the average of human ear canal length; so the simulated model can be used to determine the performance of the protective earphones and test them at different frequencies and sound pressure levels.
Introduction
Human hearing system, including outer ear, middle ear, inner ear, and related nerves, depends on sound. Outer ear has the duty to collect the sounds and transfer them to the middle ear via the ear canal and to the tympanic membrane (eardrum). Sound waves pass through malleus, incus, and stapes, reaching to the inner ear. Inner ear includes cochlea and semi-circular canals. Cochlea includes thousands of very thin hair cells in the spiral organ (organ of Corti). When the sound waves enter the inner ear, the hair cell helps in stimulating the sound waves. Hair cells transform the vibrations into electric signals, and waves are transferred to the brain via hearing nerves. Brain transforms the signals into understandable sounds. Confronting with sound damages spiral organ cells. The sensing hair cells are vibrated by acoustic input signals, and then the mechanical vibrations are transformed to an electric form to reach to the eighth brain nerve. Confronting with intense sounds (over 85 dBA) primarily damages outer hair cells that are responsible for the sounds with high frequencies (3–6 kHz). 1
Ear canal performs like a resonator, turning up the sound. Ear canal resonance depends on its length. The shape and size of ear lobes and the curvature of ear canal affect frequency reactions of the eardrum.2,3 Different parts of the base membrane have different widths. High-frequency signals are affected by resonance near the oval window and low frequencies are so affected near cochlea. 4 Generally, 16% to 24% hearing loss in adults is due to the noise at working places. 5 Human ear is more sensitive to high frequencies than low frequencies, but with age, people’s sensitivity to higher frequencies decreases. 6 Noise-induced hearing loss (NIHL) is the result of long-term exposure to noise that causes cumulative damage to hair cells of the cochlea. 7 It is bilateral and symmetrical, and it is usually affected by high frequencies (3, 4, and 6 kHz), extending then to lower frequencies (0.5, 1, or 2 kHz). 8 Hearing damage due to confronting with noise for some years is extended to both high and low frequencies. 1 According to the U.S. Health and Human Services Ministry, when eliminating noise is not possible by engineering controls, proper use of hearing protection devices together with audiometric monitoring is effective in preventing NIHL. Effective hearing protection can be achieved by proper selection of different types of hearing aids, appropriate tests and compatibility, proper use, and continuous attention to maintaining them. 1 Despite the fact that hearing system protection devices are not considered as the first protective action, they are regarded as a main measure for preventing hearing loss due to their low costs, availability, and effects. 9 Promoting the use of hearing protection devices prevents NIHL among workers who are exposed to excessive noise. 10 Earplugs are one kind of hearing protection devices that are placed inside the ear to block the ear canal, and they are produced either in molds or by ductile foams. Inappropriate fitting of hearing protectors may have negative effect on noise reduction rate. The result of Salmani research showed that training in the appropriate use of earplugs significantly affects the efficacy of earplugs. 9 The results of the study dealing with an analysis of noise damping rates by earplugs showed that in low frequencies and high frequencies (8 and 12 kHz), earplugs have high rate of damping. 8 The performances of hearing protection devices differ from each other in reducing and attenuating the noise. There are various methods for evaluating the performance of hearing protection devices in reducing noise. These methods are categorized into subjective and objective aspects. Standard no. ISO4869–3:2007 suggests the acoustical test fixtures (ATFS). This is an objective method. In this method, hearing tests are done in different frequencies with or without the protective earphone. The attenuation index is obtained out of the difference between open and blocked ears’ thresholds.11,12
Hence, sound is one of the most important problems in industrial environments causing hearing loss in the workforce. In addition improper fitting of hearing protectors have negative effects on noise reduction. In this study, by simulating a model of ear canal and evaluating the rate of attenuation in different distances and different frequencies between the earplug and the microphone that is located in an ear as the simulator for receiving the sound, in different materials such as Teflon and cast iron, the effective frequencies on hearing loss and variations of the sound level in different frequencies and distances after placing the earplug are determined.
Methods
Modeling and preparation of setup
A model of ear canal was primarily simulated. The diameter of the human ear canal is about 7 mm. 13 This dimension was considered in the modeling. By default and in two changeable conditions, the ear canal structure was designed with different materials of Teflon and cast iron. Sound pressure sensors (1/4″) were placed in the ear canal. The microphones were connected to the Data Acquisition Card (DAQ; National Instrument, USA) for receiving sound signals from environment, and the sound card was connected to the computer. Labview software was installed in the computer (Window 7: 64 bites), which was used for drawing the frequency analysis curves. Other features of the DAQ are as follow: sample rate: 51200, resolution: 24 bites, sample per channel: 5000, and NI USB: 9234.
Simulation of sound attenuation by Labview
Labview software was used for the simulation of sound attenuation in octave band frequencies. The software is a graphical programming software with capabilities such as noise measurement, frequency analysis, and controlling the sound. 14 Response network was adjusted on network “A” and also the bandwidth of one octave band was set on the work page of the software.
Sound signals play
The microphone was first calibrated by the calibrator in frequency of 94 dB at 1000 HZ (model: 4230). Pink noise with 90 dB in one-third octave frequencies was played by the 80 Watt loud speakers.12,15 The played sound was received by the microphone placed in the ear canal, and the frequency analysis curves were drawn according to the stated frequencies in Labview software. The earplug (model: ELVEX NRR25 manufactured according to standard ANSI S3.19–1974) was placed on the model, the played sound with the same intensity was replayed in the mentioned frequencies, and the required graphs were drawn. The rate of attenuation of the earplug sound was obtained by subtracting the sound pressure level at each frequency in two stages. The rates of sound reduction in octave frequencies were calculated for the simulated canal of Teflon material, in different distances between the microphone and the earplug (12.8 mm, 17.5 mm, and 25.5 mm). For more investigations, the rates of sound attenuation in octave frequencies were determined for the distance of 22.8 mm for the canal of cast iron material, and for the distance of 25.5 mm for the canal of the combined Teflon and cast iron materials. Each test was repeated three times to reduce the errors and average of results was recorded. The results were analyzed by SPSS software version 20.
Results
The results of sound simulation in octave frequency signals showed that there was a significant difference between the received noise by microphone before and after placing the earplug on the model (P < 0.05). The result showed that by increasing the frequency, the rates of sound reduction in different conditions had also an increasing trend. By increasing the frequency, the rate of attenuation on the used earplug also showed an increasing trend. By increasing the distance of the microphone from the earplug, the sound level had an increasing trend from the distance of 12.8 mm to 25.5 mm, but it had a decreasing trend at the distance of 31.1 mm. This decreasing trend was quite prominent in frequencies under 500 Hz. The sound level in Teflon showed increasing and decreasing trends for different frequencies at the distance of 25.5 mm, reaching to its maximum rate at the frequency of about 4000 Hz. The peak frequency of 4000 Hz was observed in most of the existing states regarding the material, including metal at the distance of 22.8 mm, Teflon at 17.5 mm, Teflon at 25.5 mm, and combination of metal and Teflon at 25.5 mm. Among different conditions, the required rate has reached to its maximum value, i.e., 59 dB, in the metal canal at the related distance of 22.8 mm and in the frequency of 4000 Hz (Figure 1).
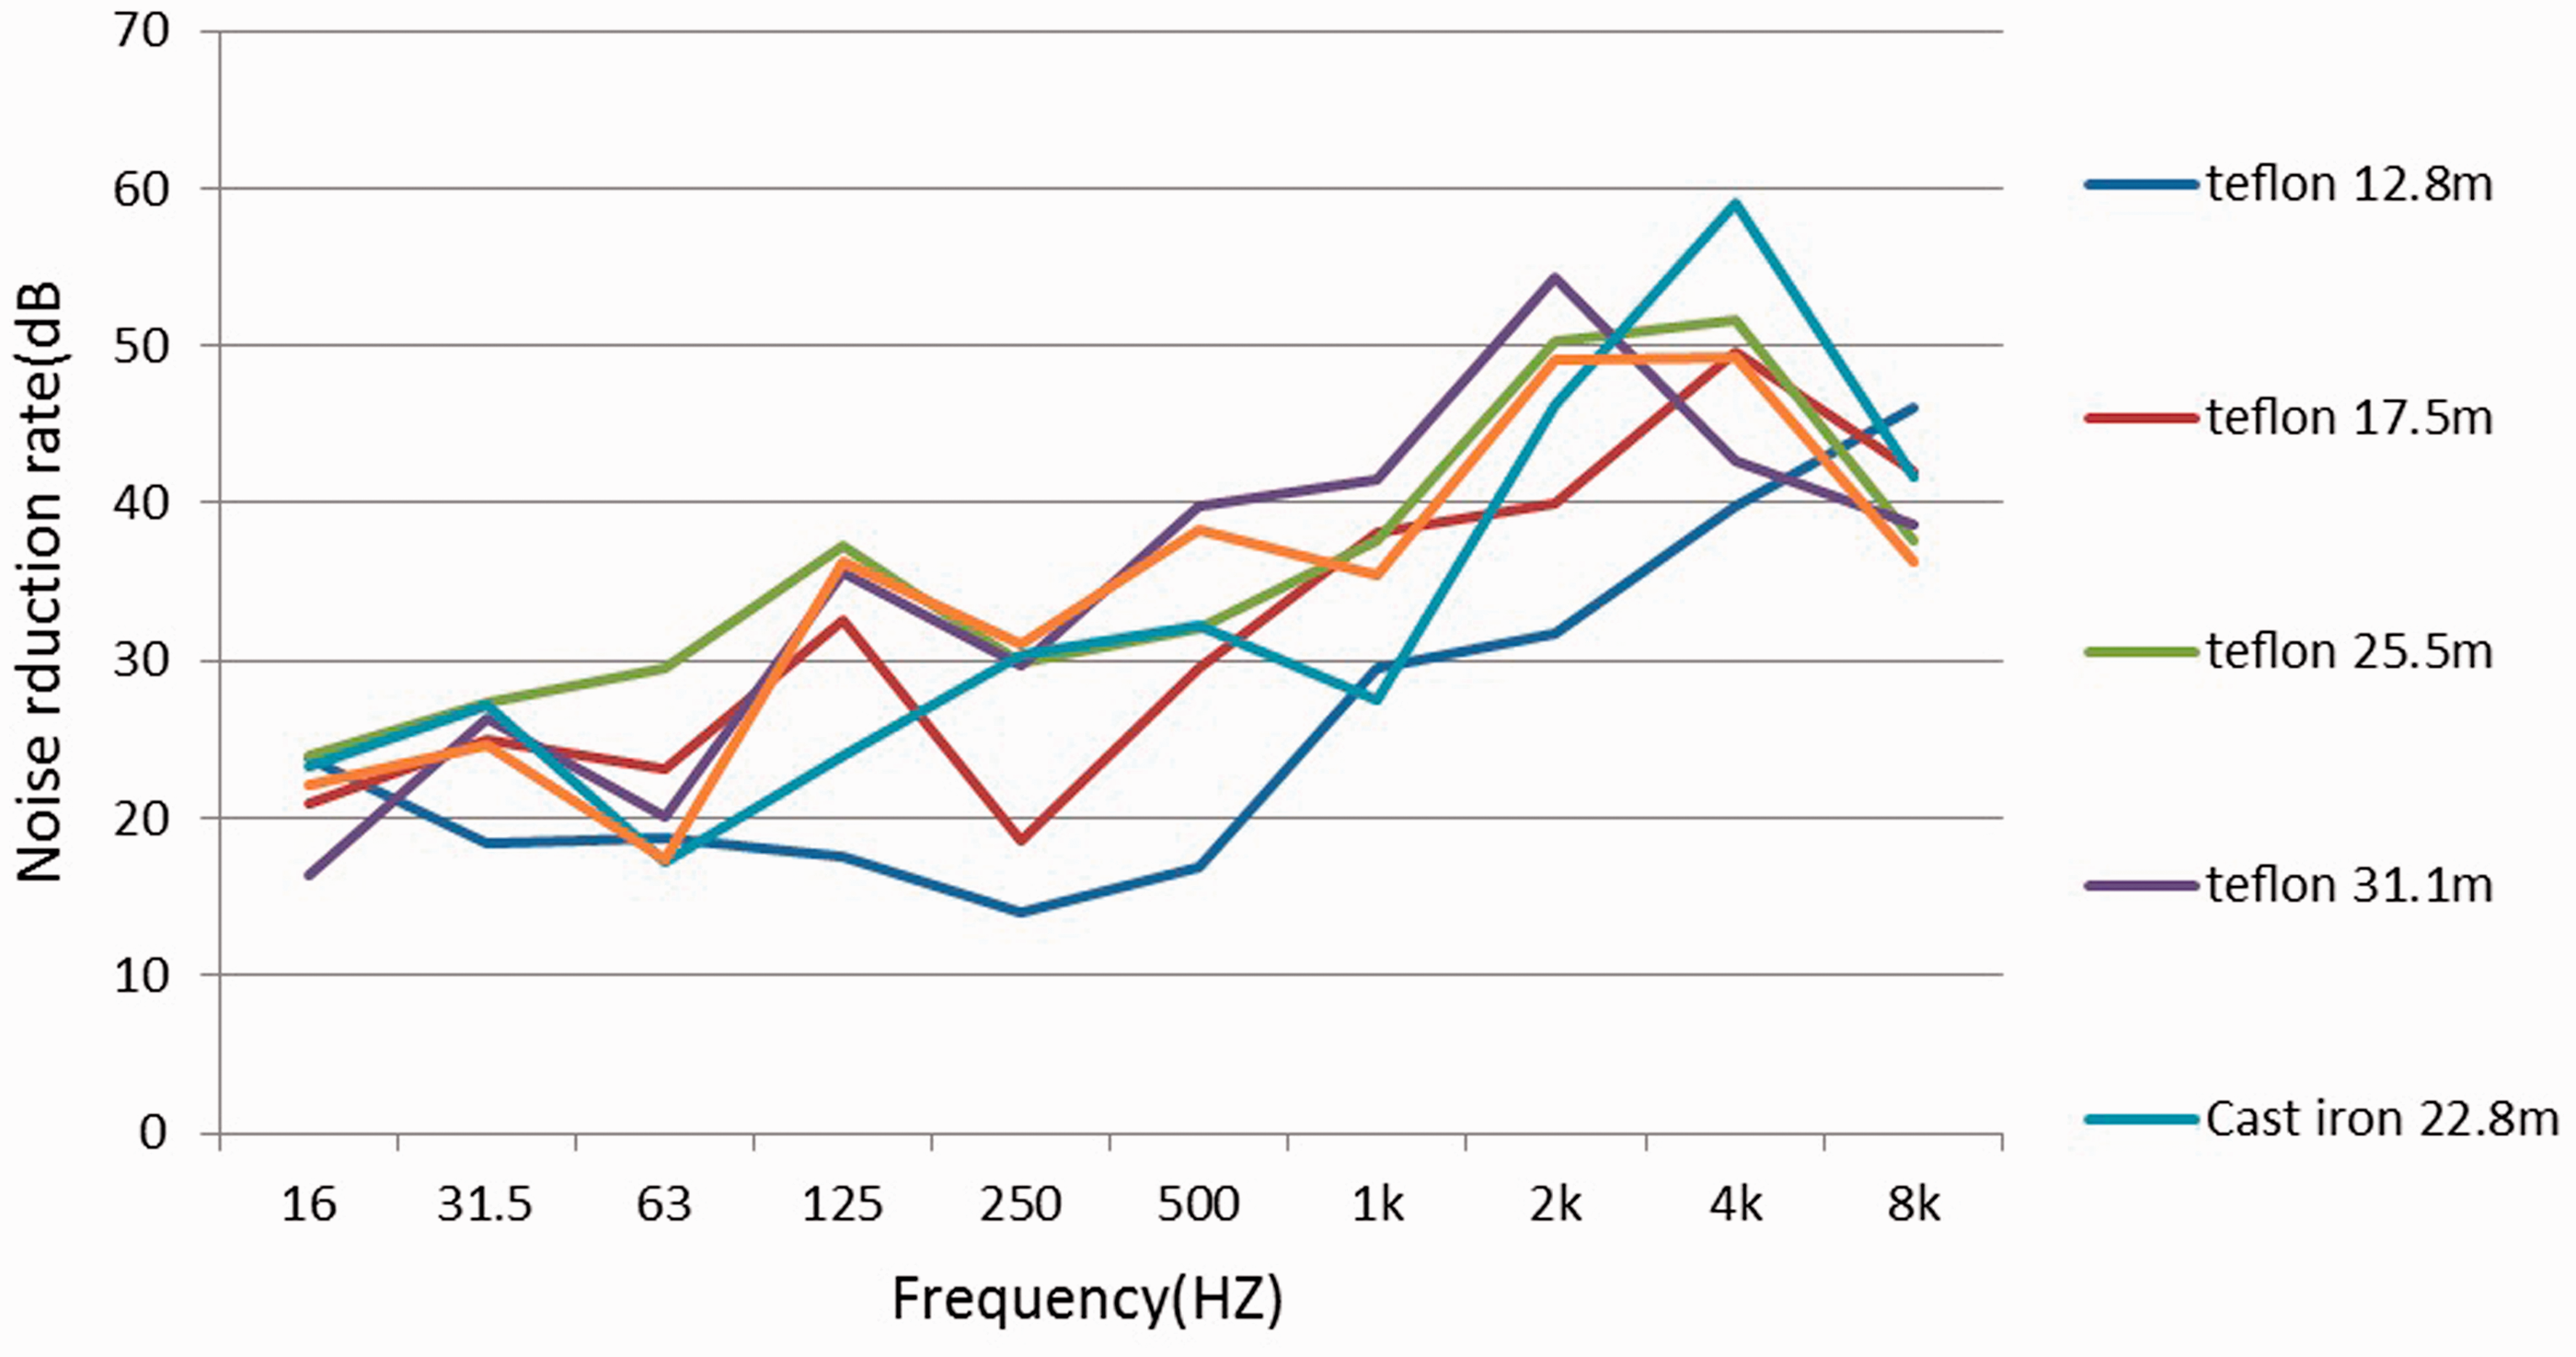
Rate of sound attenuation (dB) in octave frequencies at different distances in simulated ear canal.
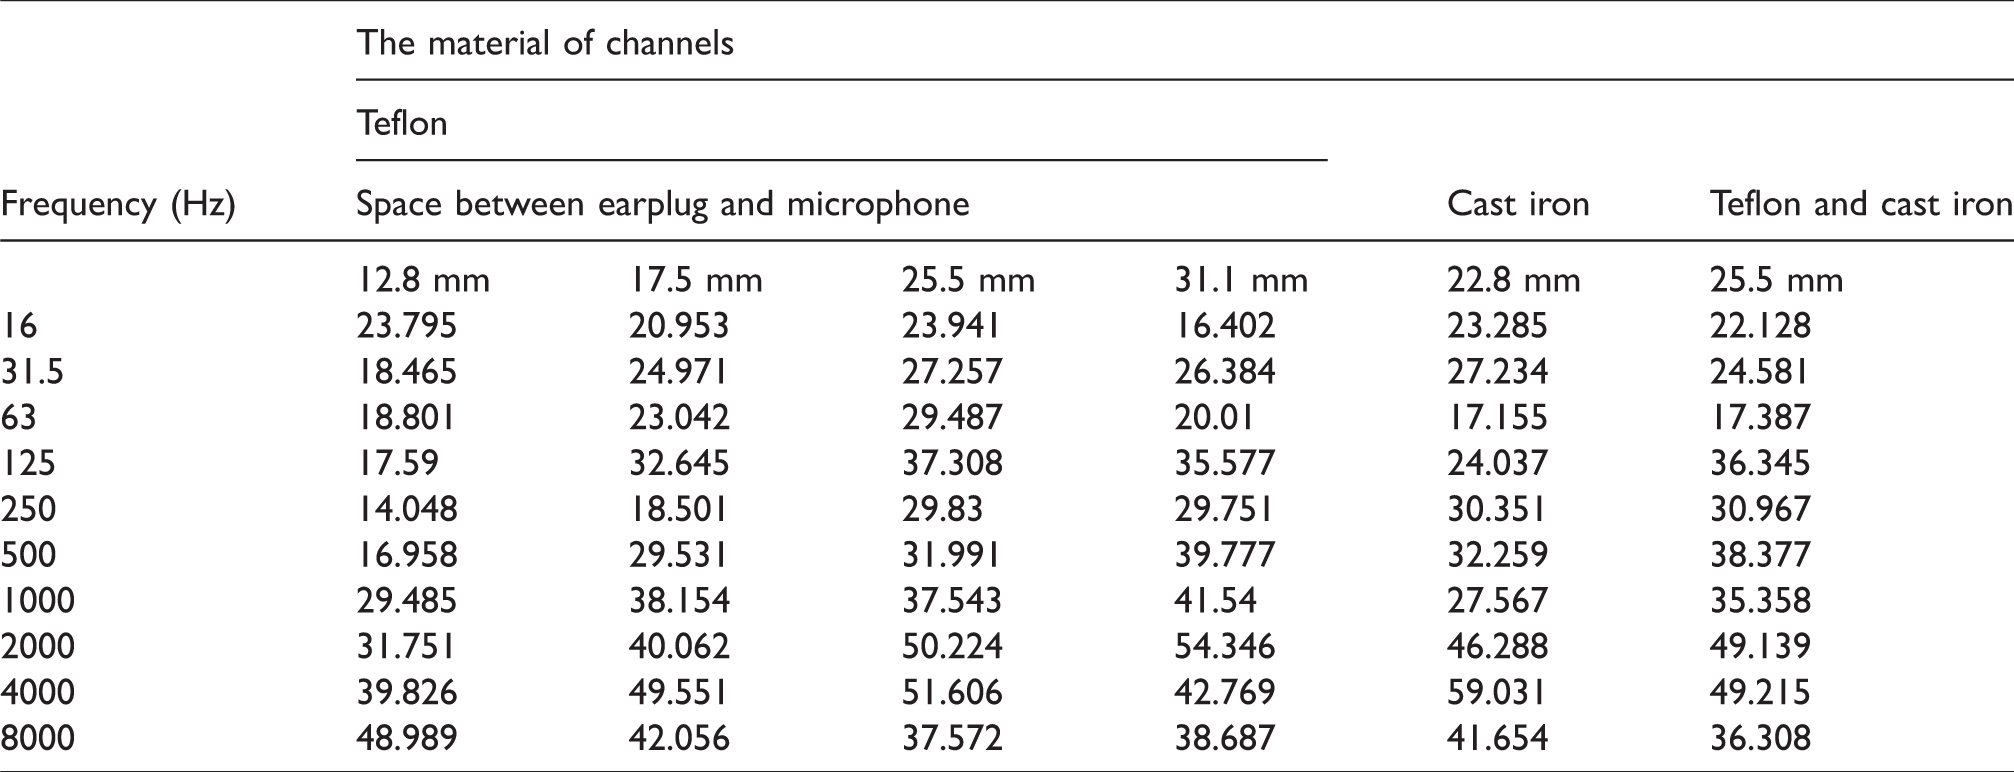
The obtained peak rates for all the situations coincided with each other at fixed frequency signals. The sound level in the Teflon canal at the distance of 25.5 mm was higher in comparison with other distances, for the low frequencies of 16, 31.5, 63, and 125 Hz (23.941, 27.257, 29.487, and 37.308 dB, respectively), being closer to the rate of sound attenuation of the protective earphone (Table 1).
Average and standard deviation marked on the earplug (model: ELVEX NRR25).

At the frequency of 250 Hz, the sound level in the canal with the combination of metal and Teflon was the highest at the distance of 25.5 mm (30.967). At frequencies of 500, 1000, and 2000 Hz, the rates of sound attenuation in the Teflon canal were higher at the distance of 31.5 mm as compared to other distances (39.777, 41.54, and 54.346 dB, respectively) (Table 2). There was no significant difference between the average noise reduction of frequencies in this study and the numbers entered in the catalogue of earplug at 25.5 mm, 17.5 mm, and 31.1 mm (P <0.05). The rate of the attenuated sound level in 4000 Hz frequency at the distance of 22.8 mm was higher in comparison with other distances (59.031 dB) (Figure 1). Finally, in the Teflon canal, the sound level obtained the maximum rate at the distance of 12.8 mm in 8000 Hz frequency (48.989 dB) (Table 1).
Rate of sound attenuation (dB) in octave frequencies at different distances in the simulated ear canal of Teflon and cast iron materials and the combination of the two materials.
Discussion
The aim of the present study is determining effective frequency signals on hearing loss in human beings. In this research, the authors used the earplug manufactured according to standard. The result of noise reduction on the model showed that there is a significant difference between the noise before and after the placing the earplug, which means that the model can show the function of the earplug in attenuation of noise, and also it is indicative of being the standard of the earplug.
The results showed that the rates of sound level in Teflon canal at the distances of 17.5 mm and 25.5 mm, cast iron canal at the distance of 22.7 mm, and the canal with a combination of Teflon and cast iron at the distance of 25.5 mm reached their maximum at the frequency of 4000 Hz. The study by Agarwal showed that hearing loss had its highest rate due to confrontation with traffic noise at the frequency of 4000 Hz. 16 According to the study by Mirzakhani et al., regarding confrontation with noise and hearing loss among the key makers in the city of Tehran, hearing loss was observed mainly in the people at the frequencies of 1000 and 2000 Hz, with higher rates at 4000 and 8000 Hz frequencies. 17 Studies have shown that audiometric spaces in frequencies of 3, 4, or 6 kHz together with returning to the original state at the frequency of 8 Hz indicate hearing loss due to generated noise. 18 The base membrane at 4 kHz is usually affected by noise due to sound conduction from the ear bones. 16 Organ of Corti is more sensitive in specific frequency signals, and according to experience, the 4096 Hz frequency region is the vulnerable region in the ear, and this region tolerates the highest hearing damage in confrontation with noise. There are various and physiological and acoustical factors for that, which are stated in audiology books, factors related to the maximum threshold shift seen at the 4000 Hz region may be attributed to the physiological and anatomical differences of the basilar membrane, the direction and pattern of the travelling wave within the cochlea, deficiency in vascular flows in this region and reflection of sound wave energy in the canal, and the resonance characteristics of the external auditory19,20 (this hard walled tube, closed at one end amplifies acoustic energy in the upper frequencies by about 10 decibels). 21 Other reasons are as follows: Changes triggered by acoustic overexposure can lead to temporary threshold shifts (TTS) in auditory sensitivity. Repeated exposures can cause a chronic increase in oxidative stress leading to the loss of outer hair cells, and a permanent threshold shift in the auditory region of 3000–6000 Hz. 22
Acoustical factor of 4000 Hz notch is due to the transfer function of the ear. As any object facing a sound, the ear acts as a passive filter. A passive filter is a low pass: the high frequencies are more absorbed by the object, as high frequencies impose a higher pace of compression–decompression to the object. 23 A contributing factor to this filter system is the contraction of the middle ear muscles which attenuate transmission of sound in the lower frequencies. 20
Since sound level attenuations are different in different conditions in different distances of the simulated canal, the canal length can indicate the reason for the differences in related problems and harms in individuals. Results showed that the longer the distance between the earplug and the microphone, the sound level increased up to the distance of 25.5 mm, and after this distance, the sound level had a decreasing trend, especially for frequencies under 500 Hz. The results of this study dealt with the analysis of the damping rate of earplug in different distances of its placement in the ear canal showed that by decreasing the distance of the earplug in the ear, the rate of sound attenuation also decreases. This reduction has been more for the frequencies of 1000 Hz and less than that in comparison with higher frequencies than 2000 Hz. 3
The sound levels at different distances showed lower values at low-frequency signals. According to Lewis study, the sounds with low-frequency signals (e.g., the sound made by heavy artilleries) are less harmful than sounds with frequency signals over 1–6 kHz. 24 The other reason for the problems of noise in different frequencies can be that hearing loss is almost always occurs primarily in the frequency signals range of 4–6 Hz, as observed in audiogram. 24 Due to the shape of human outer ear canal and other reasons, human sensitivity is more at 1000–5000 Hz frequency signals. A worker confronting with 90 dB noise in that frequency range is exposed to more harm as compared to the person who is confronting with 90 dB sound in the frequency signal of 250 Hz. 25 According to this study, the rates of sound attenuation were higher in all the distances in high-frequency signals. The results show that sound is stimulated in ear canals for about 10–15 dB in frequency signals range of 2–4 Hz, which is dangerous. Middle ear has two muscles connected to the bones that become stiff at the presence of sounds with high-frequency signals, and transfer the sounds with frequency of 1500 Hz and lower. The activity of middle ear manages protections against loud noise existing in the environment. Moreover, ear lobe and ear canal improve sound frequencies. 26 Thus, human hearing system weakens some sound frequencies, having protecting role, and resonates the sound in some frequencies, having a destructive role.
Damages to cochlea starts at the beginning at frequencies ranging from 3000 to 4000 Hz. This is fixed in the first 10 years of confrontation, but it changes afterwards. The next region exposed to the impact is 6000 Hz, continued after 8000 and 2000 Hz, where the damage develops with slower speed. 25 Different sound frequency signals cause various movements of the base membrane. Hence, different frequencies stimulate different parts of the base membrane. Sounds with frequency signals lower than 1 kHz are not affected by the ear lobe. Sounds with frequency signals higher than 1 kHz, especially vocal frequencies (2–3 kHz), are stimulated considerably. 4 Sound attenuation will show an ascending trend by increasing the sound frequency signal. The rate of reduction stated on earplugs also increase by increasing the frequency, and this increasing trend is observed in the two models of earplugs.
Hearing protection devices dampen the sounds with high-frequency signals more than the sounds with low-frequency signals. The reason for it is that the energy of sounds with low-frequency signals freely enters into the space between the ear canal wall and the earplug. There are three reasons for the dependency of the frequencies. The first reason is that all the frequency signals are dampened with half of the wavelength lower than the blocking diameter (e.g., ear protection devices). Thus, the sounds with low-frequency signals that have higher wavelengths easily pass from the blockage, while the sounds with high-frequency signals having lower wavelengths are dampened easier. The second reason is mass and weight. By heavier ear mass, the damping rate becomes more. The third reason is the resonance characteristic of the ear canal. 5
Conclusion
The results showed that the highest rate of noise reduction was at a frequency of 4000 HZ. There are many reasons for that. Organ of Corti is more sensitive in specific frequencies, and according to experience, the 4096 Hz frequency region is the vulnerable region in the ear, and this region tolerates the highest hearing damage in confrontation with noise. Also, the maximum sound reduction was observed at 25.5 mm at frequencies below 250 Hz. Due to the nature of the industrial noise and the workers exposure to the high noise level at different frequencies, the simulated model can be used to determine the performance of the protective earphones and test them at different frequencies and sound pressure levels.
Footnotes
Acknowledgments
The authors would like to express their gratitude to the noise and vibration laboratory of School of Public Health, Isfahan University of Medical Sciences for providing equipment. This article is a part of the research thesis for the master’s degree in the field of Occupational Health Engineering, no.: 3941048.
Declaration of conflicting interests
The author(s) declared no potential conflicts of interest with respect to the research, authorship, and/or publication of this article.
Funding
The author(s) disclosed receipt of the following financial support for the research, authorship and/or publication of this article: This work was supported by the Medical university of Isfahan city of Iran.