
Abstract
Introduction
The COVID-19 pandemic witnessed an unprecedented “infodemic” of misinformation with severe real-world consequences. Dangerous health misinformation contributed to vaccine hesitancy and improper treatments,1,2 while false claims about the virus’s origins and spread fueled xenophobic violence. 3 For example, the label “Chinese virus” was spread globally, which led to antipathy and rejection of Chinese people. These emotionally charged claims incited hatred and violence, with documented attacks targeting Asians during the pandemic. 4 In one case, a Texas man stabbed a Burmese American family, erroneously blaming them for spreading COVID-19. Separately, a Brooklyn assailant doused an Asian woman with acid, causing severe burns.
Such misinformation thrived through a storm of factors: public anxiety during crises created cognitive vulnerabilities, while bots in social media preferentially amplified emotionally charged content. 5 People tended to believe information that aligned with their preexisting worldviews or provided simple explanations for complex situations. This phenomenon proved particularly dangerous during health emergencies, when accurate information could mean the difference between life and death.
In this environment of widespread digital misinformation, globally observed inauthentic coordination tactics, including astroturfing (where artificially manufactured online support is presented as genuine public opinion), played a significant role.6,7 State and non-state actors have exploited these tactics to amplify divisive narratives, deliberately inciting anger, fear, or xenophobic hostility in vulnerable populations. During the pandemic, weaponized misinformation fueled real-world violence, demonstrating how engineered outrage can rapidly escalate into offline harm.
This underscores the urgent need to examine emotional contagion (i.e. the spread of emotions from one person to another 8 ). A large-scale Facebook experiment showed that emotions can be transmitted online, even without nonverbal cues. 9 As people spend more time on digital media, their emotional expressions may increasingly align with those of others. 10 Research has shown that social bots play a role in stirring emotions, operating on the fringes of social systems, and targeting influential individuals with violent, inflammatory content to deepen social conflict. 11 Bots undermine traditional actors like media personalities and experts, amplify certain political messages, 12 and often display polarized emotions during contentious events. 13 They can also shape topic trends and spread negative emotions during public health emergencies. 14
Understanding how malicious actors manipulate emotions to drive engagement and polarization is critical for countering misinformation’s societal damage. Rather than focusing solely on the human-machine divide, it is more useful to explore a broader set of actors involved in emotional contagion, examining the interactive networks among them to better understand these relationships. Our study investigates these dynamics by analyzing the roles of key actors and the evolution of emotional contagion in misinformation during COVID-19.
This study aims to utilize computational methods to uncover the networks of misinformation spreaders and the mechanisms of emotional contagion, with a focus on assessing public reactions during health crises. On the whole, the research classifies misinformation content and its contributors, then examines emotional contagion over time using time series analysis. The research questions addressed include: Actor feature mining (RQ1): What types of actors participated in spreading China-related COVID-19 misinformation? Content feature mining (RQ2): How did emotion in China-related COVID-19 misinformation vary across actor types? Actor-network analysis (RQ3): What roles did different actors play within the emotion network (i.e. a directed, weighted network modeling emotional influence among actors)? Emotional contagion analysis (RQ4): How did emotional contagion evolve temporally among actors spreading China-related COVID-19 misinformation?
Methods
Data collection and preprocessing
Twitter serves as a critical platform for studying misinformation due to its role in real-time information dissemination during health crises. Its viral features (retweets, hashtags, mentions) enable rapid narrative spread, while its public API facilitates scalable data collection. The platform also attracts inauthentic actors (bots, trolls) due to algorithmic amplification of emotional content, making it a hotspot for disinformation. Prior research on political and health misinformation often uses Twitter, allowing direct comparison with existing literature.15–17 Compared to closed platforms, Twitter’s public interactions simplify tracking network dynamics and emotional contagion, ensuring methodological transparency and reproducibility.
The data collection process is shown in Figure 1. This study used Twitter’s public API v1.1 to collect English-language tweets about COVID-19, predominantly from North America and Europe, starting February 17, 2020. The data remained unaffected by Twitter’s verification process removal in October 2022. To focus on China-related misinformation, the search was narrowed using English keywords from Poynter’s fact-checking database,
18
refined with Part-of-Speech tagging in spaCy.
19
Relevant tweets were filtered for China-related entities, resulting in 341 keyword groups (examples shown in Table 1). Then, semantic modeling with Doc2vec20,21 and HDBSCAN identified clusters of similar tweets. Finally, the study collected 203,120 original tweets, 522,599 retweets, and 406,995 users, with topics primarily covering viral origins (48.9%), conspiracy theories (24.2%), authoritarian actions (8.7%), impact (8.4%), social conflict (4.3%), medium (3.8%), and preventive treatment (1.6%). These topics reflect the Poynter’s classification schema. Data collection and preprocessing. Keyword examples for each topic.

Actor feature mining (addressing RQ1)
Knowledge graph and entity analysis
To classify different verified users, this study adopted knowledge graph and entity analysis methods. Verified users on Twitter in 2020 met specific visibility criteria. For analysis, the full name of verified users was used as the entity, and the Google Knowledge Graph API and IBM Natural Language Understanding API were leveraged to obtain relevant labels 22 and classify users based on returned keywords. The APIs’ keyword outputs were cross-checked against a manually annotated subset (n = 200) of user profiles. Intercoder reliability (Cohen’s κ = 0.82) confirmed strong agreement between automated and manual labels.
Social network analysis and bot detection
To classify non-verified users, this study employed social network analysis to identify instances of “astroturfing,” where the true sponsors of a message are disguised to appear grassroots-driven. Since non-verified users can include both human and bot accounts with similar clustering behavior, new identification methods were developed. Co-tweeting and co-retweeting networks were constructed using NetworkX, and Keller’s method 23 was applied to detect groups spreading the same tweet quickly. Botometer, with over 1000 features, was used to assess bot probability, setting a conservative threshold of 0.8 to classify users as bot-like or human-like. 24 Accounts that have been deleted or blocked were also identified as exceptional users in this study.
Content feature mining (addressing RQ2)
Emotion analysis
To examine the emotional content of misinformation, this study employed a textual emotion analysis method based on an emotion lexicon. To calculate emotion scores (the frequency of emotion words in a tweet divided by the number of words in the tweet and normalized by the number of daily tweets), we used The NRC Emotion Lexicon created by the National Research Council Canada. 25 It is widely used in the international academic community and provides a categorization of eight basic emotions (anger, fear, anticipation, trust, surprise, sadness, joy, and disgust) as well as positive and negative sentiments. This provides a measure of the emotional content in misinformation, which can help to shed light on the emotional appeals that may be used to spread mis- and disinformation on social media.
Actor-network analysis (addressing RQ3)
Social network analysis
This approach was also used to explore the interactions between actors and assess their roles. Accounts of the same category were aggregated, an edge represented a retweet relationship, and the size of a node represented the in-degree value. Edge weights were defined as the count of negative words in retweeted tweets, operationalizing the directional transfer of negative sentiment between actors. This approach aligns with established sentiment analysis methods 26 and reflects asymmetric emotional contagion relation in retweet networks, where higher weights indicate stronger negative sentiment propagation from source to target. In this study, the software Gephi was used to visualize social networks.
Emotional contagion analysis (addressing RQ4)
Time series analysis
After applying the Augmented Dickey-Fuller (ADF) test and achieving stationarity with one differencing, indicating the avoidance of spurious regression, this study primarily employed the Granger causality test to investigate the interrelationship between multiple actors. Granger causality is a statistical hypothesis test for determining whether one-time series can predict another. It does not imply true causality but rather indicates a predictive relationship based on past data. This approach aimed to examine the relationship of emotional contagion on the China-related misinformation campaign.
To address multiplicity bias, we implemented three safeguards. First, we selected the optimal lag length by requiring agreement across four standard information criteria: AIC, BIC, FPE, and HQIC. All four consistently indicated lag 10, confirming a data-driven choice. Second, we required both statistical significance (p < 0.05) and theoretically plausible effect sizes for substantive interpretations. Third, we grounded results in established theory, such as astroturfing’s known negativity bias, to distinguish meaningful patterns from statistical noise. Sensitivity analyses with alternative lags (8–12) further supported robustness, minimizing false discoveries while maintaining transparency.
Results
Actor feature mining (addressing RQ1)
Knowledge graph and entity analysis
Distribution of verified user types.

Social network analysis and bot detection
Classification of astroturfing accounts and their characteristic.
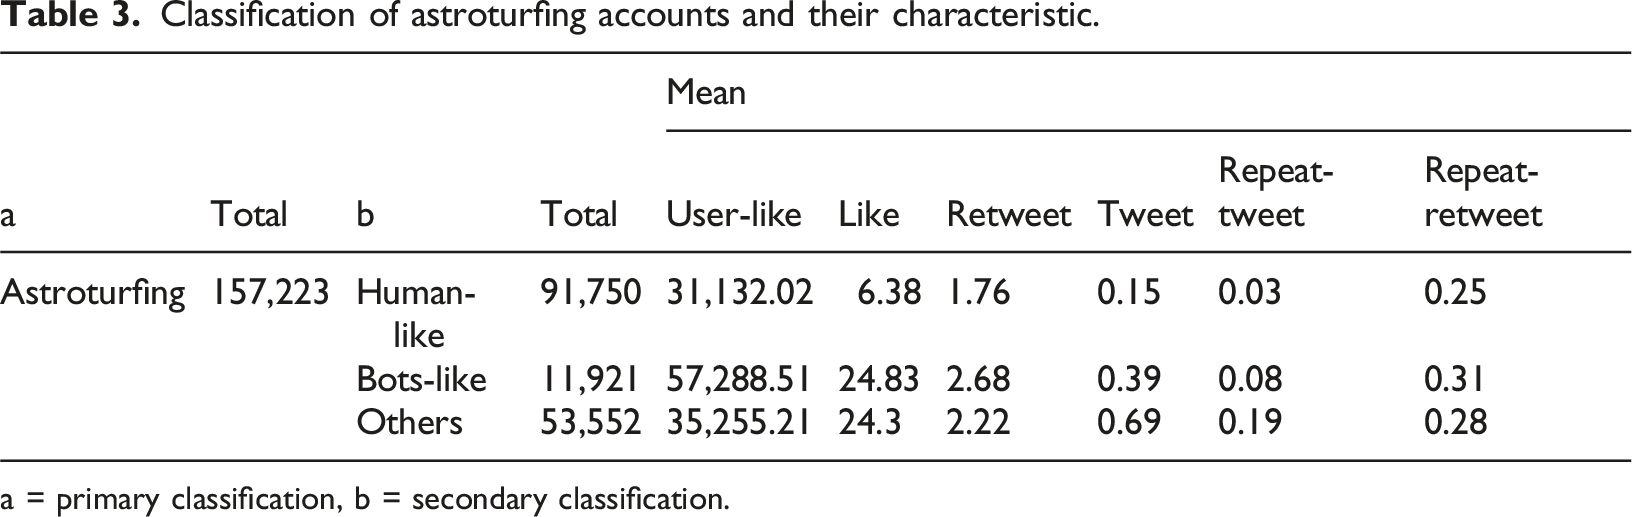
a = primary classification, b = secondary classification.
Final classification of actors and their characteristics.

Astroturfing accounts were highly active, contributing 59.81% of retweets and 67.23% of repeat retweets. Non-astroturfing bots engaged heavily in likes (M = 32,019.18) but did not significantly spread misinformation via retweets. Influential users in news and politics had higher averages in likes and tweets, with news (M = 5.47) and NGOs & activists (M = 3.20) being particularly active in original tweets. This indicates that authentic, influential users in news played a key role in spreading misinformation, challenging the idea that automated technologies were the main drivers.
In summary, for RQ1, astroturfing accounts and bots spread misinformation mainly through retweets and likes, while authentic users, particularly in the news, played a unique role by posting original tweets. Observing the interactions between different types of actors is also necessary.
Content feature mining (addressing RQ2)
Emotion analysis
The distribution of emotion scores for various actor types was analyzed (Figure 2). Inauthentic actors, such as astroturfing, exceptional users, news, and bots, showed higher negative emotion scores than positive emotions. Astroturfing had the highest negative emotion score (median = 0.040), followed by exceptional users (median = 0.037), news (median = 0.035), and bots (median = 0.032). In contrast, the highest positive emotion scores were in politics (median = 0.028) and NGOs & activists (median = 0.0279). Positive emotion scores for inauthentic actors were lower: astroturfing (median = 0.024), exceptional users (median = 0.023), and bots (median = 0.020). Further analysis of negative emotions (Figure 3) revealed that astroturfing and news had the highest scores in categories like disgust, fear, anger, and sadness. For example, exceptional users had a median disgust score of 0.01, while astroturfing scored 0.009. Distribution of emotion scores. Distribution of negative emotion median scores.
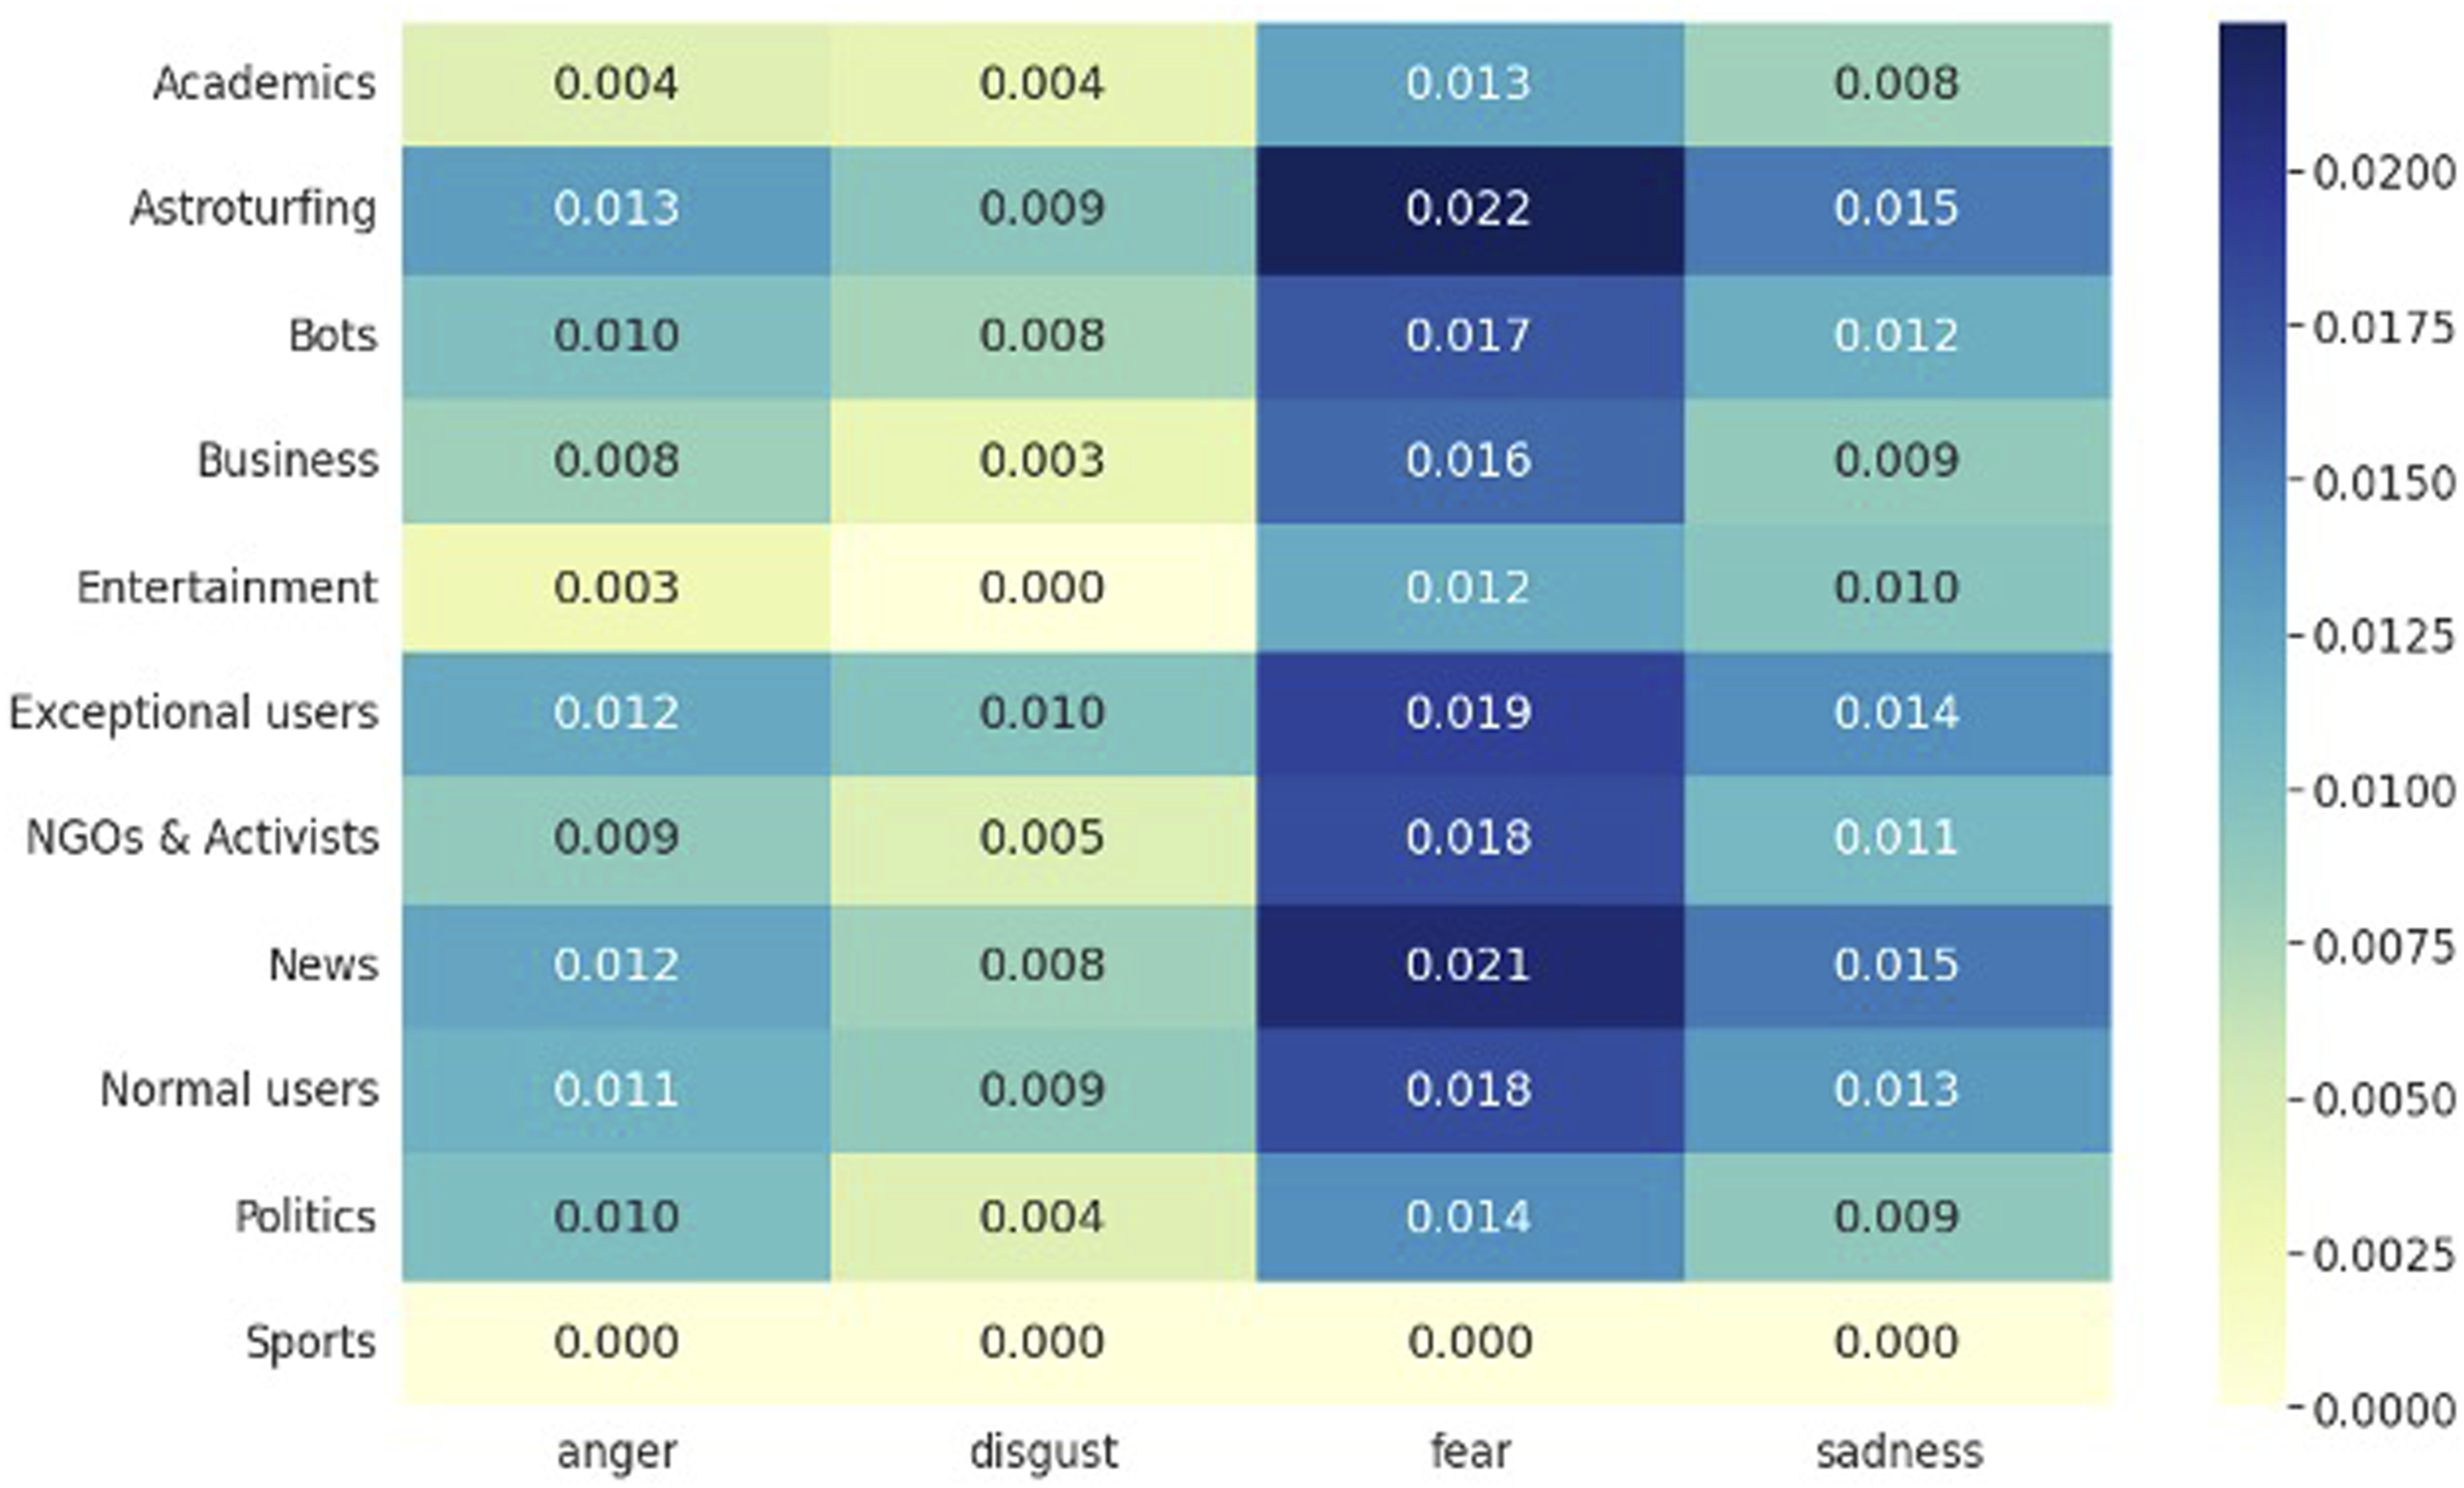
Therefore, for RQ2, it can be concluded that negative sentiment was more prominent in inauthentic actors and news, while positive sentiment showed a different pattern.
Actor-network analysis (addressing RQ3)
Social network analysis
The emotion score distribution showed that inauthentic actors were more likely to spread negative emotions. To observe emotional contagion, the study used social network analysis of retweet relationships for RQ3.
Figure 4 illustrates that astroturfing accounts amplified negative emotions from news and political actors, which were then transmitted to normal users. News, astroturfing, and political actors had the highest weighted out-degree, mainly acting as senders of negative emotions (Table 5). Astroturfing accounts not only sent negative messages (weighted out-degree = 109,504) but also received the most negative messages (weighted in-degree = 344,726), followed by normal users (weighted in-degree = 121,314). Astroturfing accounts became a major transit node for negative information. Overall, news and political actors, astroturfing accounts, and normal users were key nodes, with their dynamic interactions warranting further observation. Retweet the relationship between negative words. The weighted in-degree value of a node was represented as the node size, and the frequency of negative words in retweeted tweets was represented as the thickness and transparency of the edge. Weighted In-degree and out-degree of actor node.

Emotional contagion analysis (addressing RQ4)
Time series analysis
VAR Granger causality test (negative emotion).

VAR Granger causality test (positive emotion).
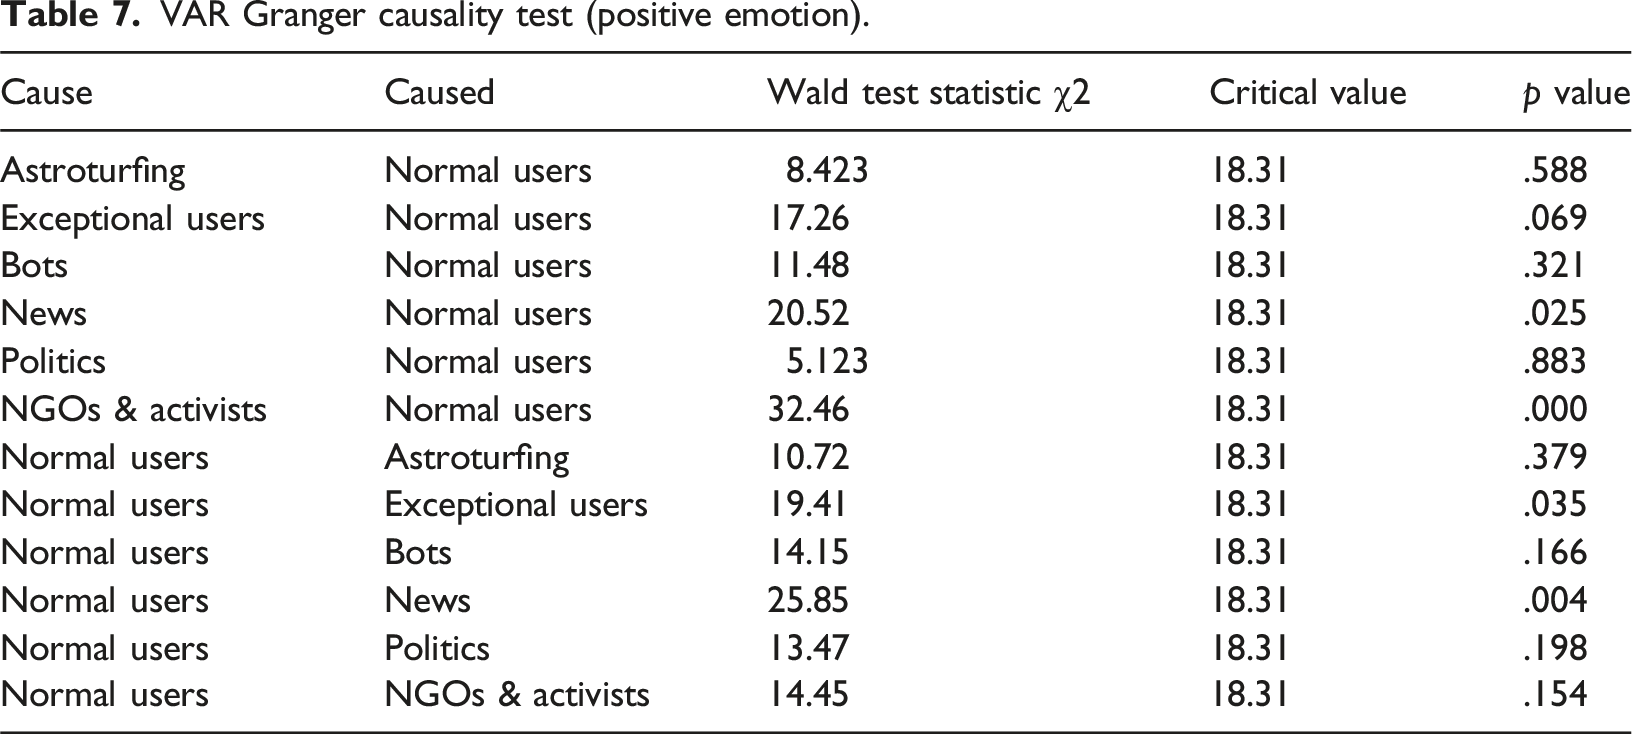
The findings indicated that the negative emotions of inauthentic and political actors significantly Granger caused the negative emotions of normal users (Table 6). For example, significant relationships were found between Astroturfing and Normal users (χ2 = 40.45, p = .00), Exceptional users and Normal users (χ2 = 19.22, p = .038), and Politics and Normal users (χ2 = 18.39, p = .049). In contrast, no significant Granger causality was found for positive emotions between these actors and normal users (Table 7), such as between Astroturfing and Normal users (χ2 = 8.42, p = .588) or Politics and Normal users (χ2 = 5.12, p = .883). This indicates that negative emotions from inauthentic and political actors significantly influenced normal users, while positive emotions did not.
Additionally, normal users also had reverse emotional contagion effects on astroturfing accounts (χ2 = 45, p = .000), exceptional users (χ2 = 37.85, p = .000), news (χ2 = 22.94, p = .011), and NGOs & activists (χ2 = 24.68, p = .006) (Table 6). Inauthentic actors could capture and amplify the negative emotions of normal users, creating a closed loop of emotional contagion.
Discussion
In summary, the key findings of this study are: (1) Multiple actors spread misinformation, with hybrid human-machine astroturfing accounts and bots playing a significant role, mainly spreading misinformation through retweets and likes, while influential users in news were more active in posting original tweets. (2) Inauthentic actors (astroturfing accounts, bots, exceptional users) and news actors were more likely to spread negative misinformation. (3) In the retweeting network, astroturfing accounts amplified the negative emotions of news and political users, which were then transmitted to normal users. (4) Negative emotions from inauthentic actors and political users were Granger causes of negative emotions in normal users, while positive emotions were not significant.
This study examines the mechanism of digital emotion contagion in health misinformation, particularly driven by hybrid human-machine astroturfing accounts. While prior research has extensively documented the role of bots in disseminating COVID-19 misinformation,5,7,27 the complex interplay between human and machine actors in computational propaganda is often overlooked. As a study demonstrated, false news spreads farther and faster than the truth, partly due to its emotional novelty. 28 Building on these findings, our analysis suggests that hybrid coordination may exacerbate this effect by strategically amplifying negative emotions, thereby accelerating misinformation diffusion. Additionally, this study highlights the importance of integrating various computational methods for misinformation research. Tools like Botometer have limitations in identifying new users in specific events, 29 whereas the astroturfing collaborative networks method offers a more comprehensive view of digital emotion contagion. This underscores the need for future studies to select flexible and appropriate computational methods based on their research objectives.
Digital emotion contagion is mediated by platform biases and organized misinformation, often amplifying strong negative emotions. This misinformation can lead to public psychological reactions such as panic, incitement, and exclusionary behaviors (e.g., discrimination), harming public communication. It also contributes to stigma, hinders health measures adoption, and fuels distrust in authorities, potentially causing mass panic. 30 Additionally, the politicization of health issues, especially under right-wing leaders like Donald Trump, has been heavily influenced by computational propaganda and affective politics. 31 The study’s findings offer a framework for understanding the spread of misinformation in multi-agent networks and its implications for health issues.
While this study primarily focuses on misinformation and emotional contagion on Twitter, it is important to acknowledge that these phenomena extend to other digital platforms, particularly those with younger and more diverse user bases. For instance, TikTok has emerged as a significant vector for emotionally charged content, including medical misinformation, especially in non-English-speaking regions. 32 Future research should explore these dynamics in other digital ecosystems to develop more comprehensive strategies for mitigating misinformation.
Limitation
This study has several limitations. First, while it focused on online digital emotion contagion, particularly in digital health monitoring, the short- and long-term psychological effects on users require further examination. Second, as the analysis relied solely on Twitter data, platform-specific algorithms may have shaped contagion patterns; cross-platform comparisons would strengthen generalizability. Third, the emotional analysis was also restricted to Twitter text, leaving multimodal sentiment analysis for future exploration, including video and image data. Finally, our analysis did not disentangle platform-level emotional amplification from inter-actor contagion dynamics, though the latter remains salient even under uniform visibility conditions. Future work should integrate platform affordances with network-level actor strategies.
Conclusion
This study develops a computational framework to explore digital emotional contagion in health misinformation, focusing on hybrid human-machine astroturfing accounts. Astroturfing accounts acted as key transit nodes, creating a closed loop of negative emotional contagion in misinformation spread. The framework provides a tool for monitoring emotional responses in public health crises, with findings applicable to other emergencies beyond COVID-19.
Footnotes
Ethical considerations
This study involved the analysis of secondary data collected from social media platforms. The data set includes publicly available information from social media accounts. As such, ethics approval was not sought. The results are presented in aggregate form and do not contain any identifiable information, ensuring the privacy of the individuals whose data were included in the study.
Author contributions
CQY conceptualized the study, collected and analyzed the data, designed visualizations, and drafted the manuscript with subsequent revisions. LQ supervised the research project, provided strategic direction, reviewed and provided critical feedback on manuscript drafts, and approved the final version of the paper. Both authors contributed to refining the content and ensuring the accuracy of the research.
Funding
The authors disclosed receipt of the following financial support for the research, authorship, and/or publication of this article: This research was supported by Key-Area Research and Development Program of Guangdong Province; ID:2022B101010004; Project of Collaborative Innovation Centre for Chinese Culture Transmission and Communication in Hong Kong, Macao, Taiwan and Overseas, Jinan University; JNXT2022002; Chinese Special Funds for Basic Research Operating Costs of Central Universities; ID:23NJYH11.
Declaration of conflicting interests
The authors declare that there are no conflicts of interest regarding the publication of this paper.
Data Availability Statement
The data that support the findings of this study are available from the corresponding author upon reasonable request. Due to privacy and ethical considerations, some data may not be publicly available.