
Abstract
Introduction
Hypothesis generation is an important and valuable process in nearly every research project. A solid hypothesis is critical and a foundation for conducting impactful research. The hypothesis marks a project’s starting line. Exploring and understanding these processes and their influencing factors are crucial for improving hypothesis generation, especially to initiate a research project. Past research into the mechanisms of hypothesis generation has focused on clinical care and pure scientific settings.1–9 Additionally, two textbooks offer systematic introductions to scientific thinking, including hypothesis generation.10,11 However, more insights are needed regarding the mechanisms and processes of hypothesis generation for clinical research projects, as much is still unknown regarding factors influencing hypothesis generation in such a context.
There are at least two types of research hypotheses: (1) hypotheses based on experimental observations, where researchers may observe phenomena and seek to understand them further, and (2) data-driven scientific hypothesis generation, where researchers analyze various data sets and may identify patterns or differences that prompt further exploration. 12 While both types are valuable, this case study primarily focuses on data-driven hypothesis generation.
Our team conducted a randomized controlled human subject study to explore hypothesis generation by clinical researchers and documented the data-driven hypothesis generation processes, i.e., analyzing data sets and developing hypotheses. We recorded their thought processes (including multiple cognitive events, a granular unit of thought processes used by the participants while generating hypotheses) via think-aloud protocol, the time it took to generate hypotheses, etc.12–17 The quality of these hypotheses was rated by the same expert panel by using the same clinical research hypothesis quality evaluation instrument. 16 In this manuscript, we only focus on inexperienced clinical researchers (based on their years of experience, publications, and roles in research projects).13,14
Patel’s studies demonstrate differences in hypothesis generation in clinical diagnosis among clinicians with different experience levels.1,2,18,19 We, therefore, separate participants based on experience levels. Understanding hypothesis generation gives us insight into ways to improve the hypothesis generation process and how outside tools and factors influence hypothesis generation. Additionally, our team developed VIADS (a visual interactive tool for filtering and summarizing large health datasets coded with hierarchical terminologies) as a secondary data analysis tool to organize, filter, summarize, and visualize large datasets and facilitate data-driven hypothesis generation. 13 We then conducted utility and usability studies of VIADS. We have published the study protocol, 13 the usability study of VIADS, 15 clinical research hypothesis quality assessment instruments, 16 cognitive events (i.e., cognitive activities used to generate hypotheses, e.g., “Seeking for Connection”, an attempt to draw connections between data points) used during hypothesis generation, 12 and comparison of hypothesis generation between VIADS users and users of other tools.14,17,20
To further explore the data collected from the randomized controlled study, in this manuscript, we concentrated on the highest and lowest-rated hypotheses regarding quality and analyzed associated factors to better understand the hypothesis generation process. Subsequently, we utilized data from nine participants who generated these highest and lowest-rated hypotheses and compared their overall hypothesis generation processes and results. While other published results of the study were based on comparisons at the group level, this manuscript focuses on comparisons of the individual hypotheses and participants. Therefore, this case study paper examines an existing data set via different lenses that have not been explored or published. We aim to provide additional insights into understanding factors that may influence the quality of scientific hypotheses within clinical research. Such insights can inform the development of future informatics tools to support the hypothesis generation process.
Methods
Case study purpose and analysis strategies
In order to gain more insights about the quality of hypotheses and associated factors, we compared the quality ratings of hypotheses and examined the associated factors, such as the time needed to create hypotheses, the number of hypotheses generated by each participant, the number of cognitive events used per hypothesis, and the participants’ clinical research experience and demographics. Such analysis can add a higher resolution of granularity, providing a deeper understanding of the factors that may contribute to the quality of the hypotheses generated during the process.
We compared (1) the five highest-rated hypotheses (Top 5) and the five lowest ones (Bottom 5) and (2) all the participants who generated the Top 5 and the Bottom 5 hypotheses. Both the methods and results sections were organized by subheadings: (1) the hypotheses (Top 5 and Bottom 5) and (2) all the participants who generated the Top and Bottom 5 hypotheses. The data collection, qualitative coding, data processing, and quantitative comparison methods and results in the original study were published, respectively.12–17,20,21 Given that this is a case study paper, we conducted a secondary analysis of the data collected from the original study to explore the quality of the hypotheses generated. The results are descriptive without statistical analysis due to the nature of the case study. The results presented in this paper complement the published group comparisons, i.e., we used an amplifier to examine each of the Top and Bottom 5 cases one by one and shared the findings.
Context of the study
The original published study was a randomized controlled human subject study that compared hypothesis generation by clinical researchers using the same data sets and different tools within 2 h. The study processes were recorded, coded, analyzed, and compared. The group comparison (VIADS vs other tools, e.g., SPSS, SAS, R) of the original study has been published.12,14,15,17 After organizing and writing the group comparison results, we realized the data we collected in the original study had not been fully utilized and interpreted since data from individual hypotheses and individual participants had not been examined fully through the group comparisons. Therefore, we conducted this case study to examine more specific aspects of the data collected, particularly the quality of the hypotheses generated (with the highest and the lowest ratings and the participants who generated them). Due to the importance of the quality of hypotheses and our limited understanding of the factors associated with hypothesis quality, we decided to focus on several extreme cases of hypotheses and participants first in this study.
Brief description of the randomized controlled study
After IRB approval, recruitment, and scheduling, all participants used identical health data sets coded with ICD9 (International Classification of Diseases–9th Revision) codes, adhered to the same study scripts and think-aloud protocols (i.e., verbally “work through” and articulate what they are doing while doing it), were facilitated by the same study coordinator, and used 2 h to analyze data and to generate their hypotheses. Participants were recruited through multiple channels, including team members, professional associations, and international conferences. 14 The inclusion and exclusion criteria were previously published. 13 The participants were compensated based on the time used during study sessions. 14 Participants were randomly assigned to VIADS or the other groups (any chosen tool, e.g., R, SPSS, Excel). 13 After the study session, participants completed surveys regarding their background and clinical research experience. 13 The participants’ screen activities and audio were recorded during the study sessions.
Next, the study recordings were transcribed by a professional transcription service and coded by our team. The time required to generate each hypothesis was examined and averaged for each hypothesis and each participant. Subsequently, cognitive events were coded using Atlas.ti 9 based on an established cognitive process framework.12,14,17,20 Both inductive and deductive approaches were used to analyze the hypothesis generation processes, focusing on identifying the process’s cognitive events. The inductive approach was used to develop the cognitive process framework, and the deductive approach was used to code the study transcripts based on the framework. For instance, “analyze data” was assigned as a cognitive event whenever a participant examined the data to comprehend them before formulating a hypothesis. 12 Cognitive events are granular units of thought processes used by the participants while generating hypotheses. Codes (such as “analyze data”) and cognitive events were used interchangeably during data analysis. The transcriptions from the pilot study were used as pilot coding materials to establish the coding principles and training materials for the two research assistants to discuss their coding practice, understanding, confusion, and differences. Then, two research assistants independently conducted time and cognitive event coding based on coding principles, compared their results, and consolidated any discrepancies. Any discrepancies were resolved by including a third team member and refining coding principles. The total number of cognitive events (codes) per participant and the average number of codes used per hypothesis were calculated.
Subsequently, an expert panel comprising seven members rated the hypotheses based on established clinical research hypothesis quality evaluation metrics and instruments.16,21 The comprehensive instrument includes 10 items (validity, significance, novelty, clinical relevance, potential benefits and risks, ethicality, feasibility, testability, clarity, and researcher interest level) and 39 subitems (e.g., scientific validity and clinical validity) to measure the quality of hypotheses in clinical research. 16 Ratings were conducted using a 5-point Likert scale, and the quality rating was determined by an average score among all expert panel members. 16 During the evaluation, the expert panel utilized a three-dimensional instrument (i.e., validity, significance, and feasibility) following a reliability check. Therefore, each hypothesis received a quality rating between 3 and 15.
Results
We organized the results into two main sections: hypotheses and participants who generated these hypotheses. Each section includes the highest and lowest-rated hypotheses while examining factors that may be associated with the ratings, such as cognitive event (code) usage, time allocation, and demographics. Figure 1 provides a visual overview of the study and results. The visual study flow and the results overview (the results include two sections: (1) top 5 and bottom 5 hypotheses, (2) all the hypotheses generated by participants who generated top 5 and bottom 5 hypotheses).
Hypothesis
The Top 5 and the Bottom 5-rated hypotheses
Figure 2 provides comparisons of the time required to generate the top 5-rated and the bottom 5-rated hypotheses via VIADS or other tools. For instance, the highest-rated hypothesis, H9 by CP1 (coded participant 1; H9, hypothesis #9; NV- Non-VIADS participant), had a rating of 13 and took 5 min and 37 s to generate (Figure 2). Comparison of the top 5-rated (blue bars) and the bottom 5-rated (red bars) hypotheses and time needed (orange). (C- control, V- VIADS; CP, coded inexperienced participants; H, hypothesis).
Observed differences
Time usage
The time required to formulate a hypothesis varied considerably, particularly for the bottom 5-rated hypotheses (Figure 2, orange line). For instance, the longest time taken to generate a hypothesis is CP7’s Hypothesis 7, 0:07:54 (H:MM:SS), whereas the shortest time taken to generate a hypothesis is CP8’s Hypothesis 9, which took only 0:01:05 to generate. Both hypotheses were in the bottom 5-rated hypotheses. The average time it took to generate the top 5-rated hypotheses was 0:04:10, while the average time it took to generate the bottom 5-rated hypotheses was 0:04:24.
Cognitive event usage
The cognitive events used to generate the top 5 and the bottom 5-rated hypotheses are compared in Figure 3. Cognitive events used in the top 5 (blue) and the bottom 5-rated (red) hypotheses. (C- control, V- VIADS; CP, coded inexperienced participants; H, hypothesis).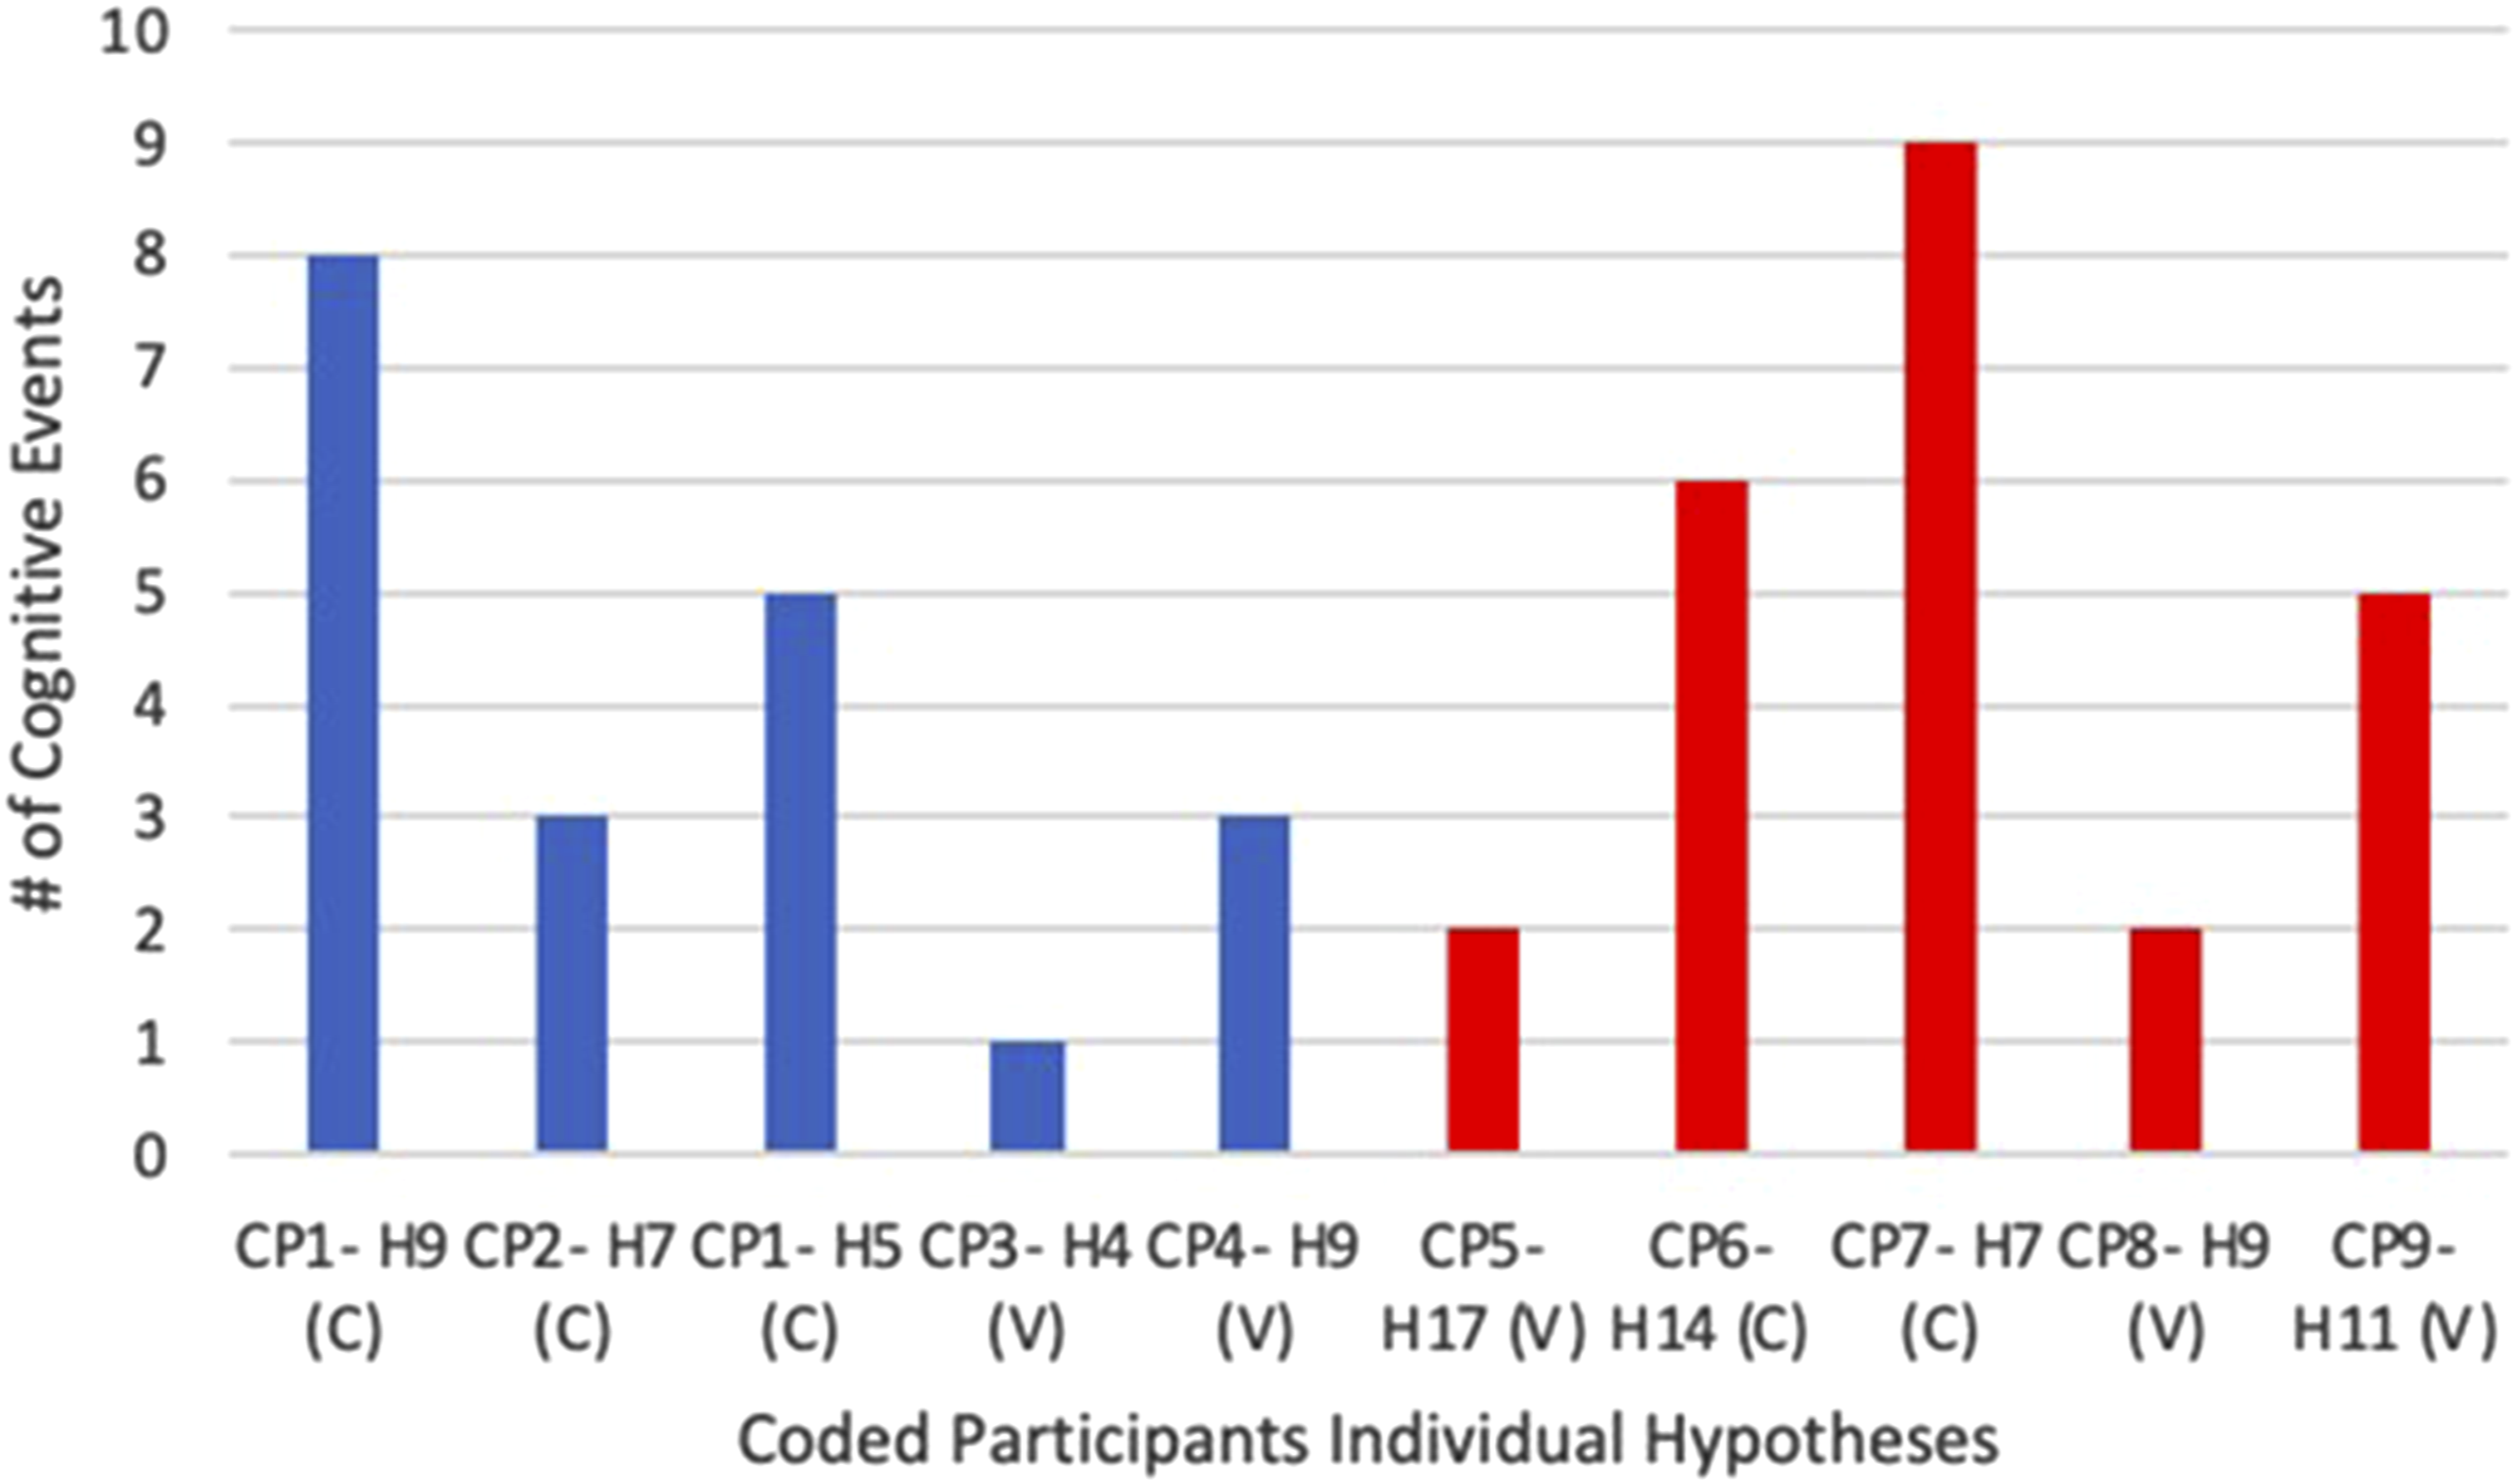
The number of cognitive events utilized to generate the Top 5 and the Bottom 5-rated hypotheses exhibited considerable variability (Figure 3). Participant 7 (i.e., CP7) employed nine cognitive events (the most) to generate Hypothesis 7. Conversely, Participant 3’s (i.e., CP3) Hypothesis 4, used just one (the least). Overall, participants with the Top 5 hypotheses utilized a total of 20 cognitive events to generate their hypotheses, while those with the Bottom 5 hypotheses utilized a total of 24 cognitive events.
Highest versus lowest rated hypothesis comparison
Participant 1’s hypothesis 9 received a rating of 13 (the highest), whereas Participant 5’s hypothesis 17 received a rating of 6.1 (the lowest). Here are the two hypotheses: • I hypothesize that HPV vaccines made a difference in cervical cancer prevalence. To look into the last 10 to 15 years [or it depends on how long has the HPV vaccine been implemented broadly] of cervical cancer incidence data longitudinally to check if there is a correlation between the decreased cancer incidence and the implementation of the HPV vaccine broadly. (Participant 1’s hypothesis 9, CP1-H9) • #366 (ICD9 code): Cataracts had a diagnosis frequency of 746 in 2015 and 331 in 2005. The hypothesis is that more patients, especially lower economic status patients, were diagnosed early in 2015, contributing to higher diagnosis frequency in 2015. (Participant 5’s hypothesis 17, CP5-H17)
Comparison of the highest and lowest individual hypothesis ratings.
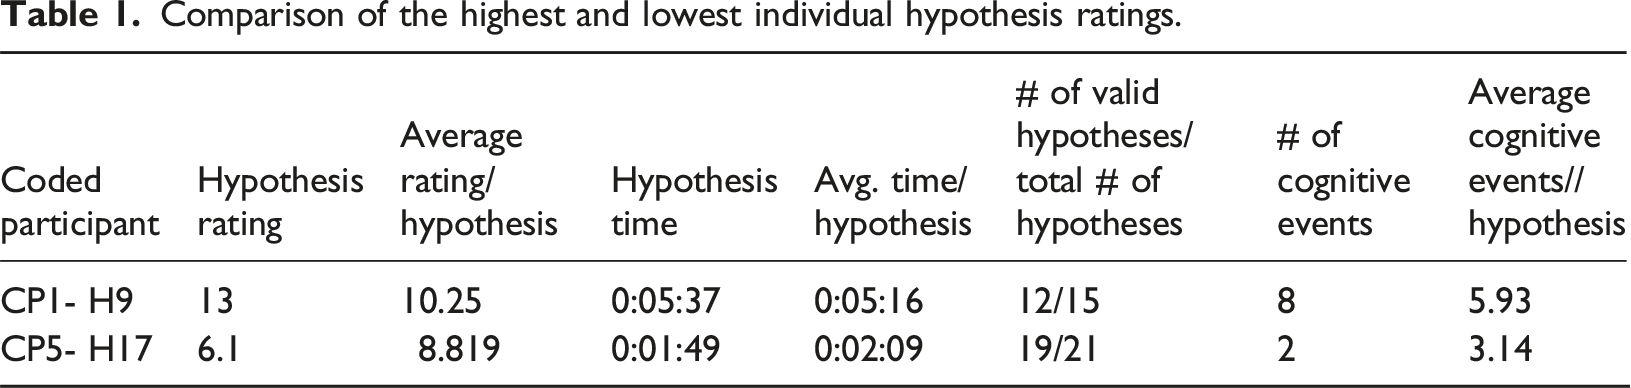
Participant 1’s 9th hypothesis (CP1-H9, the highest rating) required significantly more time (0:05:37) and cognitive events (8) than Participant 5’s 17th hypothesis (CP5-H17, the lowest rating), which took 0:01:49 and two cognitive events. Notably, both participants used times similar to the average time per hypothesis, respectively, to generate these two hypotheses (Table 1). Participant 1 appeared to utilize more cognitive events to generate Hypothesis 9 (8) than the average cognitive events used per hypothesis (5.93). In contrast, Participant 5 seemed to employ slightly fewer cognitive events for Hypothesis 17 (2) than the average (3.14).
For comparison, Participant 1 used the following cognitive events flow to generate hypothesis 9 (the highest rated): Pause/think → Analyze Data (x2) → Use Suggestion from Colleague → Analyze Data → Use Analysis Results & Seeking for Connection → Search/ask for more evidence → Use Analysis Results & Seek for Connection.
Participant 5 used Analyze Data → and Use Analysis Results & Seeking for Connection to generate hypothesis 17 (the lowest rated).
Participants
Participants that generated the Top 5 and Bottom 5-rated hypotheses
Four participants generated the Top 5 hypotheses, and five participants generated the Bottom 5 hypotheses. Figure 4 shows the average quality rating
The average quality rating per participant and time per hypothesis. Participants generated the top 5 (blue), and those generated the bottom 5-rated hypotheses (red). (C- control, V- VIADS; CP, coded inexperienced participants).
Observed differences
Time usage
The average time participants took to generate their hypotheses varied significantly, especially among participants with the Bottom 5-rated hypotheses (Figure 4). For instance, CP7 took 0:09:26 per hypothesis (the longest), while CP3 took 0:01:42 (the shortest) to generate each hypothesis. The average time it took for the participants who generated the top 5-rated hypotheses to generate each of their hypotheses was 0:03:39, while the average time it took for the participants who generated the bottom 5-rated hypotheses to generate each of their hypotheses was 0:04:57.
Cognitive event (code) usage
Figure 5 shows each participant’s average number of cognitive events used while generating each hypothesis.
CP7 used the highest average number of cognitive events (6.31 codes/hypothesis, Figure 5), while CP3 had the lowest average number of cognitive events (2.60 codes/hypothesis).
Valid rates
During the hypothesis quality rating process, any hypothesis scored at “1” (the lowest rating) for validity by three or more experts was considered invalid. Among participants with the Top 5 hypotheses, CP1 had 12 valid hypotheses out of 15 (80%), CP2 had 9/10 (90%), CP3 had 8/15 (53.33%), and CP4 had 8/9 (88.89%). For participants with the Bottom 5 hypotheses, CP5 had 19 valid hypotheses out of 21 (90.48%), CP6 had 13/16 (81.25%), both CP7 and CP8 had 5/13 each (38.46%), and CP9 had 7/14 (50%).
Demographics
Participants’ demographics and experiences.

YOE, years of experience; TOR, type of role. CP1 to CP4 have the highest-rated hypotheses, while CP5 to CP9 have the lowest.
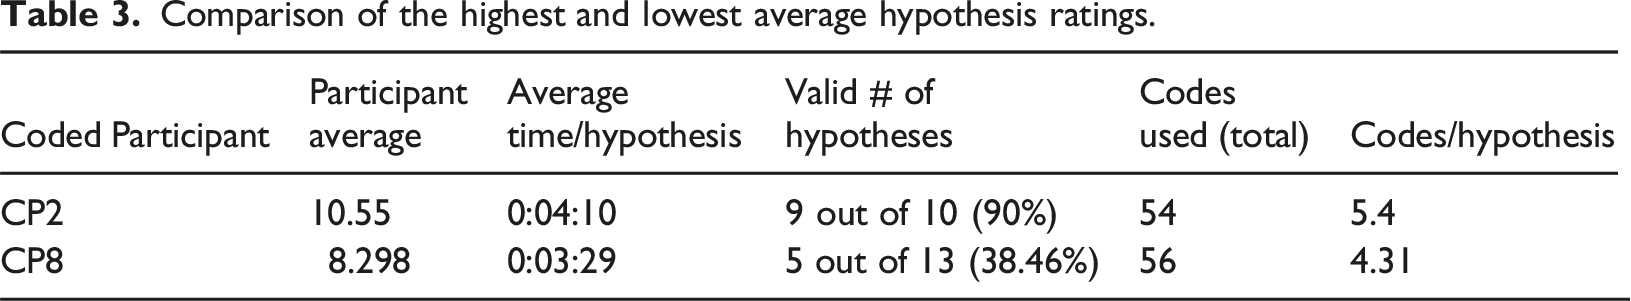
Comparing participants with the highest and lowest average ratings
Comparison of the highest and lowest average hypothesis ratings.
Summary of results
Participants used similar lengths of time per hypothesis (i.e., difference 0:03:03) when generating the Top 5 hypotheses compared to those who generated the Bottom 5 hypotheses (i.e., difference 0:07:13). Participants who generated the Top 5 hypotheses also utilized slightly fewer cognitive events on average compared to the ones with the Bottom 5 hypotheses (4 per hypothesis vs 4.8 per hypothesis). When comparing the highest and lowest-rated hypotheses, the highest-rated hypothesis required more time and cognitive events than the lowest-rated hypothesis (0:05:37 vs 0:01:49; 8 vs 2). Comparing the participants who generated the Top 5 and the Bottom 5 hypotheses utilizing their total hypotheses generated throughout the study session, the participants with the Top 5 hypotheses again used similar lengths of time to generate each hypothesis on average (0:03:34 vs 0:07:17). They used fewer cognitive events per hypothesis (3.498 vs 4.626). They also had a higher valid rate of hypotheses (75.51% vs 63.63%) and generally had more experience with clinical research. When comparing the two participants who generated the highest and the lowest rated hypotheses using their total hypotheses in this case study, the higher-rated participant utilized slightly longer time and more cognitive events per hypothesis (0:04:10 vs 0:03:29; 5.4 vs 4.31) on average and had a much higher percentage of valid hypotheses (90% vs 38.46%).
Discussion
Time usage for hypothesis generation
We examined individual participants and their hypotheses to obtain insights about how and where technology support may be valuable. We also compared the Top 5 to the Bottom 5- rated hypotheses (Figure 2).
Regarding time usage, which is the time needed to generate each hypothesis, notable differences emerge when comparing the Top 5 to the Bottom 5 rated hypotheses. The time used to generate the Top 5 rated hypotheses showed fewer variations (difference 0:03:03) as compared to the time used to generate the Bottom 5 rated hypotheses (difference 0:07:13). The latter is more than twice the former. A similar trend was observed when we compared the average time used to generate each hypothesis by participants who generated the Top 5 to those who generated the Bottom 5-rated hypotheses (Figure 4). Once again, the average time per hypothesis among the participants who generated the Top 5 shows a significantly smaller variation than those who generated the Bottom 5 rated hypotheses (difference 0:03:34 vs 0:07:17, Figure 4). The results indicate that higher-rated hypotheses are associated with a relatively more stable time (smaller variations).
However, if we look at the highest (CP1 H9, rated at 13) and the lowest-rated (CP5 H17, rated at 6.1) hypotheses, we notice something different. CP1 took 0:05:37 to generate H9 and CP5 took 0:01:49 to generate H17. The average time it took to generate the top 5-rated hypotheses (0:04:10) is slightly shorter than the average time it took to generate the bottom 5-rated hypotheses (0:04:24). That is, the individual extreme hypotheses did not show similar trends to the aggregated top 5 and bottom 5-rated hypotheses results regarding time usage.
Interestingly, when we compare the two participants (CP2: the highest average rating, 10.55; CP8: the lowest average rating, 8.30) and their average time usage to generate each hypothesis, we noticed a similar trend to extreme hypotheses. That is, CP2 used a slightly longer time than CP8 per hypothesis (0:04:10 vs 0:03:29). In comparison, the average time it took for the participants who generated the top 5-rated hypotheses to generate each of their hypotheses was shorter than those participants who generated the bottom 5-rated hypotheses (0:03:39 vs 0:04:57). Once again, the highest and the lowest rating participants did not show a similar trend to the participants who are in the top 5 or the bottom 5 groups.
Literature indicates that individuals with high time urgency tend to generate lower-rated hypotheses. 22 CP5 had to use a tool that he/she had only learned just an hour before the study session (VIADS), which could have inadvertently resulted in a feeling of urgency and cognitive overload, thereby potentially negatively affecting the quality ratings of CP5’s hypotheses. It is also plausible that cognitive overload from attempting to learn to use VIADS could have influenced these results negatively. Findings from a study by Dasgupta et al. support the idea that often, the “brain trades off accuracy and computational cost to make efficient use of its limited cognitive resources to approximate probabilistic inference”. 23
The discrepancy regarding time usage between the top 5 and bottom 5 and the highest and lowest rating hypotheses indicates the real relationship is far more complicated than our observations. The results shared in this study should be treated as cases that may provide insights for further testing; no generalization should be inferred.
Cognitive events during hypothesis generation
Another crucial factor to consider is cognitive events used in generating hypotheses. We noted the Top 5 group utilized slightly fewer cognitive events (4/hypothesis) than the Bottom 5 (4.8/hypothesis) on average, i.e., the Bottom 5 used 20% more cognitive events per hypothesis on average.
The participants who generated the Top 5 rated hypotheses employed an average of 3.498 codes (i.e., cognitive events) per hypothesis, whereas the participants of the Bottom 5 utilized an average of 4.626 codes per hypothesis. This finding aligns with the comparison between the Top 5 and the Bottom 5 rated hypotheses, suggesting that lower cognitive event usage may positively associated with the ratings of hypotheses.
However, like time usage, cognitive events demonstrate a similar trend when looking at the highest and lowest-rated hypotheses or participants. CP1 H9 (the highest-rated hypothesis) took 8 cognitive events to generate, and CP5 H17 (the lowest-rated hypothesis) took 2. A similar trend was noted between the highest (CP2) and lowest (CP8) average rating participants: CP2 used an average of 5.4 cognitive events to generate each hypothesis, while CP8 used 4.31. Like time usage, the results of cognitive events should be used as cases. The number of cognitive events used to generate hypotheses and their relationships to the quality of hypotheses need to be examined carefully in a larger-scale study.
Participants demographics
Interestingly, there are notable discrepancies when examining the demographics and experiences of participants in this case study. For instance, CP1 has the most extensive experience in hypothesis generation, study design, and data analysis, aligning with the expectation that greater experience would yield higher-rated hypotheses. However, outliers such as CP3 and CP4, with minimal experience (i.e., less than 2 years of experience in hypothesis generation, study design, and data analysis) and collaborator roles, produced some of the highest-rated individual hypotheses. Conversely, participants like CP5, despite holding prominent roles in hypothesis generation and possessing more experience in the field, produced one of the lowest-rated individual hypotheses.
CP2 (the highest average rating) has more experience in hypothesis generation than CP8 (the lowest average rating), while both participants had similar experience levels in data analysis and study design. CP2 held a leading role, while CP8 served as a research coordinator in the past. CP2 maintained a slight advantage in experience concerning hypothesis generation, which could have influenced the rating and validity rate of their hypotheses.
The results suggest the relationships between one’s experience level and the quality of hypotheses may be more complicated. Additional studies on these aspects are needed.
On the contrary, the hypotheses’ valid rate demonstrates a positive association with higher-rated hypotheses compared to those with lower ratings. The participants of the Top 5 generated 37 (out of 49, 75.51%) valid hypotheses, whereas participants of the Bottom 5 had 49 (out of 77, 63.63%) valid hypotheses.
Strengths and limitations
One of the strengths of this study lies in its detailed examination and comparison of hypothesis generation through different lenses: at the hypothesis level, at the participant level, as well as examining them individually or as a group. We compared the time needed and cognitive events used during hypothesis generation and the participants’ demographic factors based on hypothesis quality ratings. This study provides systematic comparisons between the higher-rated and lower-rated hypotheses and valuable insights with comprehensive raw data collected during the data-driven hypothesis generation process. This study is also related to the nature of the tools used to support the process of hypothesis generation by experienced and inexperienced researchers.
With a small cohort of nine participants, the study enabled us to have a deeper examination and a thorough comparison between individuals who generated higher-rated and lower-rated hypotheses, even though it has limited generalizability. This approach offers a nuanced understanding of differences in their hypothesis generation processes and also provides an important starting point to explore the complex and crucial process. This manuscript complements our prior reported results, which focused on group comparisons.12–15,20
However, the study also has its limitations. First, the time constraint of the original study session, capped at 2 h, may have influenced participants’ ability to generate hypotheses naturally, potentially introducing bias. 22 Furthermore, this case study provides insights into individual hypotheses and participants, among inexperienced clinical researchers only; any comparisons involving broader participant samples should be approached with caution. Ideally, comparisons need to be conducted throughout the natural hypothesis generation processes by the participants who generated the highest-rated, lowest-rated hypotheses, as well as the intermediate-rated hypotheses. We only compared the highest and the lowest cases in this study. The studies have shown that intermediates behave differently than what would be expected in the process of developing medical diagnosis, than just the two extreme participants. The authors found this phenomenon to be generic, going beyond the medical domain.18,24
Regarding the roles of VIADS or other tools (such as R, SPSS, SAS) in hypothesis generation among clinical researchers, please refer to our publications for a thorough comparison.12,14,15,20
Future work
A substantial amount of data from participants with average ratings were excluded by focusing solely on participants with the highest and lowest-rated hypotheses. Incorporating this middle-ground data could provide additional understanding and insights into the hypothesis generating process. Furthermore, this case study exclusively examined inexperienced clinical researchers. Future research could include experienced clinical researchers and a larger sample of participants. Their perspectives and approaches to hypothesis generation may offer additional valuable insights. An additional qualitative data analysis of the think-aloud protocols, using a cognitive theoretical framework, may also provide further insights into understanding the thought process of hypothesis generation.25,26
Conclusion
Demographics and experiences emerged as influential factors, with higher levels of experience associated with generating higher-rated hypotheses and a higher validity rate of hypotheses. Notably, outliers in hypothesis generation, characterized by either excessively short or prolonged usage of time, were negatively associated with the quality ratings of hypotheses. Fewer cognitive events were used for the participants from the Top five group, possibly showing that they required less cognitive effort to process the data. Both time usage and cognitive events trends were evident among the top and bottom-rated hypotheses, while the individual hypotheses and participants did not show the same trend. This study offers valuable insights into factors affecting hypothesis quality that provide valuable evidence for future larger-scale studies to examine the relationships among these factors and the quality of hypotheses more comprehensively. Such insight can also be used to provide evidence for customized study designs or tool development based on these associated factors.
Supplemental Material
Supplemental Material - A secondary data analysis on hypotheses generated by inexperienced clinical researchers: Cases from a randomized control study
Supplemental Material for A secondary data analysis on hypotheses generated by inexperienced clinical researchers: Cases from a randomized control study by Mytchell A. Ernst, Brooke N. Draghi, James J. Cimino, Vimla L. Patel, Yuchun Zhou, Jay H. Shubrook, Sonsoles De Lacalle, Aneesa Weaver, Chang Liu and Xia Jing in Health Informatics Journal.
Footnotes
Author note
The original randomized controlled study was approved by Clemson University (IRB2020-056) and Ohio University (18-X-192). All data used in this publication have been anonymized, and no identifiable information is used in any part of this publication.
Acknowledgment
We would like to thank all participants and expert panel members for participating in this study. Without their significant contribution and participation, none of the work would be possible. The project was supported by a grant from the National Library of Medicine (R15LM012941) and was partially supported by the National Institute of General Medical Sciences of the National Institutes of Health (P20 GM121342). This work has also benefited from research training resources and the intellectual environment enabled by the NIH/NLM T15 SC BIDS4Health research training program (T15LM013977).
Author contributions
XJ, YCZ, JJC, VLP designed the study; XJ and YCZ determined the analysis strategy; XJ, JJC, VLP, YCZ, JHS, SDL, CL obtained the funding; CL provided technical support; JJC, JHS, and SDL helped with the recruitment; XJ conducted the study; MAE, BND coded the data and conducted initial analysis; AW anonymized the hypotheses and randomized the order and put them in all Qualtrics surveys; MAE prepared the first draft of the manuscript; all coauthors revised the manuscript substantially.
Funding
The author(s) disclosed receipt of the following financial support for the research, authorship, and/or publication of this article: this work was supported by the National Institute of General Medical Sciences of the National Institutes of Health; P20 GM121342
National Library of Medicine; R15LM012941
NIH/NLM T15 SC BIDS4Health research training program; T15LM013977.
Declaration of conflicting interests
The author(s) declared no potential conflicts of interest with respect to the research, authorship, and/or publication of this article.
Data Availability Statement
More detailed, analyzed, and organized data are available upon request to the corresponding author; requests for the raw data are considered on a case-by-case basis.
Supplemental Material
Study scripts for the VIADS group, the control group, and all supplementary materials can be found at https://doi.org/10.1017/cts.2023.708 and ![]() . Supplemental material for this article is available online.
. Supplemental material for this article is available online.
References
Supplementary Material
Please find the following supplemental material available below.
For Open Access articles published under a Creative Commons License, all supplemental material carries the same license as the article it is associated with.
For non-Open Access articles published, all supplemental material carries a non-exclusive license, and permission requests for re-use of supplemental material or any part of supplemental material shall be sent directly to the copyright owner as specified in the copyright notice associated with the article.