
Abstract
Keywords
Introduction
Health care research projects frequently involve integration of multiple large data sets, such as electronic medical records from practitioners’ offices1,2 and population-based linked administrative health data for physicians’ claims, hospital stays and medication records. 3 Common approaches to working with these data that involve direct database queries for data extraction and/or statistical packages to manage and analyse such research data can quickly become time-consuming and onerous processes, 4 even at sub-terabyte volumes of data. To address this problem, analysts may create multiple smaller subsets or aggregations, followed by merging, and compilation before they can obtain a working analytic data set. Although reducing data set size may address some problems related to performance run time, fragmented analytic processes result, and data management issues can be compounded. In analytic work, this process of resource intensive data preparation followed by a fraction of resource use for actual data analysis is referred to as the ‘80:20 rule’. 5 The ratio of time spent in data preparation versus actual analyses and reporting of results can be further compounded when using ‘big data’. Big data are often characterized by volume (amount of data), velocity (rate of data accumulation) and variety (data types). 6 Some authors also include the term ‘veracity’ to the collection of big data ‘Vs’ to exemplify the importance of data quality. 4
Although our study did not involve large volumes of data relative to that being experienced in some areas of research, 7 the combination of the 4 Vs unquestionably presented analytic challenges.8–10 For example, frequent iterations and/or data refreshes are often required during development of patient-level simulation models for evaluation of alternative models. 11 The processes and resources involved in bringing our research data to an analyzable state exemplify the issues encountered. Considerable resources were required to support the initial process for managing and analyzing these data. In addition, future research plans would require appending new releases of the administrative data and addition of other large data sources, such as administrative prescription drug data. These updates were expected to further complicate data management and analyses.
One solution, online analytical processing (OLAP) technology has been an available and maturing technology for over two decades.12,13 OLAP technology expedites querying of large data stores via a multidimensional structure, often referred to as a data cube. In addition to supporting integrated calculated measures, many front-end applications for OLAP solutions are also flexible in that experienced analysts can create custom measures based on the underlying data.14,15
The research data were currently being stored in a database environment with OLAP tools readily available. Over the years, occasional reports have appeared indicating adoption of OLAP tools to support genomic and molecular research,14,16,17 but to our knowledge, applications in health research settings has been uncommon. These tools are increasingly being used in health care organizations,13,18–20 and recently published articles demonstrate application to extract inputs for machine learning models,21,22 and analyses in public health during the COVID pandemic. 23 In this work, we explore the potential usefulness of OLAP tools to support data management and analyses required for an economic simulation modeling study. The intent was to find an alternative method of managing and analyzing data that would support fast and flexible data extraction as well as calculation of standardized measures needed for our health research initiative.
In this article, we discuss methods used for the development of a multidimensional data cube using OLAP tools to support an economic health research initiative that involved an analyses of multiple large administrative data sources.
Methods
Administrative data sources accessed for the osteoarthritis research project.
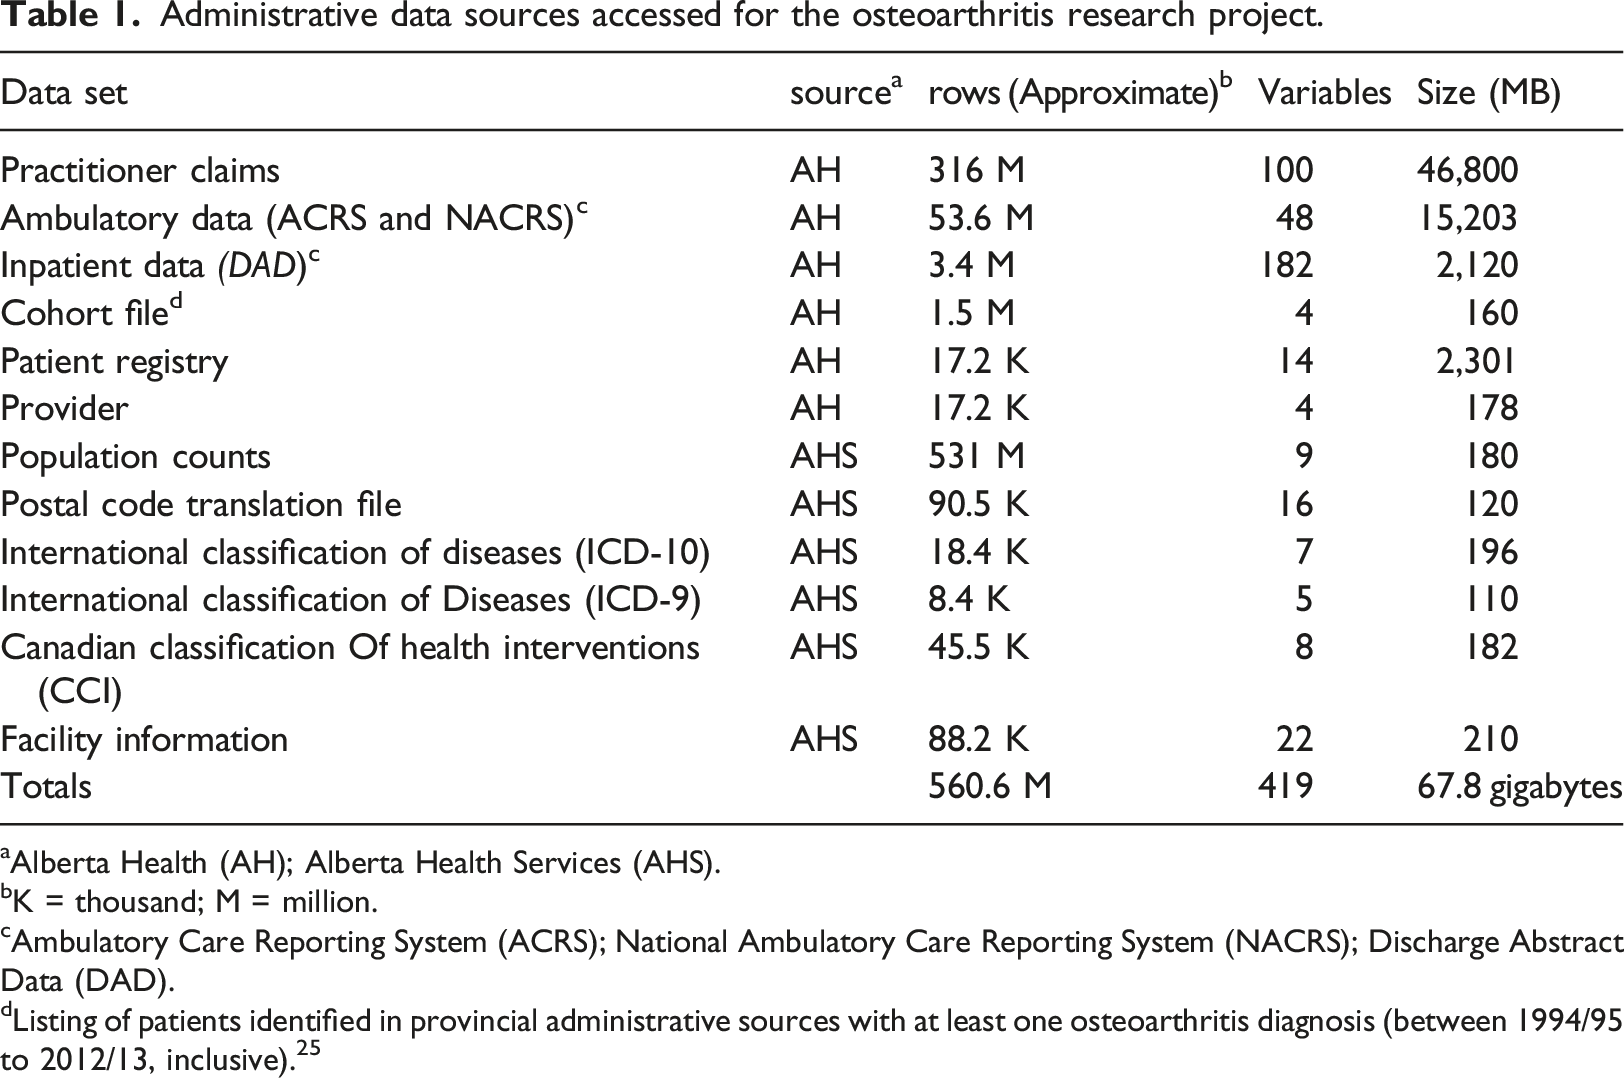
aAlberta Health (AH); Alberta Health Services (AHS).
bK = thousand; M = million.
cAmbulatory Care Reporting System (ACRS); National Ambulatory Care Reporting System (NACRS); Discharge Abstract Data (DAD).
dListing of patients identified in provincial administrative sources with at least one osteoarthritis diagnosis (between 1994/95 to 2012/13, inclusive). 25
Extensive data management and analytic tasks were required to utilize these data for the intended research purposes. Development of a multidimensional data cube was undertaken to facilitate quick access to iterations of analyses as information was required for simulation model inputs. The process for creating the data cube for the current research project is described below in terms amenable to all types of research analysts, with minimal use of technical language.
Multidimensional cube development
Development of a data cube was initiated in tandem with the on-going work being conducted by an analyst using conventional epidemiologic methods. This process facilitated validation during development of the cube, and assessment of efficiency improvements. The research data were housed in a standard database with the OLAP tools available. OLAP tools were accessible in a Microsoft SQL Server environment, 25 although there is now a plethora of software options with OLAP tools, including open source.26–28 The hardware requirements for this project were minimal (the solution could run on most new office workstations), but requirements could vary depending on the size of data and number of users, thus consultation with information technology and/or individuals familiar with OLAP is recommended. Initial analytic activities (using conventional methods) were being conducted using database queries to create merged subsets and aggregations; a statistical application was used for more complex statistical computations.
The first step in developing the data cube was to restructure the original sources of data into a series of tables within the database into a format that could be used as the data source for the multidimensional cube. Data cubes consist of two main constructs: fact and dimension tables. Fact tables consist of the core data of interest from which measures are derived, such as inpatient visits, visits to a physician, and cost information. Dimension tables consist of the parameters by which the researchers may want to stratify (i.e., slice/dice) data (e.g., age, geography, health facility, etc.). The source files for a data cube are typically stored in the database using a naming convention that prefixes the table name with the type of table (i.e., dimTableName, factTableName) to facilitate differentiation of these types of tables in the warehouse. Tables may also contain both dimension and fact elements, an example of which is described below.
Fact tables
Two main fact tables were created, from which most measures were derived. Selected fields from the three main data sources (inpatient, ambulatory and practitioner claims) were appended to create a primary fact table (factUtilization). This process required input from analysts knowledgeable with the three utilization data sources to inform mapping of fields across the data sets. The final fact table was an amalgamation of data which included eight fields that utilized data from all three sources, 16 fields from two sources, and 41 fields that obtained data from only one source. The resulting table allowed creation of simple measures, such as distinct counts of patients who utilized any of the three services, and summative measures such as costs and number of health care encounters, that could be stratified (i.e., sliced) by the various dimensions. In creating a fact table, it is also necessary to incorporate the finest level of stratification (or grain) that will be linked to dimension tables (where the levels of aggregation are defined). A field was also added to define the data source from which the utilization data were derived (i.e., inpatient, ambulatory or practitioner claims). Three additional fields for patient demographics (age in utilization year, sex, and residence postal code) that were originally provided in the Health Care Registry file were merged into the fact table.
Two additional fields were added to the main fact table based on algorithms defined by the research team; i) visit type defined health care utilization for specific services, such as radiology (based on the provider specialty and any of 16 procedure codes) and diagnostic imaging visits (based on financial and diagnostic codes, and specialty type) and ii) one of five stages of disease were assigned to each utilization event. Although some of the information acquired through these additional fields could be extracted from a data cube using a series of filters based on dimension values, integration into the fact table allowed direct slicing of data and expedited extraction of data for the simulation inputs. The process to integrate these two fields provides an example of the team collaboration that was required to develop the analytic platform - the benefits and advantages of the two methods were considered by the multidisciplinary team prior to decision on the final method.
A second fact table (factPopulation) was created based on historical and projected provincial population data (up to 2045). The population counts were available at age, sex and postal code level. The population counts were required for denominators in calculations of utilization rates, incidence and prevalence of disease, as well as for inputs into the simulation models projecting disease burden, health care utilization and costs.
Dimension tables
Several dimension tables were created based on pre-existing reference tables provided by Alberta Health and Alberta Health Services (the service delivery entity in the province), with modification to add aggregation levels, as required for the research analytics. Data for a dimension table with health care provider details (dimProvider) were obtained from Alberta Health and included the provider’s sex, year of registration and age at practice start. Sources for dimension tables obtained from Alberta Health Services included; i) disease classification (dimICD - based on the World Health Organization’s International Classification of Diseases (ICD) codes – versions 9 and 10), ii) procedures (dimProcedure - based on the Canadian Classification of Health Interventions (CCI)), iii) facility details (dimFacility) and iv) geographic information (dimPostalCode - Postal Code Translation file).
Multiple files were obtained for the diagnostic and procedure codes, as the source data were in a semi-relational format. For example, the source files for the CCI codes were obtained from four separate files; intervention code (finest level of information which linked to the factUtilization table), two additional files with aggregation levels and a separate file with provincial definitions for surgical procedures. Similarly, the diagnostic information was provided in three files for the ICD-10 information, plus one additional file with ICD-9 codes and descriptors. These files were compiled (denormalized) to create two dimension tables (dimICD and dimProc). Three additional fields were added to the procedure dimension to allow a higher level of aggregation (than was provided in the source files). For diagnostic information, the three ICD-10 reference tables were compiled into one table, and then the one source file with ICD-9 codes and descriptors was appended. A mapping file (ICD-9 to ICD-10) obtained from the Canadian Institute of Health Information will be used to create aggregation levels for the ICD-9 groups to facilitate grouping of diagnostic information (work underway). A flow diagram of the process to create the diagnostic and procedure dimensions is provided in Figure 1. Star schema data structure for multidimensional data cube based on administrative health data.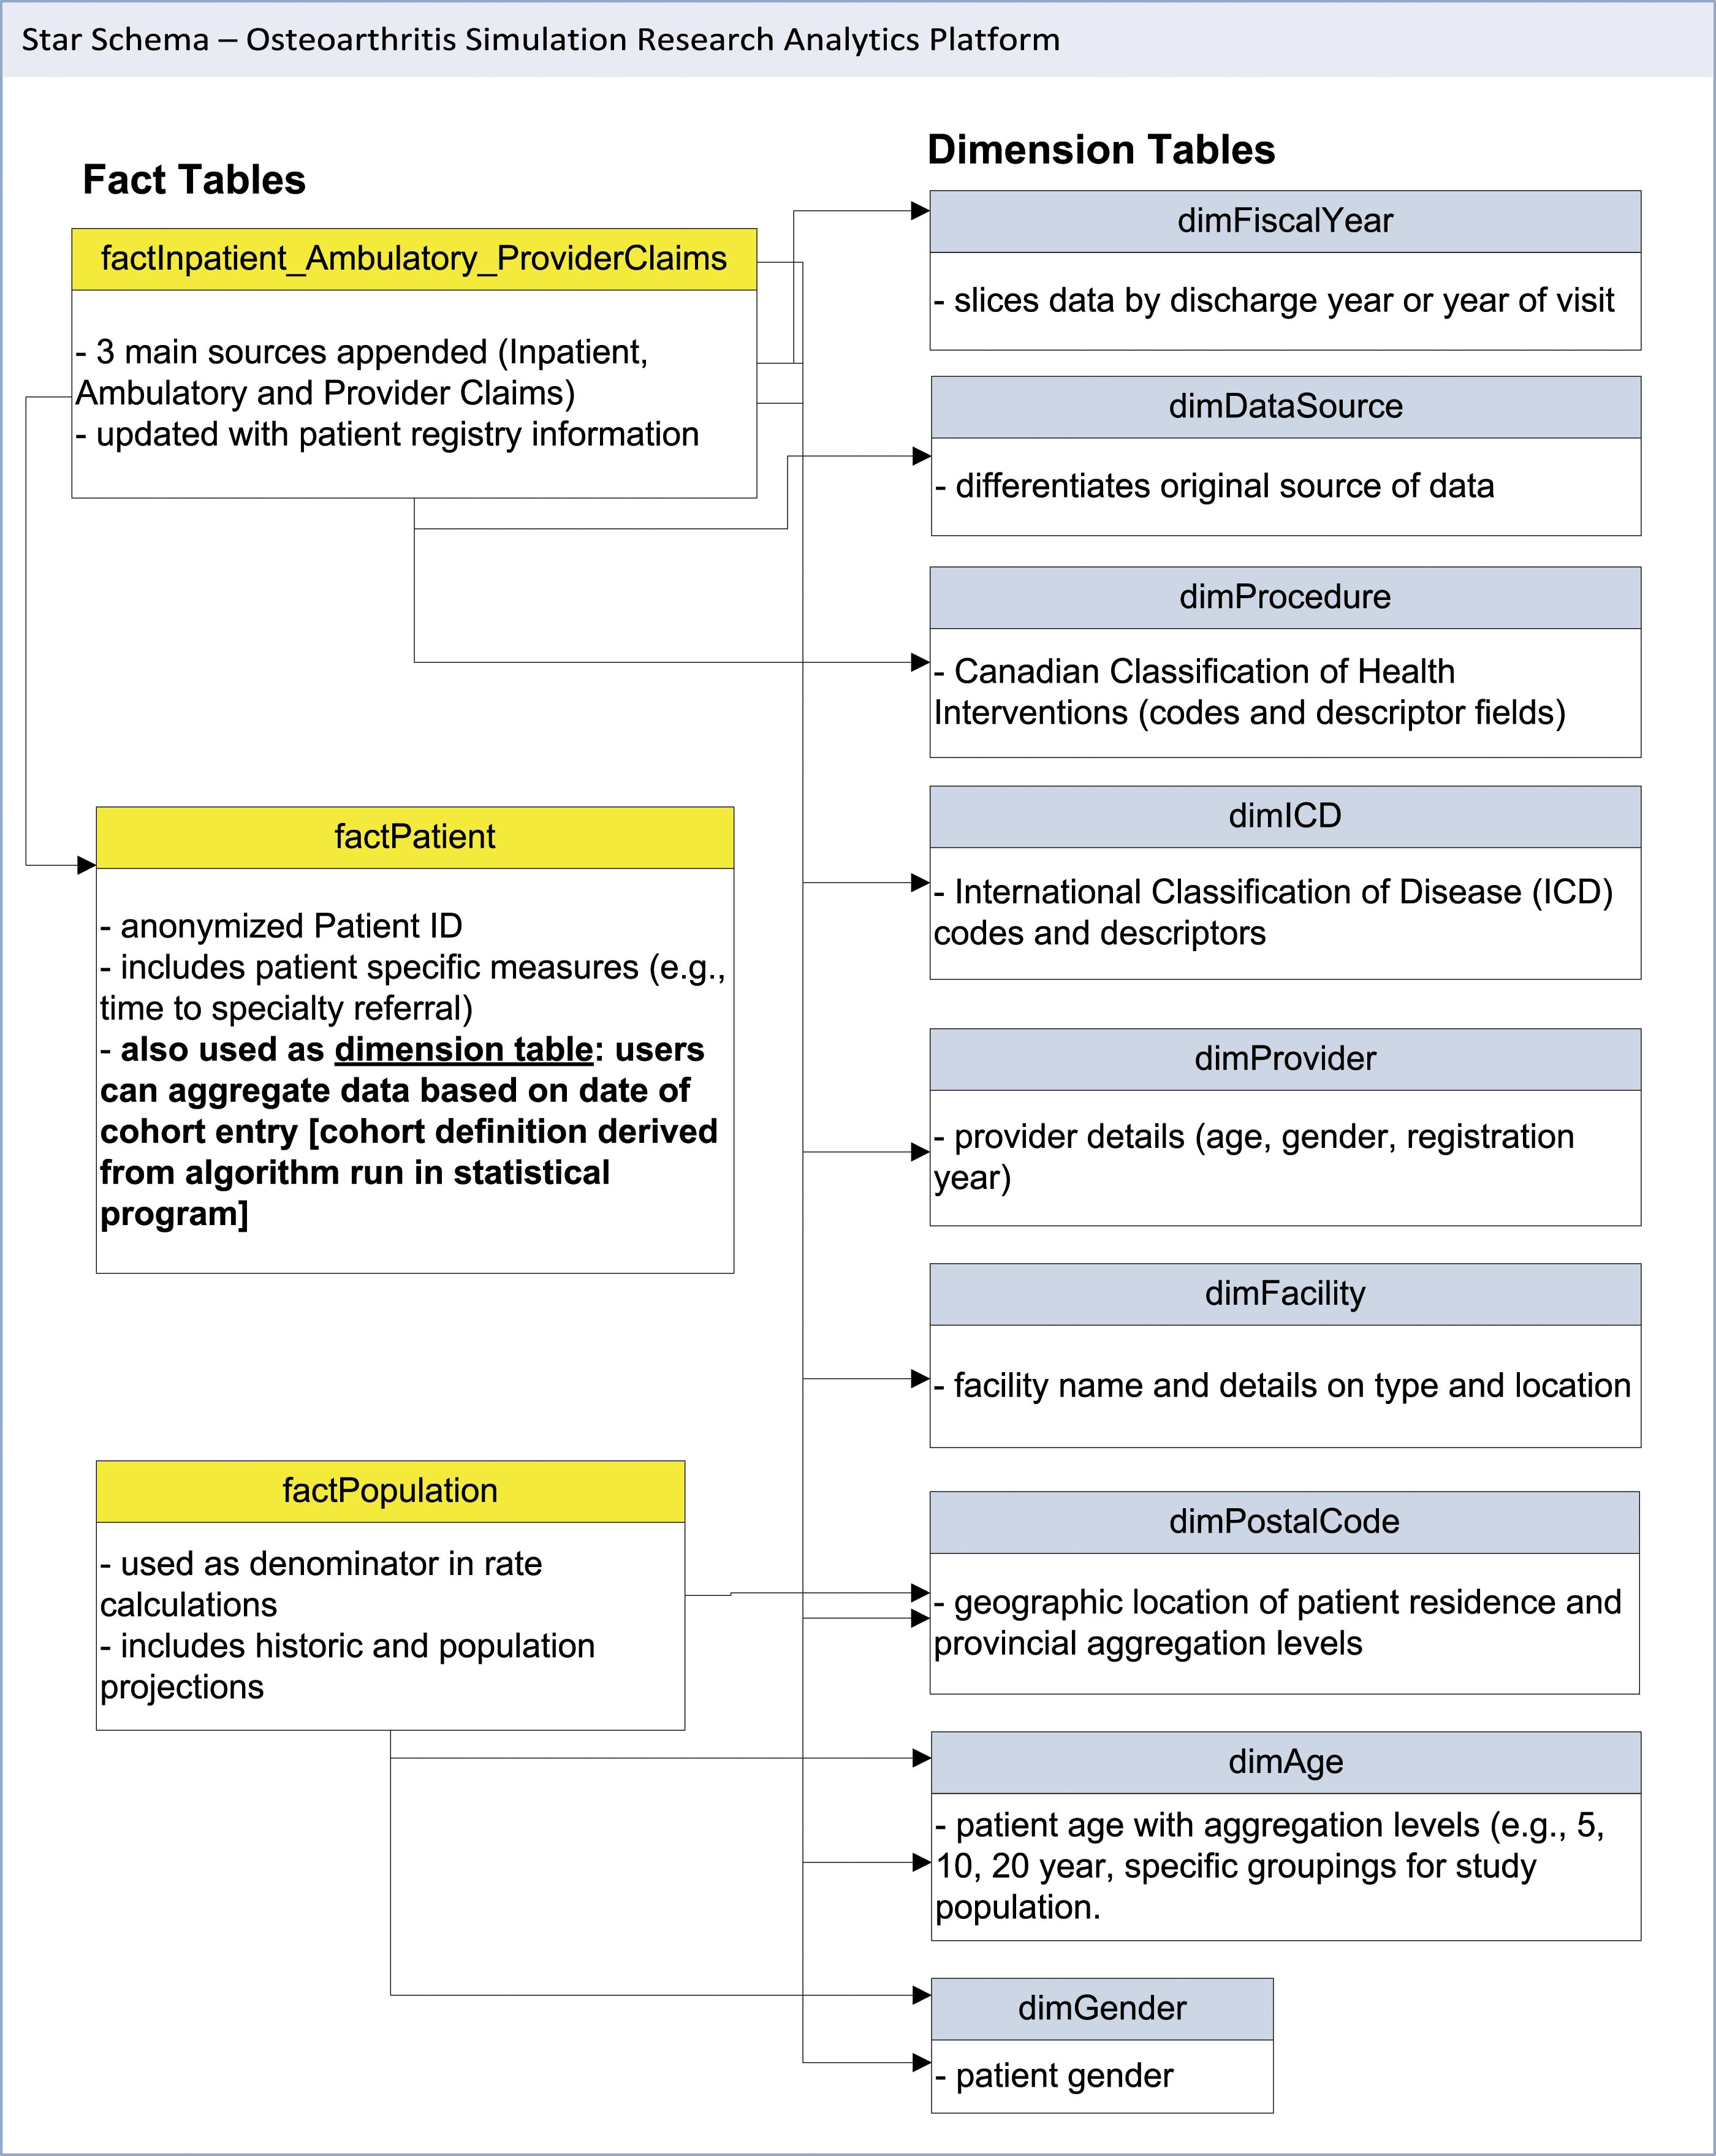
Longitudinal analysis based on cohort entry was also a requirement. Due to the complexity of the definition, the cohort entry dates for patients were first determined using a statistical package, and subsequently this information was integrated into a dimension table. This allowed users to select a block (e.g., year) of cohort patients and examine annual utilization rates longitudinally. The linkages between the fact and dimension tables were then organized in the OLAP software. This organized data format is known as a star schema and is the foundation for the multidimensional data cube (Figure 1).
The work described above were conducted using SAS® software (SAS Institute. 2011) for statistical analyses and Microsoft SQL Server® 2017 Enterprise Edition for development of the multidimensional cube.
Results
Development of the multidimensional cube occurred in iterations over approximately 12 months. The initial challenge was a paucity of human resources with experience or training using the software. The shortfall in access to human resources with the required skills in applying these tools in research settings has been highlighted previously.29,30 Coordinating the time of a multidisciplinary group of analysts, researchers with content expertise, and information technology resources was also a challenge at times. However, the expertise from various disciplines was crucial to developing this analytic solution.
Comparison of conventional analytic approaches with cube development.
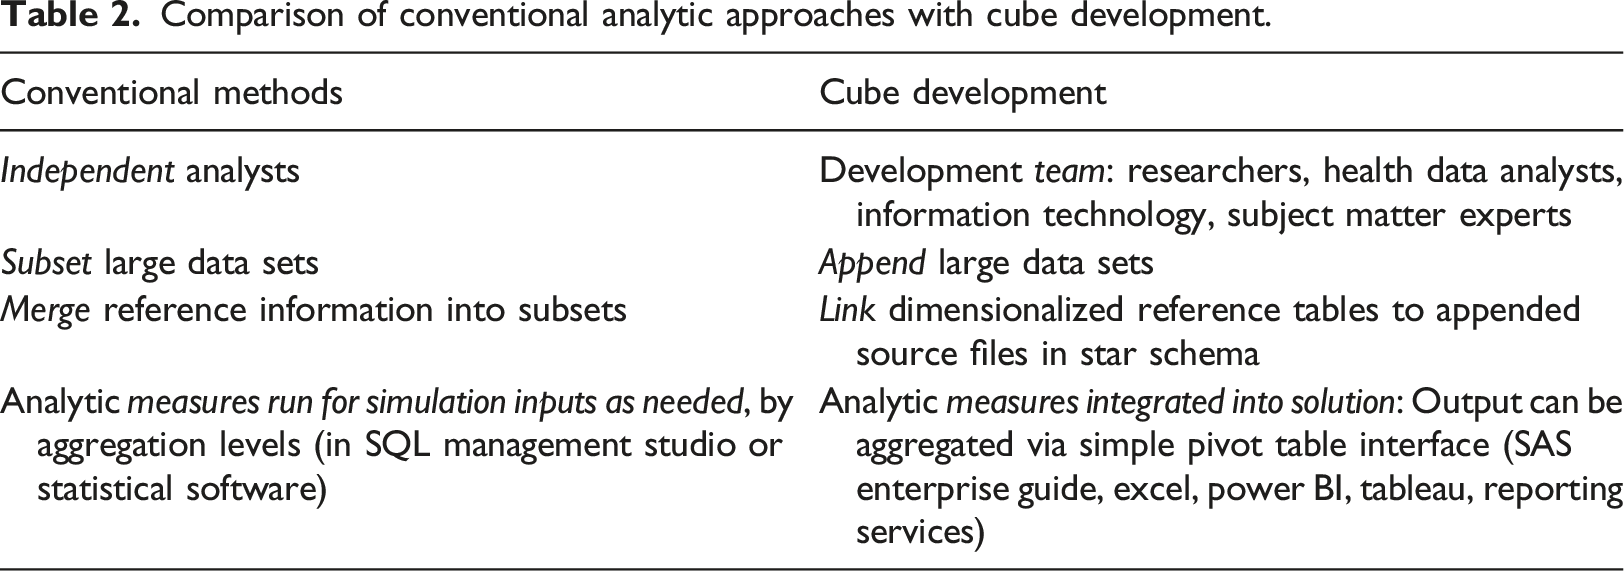
Integration of reference information and definition of stratification variables was also counter-intuitive to conventional approaches for compiling research data. Rather than creating multiple flat files by merging the administrative files with reference data and writing code to create aggregation levels, this information was compiled into dimension tables. End users were then able extract and analyze the information via a simple pivot table interface using various common tools such as Microsoft Excel and Power BI, Tableau, and statistical software, such as SAS Enterprise Guide.
Data retrieval time has been reported to be approximately 0.1% using a data cube compared to running direct queries from a database.
31
We observed major time reductions for relatively simple queries, as well as more complex queries that required linkage of several tables (Figure 2). The analytics platform has also negated the need for many intermediary steps for data extraction and analyses for iterations of development of the simulation models. Comparison of query time using the data cube versus direct database queries. *Instantaneous run from cube.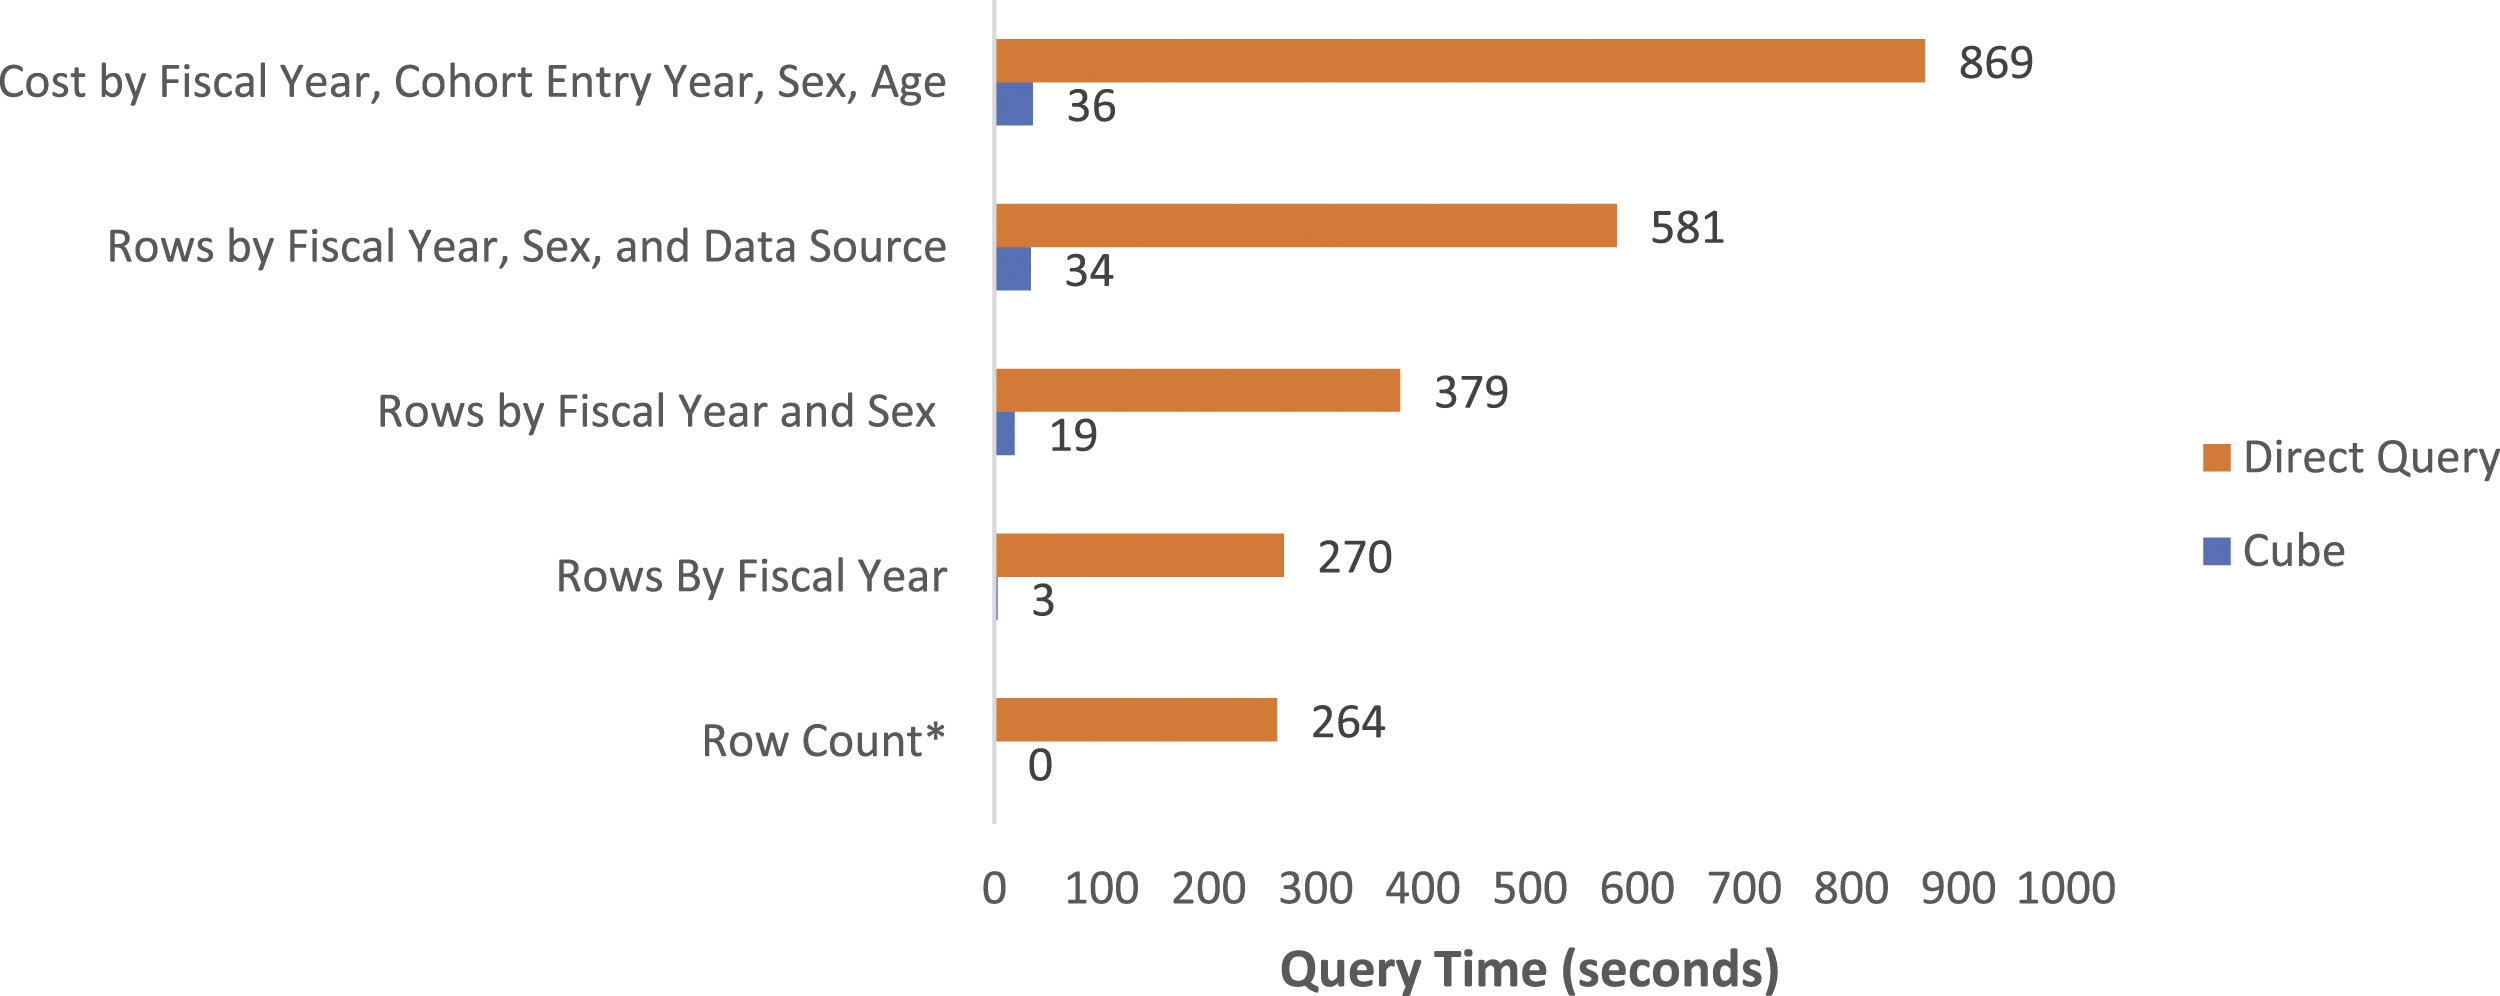
In addition, a significant reduction in server space was achieved, primarily due to the compression of data in the cube format, as well as a reduction in the number of subsets required, and pre-aggregated tables stored in the data warehouse (Figure 3). Comparison of analytics process using conventional methods with direct database access and statistical tools versus the online analytic processing solution (data cube).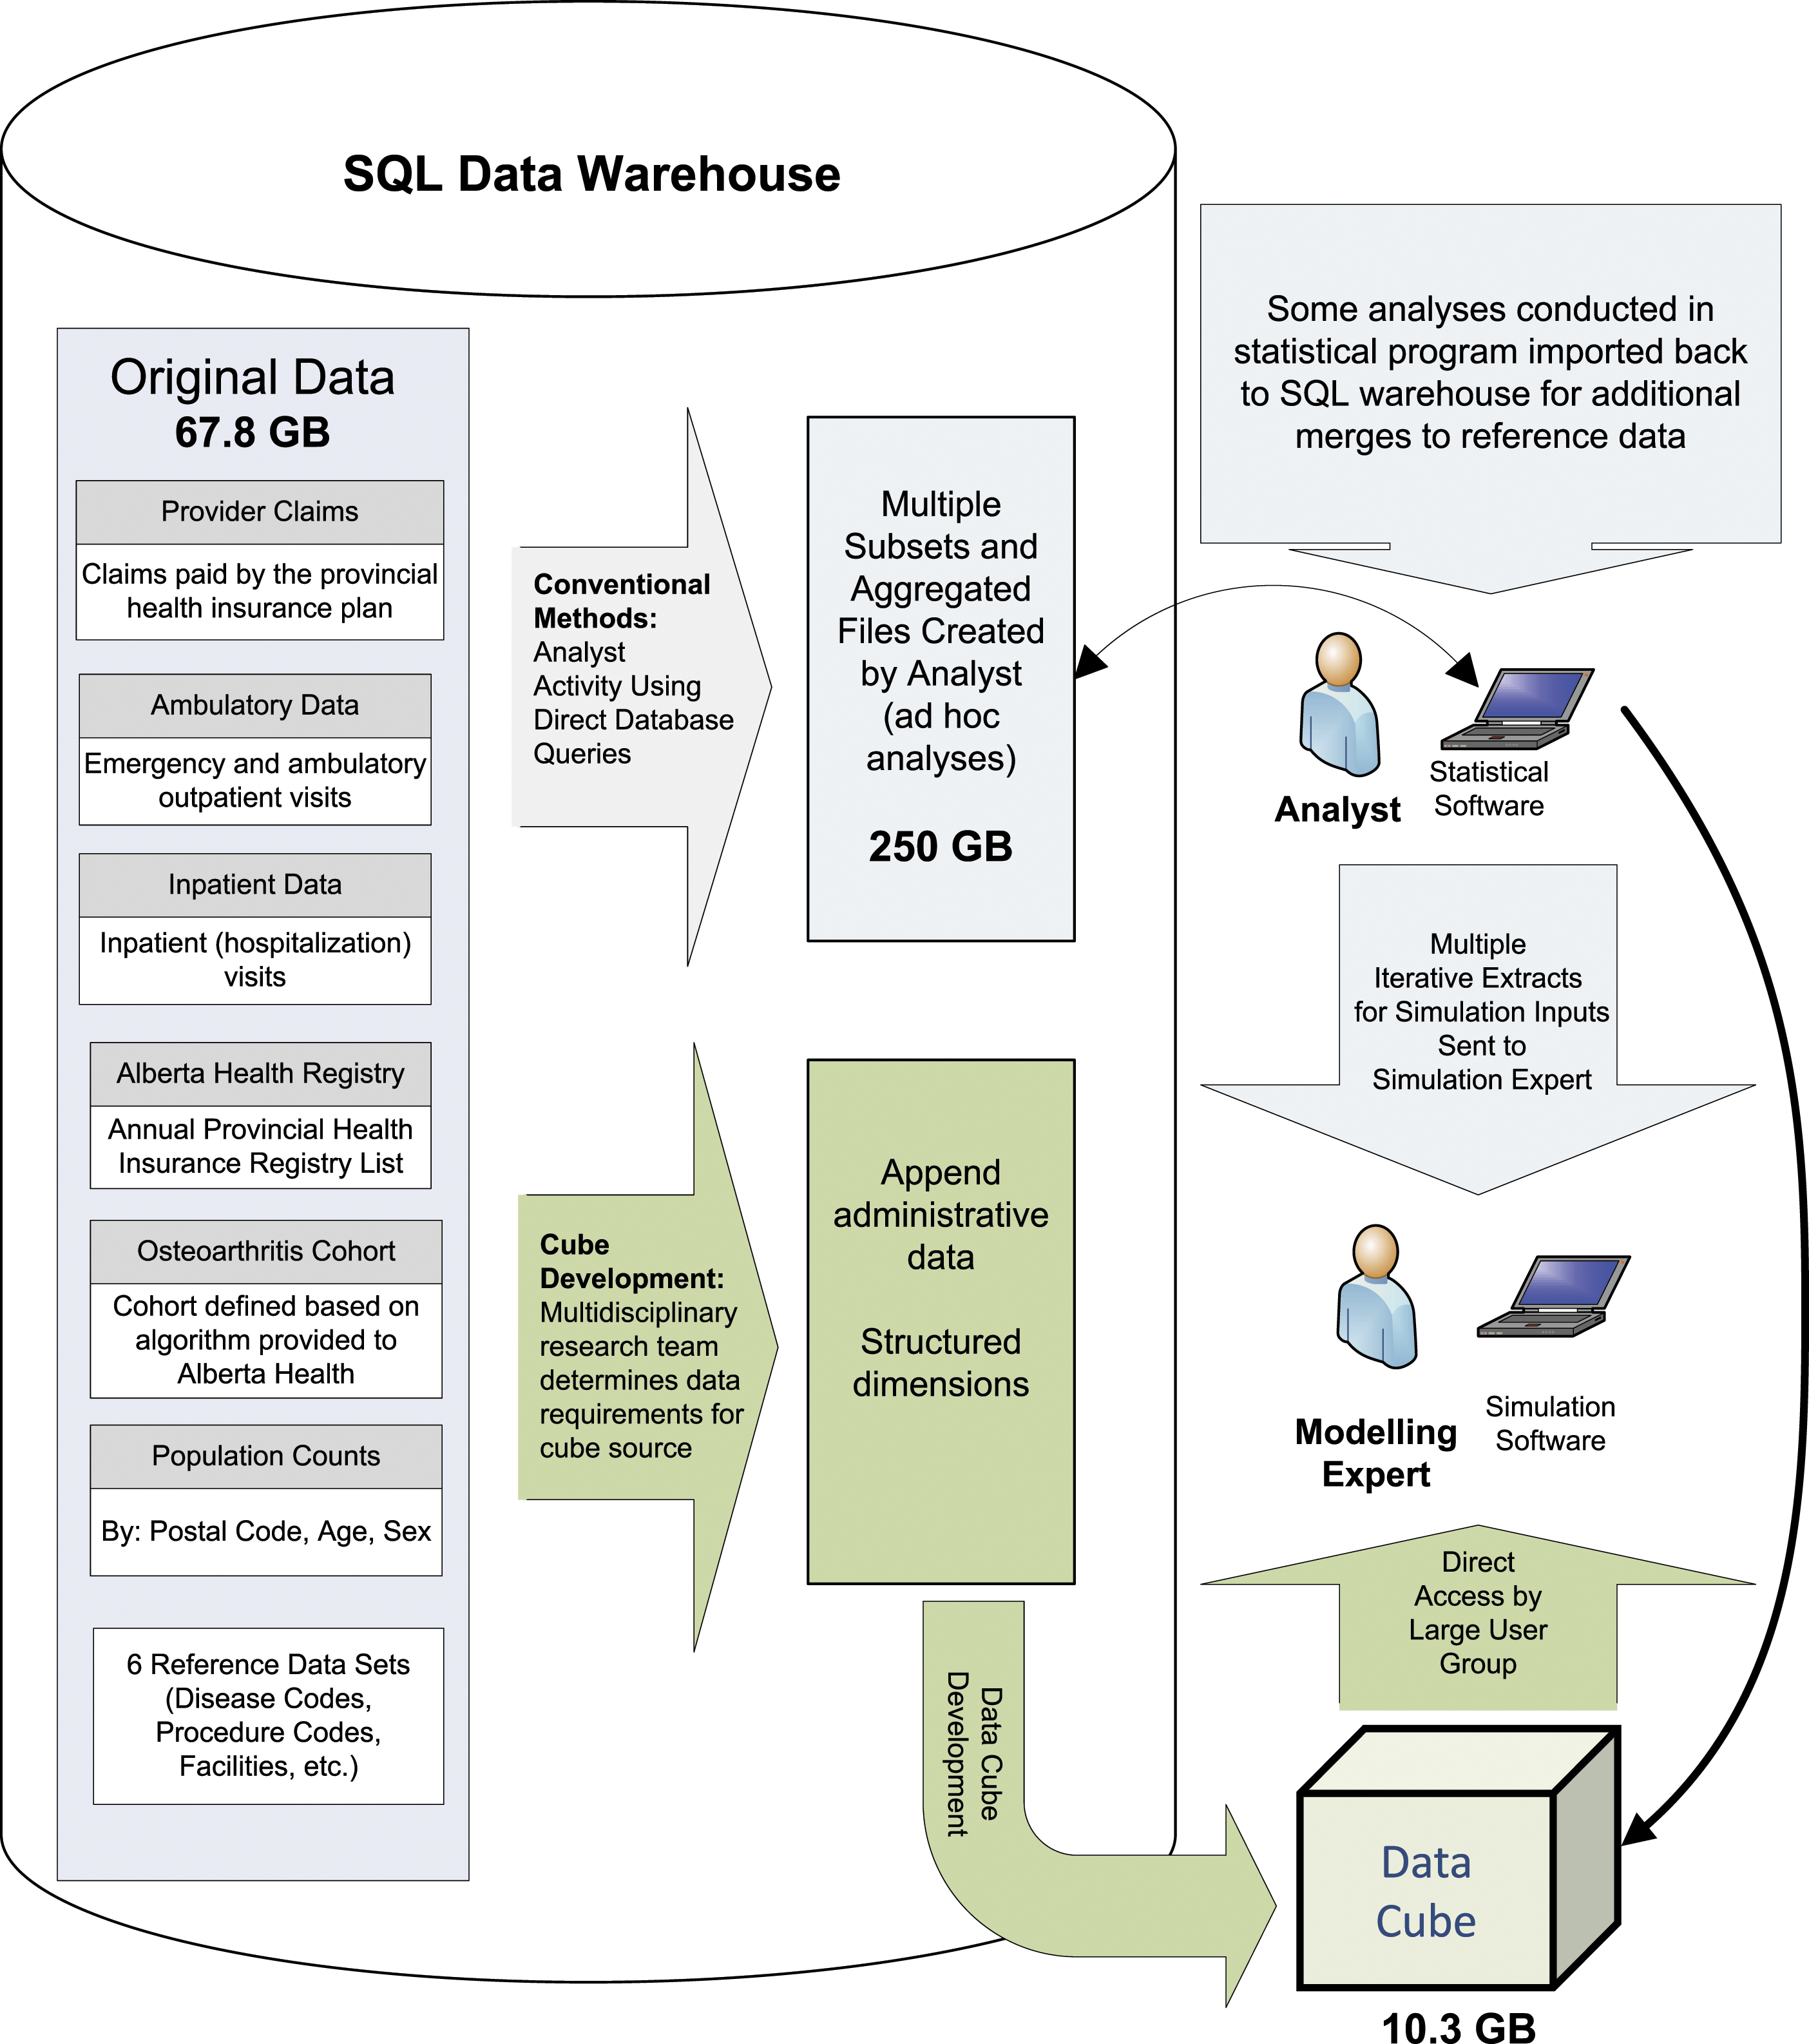
There were also significant differences in storage space requirements when the conventional methods were compared with the OLAP solution. The original source data was over 67 GB (Table 1). This increased to nearly 250 GB of space after creation of multiple subsets and aggregated files for analysis using conventional methods. Comparatively, the data tables required for the star schema were created using views (thus data were not replicated in analytic tables), and the size of the final data cube was only 10.3 GB (Figure 3).
Discussion
This project has demonstrated how an OLAP solution can be utilized to address some of the challenges encountered by researchers related to managing and analyzing large and/or complex data sets. In the current project, traditional health research methods for managing and analyzing data sets in the gigabyte range were inefficient, requiring sub-setting and repeated data linkages, to achieve reasonable run time. The major efficiency gains we observed exemplify the need for researchers to begin to explore alternatives to traditional methods for managing their data stores and conducting analyses. The utility of an OLAP solution to expedite more complex analytics has also been demonstrated previously.32,33 It has been shown that, while an OLAP solution may limit the capacity for complex analyses, OLAP can expedite descriptive analytics and extraction of data for more complex analytics with statistical tools. While we observed significant efficiency gains with respect to storage space and processing, gains may vary with the size of the data set and complexity of analytics. While accessing raw sources can provide more analytic flexibility and will still be required for some analyse, the utility of a technical solution such as OLAP could be applied to support even complex analyses, 32 providing that end users are adequately trained in use of these types of platforms.
The type of analytics required should also be considered when assessing the utility of an OLAP solution. If the analytics require frequent access to granular (for example patient and physician level data), rather than aggregate information, an OLAP solution may impart only limited benefits. Consultation with those familiar with OLAP applications for analytics is recommended. Additionally, the current study was able to access line level data from several sources with an anonymized, but linkable, identifier. Several countries are improving access to such information for research purposes,34,35 but access does vary36,37 and should be considered when assessing potential analytic efficiency gains and feasibility of developing OLAP solutions.
Integration of training on these alternative methods into programs for research analysts is needed to increase uptake in the academic environment. This in turn would also benefit health care organizations by providing applied scientists and analysts with the training and skills needed to work with large data sets by exposing trainees to tools typically found in the information technology domain. Failure to adopt technical solutions to enhance analytic efficiencies in health research settings may be due to various factors. Initially, health data analytics may require very different measures than are required for typical for-profit industries. 38 Compared to straightforward business measures such as volume of sales and number of customers, epidemiologic measures often involve complex rate calculations, risk adjustment and standardized estimates. Costing is also not as straightforward in healthcare and may require use of parameters such as resource intensity weighting, 39 as was the case in this study. Further, methods to manage and analyze health data are typically taught in public and community health programs using statistical programs. Conversely, education related to technical solutions is usually part of the information technology domain, where methods for analyses of complex health care data are not included in the academic venue.
The disconnect between health data analysts, information technology, access to technical tools and their disparate training is likely, at least in part, attributable to the lack of application of existing tools that could impart huge efficiencies in how health data are accessed and analyzed in research settings. In addition, cloud-based solutions may not always be feasible for researchers working with sensitive and/or personal health data, thus limiting options to researchers. Some have proposed that issues such as costs or patient confidentiality may be in part responsible for this delay. 9 However, tools to support large scale analytics platforms are often embedded in database applications that are used to house data on-site. Further, newer open source OLAP applications which run on big data platforms such as Hadoop® have become available in recent years 28 and should decrease costs with implementing this technology. Regarding data security, technical applications used to develop analytic platforms often support integrated role-based security, thus may provide data security superior to that achievable with systems where analysts must access databases directly to extract and manipulate data for analyses. Thus, the division of roles between health data analysts, information technology, access to tools and their disparate training is a likely culprit that contributes to lack of application of tools that could impart efficiencies in how health data are accessed and analyzed for research in academic settings.
Lessons learned
We found that close collaboration of a multidisciplinary team was crucial to development of a functional solution with validated output acceptable to the research group. The need for strong collaborations has also been stressed in an early discussion of implementing business intelligence solutions in healthcare settings. 40 The final product relied on collaborative development, with research analysts having extensive input into the structure of the star schema and measures in the solution, and information technology supporting creation of the data sets required for the cube solution. Both researchers and information technology supported development of the solution within the technical platform using OLAP tools, and subsequent validation processes.
The changes in work processes, where researchers now work with ‘pre-analyzed’ data, rather than accessing the raw data and conducting analysis on an individual basis, also created some initial dissonance. However, concerns regarding validity of the solution output were achieved by ensuring that; i) all team members were involved in development and ii) exposing all team members to the software applications and methods involved in creating the solution, and iii) provisioning key members of the research group (epidemiologists and operations researchers) with access to the raw data to support validation checks. In addition, by integrating preliminary work done by a research analyst to define cohort populations into the data cube solution, we were able to expand the application to support longitudinal analyses.
Despite longer than expected development time, the final product has resulted in major efficiency gains in how data analysis and management are done within the research team. There was a steep learning curve, for both information technology support and research analysts, and an adjustment in work processes. We expect that the learnings from this project will serve to expedite future iterations of development of the current research data and can be leveraged to support research involving other large data sets. The scalability of these types of solutions has been demonstrated by others, 41 and we plan to apply these learnings to expedite integration of updated data and new sources into the OLAP platform.
Our experience in this project leads us to propose two key recommendations for the academic community using large data sets; i) courses taught in health research disciplines need to begin exposing students to technical applications that facilitate efficient management and analyses of large data sets, which will in turn bolster skill sets for those entering work environments, and ii) methods to apply technical solutions should be leveraged across research groups (e.g., sharing of methods used to create data structures needed for OLAP solutions, which could be applied using many different software applications). Shared learnings across research groups will allow the research community to strengthen capacity to efficiently utilize the growing amount and complexity of data in academic settings, as well as provide trainees and students with expanded skill sets for entering the workforce more prepared to work with large data sources.
Footnotes
Declaration of conflicting interests
The author(s) declared no potential conflicts of interest with respect to the research, authorship, and/or publication of this article.
Funding
The author(s) disclosed receipt of the following financial support for the research, authorship, and/or publication of this article: Funding for this study was provided by the Canada Foundation for Innovation (CFI) grant “An integrative approach for translating research to improve musculoskeletal health” and the CIHR (Grant #: 126128) Operating grant “Developing an innovative evidence-based decision support tool to improve osteoarthritis care planning and health service management for diverse patient populations in Alberta, Saskatchewan and Manitoba”. DAM is supported by the Arthur J.E. Child Chair in Rheumatology and a Canada Research Chair in Health Systems and Services Research (2008–2018).
Ethical approval
These data were made available in anonymized form after receiving approval from the University of Calgary Conjoint Research Ethics Board (UCCREB) and completion of a Data Sharing Agreement with the Alberta Ministry of Health.
Consent
The UCCREB also approved a waiver of consent, given that the data were existing, anonymized and that there was no direct contact between the researchers and patients.