
Abstract
Barriers to child developmental screening lead to delayed diagnosis and intervention. babyTRACKS, a mobile application for tracking developmental milestones, presents parents their child’s percentiles computed relative to crowd-based data. This study evaluated correspondence between crowd-based percentiles and traditional development measures. Research analyzed babyTRACKS diaries of 1951 children. Parents recorded attainment age for milestones across Gross Motor, Fine Motor, Language, Cognitive, and Social domains. Fifty-seven parents completed the Ages and Stages Questionnaire (ASQ-3), and 13 families participated in the Mullen Scales of Early Learning (MSEL) expert assessment. Crowd-based percentiles were compared with: Centers for Disease Control (CDC) norms for comparable milestones, ASQ-3 and MSEL scores. babyTRACKS percentiles correlated with the percentage of unmet CDC milestones, and with higher ASQ-3 and MSEL scores across several domains. Children who did not meet CDC age thresholds had lower babyTRACKS percentiles by about 20 points and those at ASQ-3 risk had lower babyTRACKS Fine Motor and Language scores. Repeated measures tests showed significantly higher MSEL versus babyTRACKS percentiles in the Language domain. Although ages and milestones in diary varied, the app percentiles corresponded with traditional measures, particularly in fine motor and language domains. Future research is needed for determining referral thresholds while minimizing false alarms.
Introduction
Early childhood development
The first 3 years of life are critical for children’s healthy development. Developmental delays affect one in six children. 1 Early identification can prevent more significant problems. 2 Prevention involves providing early intervention at a period of rapid brain growth and plasticity, which enables maximum learning and behavioral change.2,3 Early intervention is associated with better long-term cognitive and adaptive functioning, as well as social-emotional adjustment.4–6 Unfortunately, about 30% of children with developmental disabilities are not identified promptly. 7
The COVID-19 pandemic dramatically increased the need for digital health solutions in all medical domains, including pediatric preventative care. With routine face-to-face wellness visits at a minimum, and virtual appointments not always available, millions of parents were left to monitor their children’s development independently. Supporting parents’ knowledge of typical development and their ability to detect delays and seek professional guidance, has become even more crucial.
Many parents, particularly first-time mothers, seek developmental advice online8,9 and worry about their infant’s development before approaching a healthcare provider.10,11 Parents have more opportunities than providers to observe their child’s behavior 12 and are often the first to notice problems. 13 Nonetheless, they are overwhelmed by online information, concerned with its quality, and uncertain about its relevance to their child.8,9 Even during non-pandemic times, providers have limited resources for frequent universal screening. 14 It is, therefore, clear that an efficient, scalable, digital screening platform is needed to complement preventive pediatric care, 15 for parental education and to encourage quicker follow-up with healthcare providers.
Developmental screening measures
Most traditional developmental screening measures include age-appropriate behaviors for parents or clinicians to assess a child’s competencies. The Ages and Stages Questionnaire (ASQ-3) 16 is one of the most popular. It spans Gross Motor, Fine Motor, Communication, Problem-Solving and Personal-Social domains. Scoring is based on deviation from normative age cutoffs. It has sound psychometric properties 16 including high sensitivity for neurodevelopmental disorders, particularly in older children. 17
In addition to standardized screening tools, large healthcare organizations published guides for developmental milestones to promote healthy development and early detection. The U.S. Centers for Disease Control (CDC) published 10 age-specific lists of milestones. While these lists are important public health resources, they are not supported by large population data. 18 One study compared the CDC list with three others; all varied greatly in content and age recommendations for comparable milestones. 19 A recent large-scale study compared milestone ages reported in the Survey of Well-being of Young Children 20 with the CDC age cutoffs. For most of the comparable milestones, over 90% of children passed CDC cutoffs. 21 We thus hypothesized that milestone ages reported by parents will be younger than CDC milestone cutoffs.
Technology-based developmental screening tools
Technology can engage parents in tracking their child’s development by providing user-friendly global platforms for assessing a young child’s behavior. Mobile phones are ubiquitous in parenting offering a cost-effective means for developmental screening. Most web-based screening programs are online versions of standardized parent questionnaires, such as ASQ-3, 16 PEDS, 22 MCHAT-R 23 and others,24–26 that providers can ask parents to complete as part of preventative care. 15 Digital screening is effective not only in terms of completion, but also in automating scoring. Baby Steps is a platform based on the ASQ-3. Evidence supports its feasibility and usability using phone text messaging 27 or Twitter. 28 How these data correspond to developmental risk status was not tested.
Several platforms track children’s daily schedule, growth, and specific developmental milestones (e.g., Trixie Tacker™, WhatToExpect.com Baby Tracker, MyPreemie, Estrellita, and uGrow). While they enable recording certain events and learning what to expect, they do not quantify a child’s developmental progress. Tracking developmental milestones requires investigating clinical validity, so parents and healthcare providers can translate the recorded information into meaningful, patient-reported outcomes.
babyTRACKS
babyTRACKS (previously Baby CROINC, [CROwd INtelligence Curation]) is a free app designed to facilitate parents’ understanding of their children’s developmental milestones using crowd wisdom.
29
Parents of children up to 6-years-of-age record their child’s developmental milestones (e.g., “first laugh” at 7 weeks, “clapped hands” at 10 months), choosing what and how many milestones to include (Figure 1(a)). The user can write milestones in their own words (e.g., “First time interacting with Grandma on FaceTime.”) or select from preexisting milestones suggested for their child’s age (Figure 1(b)). Screenshots of the babyTRACKS Mobile App. (a) A child’s developmental diary, with milestones recorded by the parent/user. (b) Suggested milestones for parents to add to their child’s diary (parents can also add milestones in other ways). (c) Detailed information about a child’s reported milestone. (d) Summary of a child’s development across domains. (e) Child’s developmental history per domain.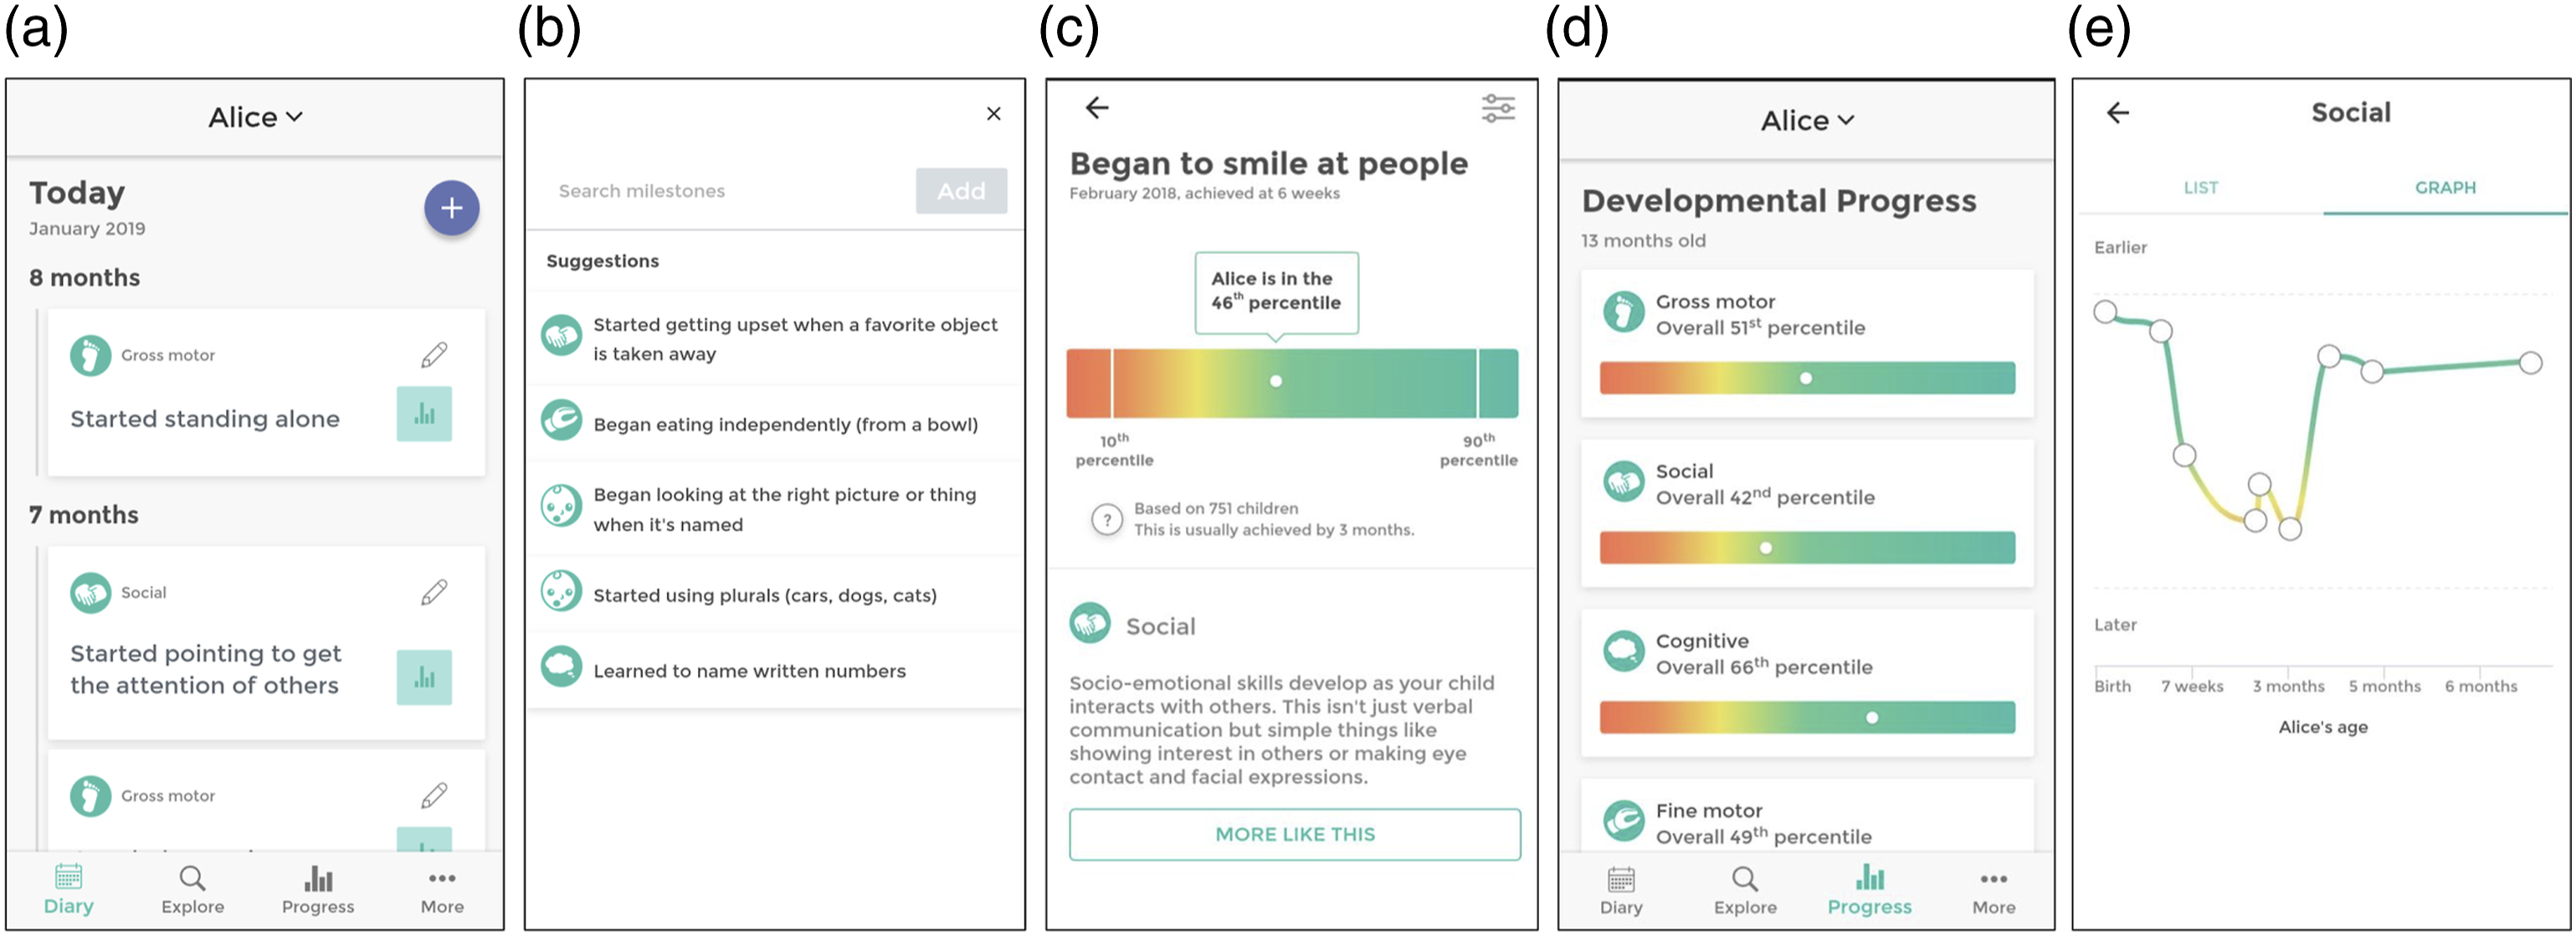
Parents receive reports about their child’s developmental progress in percentiles, computed by comparing a child’s age at attaining a milestone to the other ages reported for over 3800 children in the system. As illustrated in Figure 1(c), a child named Alice “began to smile at people” at age 6 weeks. Of the 751 other babyTRACKS children with this milestone in their diary, 46% achieved it at a later age (and 54% at an earlier age), giving Alice a 46th percentile score for the milestone. Parents of preterm children received by default age corrected percentiles but could filter back to non-corrected percentiles.
On the progress report page, parents view their child’s percentiles for each milestone (Figure 1(c)), developmental domain percentiles (Figure 1(d)) and progress per developmental domain over time (Figure 1(e)), with graphics shading from red near the 10th percentile to green towards the 90th percentile. Most users (70.7%) appreciated the statistical information presented on the app. 30 Report page included a disclaimer stating that: “Data provided does not replace qualified medical assessment”.
Crowdsourcing and babyTRACKS data
Crowdsourcing refers to tasks that leverage the public’s power to use their collective wisdom and resources to solve problems that require human intelligence and cannot be automated. 31 Crowdsourcing has been used for several healthcare purposes in genomics, diagnostics, and psychiatry.32,33 In pediatrics, a few studies used the public to improve, for example, the autism diagnostic process. 33 However, these projects recruited the paid/unpaid crowd to improve data classification, as opposed to a live system in which parents initiate, collect, and interpret data.
Crowdsourcing can benefit child developmental screening by providing parents live percentiles for their personal diary milestones, independent of accessing a local expert. These data can prompt parents to approach a provider for further assessment, as needed. They can also facilitate aggregating a global, open-access, contemporary developmental milestone database. 34 Previous babyTRACKS research underscored the reliability and developmental value of the expert-curated crowd data approach of this system. 34 Nonetheless, the ‘noise’ associated with the variability in what, how, and when these data are recorded requires clinical investigation before integrating it into routine care.
babyTRACKS domain percentiles differ from traditional standard scores in three main parameters: 1. Number and type of milestones: Each child is screened on a different set of milestones that contribute to their domain percentile. 2. Age points: For each child, the domain percentiles reflect a different combination of age points. 3. Reference group: babyTRACKS milestone percentiles reflect the child’s age of attainment compared to the subset of children whose parents also reported this milestone.
Previous preliminary babyTRACKS evidence showed promising internal validity by replicating two patterns observed in traditional screening measures: preterm children had significantly lower Gross Motor and Social percentiles than full-term children, and boys had lower Social percentiles than girls. 28
Objectives
The current report evaluated the external clinical validity of babyTRACKS percentiles based on three studies, each focused on a different traditional measure: 1. Comparison of babyTRACKS percentiles with CDC age recommendations for the full sample. 2. Association of babyTRACKS percentiles with their standardized scores from the ASQ-3 for a sub-sample. 3. Comparison of babyTRACKS percentiles and Mullen Scales of Early Learning (MSEL) assessment scores of a sub-sample.
Study 1: babyTRACKS and CDC
Study objectives were to: (1) examine how babyTRACKS percentiles relate to CDC age cutoffs, and (2) compare babyTRACKS percentiles between children who met versus did not meet CDC age cutoffs.
Methods
Parents downloaded the babyTRACKS app from the Google or iPhone store. Registration required parents to enter their child’s birth date, sex and gestational age at birth in order to open a diary.
Among a sample of 3832 children with at least one diary milestone reported, the current study focused on 1951 children with at least five milestones.
Mean age at registration was 9.6 months (SD = 12.02). Boys represented 51.56% (n = 1006) and 57.61% children were first-born. Gestational age at birth ranged from 24–43 weeks (M = 38.68, SD = 2.26), with 12.40% born before 37 weeks. Average birth weight was 3.18 kg (SD = 0.62; reported for 93 children). Of 1842 with their country registered, the top eight were Israel (26.38%), USA (16.23%), India (8.6%), United Kingdom (7.4%), South Africa (5.2%), Philippines (5%), Australia (4.7%), and Canada (4.1%).
The diaries of this sample contained on average, 16.19 milestones (SD = 18.78, range 5–271) entered in 2.44 sessions (SD = 4.07, range 1–80). The distribution of milestones by domain within a diary was on average, 32.79% for the Gross Motor, 32.05% Social, 21.45% Cognitive, 20.80% Language, and 19.80% Fine Motor domains.
Measures
babyTRACKS milestones
At the milestone level, a child’s age is ranked compared to the ages of all children with that milestone. babyTRACKS total and domain percentiles (i.e., Gross Motor, Fine Motor, Cognitive, Language, and Social) 1 are computed as the median of all milestone percentiles in a diary. A child’s domain percentile reflects the milestones entered in the diary, the number of children with those milestones and their reported ages.
The database included 804 milestone concepts. These refer to the concept under which all semantically similar, but linguistically different, milestones are classified. The babyTRACKS system relies on Curated Crowd Intelligence (CCI) methodology—an expert curation process that enables aggregating statistics for syntactically different but semantically similar milestones entered by parents. For example, the milestones “Started walking,” “Beginning to toddle,” and “Mikey is walking” were all combined into a “walking” milestone concept. CCI minimizes redundancy in milestones and maximizes sample size for percentile computations.29,34
Among 567 (70.52%) developmental milestone concepts, 199 (34.04%) were comparable to CDC milestones. The popularity of specific milestones varied greatly (M = 60.52, Mdn = 15, SD = 107.15). The distribution of ages of developmental milestones reported had a median of 13.53 months (mean = 13.9, SD = 5.44 months).
CDC developmental milestones
The CDC published milestones a child should achieve for 10 ages, from 2 months to 5 years. CDC milestones span Gross Motor, Fine Motor, Cognitive, Social and Language development. 19 These lists are based on information from two clinical textbooks.35,36
Data analysis
Three child development experts compared the babyTRACKS milestone concepts with the CDC list, and found that 34.92% corresponded closely with CDC milestones. Examples of babyTRACKS milestones judged as comparable to CDC milestones are: “Began to recognize familiar faces”, “Started to bring things to mouth”. Examples of milestones that were not comparable: “Is now able to hold bottle independently”, “Moves head from one side to another while lying on tummy” (for more examples see) 34 .
For each diary the ages of babyTRACKS milestones were compared with the ages at which the CDC stated they should be achieved. A composite score was created for the percent of milestones within a diary that did not meet CDC age cutoffs. In addition, for the whole database we computed a difference score between CDC and babyTRACKS milestone ages (e.g., the babyTRACKS “crawling” milestone age of 8 months, subtracted from the CDC “crawling” cutoff of 9 months, yielded a 1-month age difference), and computed a median domain age difference score.
The babyTRACKS domain percentiles were not normally distributed. The percentage of unmet milestones according to the CDC age threshold was skewed towards zero, as expected in a typically-developing sample: 54.54% had no unmet CDC milestones. Therefore, analyses relied upon non-parametric Spearman Rho and Mann-Whitney tests. p-values were based on Bonferroni correction.
Results
Overall median difference between CDC and babyTRACKS ages was 5.3 months, ranging from 3.8 months in the Gross Motor to 7 months in the Cognitive domain (Figure 2). Differences between CDC and babyTRACKS ages (in months), per Developmental Domain.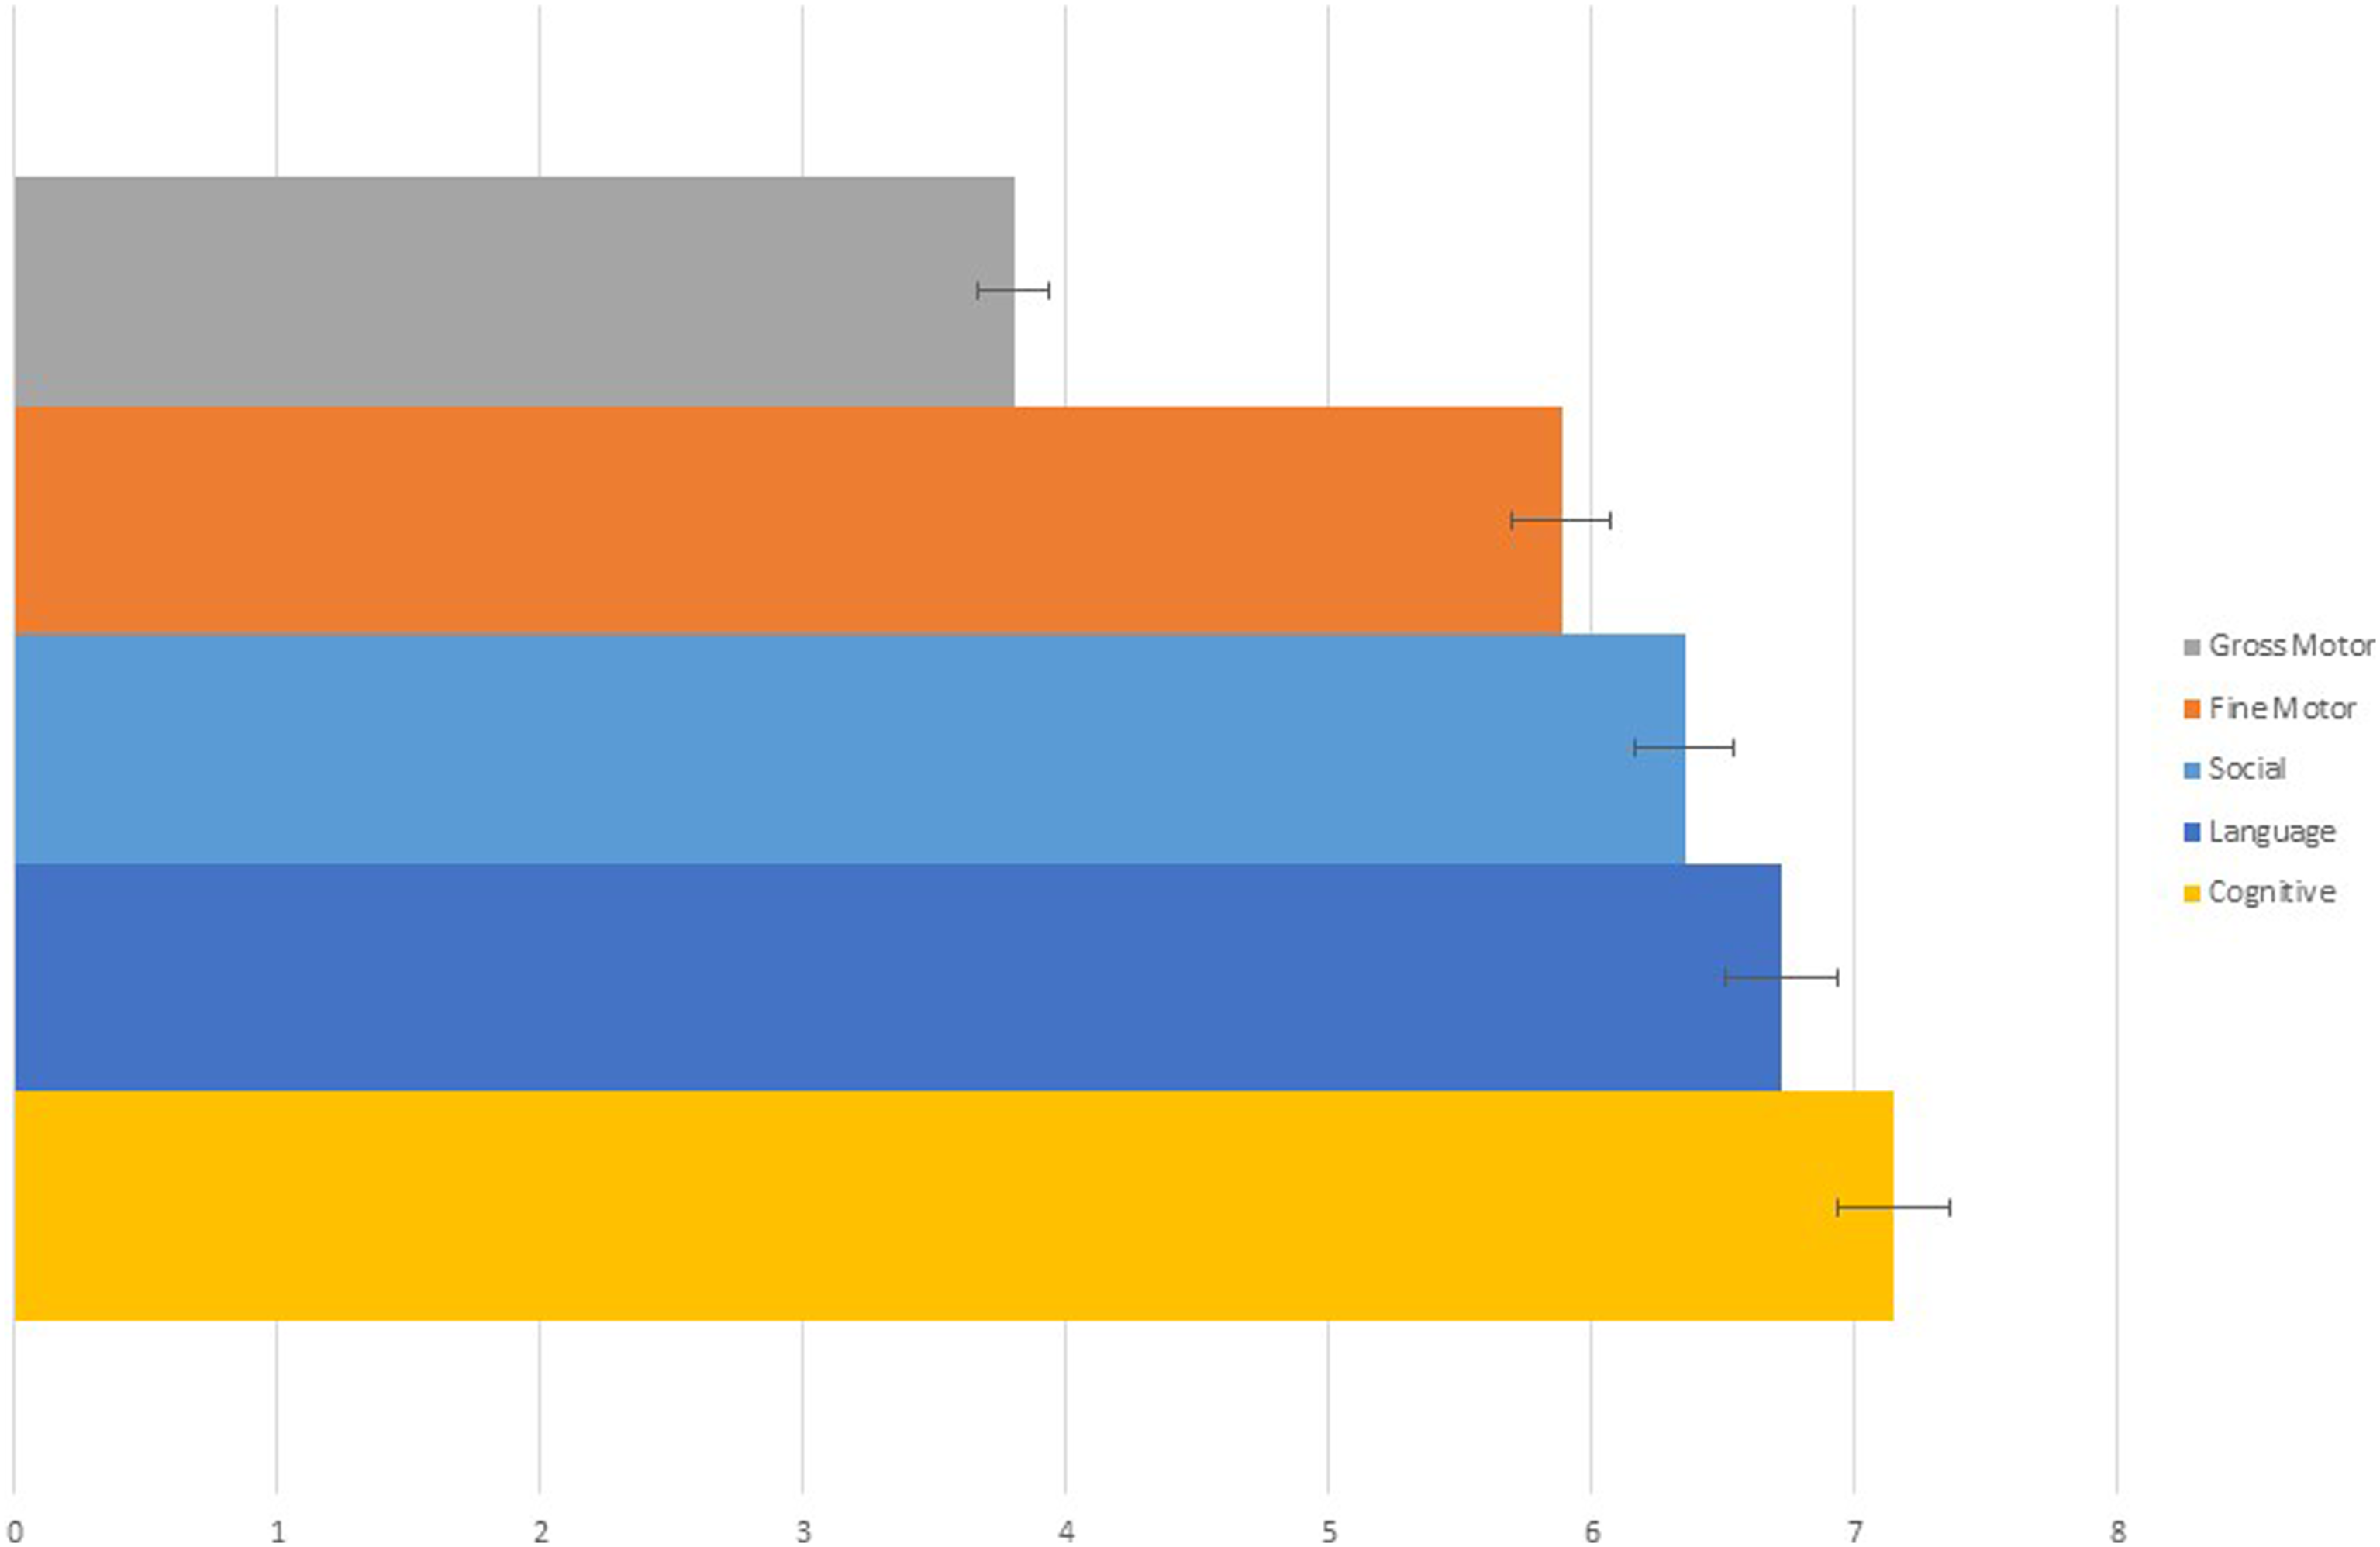
The percent of unmet milestones according to CDC age cutoffs was strongly correlated with babyTRACKS overall percentiles (r = −0.67, p < .001), with lower percentiles corresponding to higher percent of unmet CDC milestones. Spearman correlations were significantly high between percent of unmet CDC milestones and babyTRACKS domain percentiles (Gross Motor −0.60, Fine Motor −0.51, Cognitive −0.55, Language −0.59, Social −0.58; all p < .001).
We also compared median babyTRACKS domain percentiles between children who did not meet one or more CDC milestone age cut-offs versus those who met (Unmet = 885/1947 versus Met = 1062/1947). Significant differences were observed across all domains using Mann-Whitney tests. On average, children with babyTRACKS domain percentiles around 30 had at least one unmet CDC milestone (Table 1).
Study 2: babyTRACKS and ASQ-3
This study tested correlations between babyTRACKS domain percentiles and ASQ-3 scores, and investigated whether children that the ASQ-3 identified as developmentally at-risk had lower babyTRACKS percentiles than those who were not.
Methods
A subset of families from Israel were recruited through social media and “snowball” methodologies. They were offered consultation with research team if developmental concerns arose. Families consented to participate and were sent a link to download the app. After using the app 2–8 weeks, and adding at least five diary milestones, they completed the ASQ-3 in Hebrew. Note that these families were included in study 1, and 13 participated in study 3.
Children in this subsample (n = 58) were 0.6–60 months-old at recruitment, on average were born after 39.3 weeks’ gestation (SD = 1.33), 51.7% were boys, and 75.6% were first-borns. Of the families, 97.59% recorded one child in the application. Most parents (96.6%) were married. Upon study participation, mothers were on average 29.75 years-old (SD = 4.01), 69.0% had an academic education (i.e., bachelor’s degree and higher), 29.3% high school education, and 37.9% worked full-time. Fathers were on average 33.97 years-old (SD = 6.19), 44.8% had an academic education, 43.1% high school education, and 82.8% a full-time job. Among the mothers, 71.1% considered themselves “good” or “very good” in English.
Measure
The ASQ-3 16 is a gold-standard screening tool. Parents answer 30 questions; 6 for each of five developmental domains: Gross Motor, Fine Motor, Personal-Social, Problem-Solving, and Communication. 2 The ASQ-3 contains 21 versions for age groups birth to 6 years. Items are rated “Not Yet”, “Sometimes”, or “Yes”. Domain raw scores are relative to age cutoffs. If the score is below 2 SD, the child is classified as “needs referral,” while a 1-2 SD cutoff score indicates a child requires monitoring in that domain. Several validation studies using the ASQ-3 were conducted in large samples of children from diverse backgrounds, reporting 70–90% sensitivity and 76–91% specificity.37–40
Data analysis
Comparison of median, mean (SD) babyTRACKS percentiles between CDC groups.
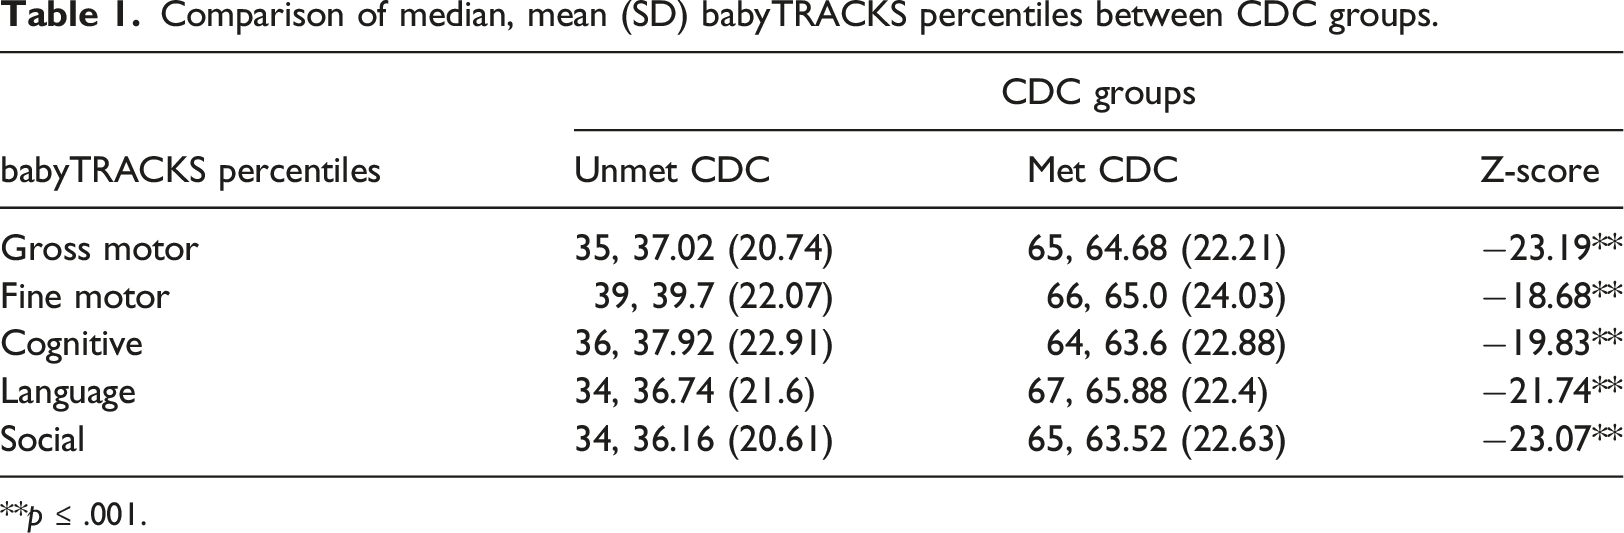
**p ≤ .001.
Results
Spearman rho correlations (r, n) between babyTRACKS domain percentiles and ASQ-3 scores.
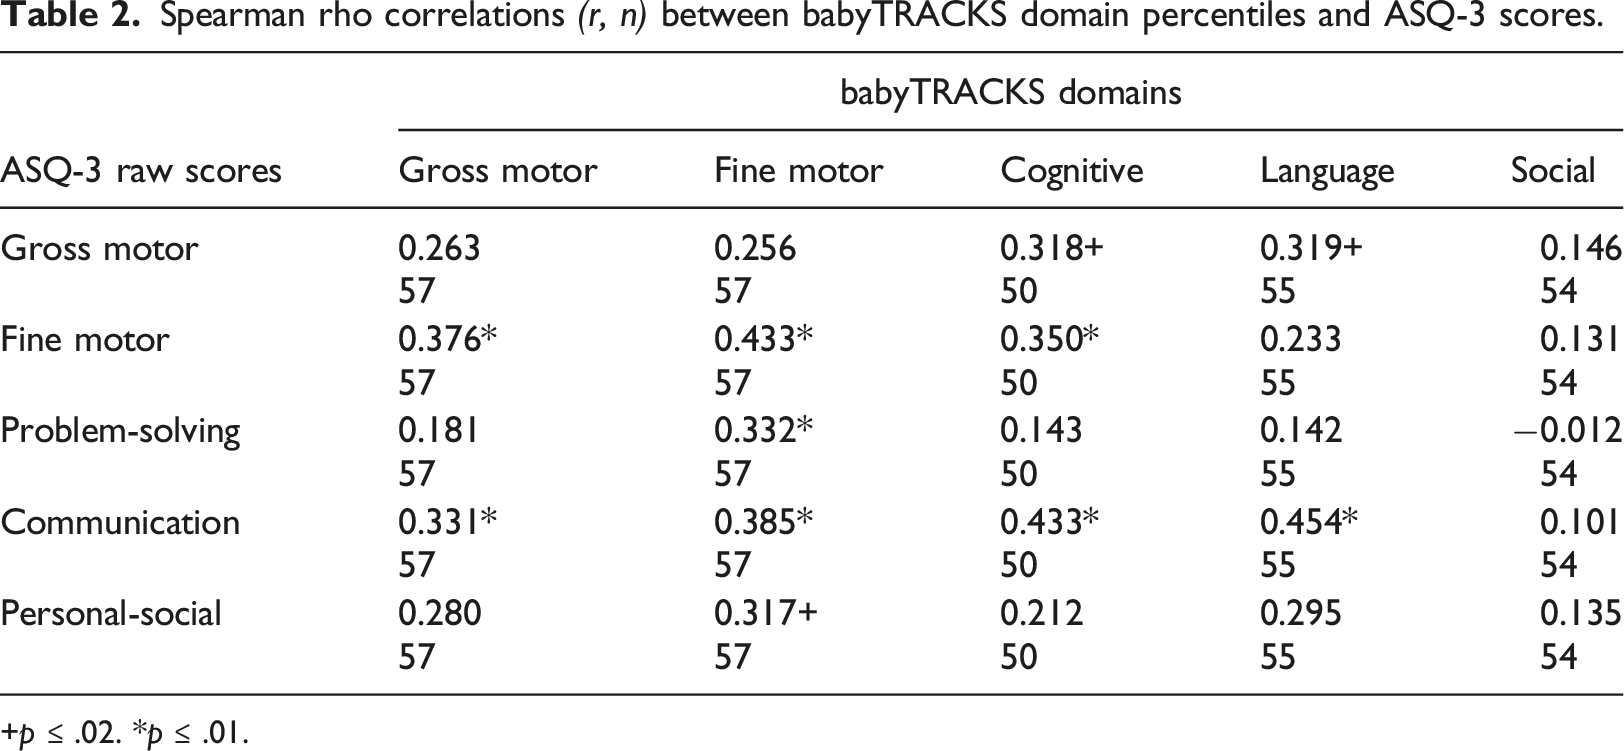
+p ≤ .02. *p ≤ .01.
Comparison of median babyTRACKS percentiles in comparable domains by ASQ-3 risk.
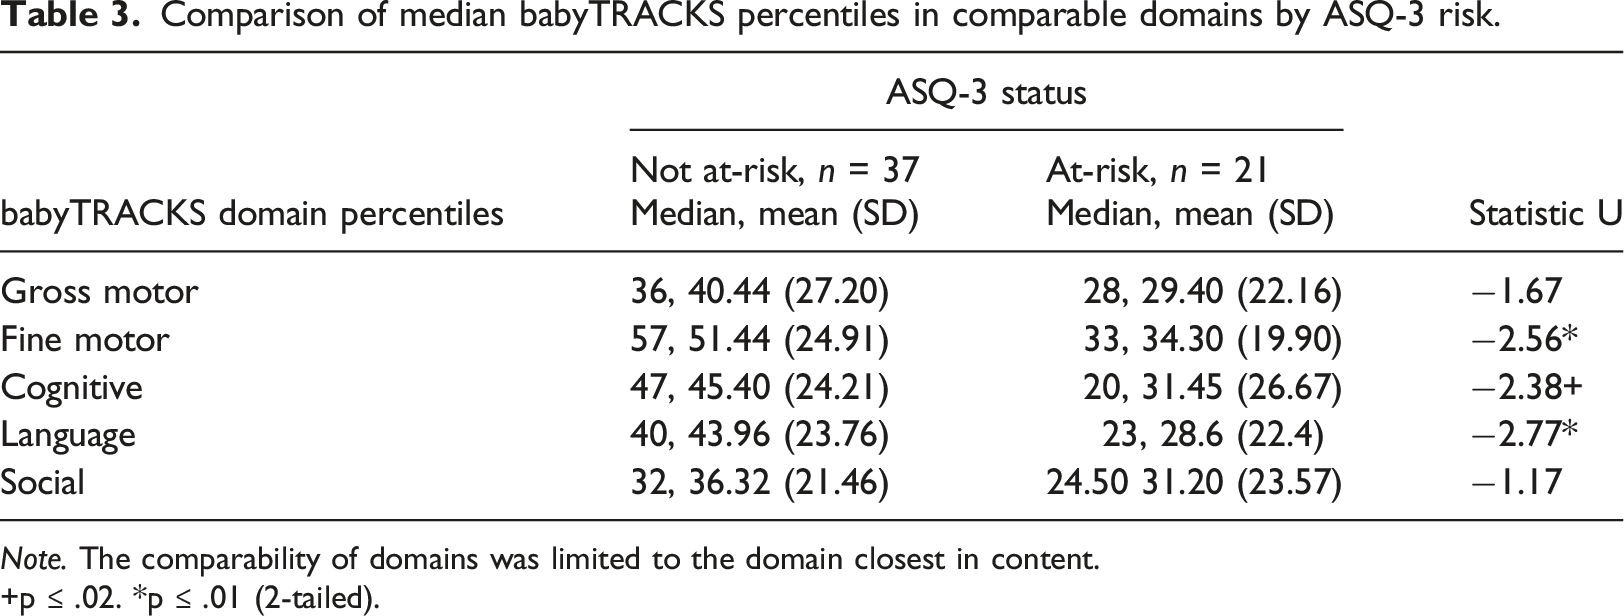
Note. The comparability of domains was limited to the domain closest in content.
+p ≤ .02. *p ≤ .01 (2-tailed).
Study 3: babyTRACKS and MSEL
This study investigated the degree to which babyTRACKS percentiles are associated with MSEL assessment percentiles. It also characterized the babyTRACKS profile of children with low MSEL scores.
Methods
A convenience sample was recruited through advertisements and social media in Israel. After consenting, families opened a babyTRACKS account and entered milestones at least weekly for 8 weeks.
After 8 weeks, a developmental assessment was scheduled with the family in the child’s home or the lab. A child development clinician administered the MSEL. Parents were asked to complete a questionnaire including the ASQ-3 (Study 2). Parents received a video of the assessment and if necessary, referred for clinical evaluation.
Thirteen families participated. Inclusion criteria were: (1) 1–24 months-old, (2) no diagnosed developmental delay or medical condition, and (3) the parent was proficient in English. Children were ages 1.5–13 months, median 6.2 months upon babyTRACKS registration. Median weeks of gestation was 40. There were 61.5% females and 53.8% were second children. Mothers had a median age of 34 years at time of research and 53.8% a Bachelor’s degree.
Measure
The MSEL assesses motor and language functioning from birth to 68 months. 40 It yields five scale scores: (1) Fine Motor, (2) Gross Motor, (3) Visual Perception, (4) Expressive Language and (5) Receptive Language, and an overall Early Learning Composite score (ELCS). In the normative sample, internal reliability for the ELCS was 0.91, and 0.75–0.83 for individual scales. The 1- to 2-week test-retest reliability in the normative sample of 1- to 24-month-old toddlers was adequate (0.82–0.96).
Data analysis
For this study, only babyTRACKS milestones parents recorded in diary by the date of the MSEL assessment were analyzed. Statistical tests were non-parametric due to the small sample size. Spearman Rho correlation tests were conducted between babyTRACKS and MSEL percentile scores. Wilcoxon signed tests were conducted to examine within-child differences between MSEL and comparable babyTRACKS domain percentiles. Since there is no comparable Visual Perception score in babyTRACKS and no Social score in MSEL, they were not included in the repeated measures analysis.
Results
Comparison of babyTRACKS and MSEL domain percentiles.
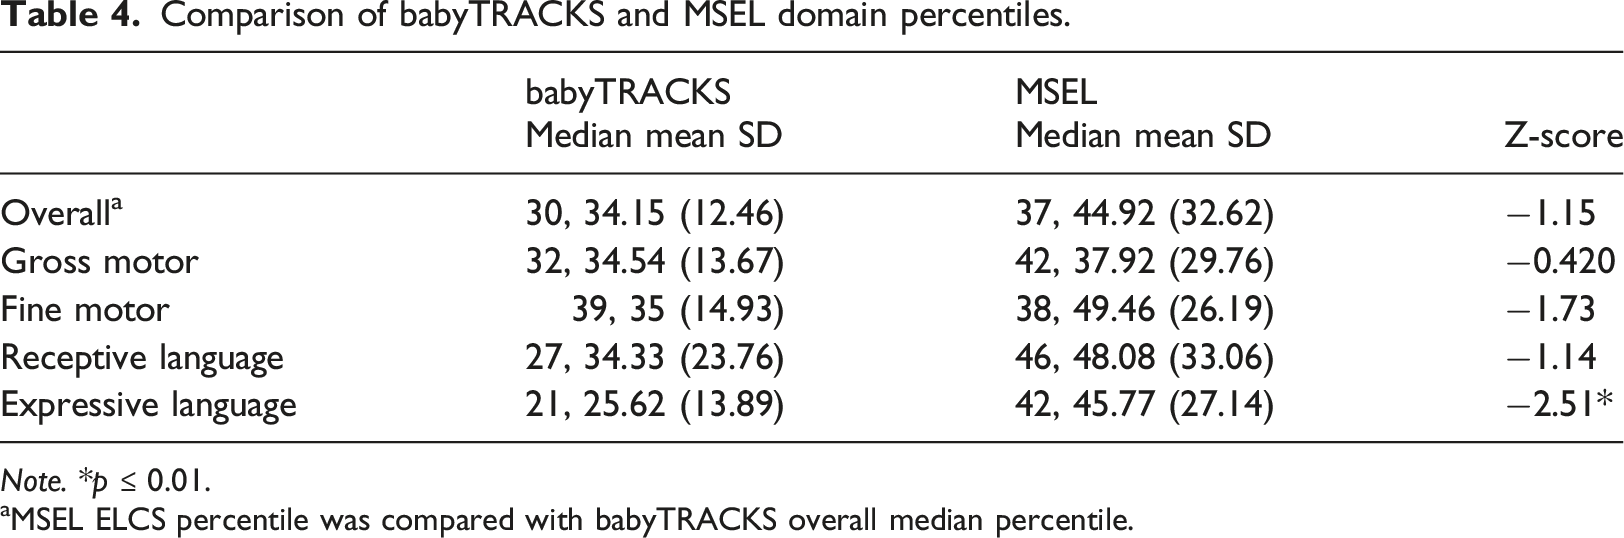
Note. *p ≤ 0.01.
aMSEL ELCS percentile was compared with babyTRACKS overall median percentile.
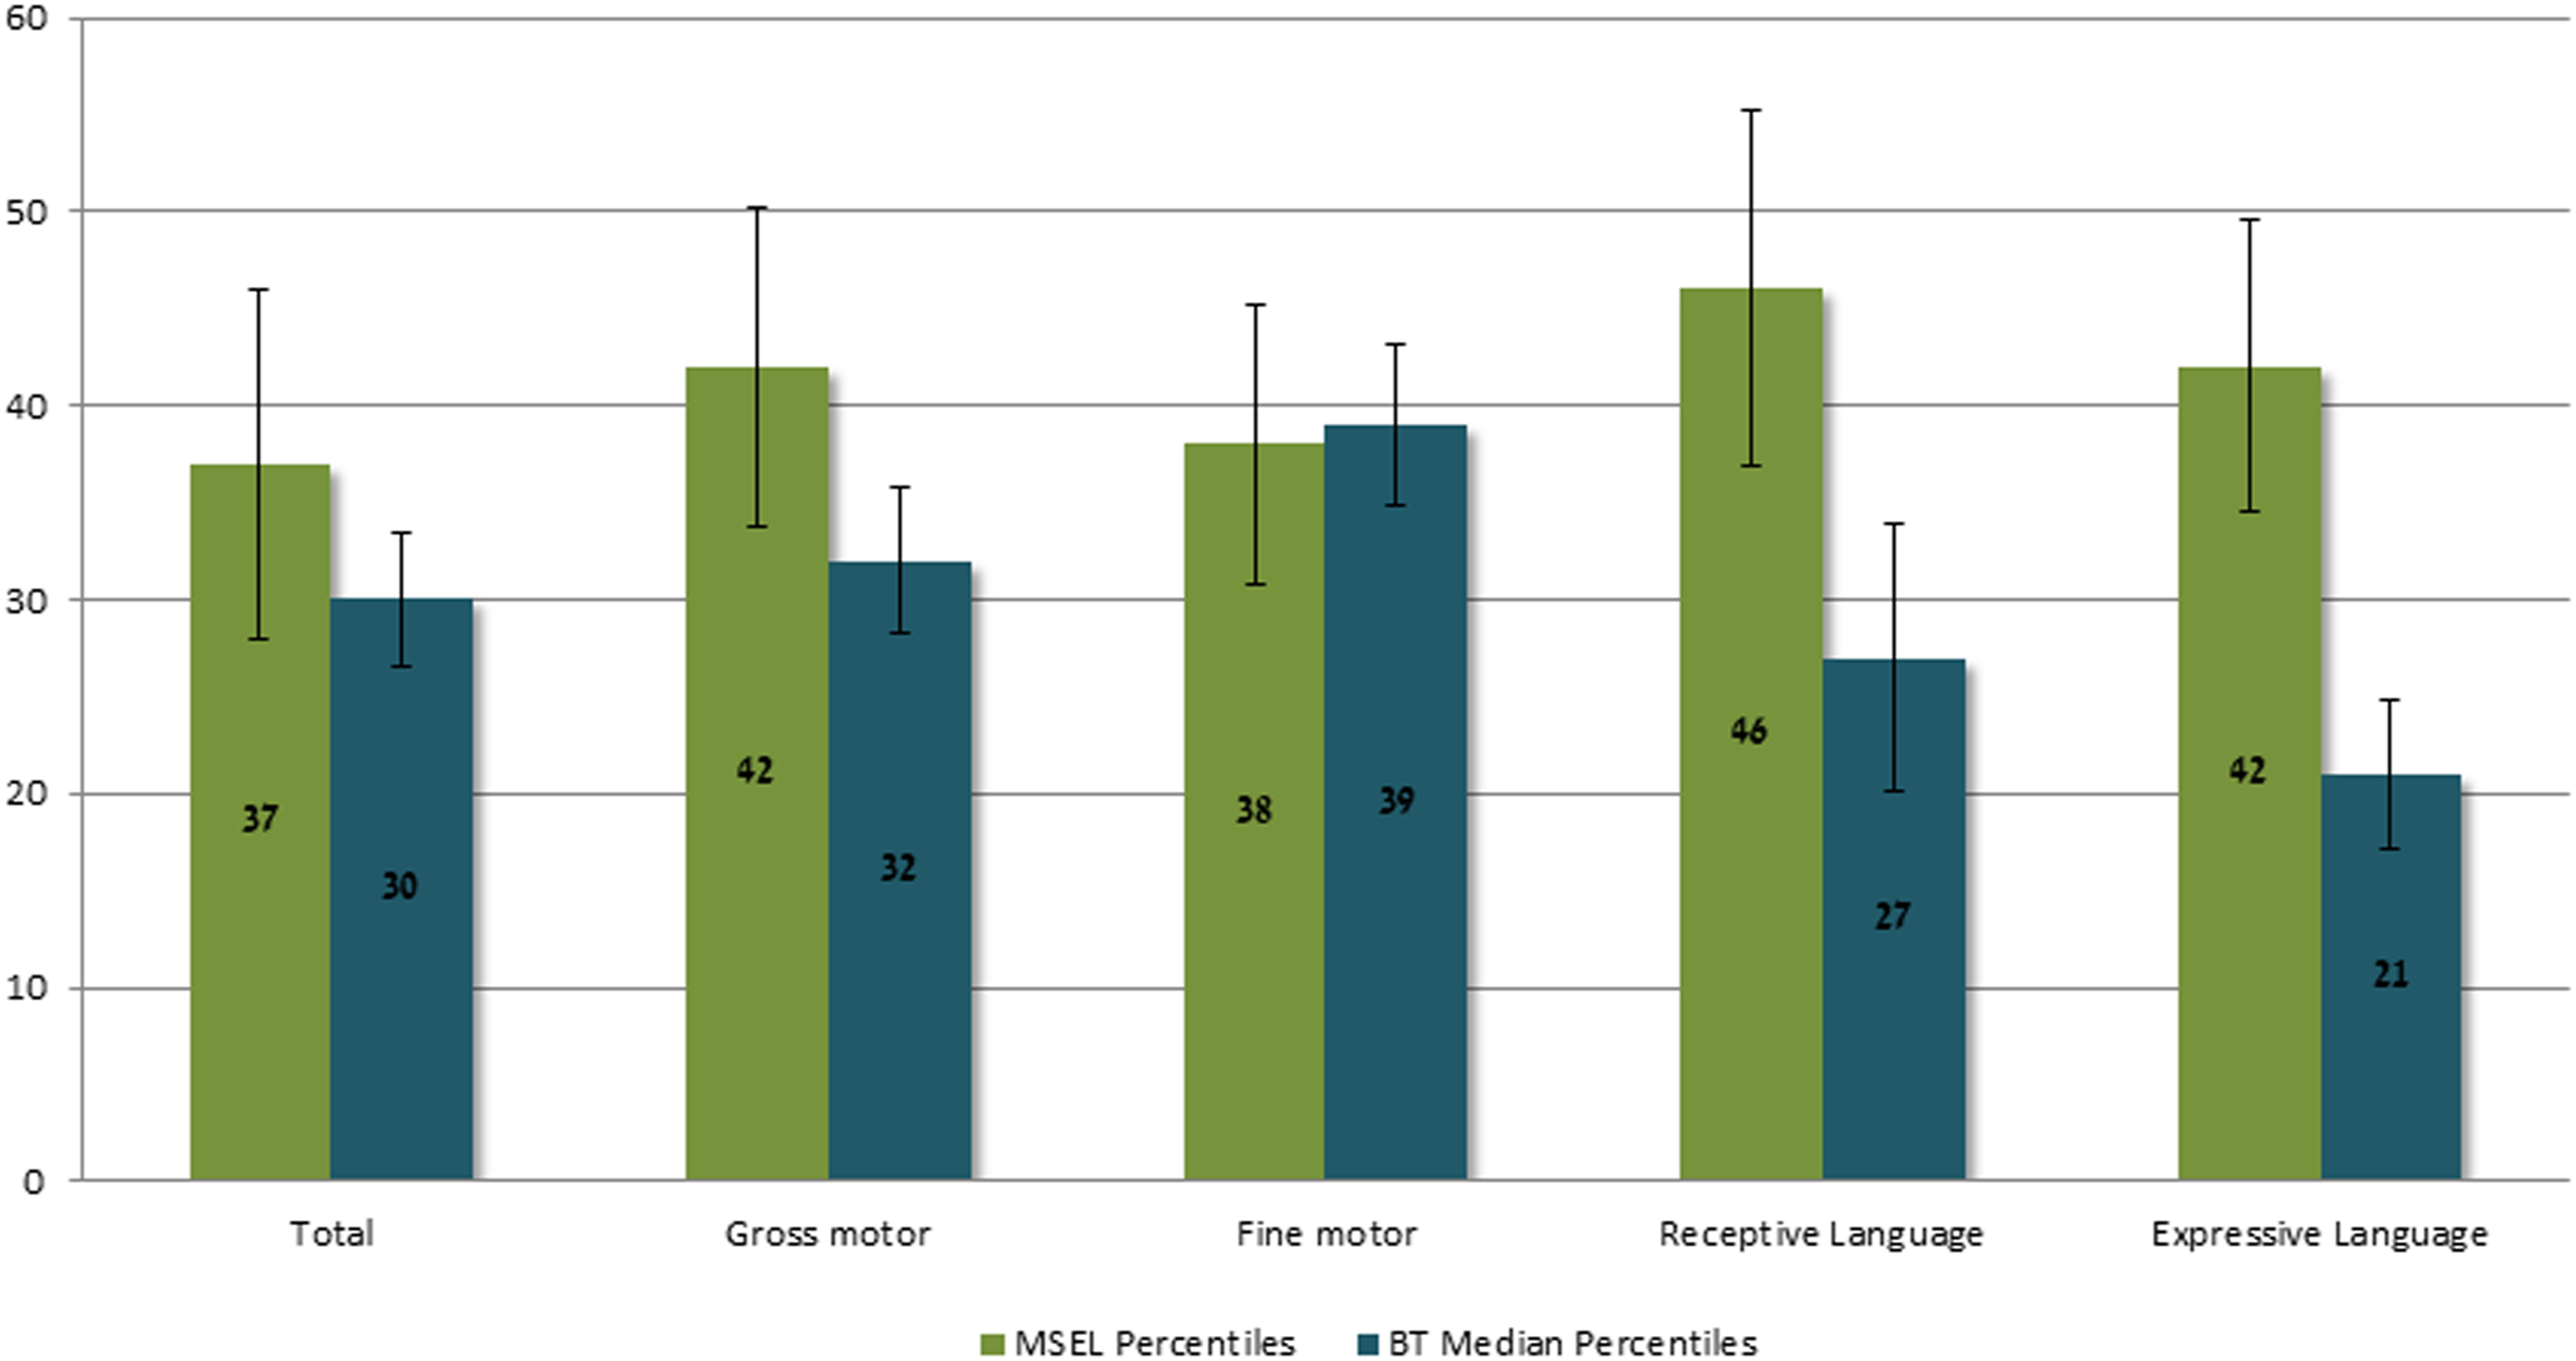
Median MSEL and babyTRACKS Percentiles. Note. In the Language domain, median babyTRACKS percentiles reflect Expressive and Receptive Language and not total Language scores.
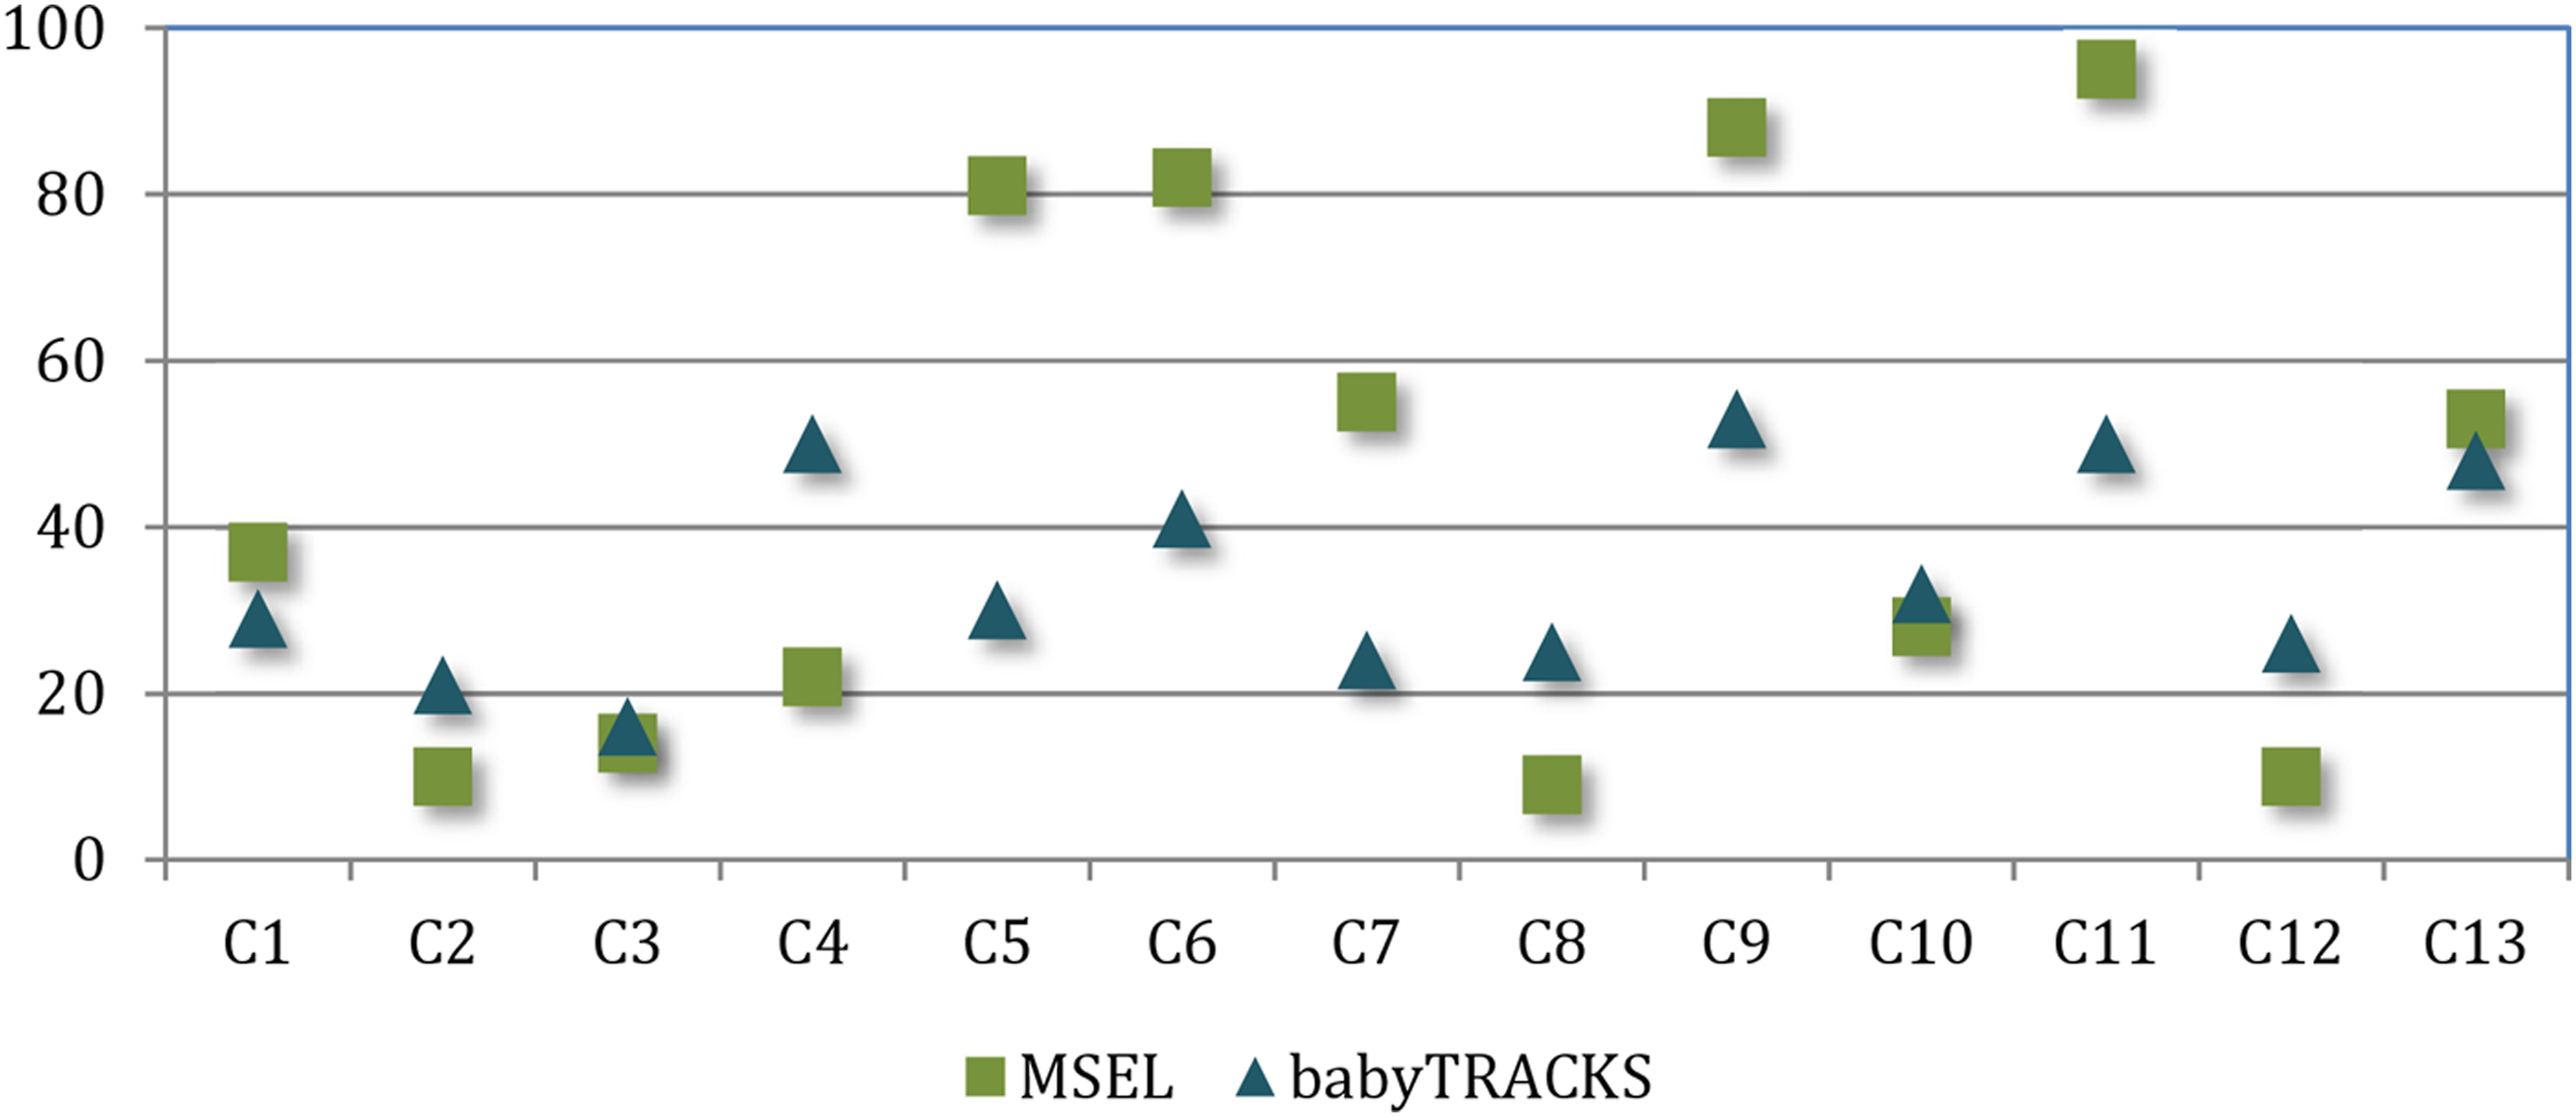
ELCS Percentile and babyTRACKS Median Percentile per Child.
MSEL spearman correlations to babyTRACKS domain scores (r, n).
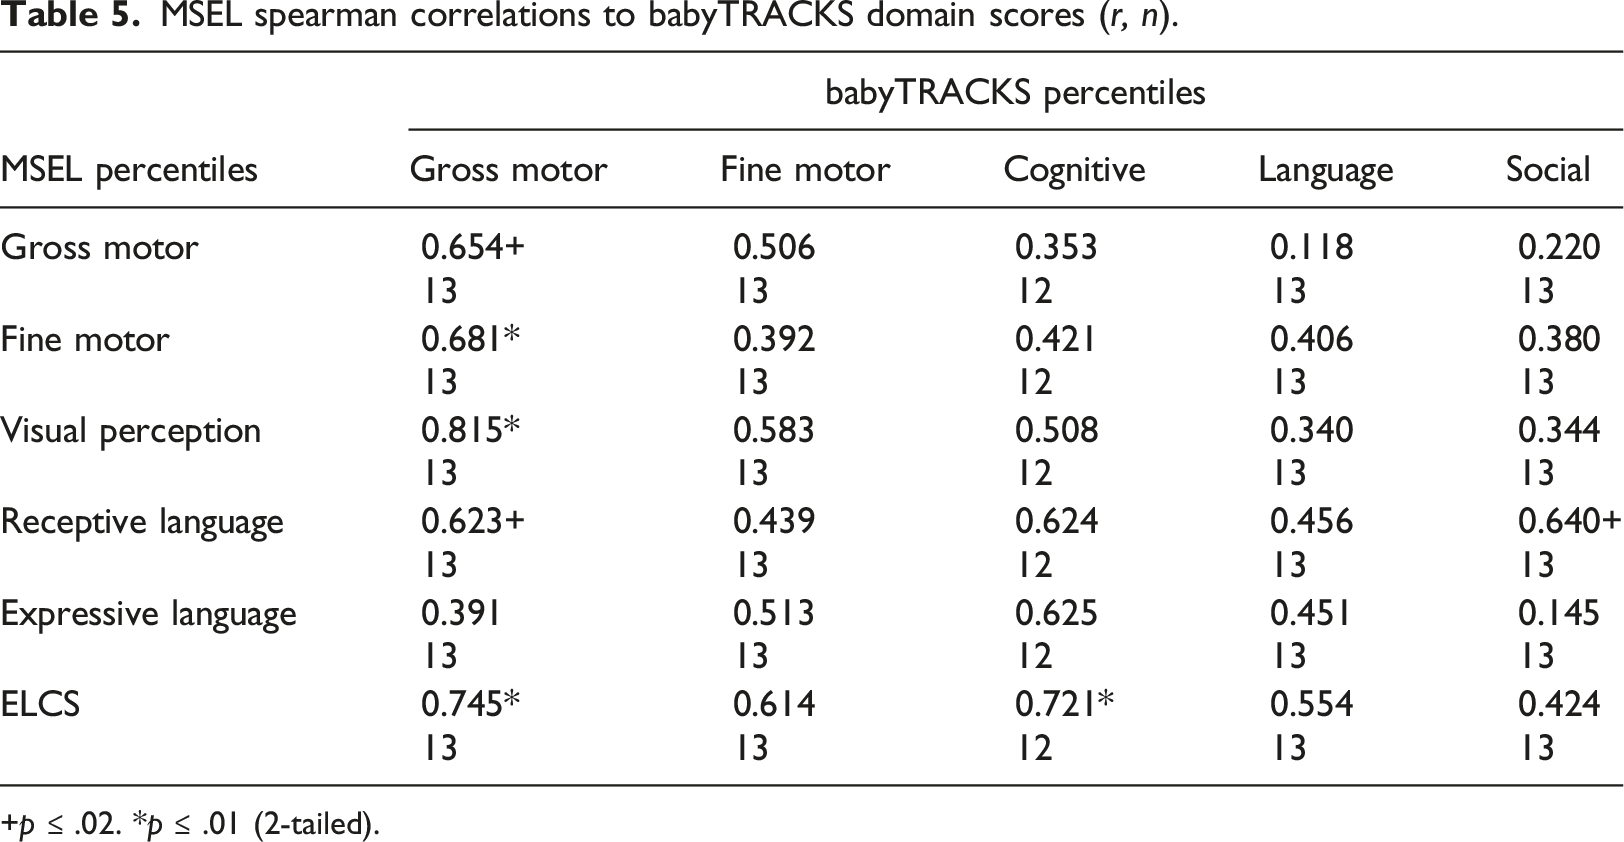
+p ≤ .02. *p ≤ .01 (2-tailed).
Table 4 presents Wilcoxon signed tests comparing MSEL percentiles to babyTRACKS percentiles, overall and within comparable domains. There were significant differences between babyTRACKS Language scores (Median = 24) and MSEL Expressive Language and Receptive Language scores (Z = −2.06, p = .04 and Z = −2.02, p = .04, respectively). MSEL Language scores were higher than the babyTRACKS Language percentile for 69% of the group. We explored which type of Language milestones in babyTRACKS contributed to this difference by analyzing Wilcoxon signed tests with the babyTRACKS Language domain divided into Expressive Language and Receptive Language scores. Results showed that Receptive Language percentiles were similar between measures. However, 77% of the group had higher MSEL Expressive Language scores than babyTRACKS Expressive Language percentiles.
Discussion
The COVID-19 pandemic increased the need to help parents track their child’s development, in partnership with healthcare providers, to obtain earlier diagnosis and intervention. Crowd sourcing aided public health during the pandemic 41 and this paper suggests its value for developmental screening. babyTRACKS is a platform that tracks young children’s development using personalized, crowdsourced data. This 3-phase study determined the relation between crowd-based percentiles and three types of traditional developmental indices: CDC-determined milestone ages, the ASQ-3 parent questionnaire, and MSEL assessment.
Can babyTRACKS detect developmental needs?
Unlike data-driven mobile trackers such as Fitbit™, which presents users’ physical activity relative to others to motivate an active lifestyle, data provided by babyTRACKS is sensitive, as it can indicate neurodevelopmental concerns. Therefore, thorough, validity testing using multiple tools is needed before output from this tool can be interpreted as a signal for action. The goal of babyTRACKS’ data sharing is to reassure parents about typical development and increase awareness of children’s weak areas, to encourage earlier contact with experts when needed, while avoiding needless alarm. In absence of validated thresholds, babyTRACKS visually displays lower versus higher percentiles, and notes that concerned parents should approach their providers. The platform does not aim to replace providers or traditional screening measures, but rather spurs prompter access. Findings strengthen the concept that crowd-based data can be clinically meaningful for monitoring young children’s development.
babyTRACKS percentiles and the percentage of unmet CDC milestones, ASQ-3 scores, and MSEL percentiles were significantly correlated. babyTRACKS scores differentiated those with lower versus higher developmental levels according to the CDC age cut-offs and ASQ-3. Children who did not meet at least one CDC threshold had babyTRACKS percentiles below 40 across domains, versus above 60 for those who surpassed all CDC thresholds. Given the much older CDC-recommended ages, a child not meeting one CDC milestone sufficed to detect a lower babyTRACKS profile. Children considered at-risk based on the ASQ-3 had lower babyTRACKS Language and Fine Motor percentiles and marginally lower Cognitive percentiles. Of the 6/7 children with a total MSEL percentile under 40, all had babyTRACKS percentiles under 30. The high variance in crowd-based percentiles requires further research to translate these scores into clinical practice.
Considering these findings, the color scheme applied in babyTRACKS reports denoting the 10th percentile as red and 90th as green, seems conservative. This scheme alerts only below the 10th percentile, while at the 30th percentile some children had low MSEL scores. Future design of data-driven developmental tracking platforms should weigh the need to implement lower age thresholds to decrease false negative rates with the need to alert parents of children with mildly lower percentiles across multiple domains. The next step would be to study how parents interpret and act on the data.
Crowd-based versus clinical age recommendations
Parents’ reports of the onset of competencies in babyTRACKS can be considered part of the current era of rapid information sharing and searching42,43 and baby quantification. 44 The younger babyTRACKS ages, relative to CDC-recommended ages, agrees with research indicating discordance between CDC recommendations and other norms.19,34 Median age differences between babyTRACKS and CDC ranged from almost 4 months for Gross Motor to about 7 months for Cognitive milestones. This gap can be attributed to babyTRACKS recording the age at which children first achieve a milestone as opposed to CDC reflecting ages by which parents should worry if not achieved. Among the children, 54.6% reached all CDC-comparable milestones earlier than the CDC thresholds and 89% had no more than three unmet CDC milestones, consistent with previous research. 34 One advantage of babyTRACKS tracking of emerging milestones is its relevance to all parents, not only those concerned or at-risk. Thus, it fosters age-appropriate parent expectations and enables detection based on a child’s developmental trajectory.
Do crowd-based percentiles perform similarly across developmental domains?
The association between babyTRACKS and traditional measures’ scores differed across developmental domains. The hypothesized within-domain correlations were strongly confirmed for the MSEL small group study. Fine Motor domain scores correlated between babyTRACKS and ASQ-3 ASQ-3 Communication correlated with babyTRACKS Fine Motor, Language and Cognitive domains scores.
babyTRACKS Social and Cognitive scores did not correspond within-domain with the ASQ-3. This can be because these babyTRACKS domains comprise different types of milestones than their ASQ-3 counter-domains. ASQ-3 Problem-Solving did not correlate with the babyTRACKS Cognitive domain, as it is strongly influenced by fine motor skills, as seen in its correlation with babyTRACKS Fine Motor percentile. Whereas babyTRACKS Cognitive, primarily describes Receptive Language.
Content differences can also explain the dissociations between babyTRACKS Social domain and ASQ-3 scores and with MSEL Receptive Language. ASQ-3 and MSEL do not address babyTRACKS Social domain milestones of non-verbal communication, social, emotional and regulation. Parents were obviously interested in tracking these milestones as they contributed 36.4% of the babyTRACKS database. The ASQ-3 Personal-Social domain includes several self-help items, explaining its relation to babyTRACKS Fine Motor domain. Monitoring social, emotional, and regulation development from infancy is important to include in general screening tools (e.g., PEDS;45,46 and in tools intended to detect autism-related disorders (e.g., First Year Inventory). 47 These areas are poorly represented in standardized tools. 19 Future research using specific social and emotional screening and assessment will enable clinical validity testing.
Crowd percentiles and diagnostic evaluation
When building digital healthcare tools for conditions such as diabetes and high blood pressure, the cutoff alerting patients to seek help is defined by gold-standard guidelines. In the case of developmental screening, there is no gold-standard for age cutoffs agreed upon across traditional checklists. 19 Additionally, self-tracking tools must minimize over-detection.
Within-domain correlations between babyTRACKS and MSEL percentiles were above 0.60, and high cross-domain associations provided preliminary indications for the correspondence between babyTRACKS profiles and children’s clinical profiles. Repeated measures tests showed no significant differences in median percentiles across most domains. However, individually, the babyTRACKS diary underestimated 4/13 children, as noted by 30% higher MSEL ELCS percentiles relative to overall babyTRACKS scores. Further investigation of child, parent and measurement factors that contribute to this wide gap is needed.
Closer investigation of the higher MSEL scores for 69% of children showed that within babyTRACKS, Language (specifically Expressive Language as opposed to Receptive) was over-detected by babyTRACKS compared to MSEL. This requires further analysis with a larger sample and by age group. babyTRACKS diaries on average contained 17% Expressive Language milestones versus 5.3% Receptive Language. Screening for expressive language delays may require a more structured method, either including lists of milestones or notifying parents to enter language milestones beyond what they would spontaneously notice. Supplementing babyTRACKS language screening using other language tracking technologies such as LENA 48 might also be considered.
Limitations and future research
Adding follow-up assessments and mapping children’s babyTRACKS outcomes to their routine healthcare records would advance predictive validity testing. In addition, most users entered the app for 1-2 sessions. This may have created bias in the age lag between milestone occurrence and recording. Further work is needed at the design level to maintain parent’s routine use of the app and at the research level to unfold the impact of such bias.
A larger sample is needed. Most Israeli users (308/491) were personally recruited for babyTRACKS research projects, including the current assessment, as opposed to the 1640 participants who independently downloaded babyTRACKS. Thus, parents in the Israeli sample may have had more developmental concerns, were more educated (such as above-average English skills required to use this English-language app), and have heald a stronger research orientation. Although we recruited children without diagnosed conditions, the assessment data indicated that some needed further evaluation.
This study focused on assessing the clinical validity of the outcomes of a self-tracking platform. In an era in which patients are increasingly searching for tools to manage health and in which resources for preventative healthcare are limited, testing validity is critical to enabling families to act on their tracking data. Further research examining providers’ interpretations of crowd-based percentiles is important to facilitate transferring baby quantification/monitoring measurements into practice.
One of the novelties of babyTRACKS, as a developmental milestone evaluation tool, is the open-ended nature of entering milestones. Users could choose what milestones they want to author or adopt from the crowd. While common milestones appeared more often in a user’s exploration of the database there was no compulsory entry of a certain core list of milestones. The few app sessions parents engaged in calls for finding the balance between an open-ended journal like pro-active experience and a guided structured survey method. Further research is needed to compare user experience and clinical validity of compulsory versus open-ended tracking.
Conclusions
This study presents the value of crowdsourcing developmental milestone data for tracking young children’s development. Although crowd data is noisy in nature, it enabled parents to receive rapid statistics for their child’s personal progress. Platforms that facilitate tracking across developmental domains and time points are needed to mirror universal developmental screening guidelines. 49 More-structured digital tracking and carefully-defined behaviors or observations are warranted to increase precision in some domains. If parents are already recording their child’s progress online, it makes sense to leverage that data to advance and inform early detection and improve the quality of community care.
Footnotes
Acknowledgements
We thank the team members for their contribution to the babyTRACKS system project: Gal Agmon, Moriah Anouchi, Daniel Moran, Eden Saig, Naama Tzur, and Yocheved Zaltz.
Declaration of conflicting interests
The author(s) declared no potential conflicts of interest with respect to the research, authorship, and/or publication of this article.
Funding
The author(s) disclosed receipt of the following financial support for the research, authorship, and/or publication of this article: EB received research funding from the Israeli Science Foundation (grants 1501/14 and 1435/18) and the US-Israel Binational Science Foundation (grant 2014-359). The funders had no role in study design, data collection and analysis, decision to publish, or preparation of the manuscript.
Compliance with ethical requirements
This study was approved by the institutional review board of the University of Haifa (061/19). The authors whose names are listed above certify that all procedures performed in studies involving human participants were in accordance with the ethical standards of the institutional and/or national research committee and with the 1964 Helsinki declaration and its later amendments or comparable ethical standards.
Informed consent
Informed written consent was obtained from all individual participants included in the study.
Availability of data and material
No - some restrictions will apply.