
Abstract
Background
Emergency Department (ED) overcrowding is an emerging risk to patient safety. This study aims to assess and compare the predictive ability of machine learning (ML) models for predicting frequent ED users.
Method
Korean Health Panel data from 2008 to 2015 were used for this study. Individuals with four or more visits per year were considered frequent ED users. Logistic Regression (LR), Random Forest (RF), Support Vector Machine (SVM) as well as two ensemble models, namely Bagging and Voting, were trained and tested to examine their predictive performance.
Results
The ML classification algorithms identified frequent ED users with high precision (90%–98%) and sensitivity (87%–91%), whereas LR showed fair precision (65%) and sensitivity (67%). The ML algorithms showed a high area under the curve (AUC) values from 89% for SVM to 96% for Random Forest, while LR showed the lowest AUC (65%). The classification error varied among algorithms; LR had the highest classification error (24.07%) while RF had the least (3.8%).
Conclusions
Results show that ML classification algorithms are robust techniques to predict frequent ED users, and the variables in administrative health panels are reliable indicators for this purpose.
Introduction
Emergency care is a crucial and growing part of the emergency medical system. Emergency Department (ED) overcrowding is an emerging risk to patient safety and may significantly affect chronically ill patients as well as infectious disease patients. 1 For instance, overcrowding in an ED may cause delays in patient transportation or revenue loss for a hospital due to hospital diversion. 2 Frequent users with avoidable visits play a significant role in imposing such challenges on ED settings. Non-urgent or “avoidable” ED use accounts for a disproportionate percentage of ED visits, which results in overcrowding and cost increases due to unnecessary tests and treatment. 3 A systematic review in 2019 reported that in the US 14%–47% of total ED visits are attributed to frequent users who contribute to and account for 4%–16% of ED users. 4 Identifying these frequent ED visitors in advance will help providing stratified care management and resource allocation, leading to a decrease in cost and overcrowding of EDs, and improving the quality of care.
Frequent utilization of EDs is a challenging and contentious issue for healthcare system authorities 5 6 . Given the challenges associated with patient identification, predictive modeling is an approach to improve classification of frequent ED users who are most likely to cause a heavy burden on health care services in the future 5 . Although most current predictive models use classical methods like regression modeling 5 7 , more sophisticated machine learning techniques may be a better fit to increase the accuracy of outcome prediction with the utilization of big data.
Our study aimed to compare the performance of logistic regression and four other machine learning classification models for predicting frequent ED use. In this study, a nationally representative population-based study was used. Although national administrative databases are limited in clinical information, they have some advantages such as “accessibility” and “a greater number of features” 8 , making them an appropriate source for predicting future ED users.
Related work
Various research efforts have focused on understanding the utilization and factors leading to ED crowding by frequent users. The majority of these studies have used logistic regression, one of the preferred methods in the literature on predicting frequent ED users 7,9, however, a few of the studies used more complex machine learning techniques for predicting future ED visits.
For instance, Grinspan et al. focused on ED visits by children with epilepsy 10 . They used Health Record Data (HRD) from two centers in the US (Weill Cornell Medical Center and Nationwide Children’s Hospital) to predict the ED visits. They found the performance of the 3-variable model (i.e. prior ED use, insurance, number of antiepileptic drugs) equal or better than the machine learning algorithms. The models were evaluated by the expected annual ED visits by the top 5% of high-risk children in both centers 10 . The same researchers also investigated the predictability of different models for frequent ED visits (defined as ≥ 2 visits/year) among children with asthma 11 .
Another study investigated ML models to predict future ED visits using 4 years of data gathered through the California Office of Nationwide Health Planning and Development 12 . Pereira M. et al. predicted the frequent users using data between 2009 and 2010 and validated their models using the data between 2011 and 2013 12 . They compared a binary classification with different thresholds and found that the Area Under the Curve (AUC) improves with increasing the threshold for the number of visits. A strength of their study was the model validation using data from different years. Moreover, fitting the models for a rather large dataset with over 14 million data points was a solid practice of ML. They reported fair sensitivity (60%) and very low precision (9%) for frequent ED users. However, they have not been considered as the best option of the ML for such an extensive dataset because of their high sensitivity to outliers (AdaBoost) and instability (Decision Tree) 13,14.
Methods and materials
Korea Health Panel Study data (KHPS) between 2008 and 2015 were used for our study 15 . The ethics approval of this study was obtained by [blinded].
Study design
The KHPS is an official database carried out by the Korea Institute for Health and Social Affairs and the National Health Insurance Service since 2008. More detailed descriptions of the study design and profile have been published elsewhere 16 . Briefly, the purpose of KHPS is “to generate basic data on individual healthcare behaviors, health level, usage of health services, and healthcare expenditures”. The sampling frame is a national representative of the Korean population since it has used 90% of the 2015 Population and Housing Census data, and has employed a two-stage probability proportionate and stratified cluster sampling method. Sample weights for the KHPS were calculated after adjusting for unequal selection probabilities/non-responses and making a population distribution disclosure via post-stratification corresponding to the sample distribution. The core questions in the survey had 13 basic sectors and 10 additional sectors, including household items data, household member items data, health insurance data, chronic disease data, Drug use data, Long-term care data for adult household members, and emergency medical use data. The medical data was collected from multiple sources (not just one), including the use of medication, medical services, medical expenses and prescription drug receipts, or medical institutions/pharmacies. Disease (diagnosis) code and Korean Standard Disease Classification (KCD) were used. The KHPS began in 2008 and incorporated a total of 24,616 participants from 7387 households. New household members were added due to ongoing dropouts and to secure statistical reliability. In 2014, KHPS was strengthened with the addition of 2520 households to mitigate attrition. Using computer-assisted personal interviews, trained staff collected the data by visiting each household at three general levels: household, individual, and case-based. Comprehensive assessments of the use of healthcare services, cost of healthcare, and potentially influencing these have been conducted annually since 2008.
In this study, we included participants who had visited the ED at least once between 2008 and 2015. The ED users with four or more visits for any given year were considered frequent users. The registered data was stored in 16 separate datasets for the population under investigation. Emergency Department Utilization (ERU) and Household Member Information (IND) datasets in KHPS were used. In this study 9348 subjects are eligible for analysis and a total of 15,627 ED visits occurred between 2008 and 2015. shows the derivation of the study cohort Figure 1. Study flowchart.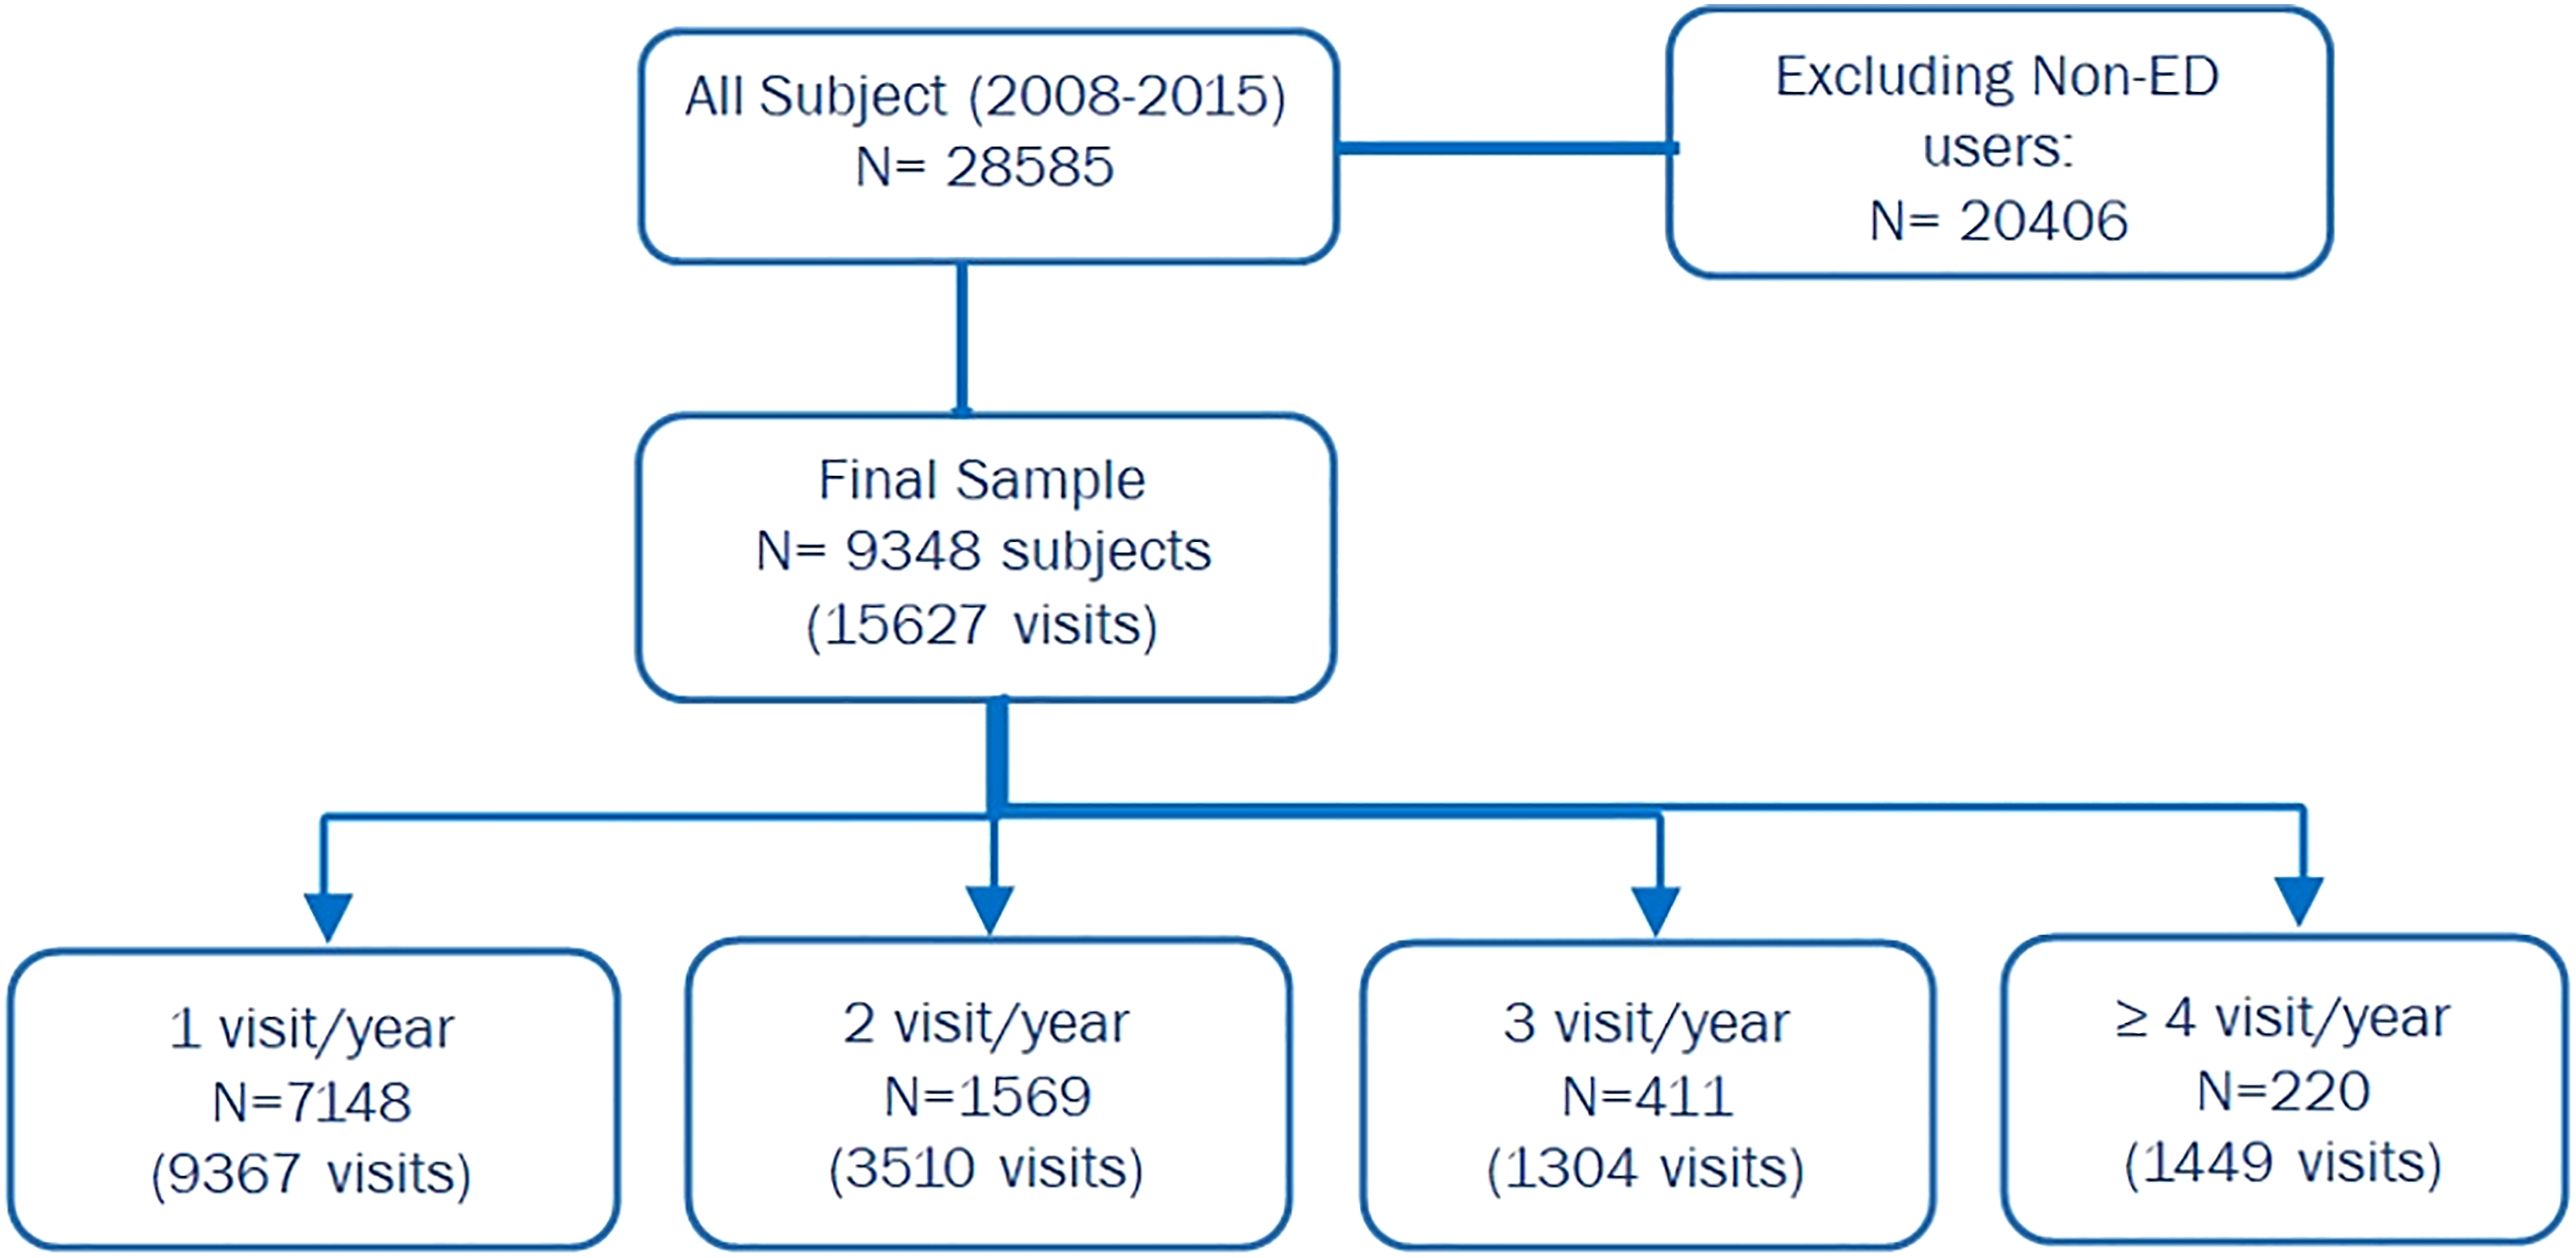
Study outcome and predictor variables
The outcome was measured as a dichotomized variable: frequent ED user as 4 or more visits per year and non-frequent ED user as 1 to 3 visits per year. In our study, frequent ED use was defined as 4 or more visits per year according to the most common definition in the literature 17 . Other studies consider frequent ED use with different ED visit numbers, depending on their settings, sample population, and objective 17 . In our study, 220 subjects (2.4%) were identified as frequent ED users. Predictive models were trained and tested for a given patient, predicting whether the patient will be a non-frequent ED user or a frequent ED user.
Data for each patient included (i) demographics (i.e. age, gender, type of insurance, residential region); (ii) reason for visit; (iii) access to ED (i.e. season of visit, day of the visit, type of transportation, visited ED (private vs public); and (iv) hospitalization (i.e. admitted/discharged after initial ED visit).
Data preprocessing
The original KHPS data contained 16 separate datasets per year. The ED visit information was extracted and merged on the PIDWON key (i.e. individual unique ID), which resulted in 9 new datasets with potential input variables for each year. Some variables were combined for one feature (e.g. season). Each of the created datasets had similar variables with different value types (e.g. binary, float, string, etc.) and some with different names. As a first step, all the features were unified. Some years recorded the diagnosis code as 4-digit codes, some as 5-digit codes, and some as alphanumeric codes. The 5 digit-code were recoded to the corresponding 4-digit according to the provided document attached to the KHPS database. The Alphanumeric codes on the other hand were re-coded to their 4-digist peer using the equivalent names of the disease as per the Korean standard classification of diseases 18 . In this study, the 4-digit codes were considered as the baseline, and the others were re-valued accordingly. After that, the disease codes were categorized into 26 groups in line with Korean Standard Statistical Classification (KSSC) 18 .
In the next step, all data types were transformed to fit logistic regression models and the other learning algorithms as applicable.
ED users were grouped into five age categories (0–14, 15–24, 25–44, 45–64, and 65+), as per the South Korea age structure (South Korea Age Structure - Demographics, 2020; https://www.indexmundi.com/south_korea/age_structure.html). Cities were divided based on the administrative districts of residence of patients. The administrative districts of South Korea were classified as the capital city, metropolitan cities, and provinces. Hospitalization was categorized as discharged and admitted (i.e. admitted and transferred to another clinic). Insurance status was grouped into National Health Insurance (NHI) and additional (i.e. those who had additional private insurance coverage to NHI, such as long-term care insurance, industrial disaster, and car insurance, etc.). Type of transportation was categorized into the ambulance (i.e. 911, clinical, other) and self-transportation (e.g. car, taxi, etc.). Time of Visit includes Season of the visit (i.e. Spring, Summer, Fall and Winter) and Day of Week to examine the possibility of ED visit on the weekends due to lack of out-of-hours access to primary care. The reason for the visit was categorized into 26 groups as per the South Korea Classification of Diseases (KCD) (Classification of Diseases-sixth Version, 2010).
Out of 15,725 data points, 98 had missing values in one or more columns. Missing data was registered as '-9′ in the original dataset. The missing values were removed from the dataset since they contributed to a small proportion of the final data (0.6%). In our data set, the ratio of non-frequent ED users to frequent ED users was about 90:10. Thus, Synthetic Minority Over-sampling Technique (SMOTE) was used to balance the data for a more accurate and reliable result 19 . It should be mentioned that over-sampling was executed only on the training data; therefore, the test data is true out-of-sample data and has not been leaked into training dataset to cause overfitting problem. After resampling, we had a total of 19,840 oversampled data for training the models. With the equal ratio of non-frequent users versus frequent users, we had 9920 for non-frequent users and 9920 frequent ED users in this oversampled data.”
Bivariate analysis
The majority of the ED utilization baseline characteristics were extracted based on conventions from the ED literature 17 , 20 . Means and standard deviations for continuous variables and percentages for categorized variables were presented. The Chi-square test was used for group comparison of categorical variables. Bivariate and multivariate logistic analysis was used to describe the relationship between these characteristics and frequent ED users. The final multivariate logistic model contained only significant predictors with p-values <0.05. Interactions among the main predictors in the final model were examined. The sample size guideline for logistic regression models from observational studies recommended the formula; n = 100 + 50i where i refers to number of independent variables in the final model. Our current study with 9348 patients was sufficient and justified for any regression models. Odds ratios (OR) and 95% confidence intervals (C.I) were calculated. All reported tests were two-sided, and α=0.05 was set for statistical significance. Python (Py 3.6.7) statistical tools was used for analysis.
Development of models
The dataset was randomly split into 70% and 30% of observations for training and test sets, respectively. Our study explored five predictive modeling techniques to account for irregularities often encountered in health data, such as missing data, bias distributions, large numbers of variables, and non-linear relationships among variables. These modeling techniques were: (i) logistic regression with the best subsets using Recursive Feature Elimination (RFE), which is a rather easy-to-interpret algorithm, and (ii) classification algorithms that may provide more accurate predictions, although they are more challenging to interpret. In our study, Support Vector Machine (SVM), Random Forests, Bagging, and Voting were used for classification algorithms.
Briefly, logistic regression with RFE identifies the best-fitting regression by recursively considering smaller and smaller sets of variables. Random Forest creates decision trees on randomly selected data samples drawn from a training set, gets a prediction from each tree, and selects the best solution through voting. SVM solves problems of both linear and non-linear data using kernel trick; it helps build a more accurate classifier by taking a low-dimensional input space and transforming it into a higher-dimensional space. For both RF and SVM we used Scikit-Learn built-in functionality, GridSrearchCV, with 10-fold cross-validation (CV). Since the full grid search would take a substantial time, only the most important hyperparameters were tuned and the rest were set as default. We built our RF model by setting the number of the estimator, n_estimatior= 1400, max_features (max number of features considered for splitting a node) = auto (max_features=sqrt (n_features)), and max_depth (max number of levels in each decision tree), nodes are expanded until all leaves are pure or until all leaves contain less than min_samples_split samples. (min_samples_split set to 2) 260. SVM critical parameters were tuned to kernel=‘rbf’, gamma= 0.1, C=1.0, class-weight=Balanced.
Bagging classifier, also known as Bootstrap Aggregation, combines subset learners to reduce the variance of estimates; it fits a base classifier on random subsets of the original dataset, and form the final outcome through combining individual prediction of each subsets by averaging. In this study, the Decision tree classifier was used as the base learner, n_trees set to 100, Of them, and the best model was chosen using K-fold CV. The voting algorithm, on the other hand combines predictions from multiple learners. We used Logistic regression, CART, and SVM to examine the prediction improvement compared to standalone logistic regression. Similar to former models, K-fold CV was used to select the best model and reduce the overfitting problem.
For each model, parameters were optimized using 100 iterations of a randomized search. Once the optimal parameters were selected, each model was trained on the complete training data set.
Our ML model developing process was derived from the ML analysis workflow suggested by Stevens et al. in Figure 2. Overview of machine learning analysis workflow from Recommendations for reporting machine learning analyses in clinical research by L. Stevenses et al. (2020) (https://www.ahajournals.org/doi/full/10.1161/CIRCOUTCOMES.120.006556).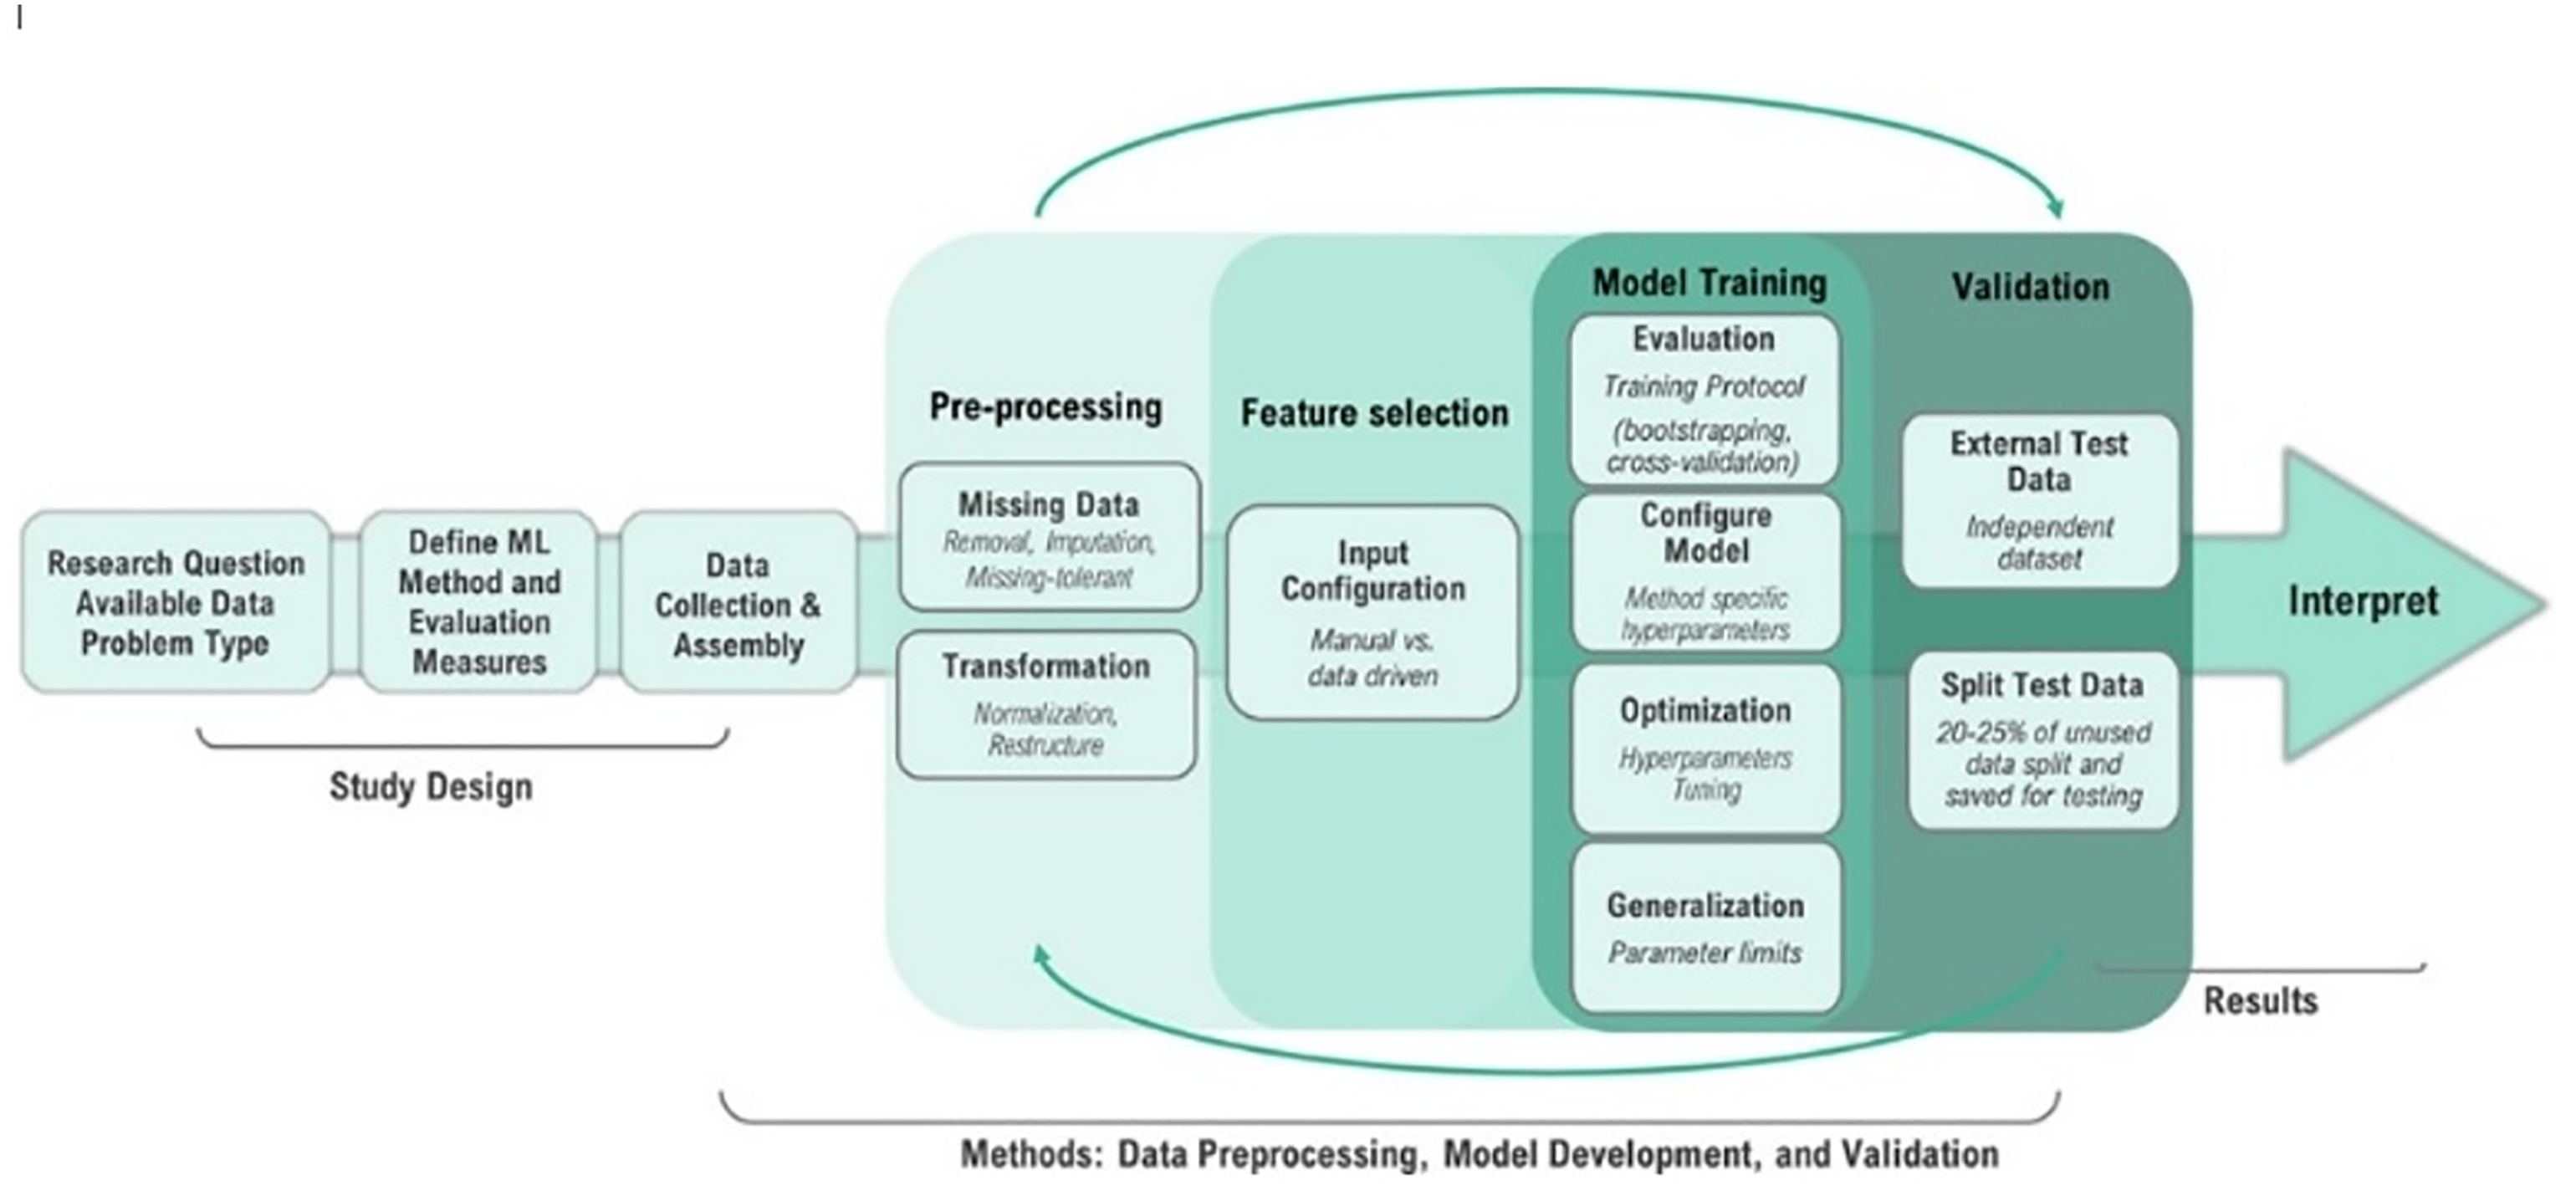
Evaluation of models
Models were evaluated on the test set using the standard classification evaluation metrics: (i) AUC, (ii) sensitivity (a.k.a recall or TP/TP+FN), (iii) precision (a.k.a PPV or TP/TP + FP), (iv) calibration error, and (v) classification error (i.e. the percentage of predictions that are incorrect) [20]. The performance of each model’s AUC, sensitivity, and precision was calculated. Interpretation of the evaluated values is as follows: <0.6 for poor, 0.6–0.69 for fair, 0.7–0.79 for good, 0.8–0.89 for very good, and >0.9 for excellent 21 . For calibration and classification error evaluation the following rubric was also used: 0–4% for excellent, 5–9% for very good, 10–14% for good, 15–20% for fair, and >20% for poor. Python (Py 3.6.7) on the Google Colaboratory™ platform was used with the following packages for analysis: “scikit-learn”, “statsmodels”, “matplotlib”, and “seaborn”.
Results
Description of the cohort
Characteristics of ED Users and their visits between 2008 and 2015 (9348 patients with a total of 15,627 ED visits).
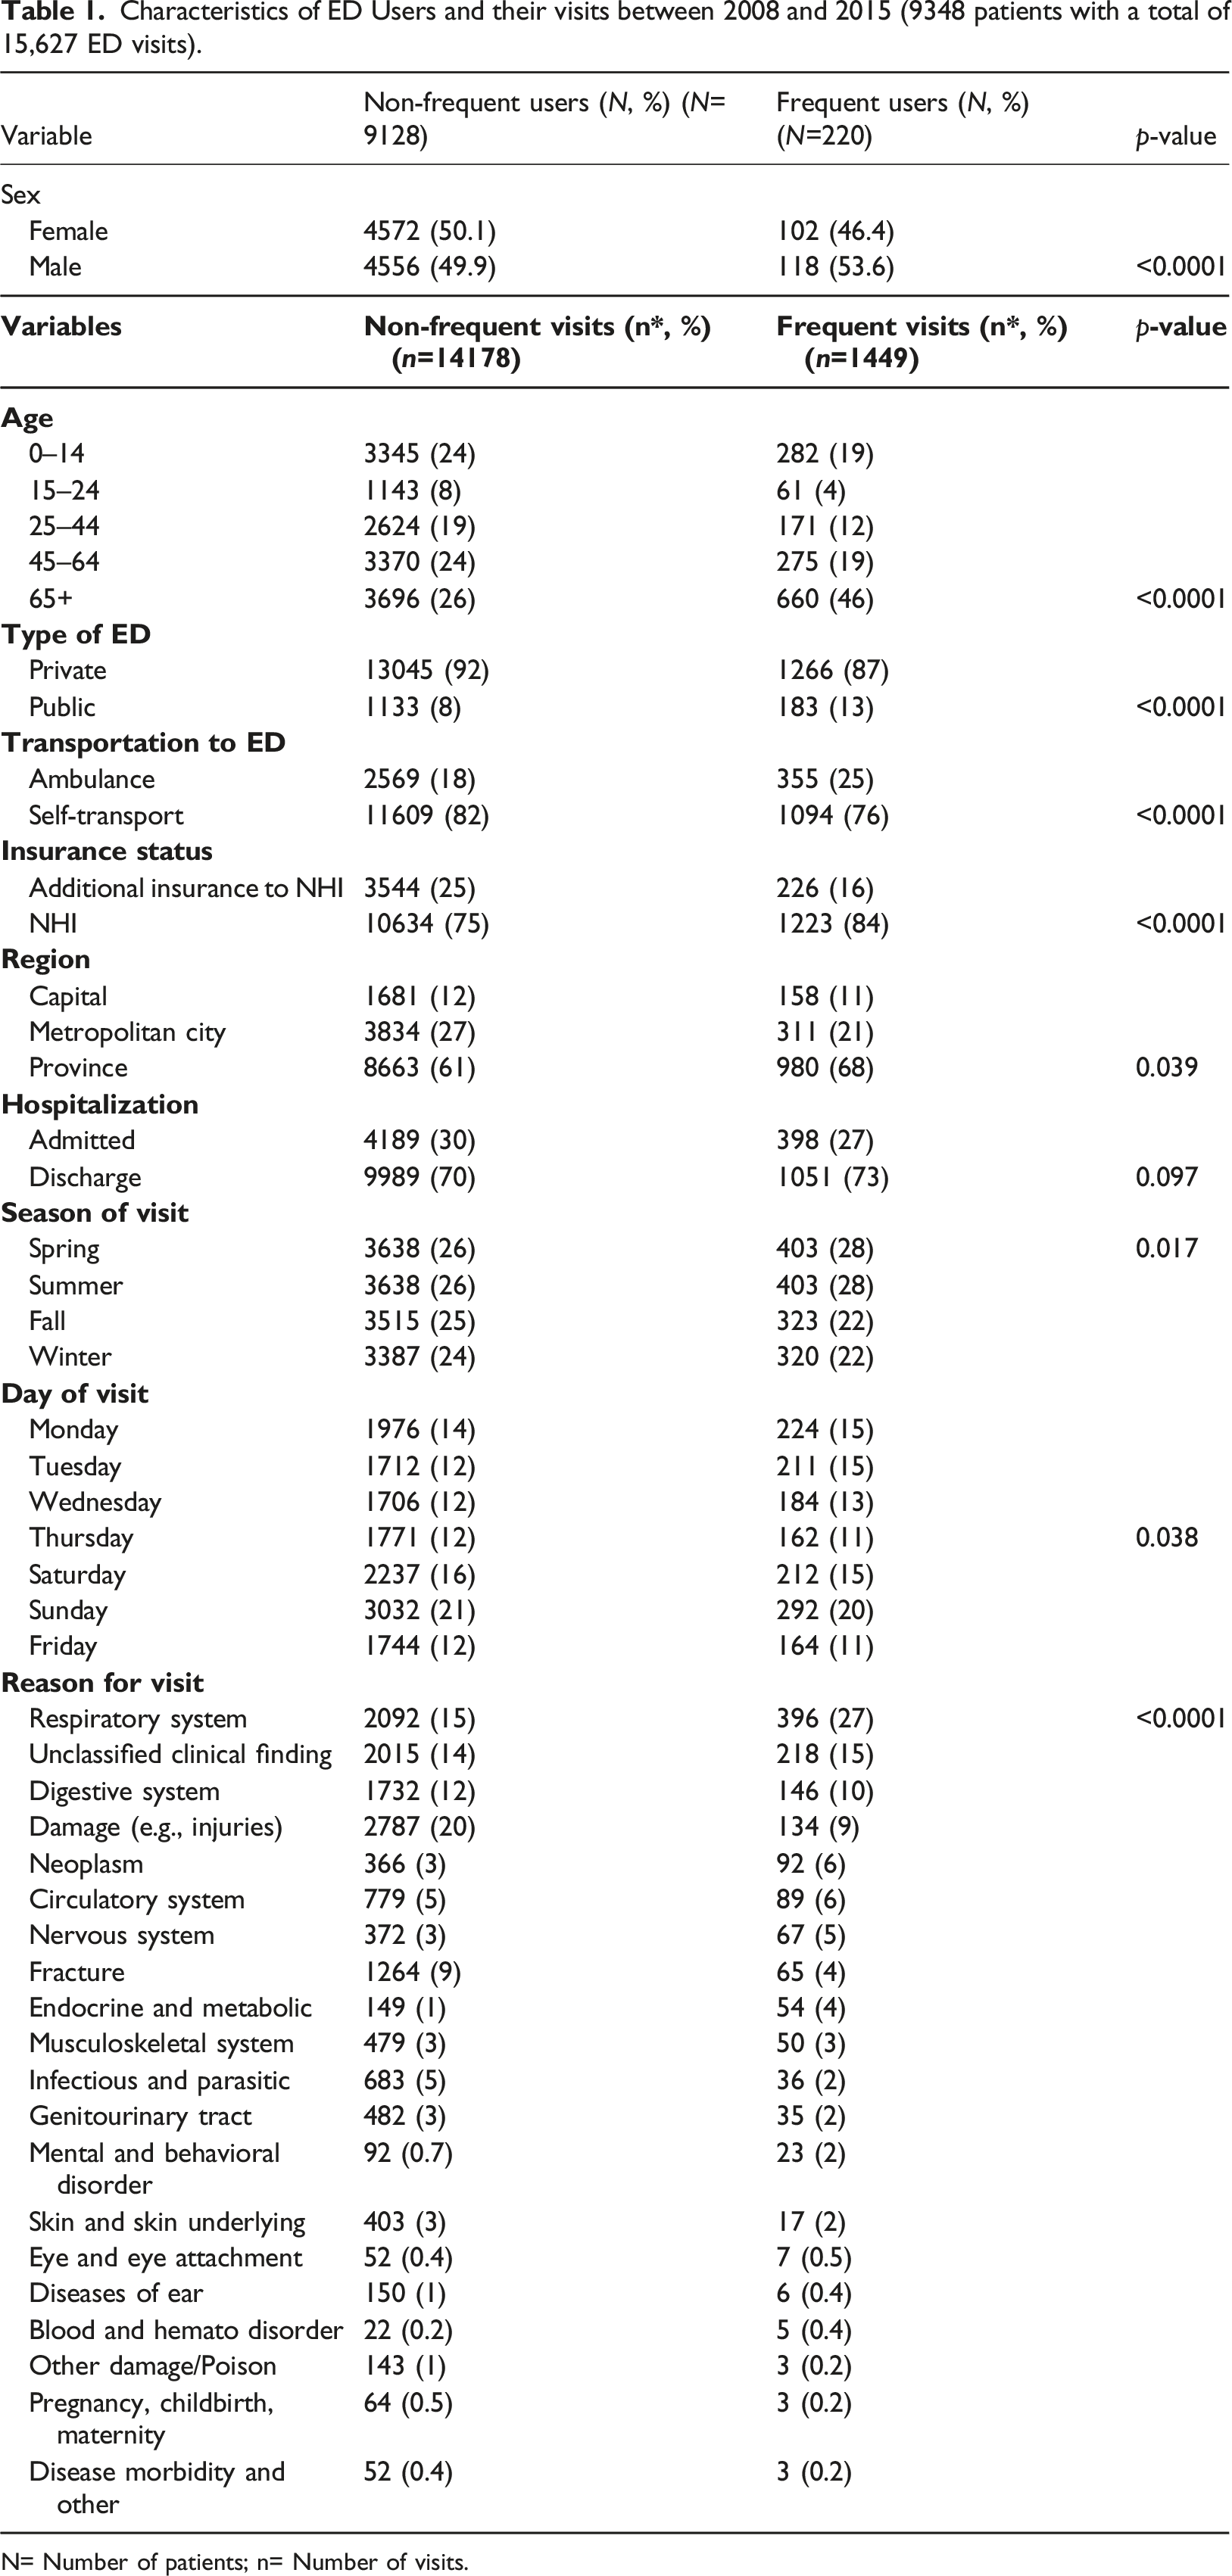
N= Number of patients; n= Number of visits.
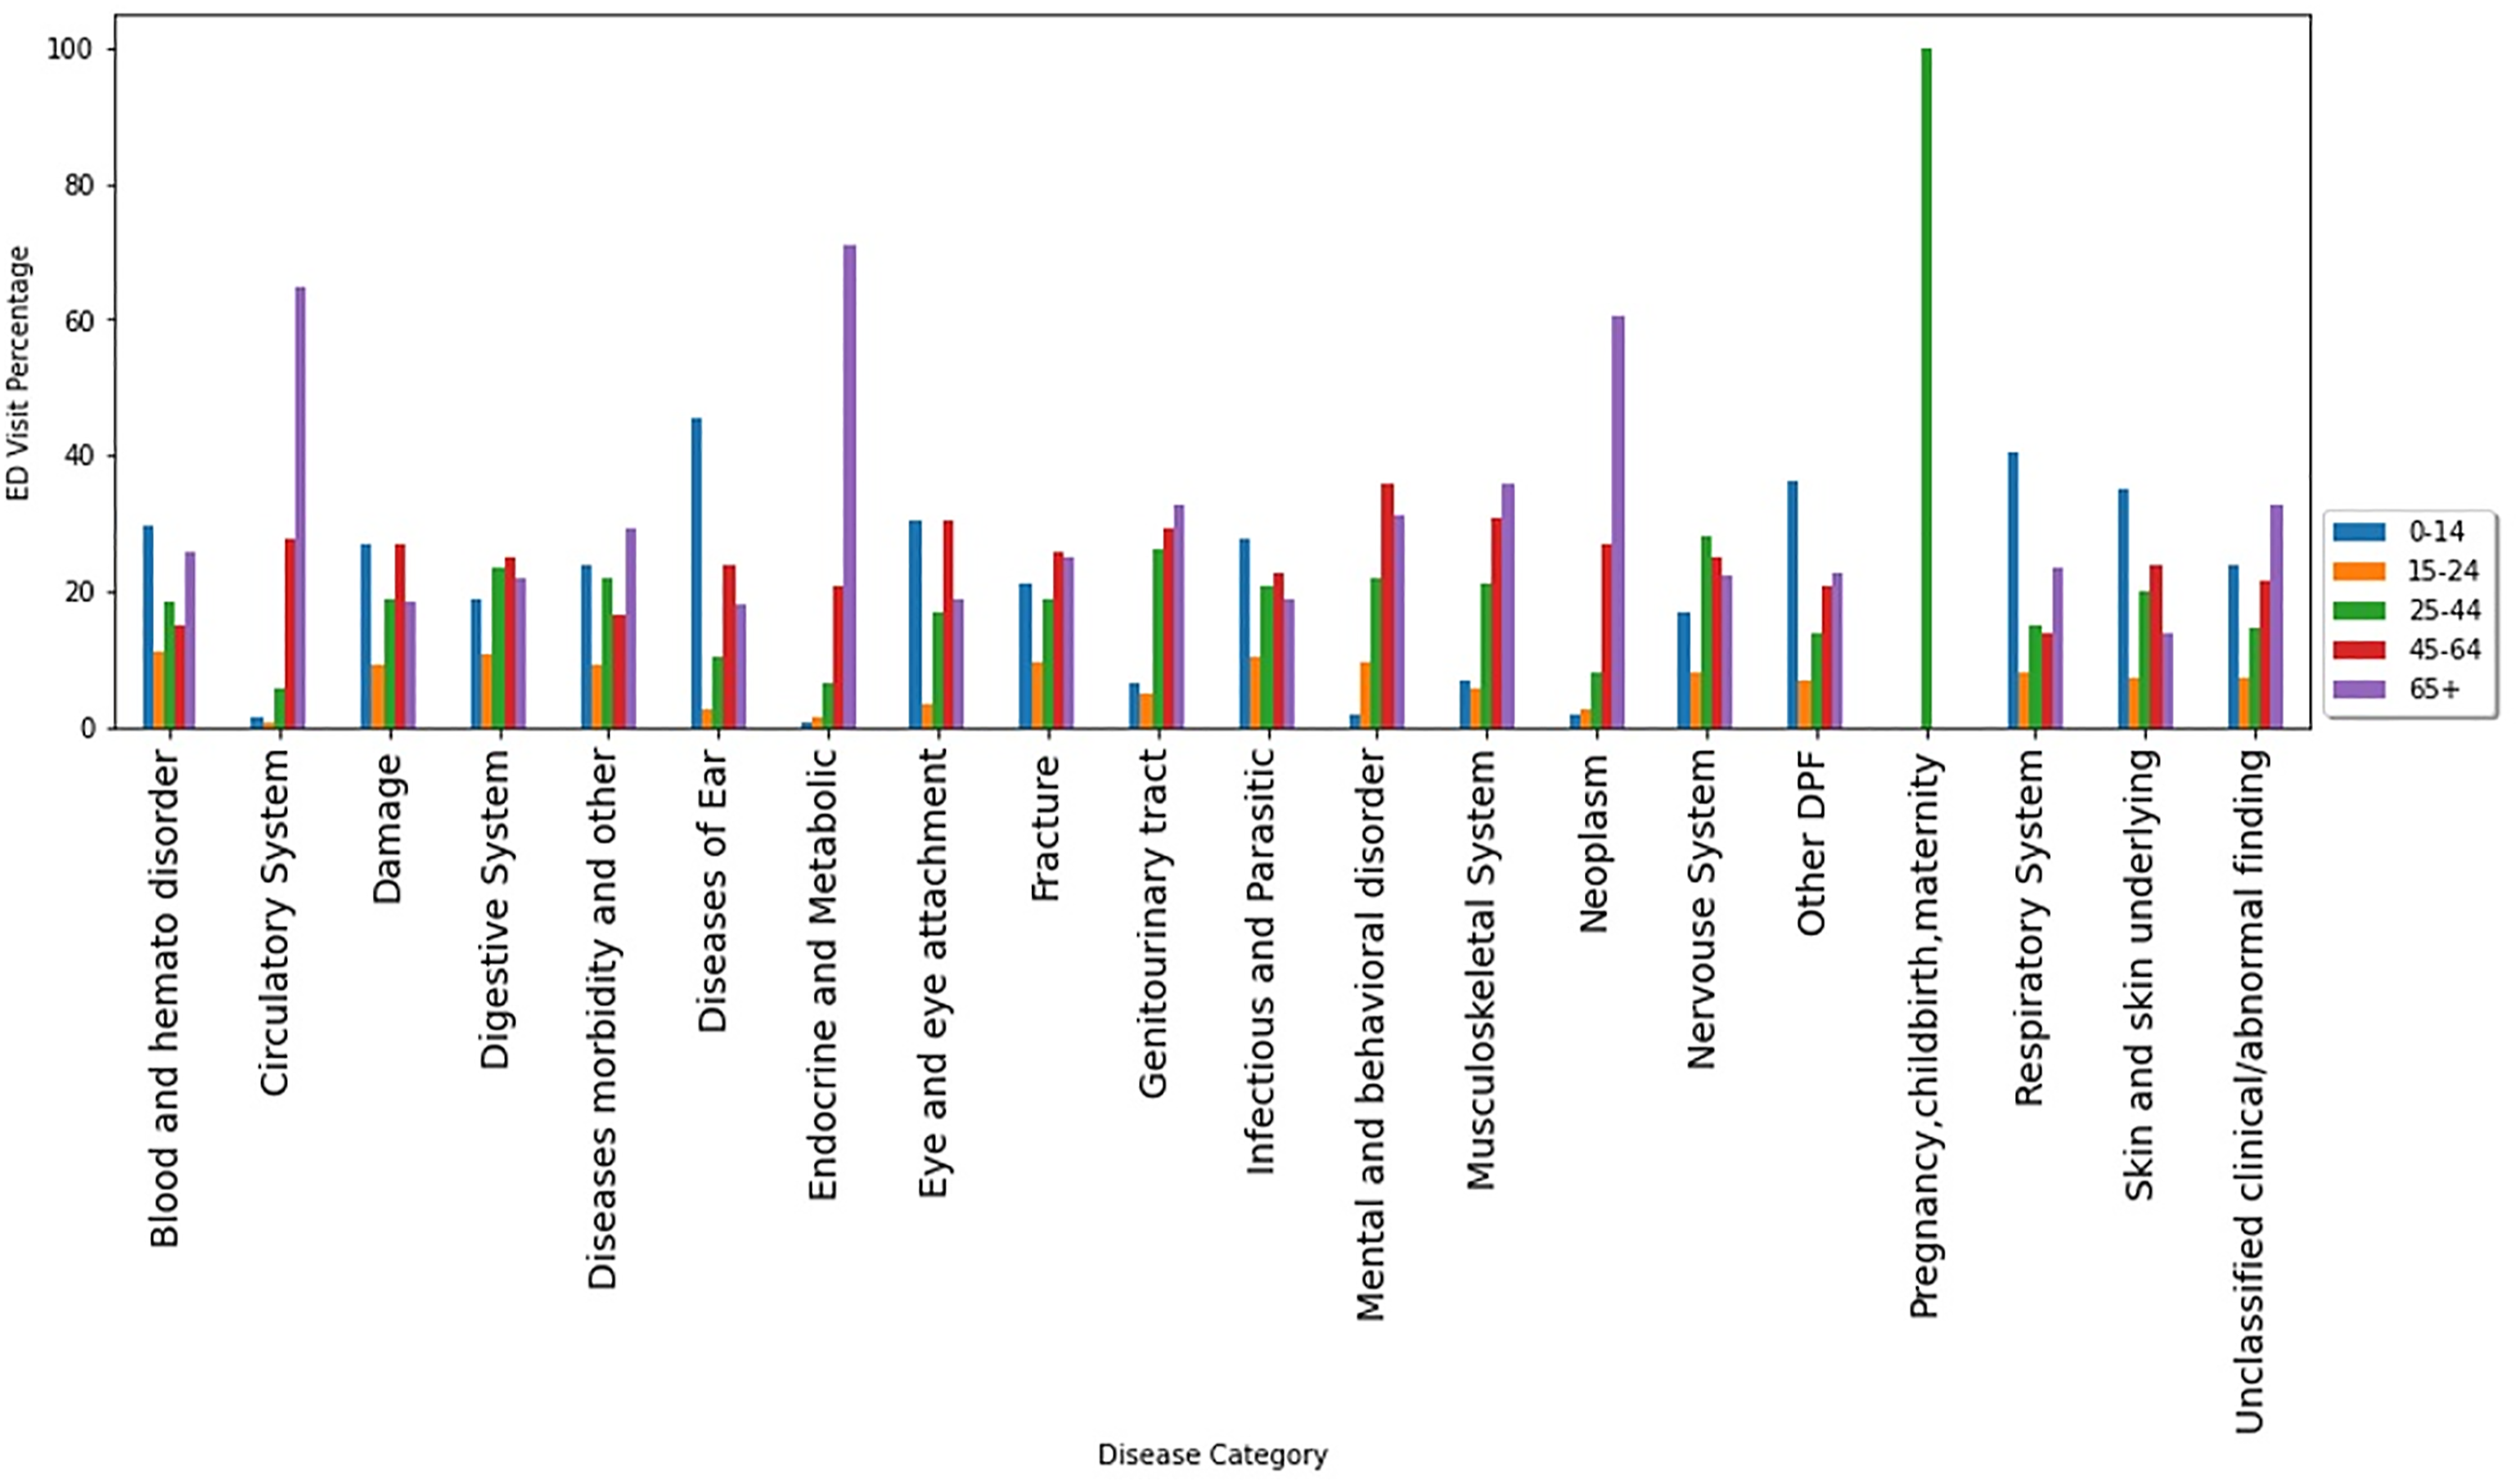
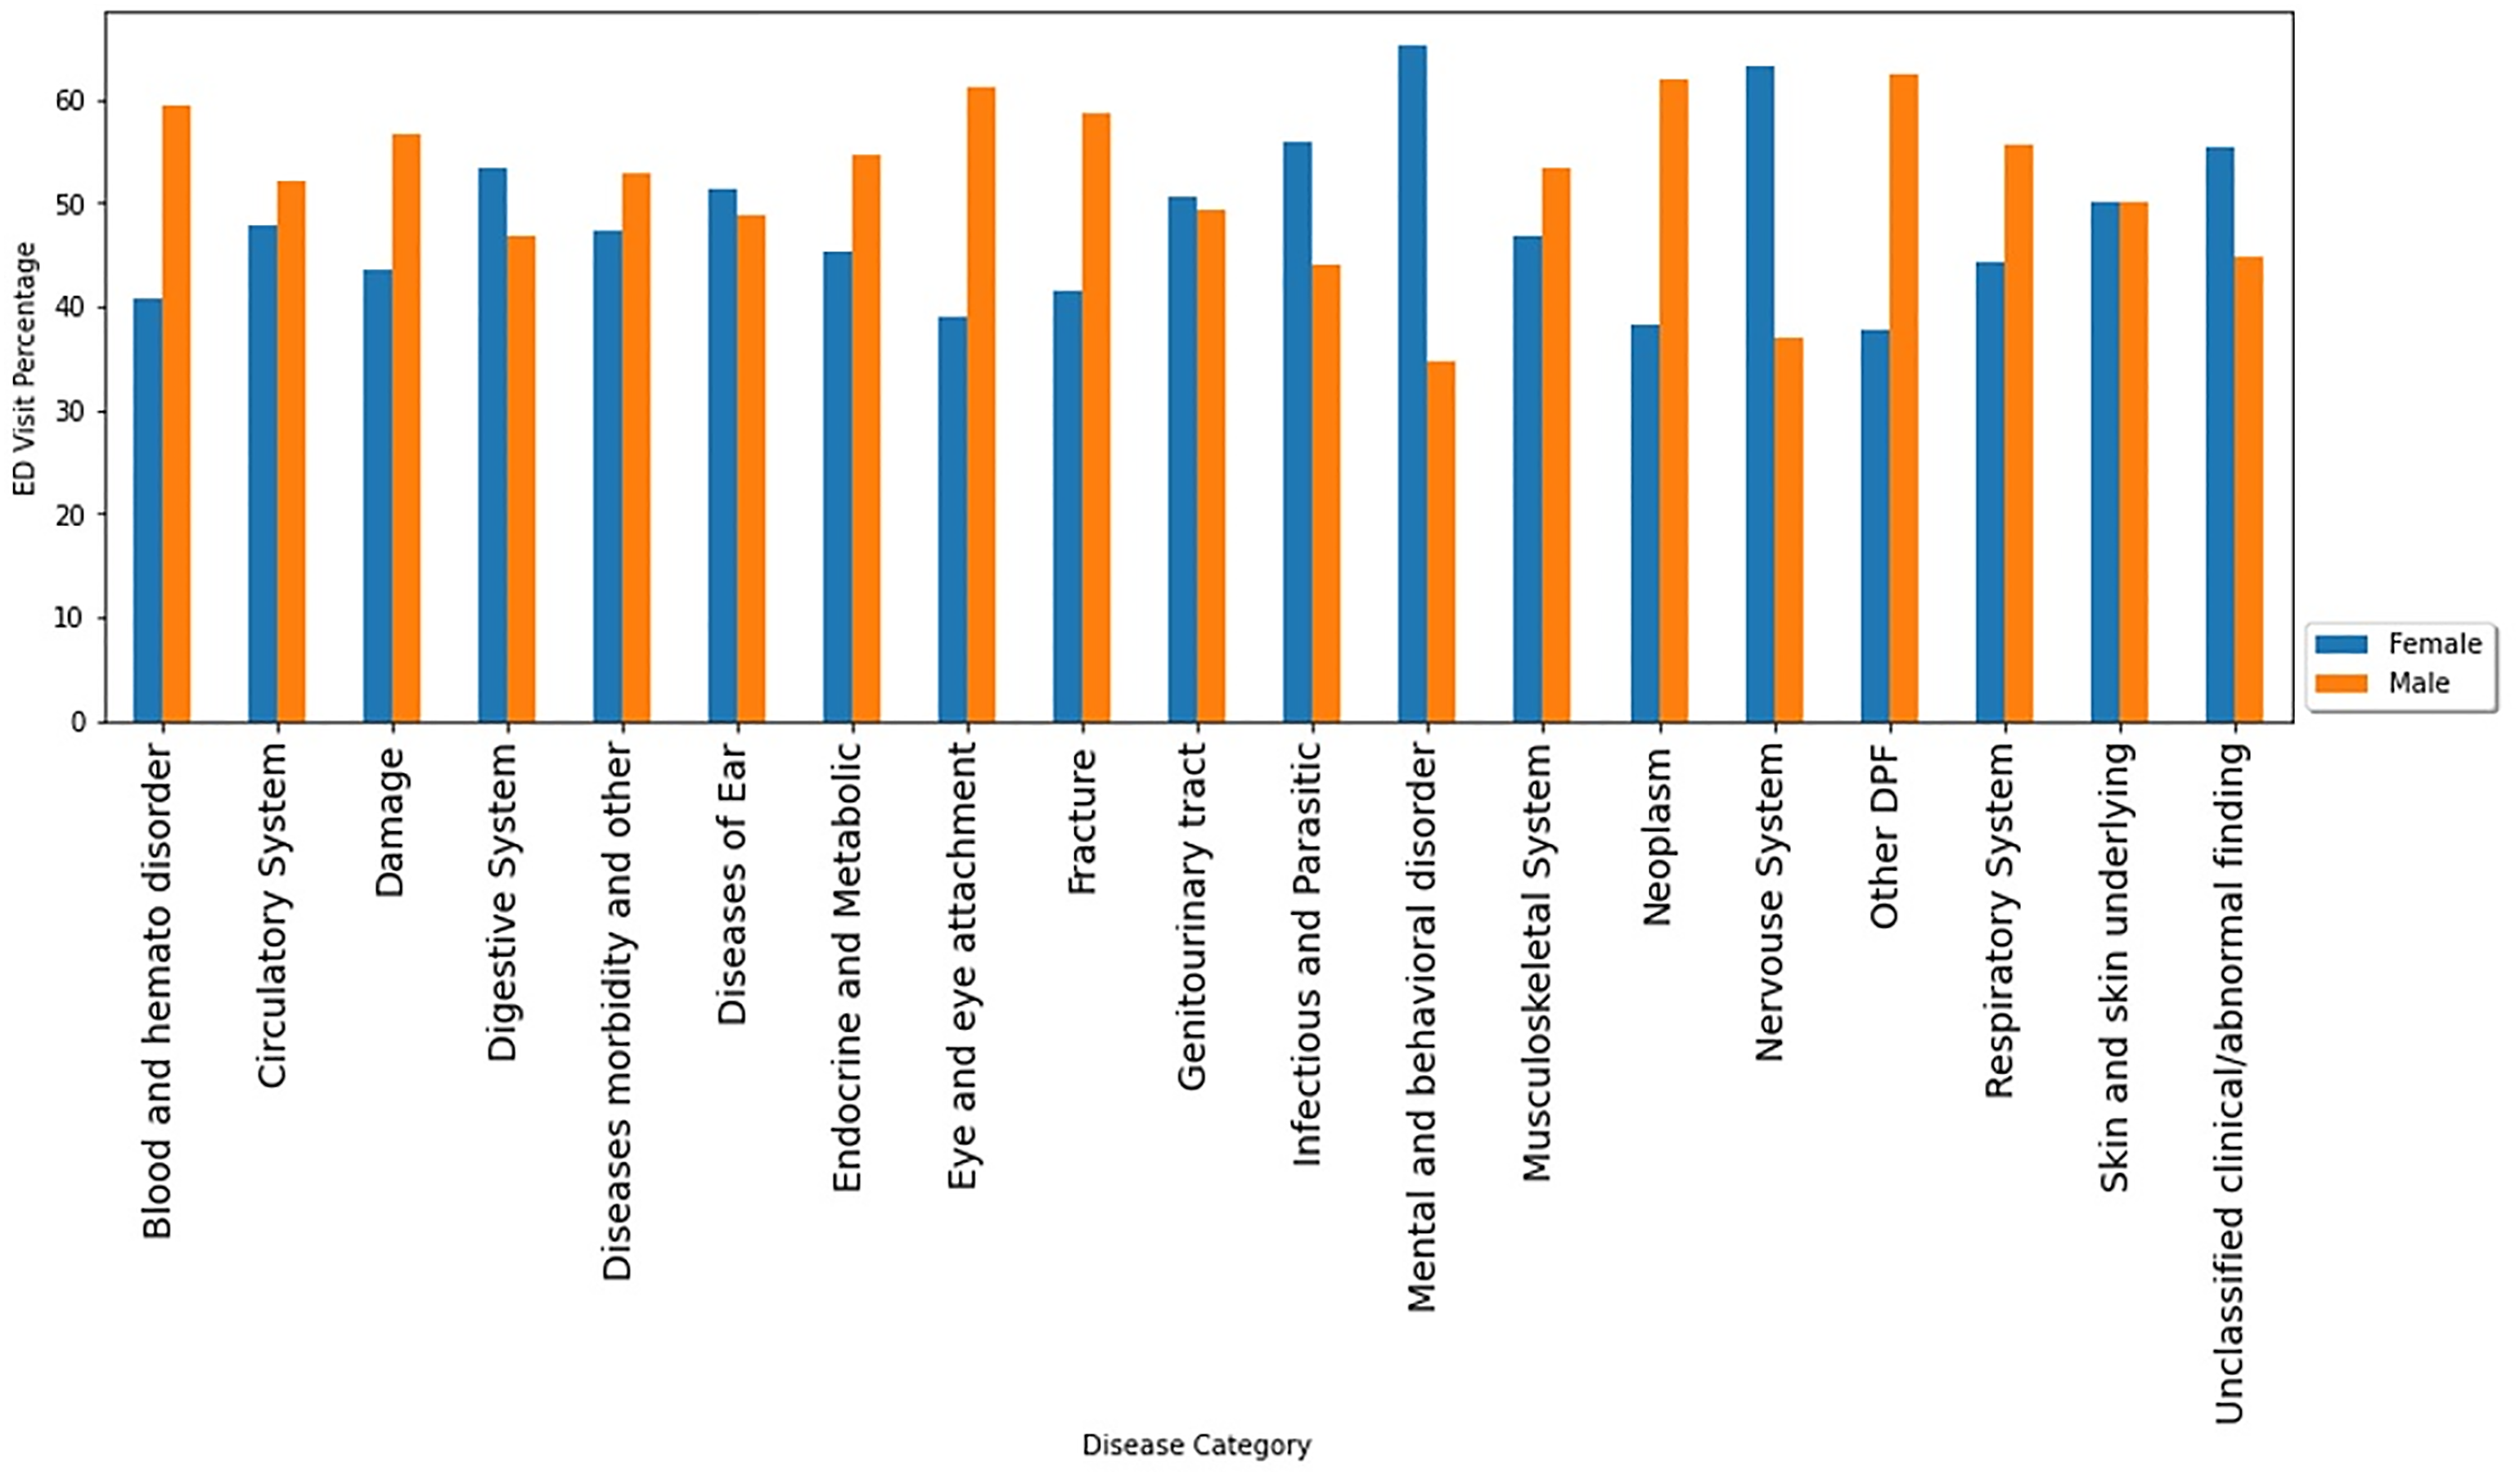
ED visits by age groups within disease categories.
Respiratory system complaints were the top reasons to visit EDs among both very young (under 14 years old) and very old (over 65 years old) patients (Figure 3). Spring and winter seasons showed the highest number of ED visits due to respiratory system diagnosis (Figure 4). Male users contributed more than females in disease categories of damage/injuries, respiratory system, fractures, and circulatory system. However, females account for more visits than males due to digestive system complaints, infectious and parasitic diseases, mental and behavior disorders, and nervous system (Figure 5). ED visits by season of the visit within disease categories. ED visits by sex within disease categories.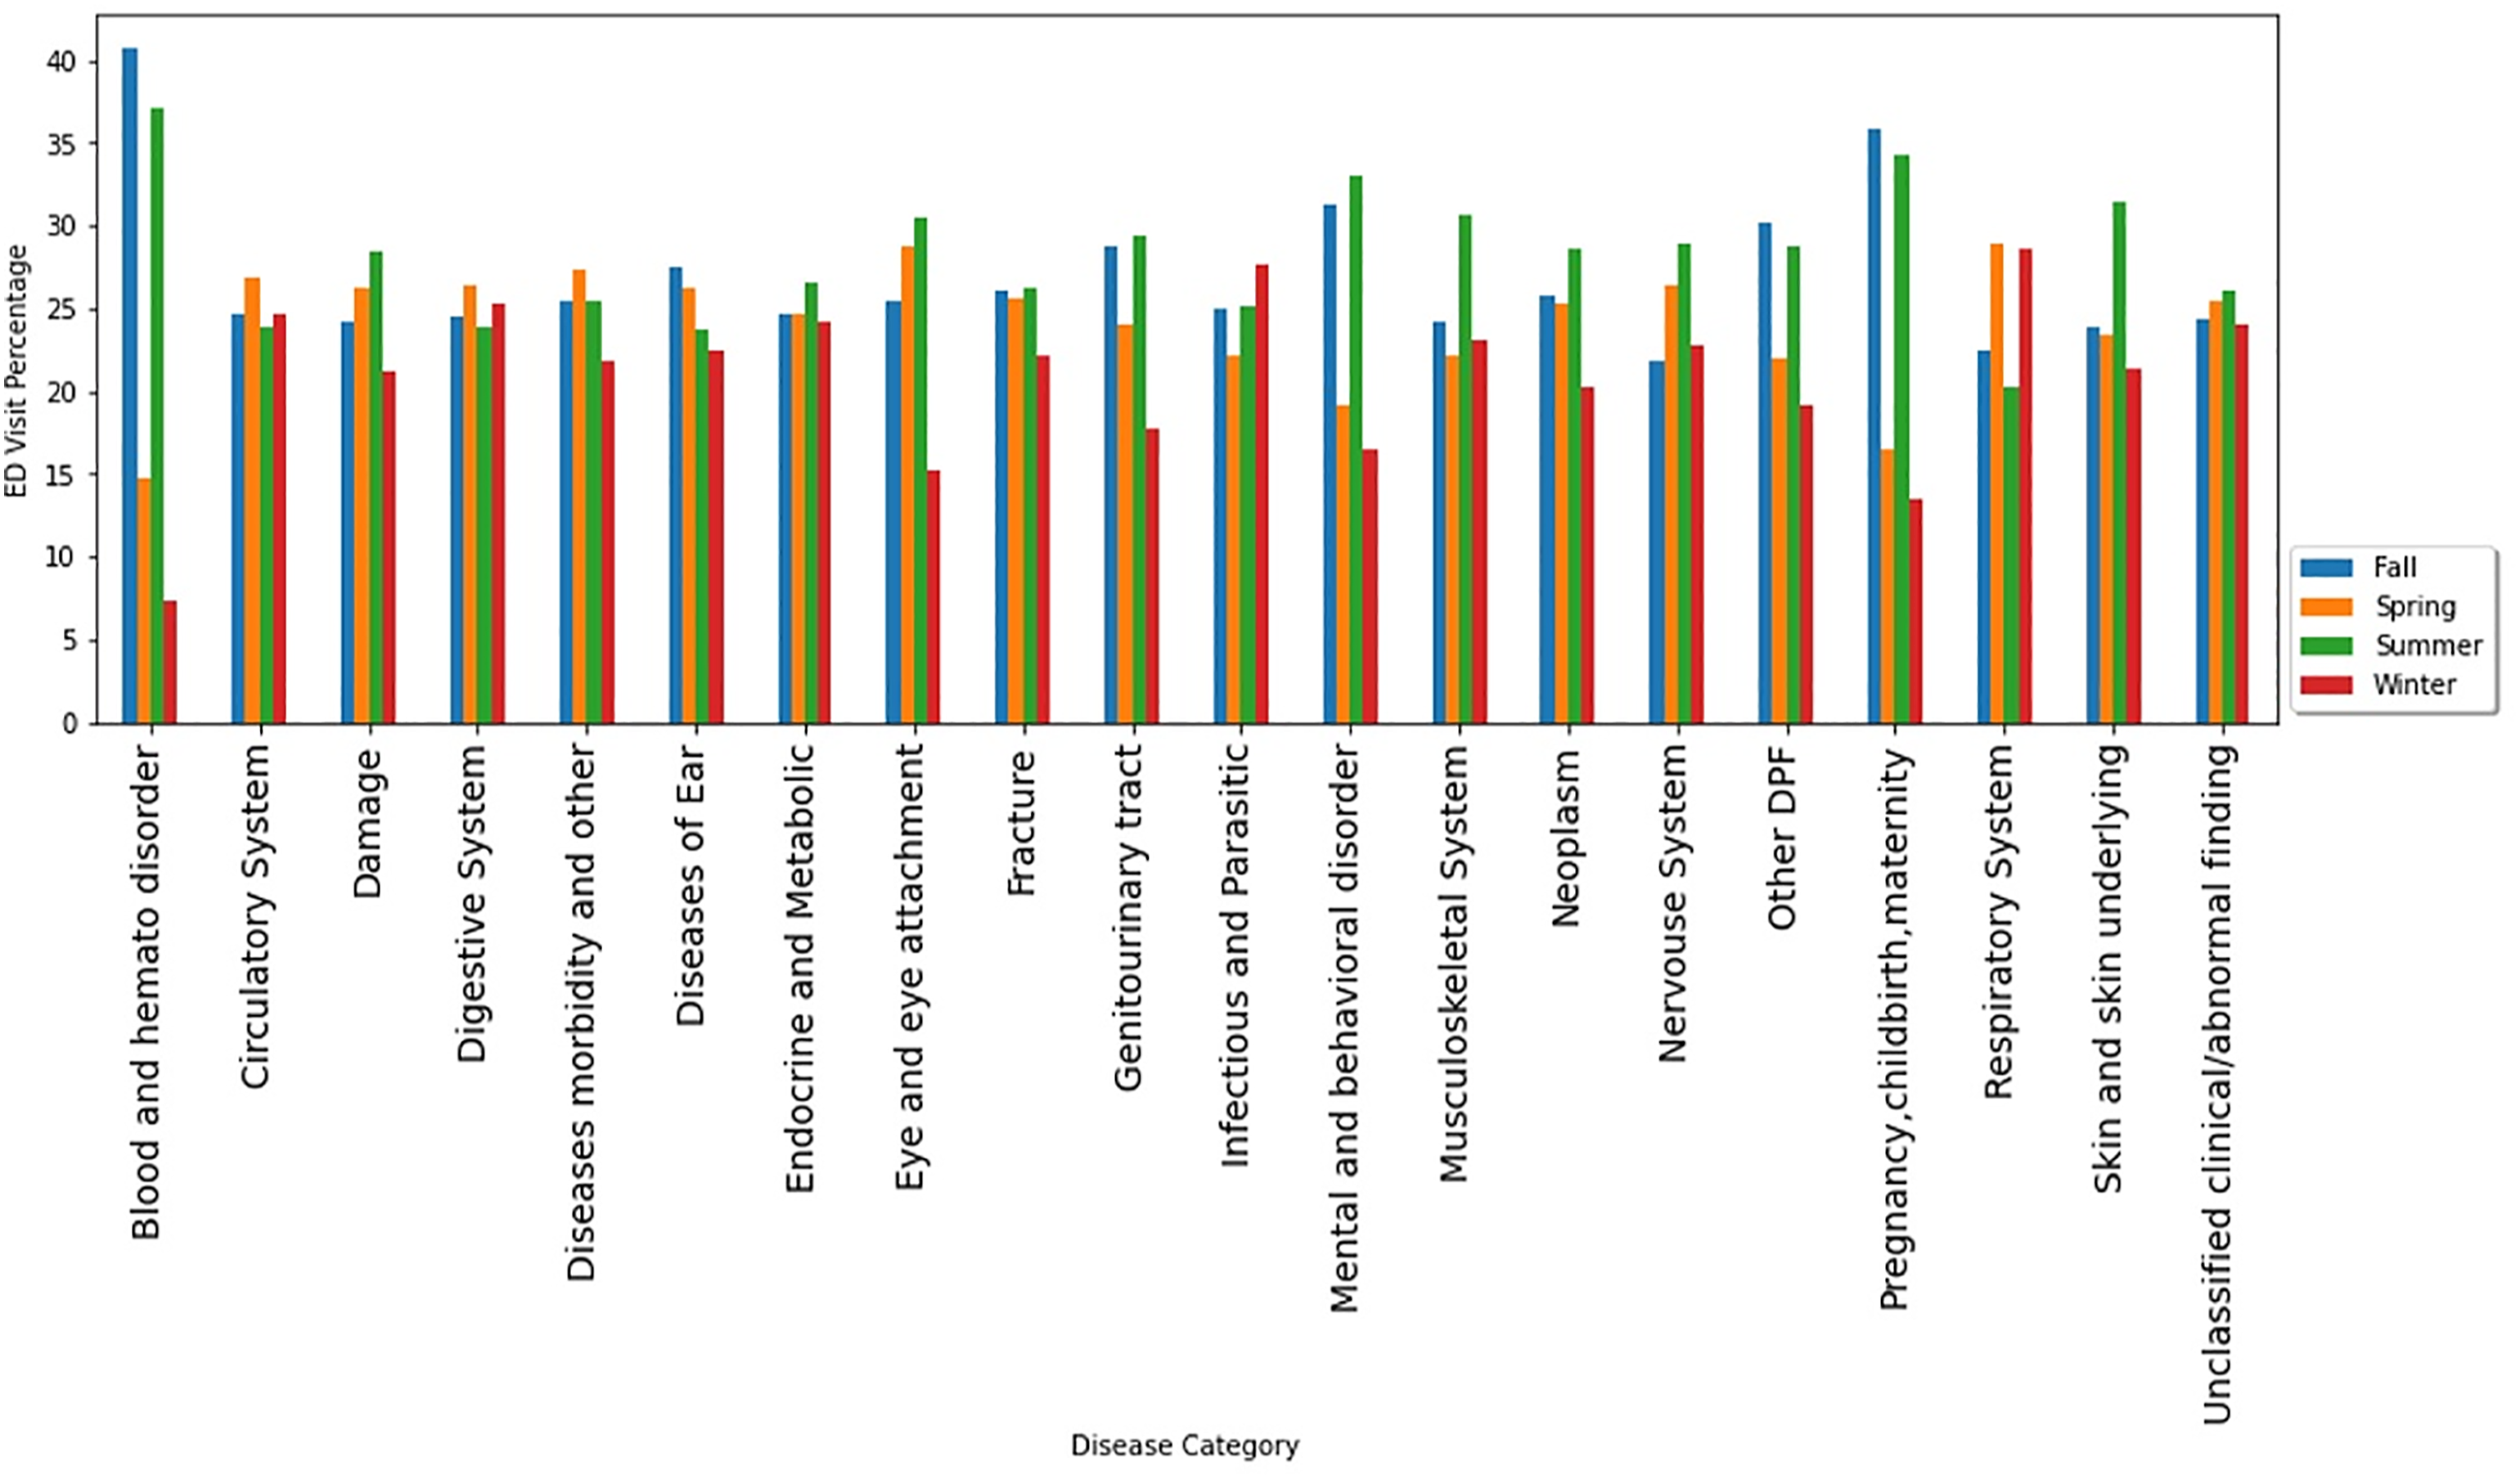
Bivariate analysis results
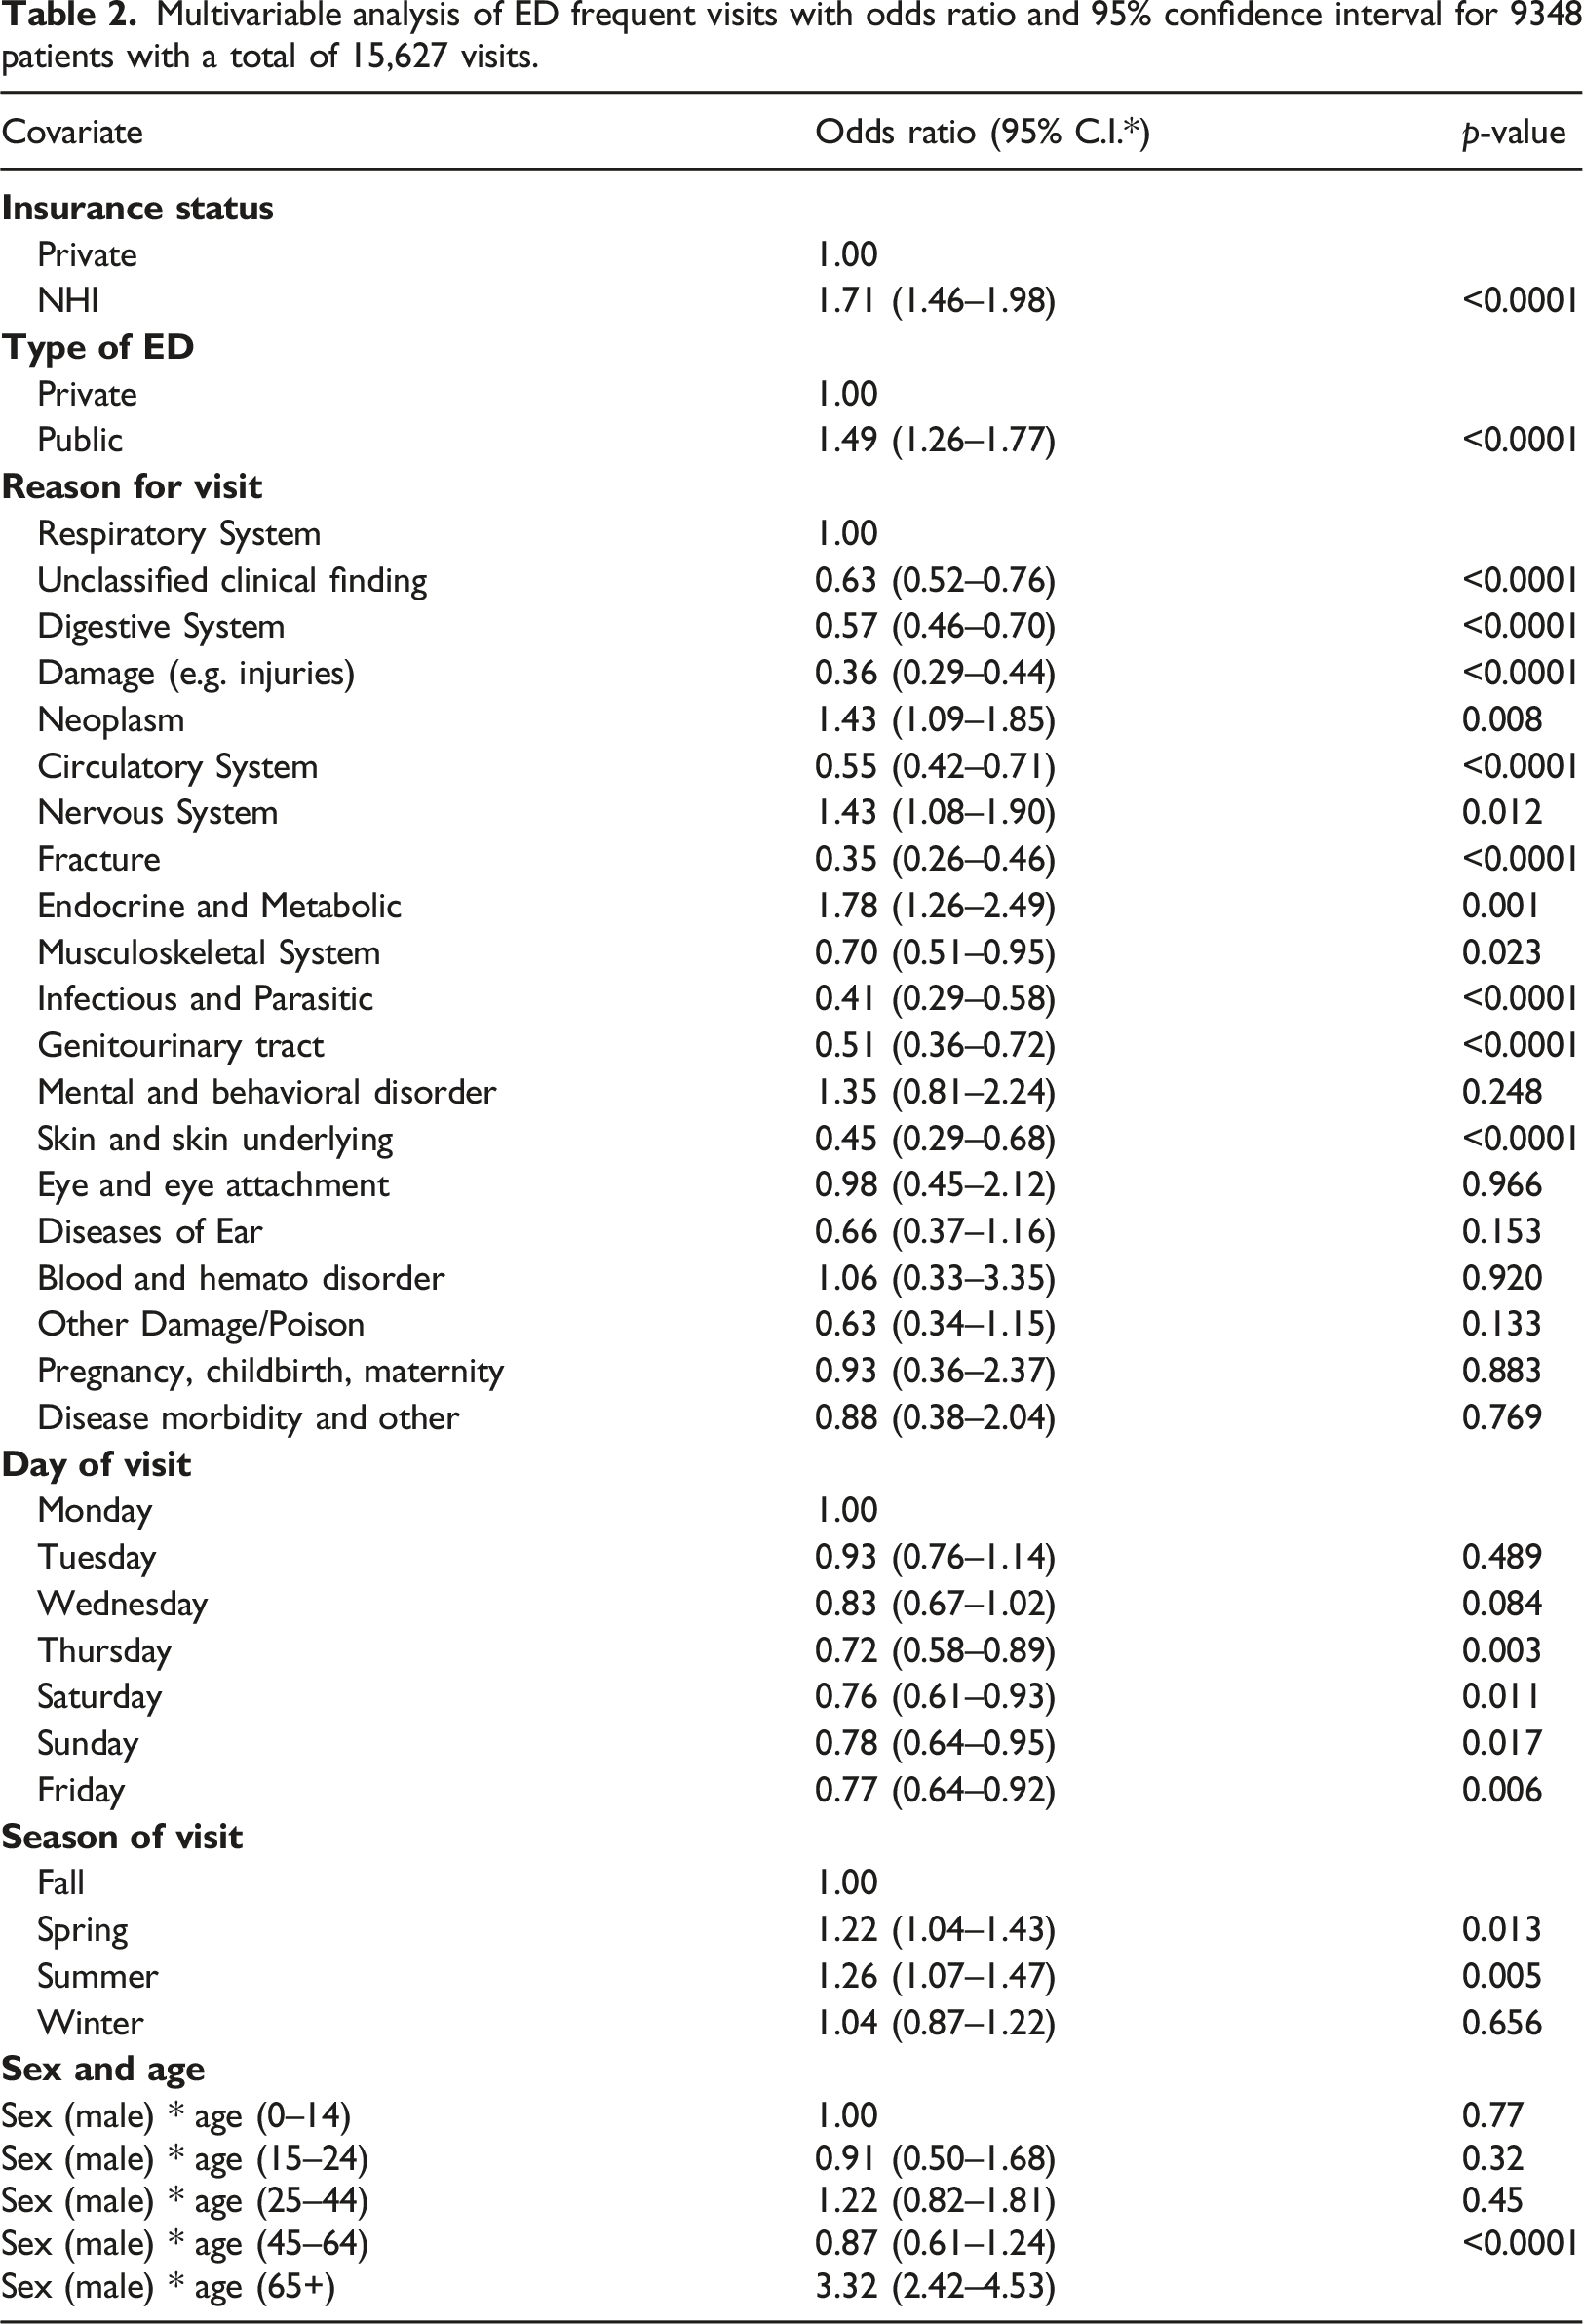
Several potential predictors were significantly associated with frequent ED visits. Males were more likely to be frequent ED users than females [OR=1.5; 95% CI: 1.34–1.67; p-value <0.0001]. Patients living in the provinces were more likely to be frequent ED users than those living in the capital city [OR = 1.2; 95% CI: 1.01–1.44; p-value = 0.039]. Those who do not have any additional private insurance were more likely to be frequent ED users than individuals with additional private insurance [OR = 1.8; 95% CI: 1.56–2.09; p-value <0.0001]. Other factors associated with frequent ED visits were age, the mode of transport, day of the visit, the season of visit, and medical reasons (Supplemental Table).
Multivariate models
Multivariable analysis of ED frequent visits with odds ratio and 95% confidence interval for 9348 patients with a total of 15,627 visits.
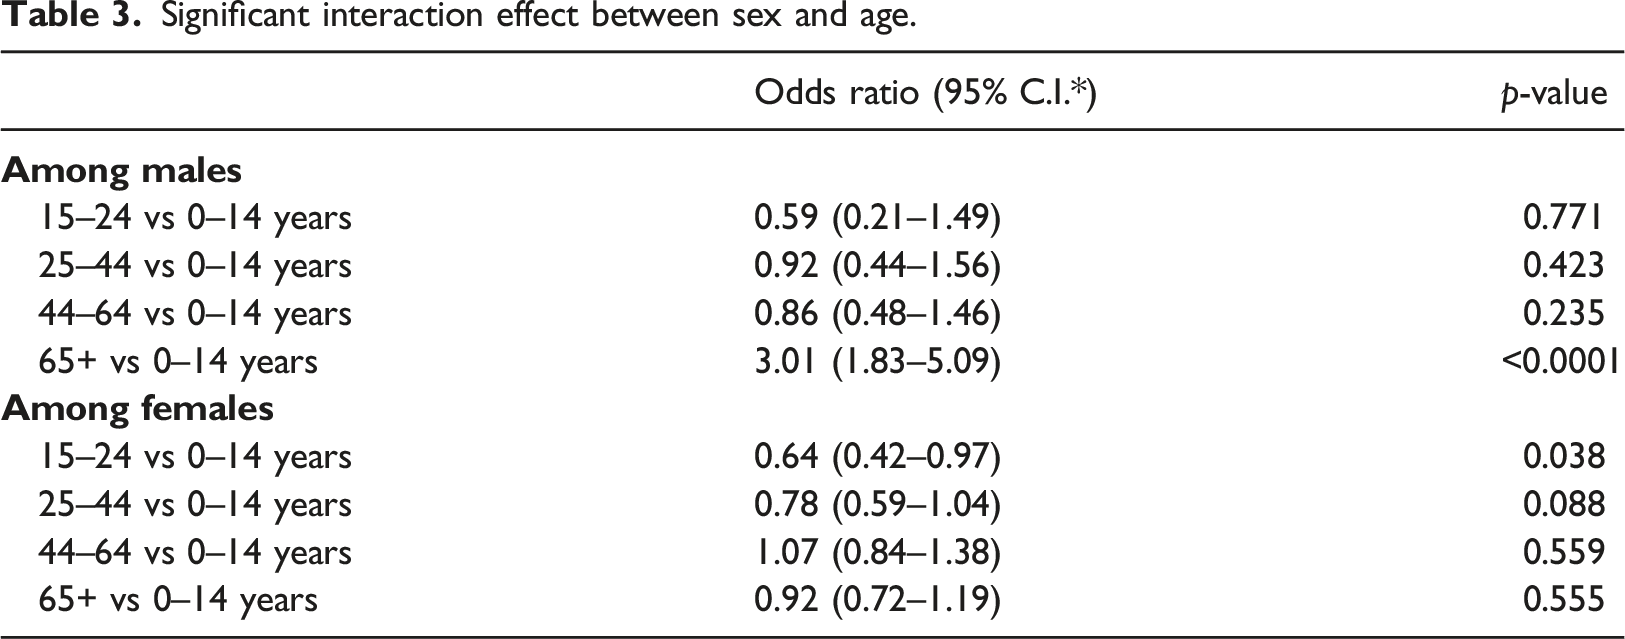
Significant interaction effect between sex and age.
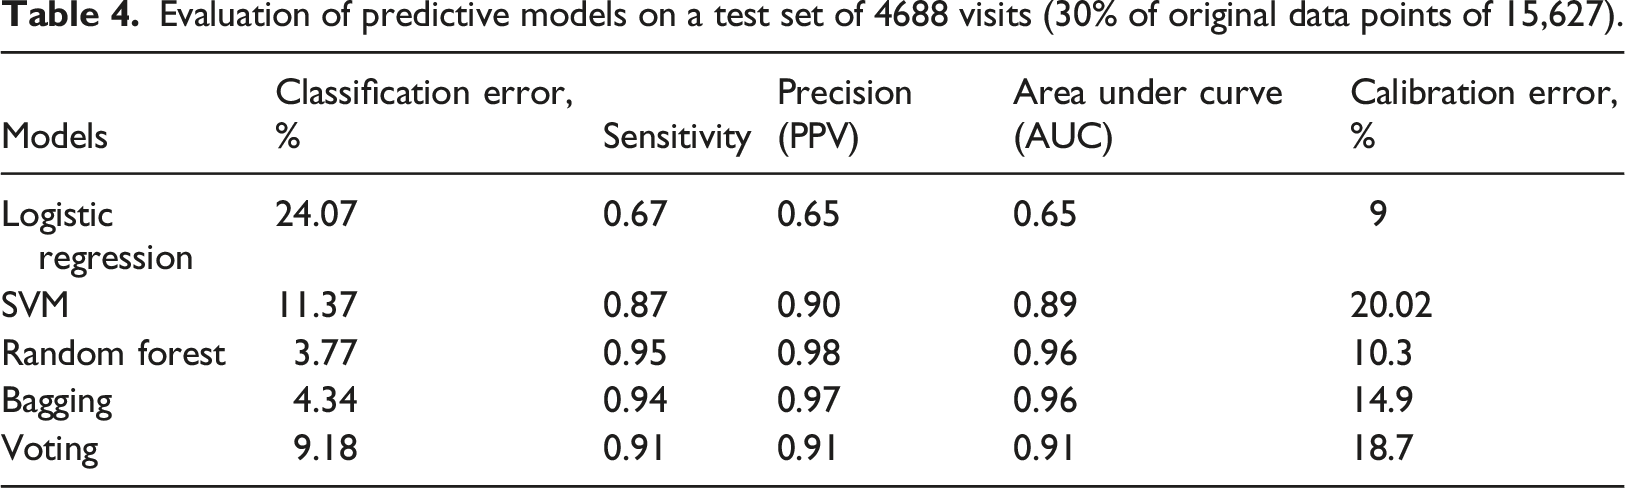
All the classification algorithms predicting frequent ED users showed satisfactory discriminating power from a very good AUC of 0.89 (SVM) to an excellent AUC of 0.96 (Random Forest) (Figure 6). Random Forest performed the best among the machine learning algorithms, with an AUC indicating excellent predictability (0.96), and excellent classification error (3.8%). Calibration was fair for SVM, Bagging and Voting (15–20%), while logistic regression and random forest had good calibration (9 and 10%, respectively). (Table 4). Prediction ability of the logistic regression and machine learning models for frequent ED visits receiver-operating characteristics (ROC) curves; the corresponding values of the area under the curve (AUC) for each model are presented. Evaluation of predictive models on a test set of 4688 visits (30% of original data points of 15,627).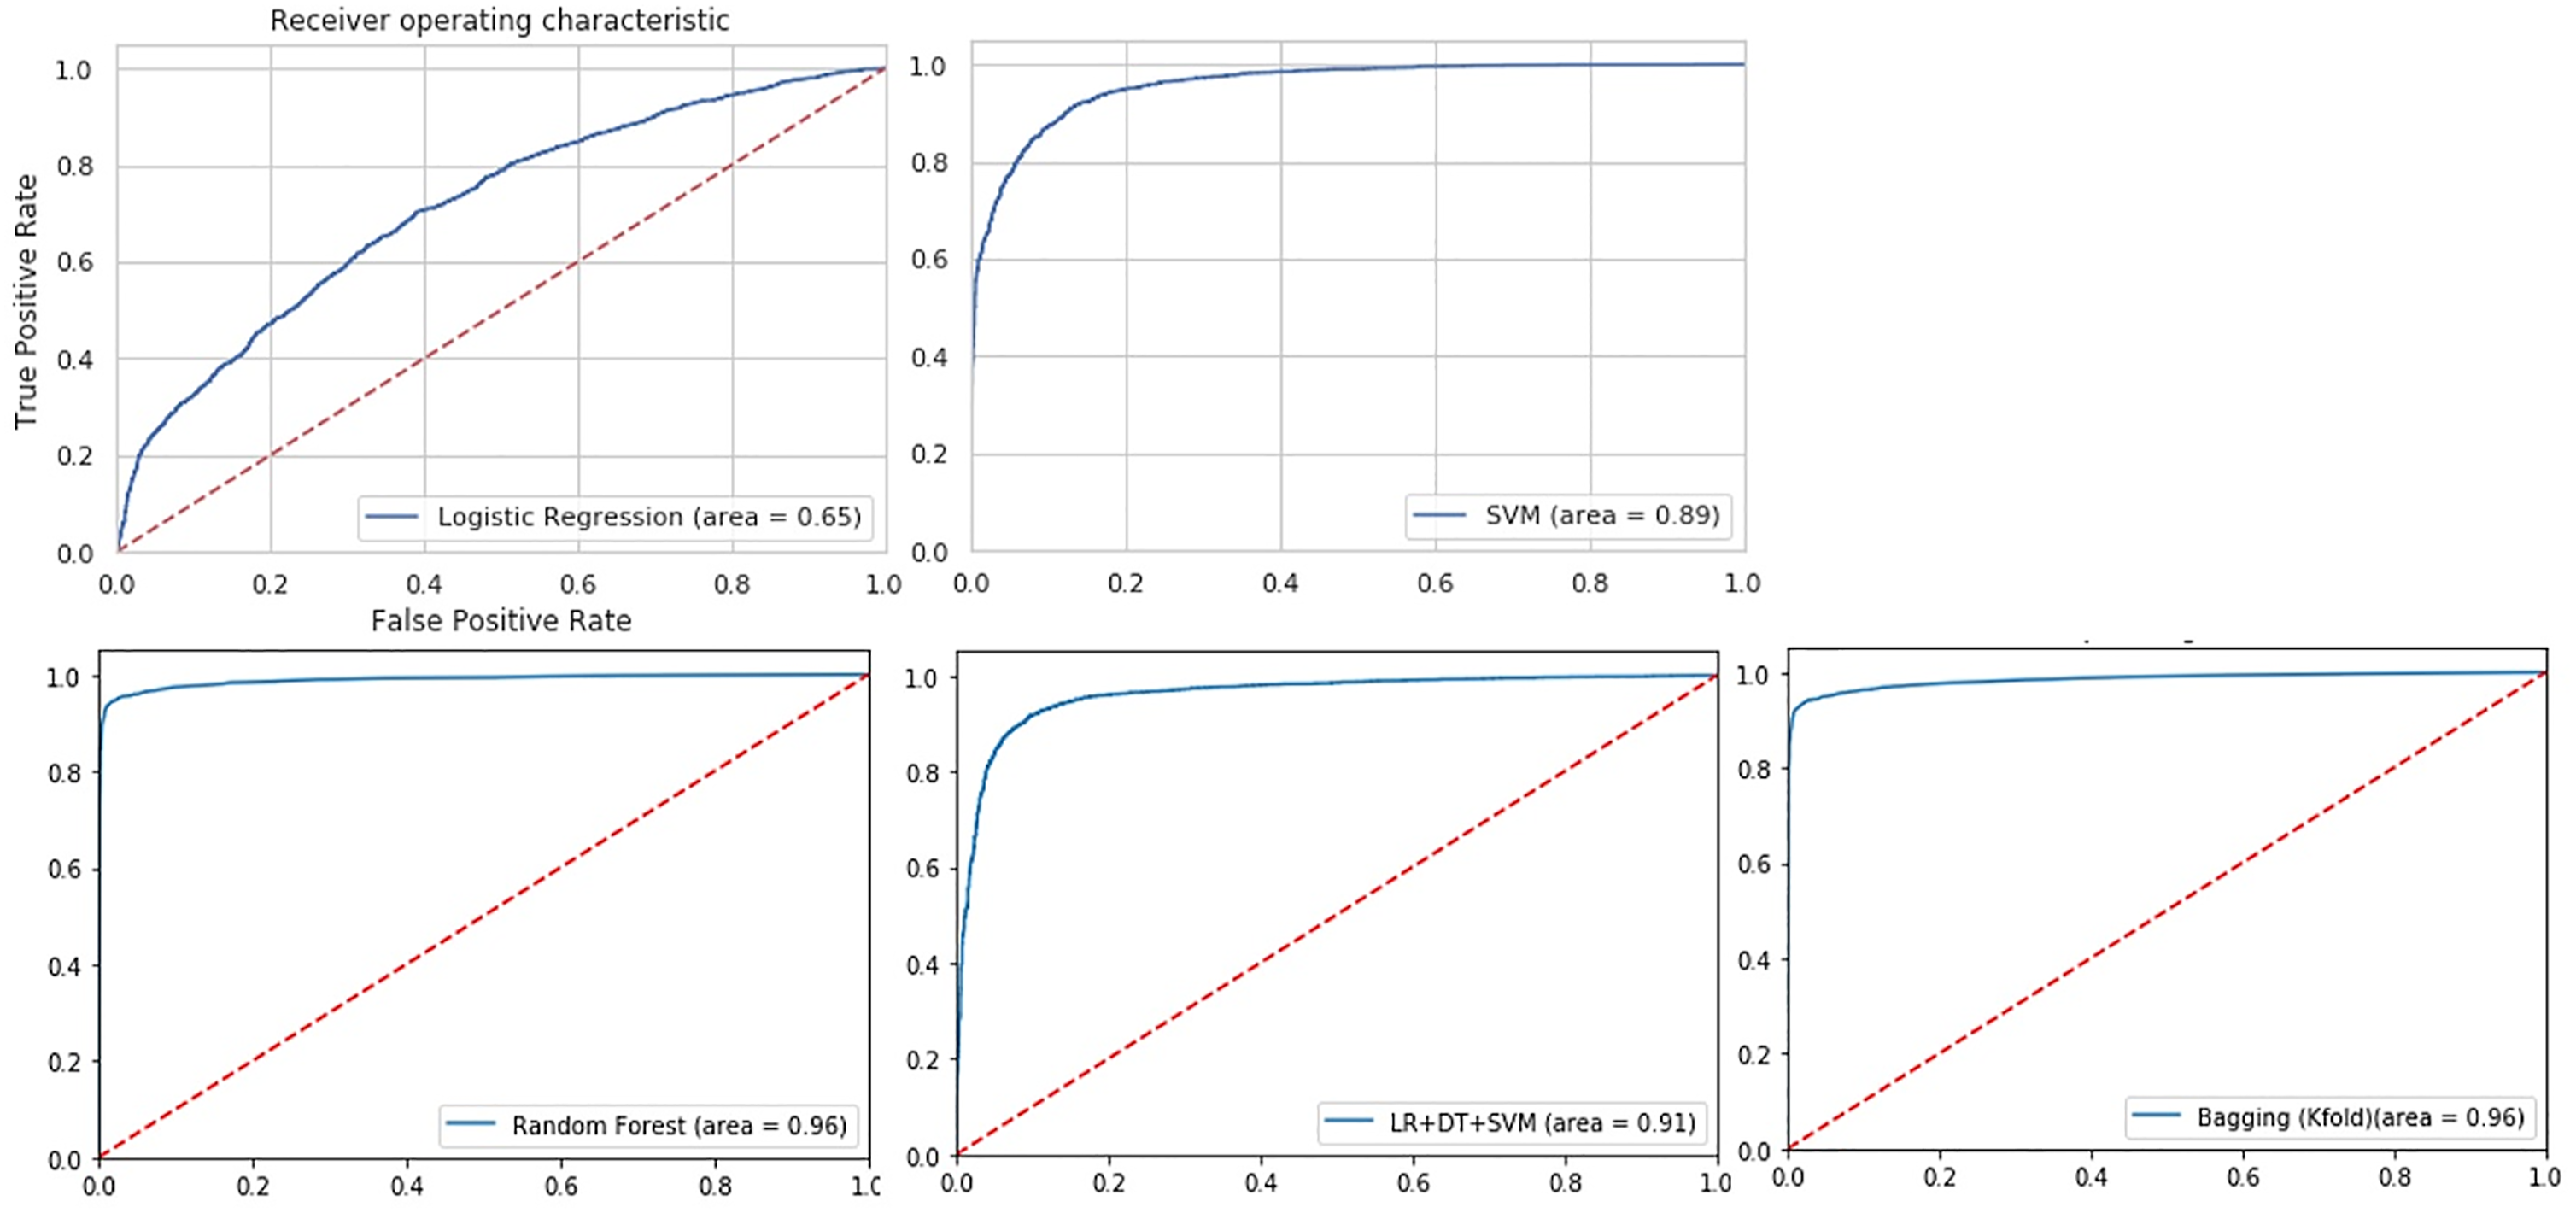
The best logistic regression model with RFE for training included age, sex, insurance status, season, day, residential region, type of ED and reason for the visit (Figure 7). Using AUC, this model underperformed the classification machine learning algorithms for our data (AUC = 0.65 vs. AUC = 0.89–0.96; classification error = 24.07% vs. classification error = 3.8%–11.8%). However, compared to the other models, logistic regression showed a better calibration (9%). Variables selected by recursive feature elimination (RFE) process for logistic regression model training.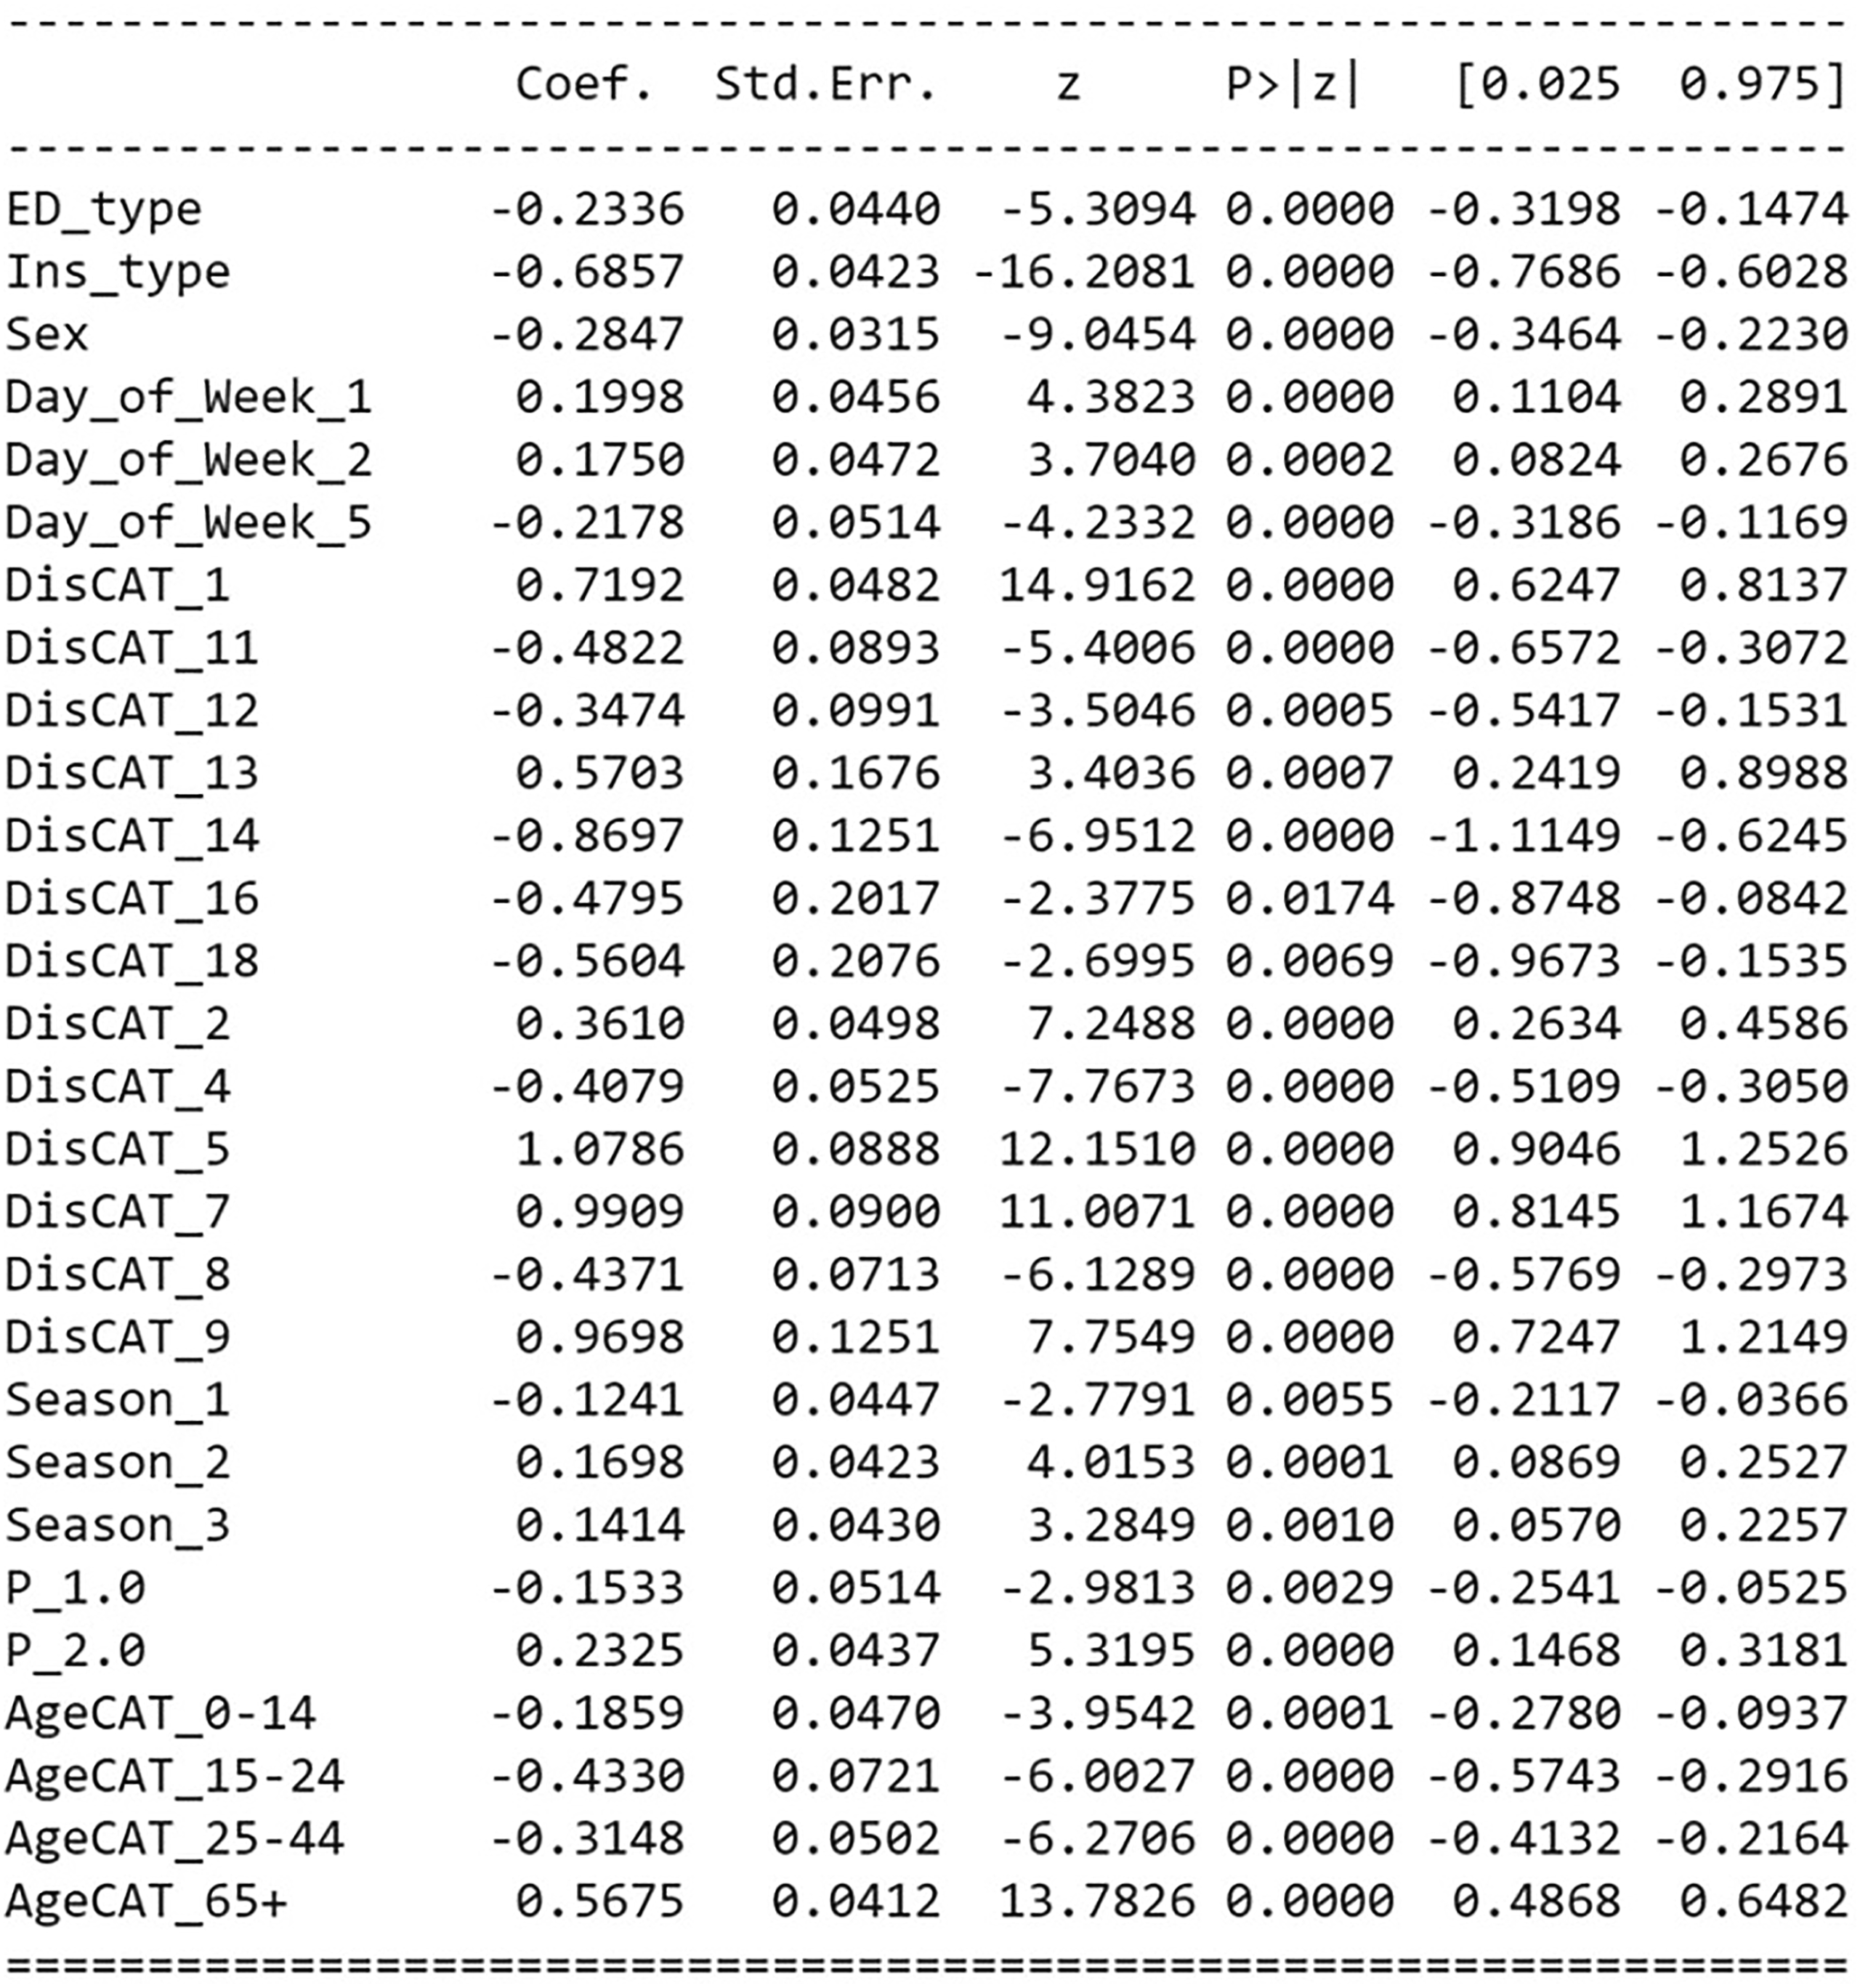
Random Forest with the smallest classification error and highest precision and sensitivity was chosen for further analysis. Figure 8 shows the most important features contributing to frequent ED user prediction, according to the Random Forest feature importance score. The top five important features were disease category, age, day of the week, season, and sex (Figure 8). Random forest feature importance score.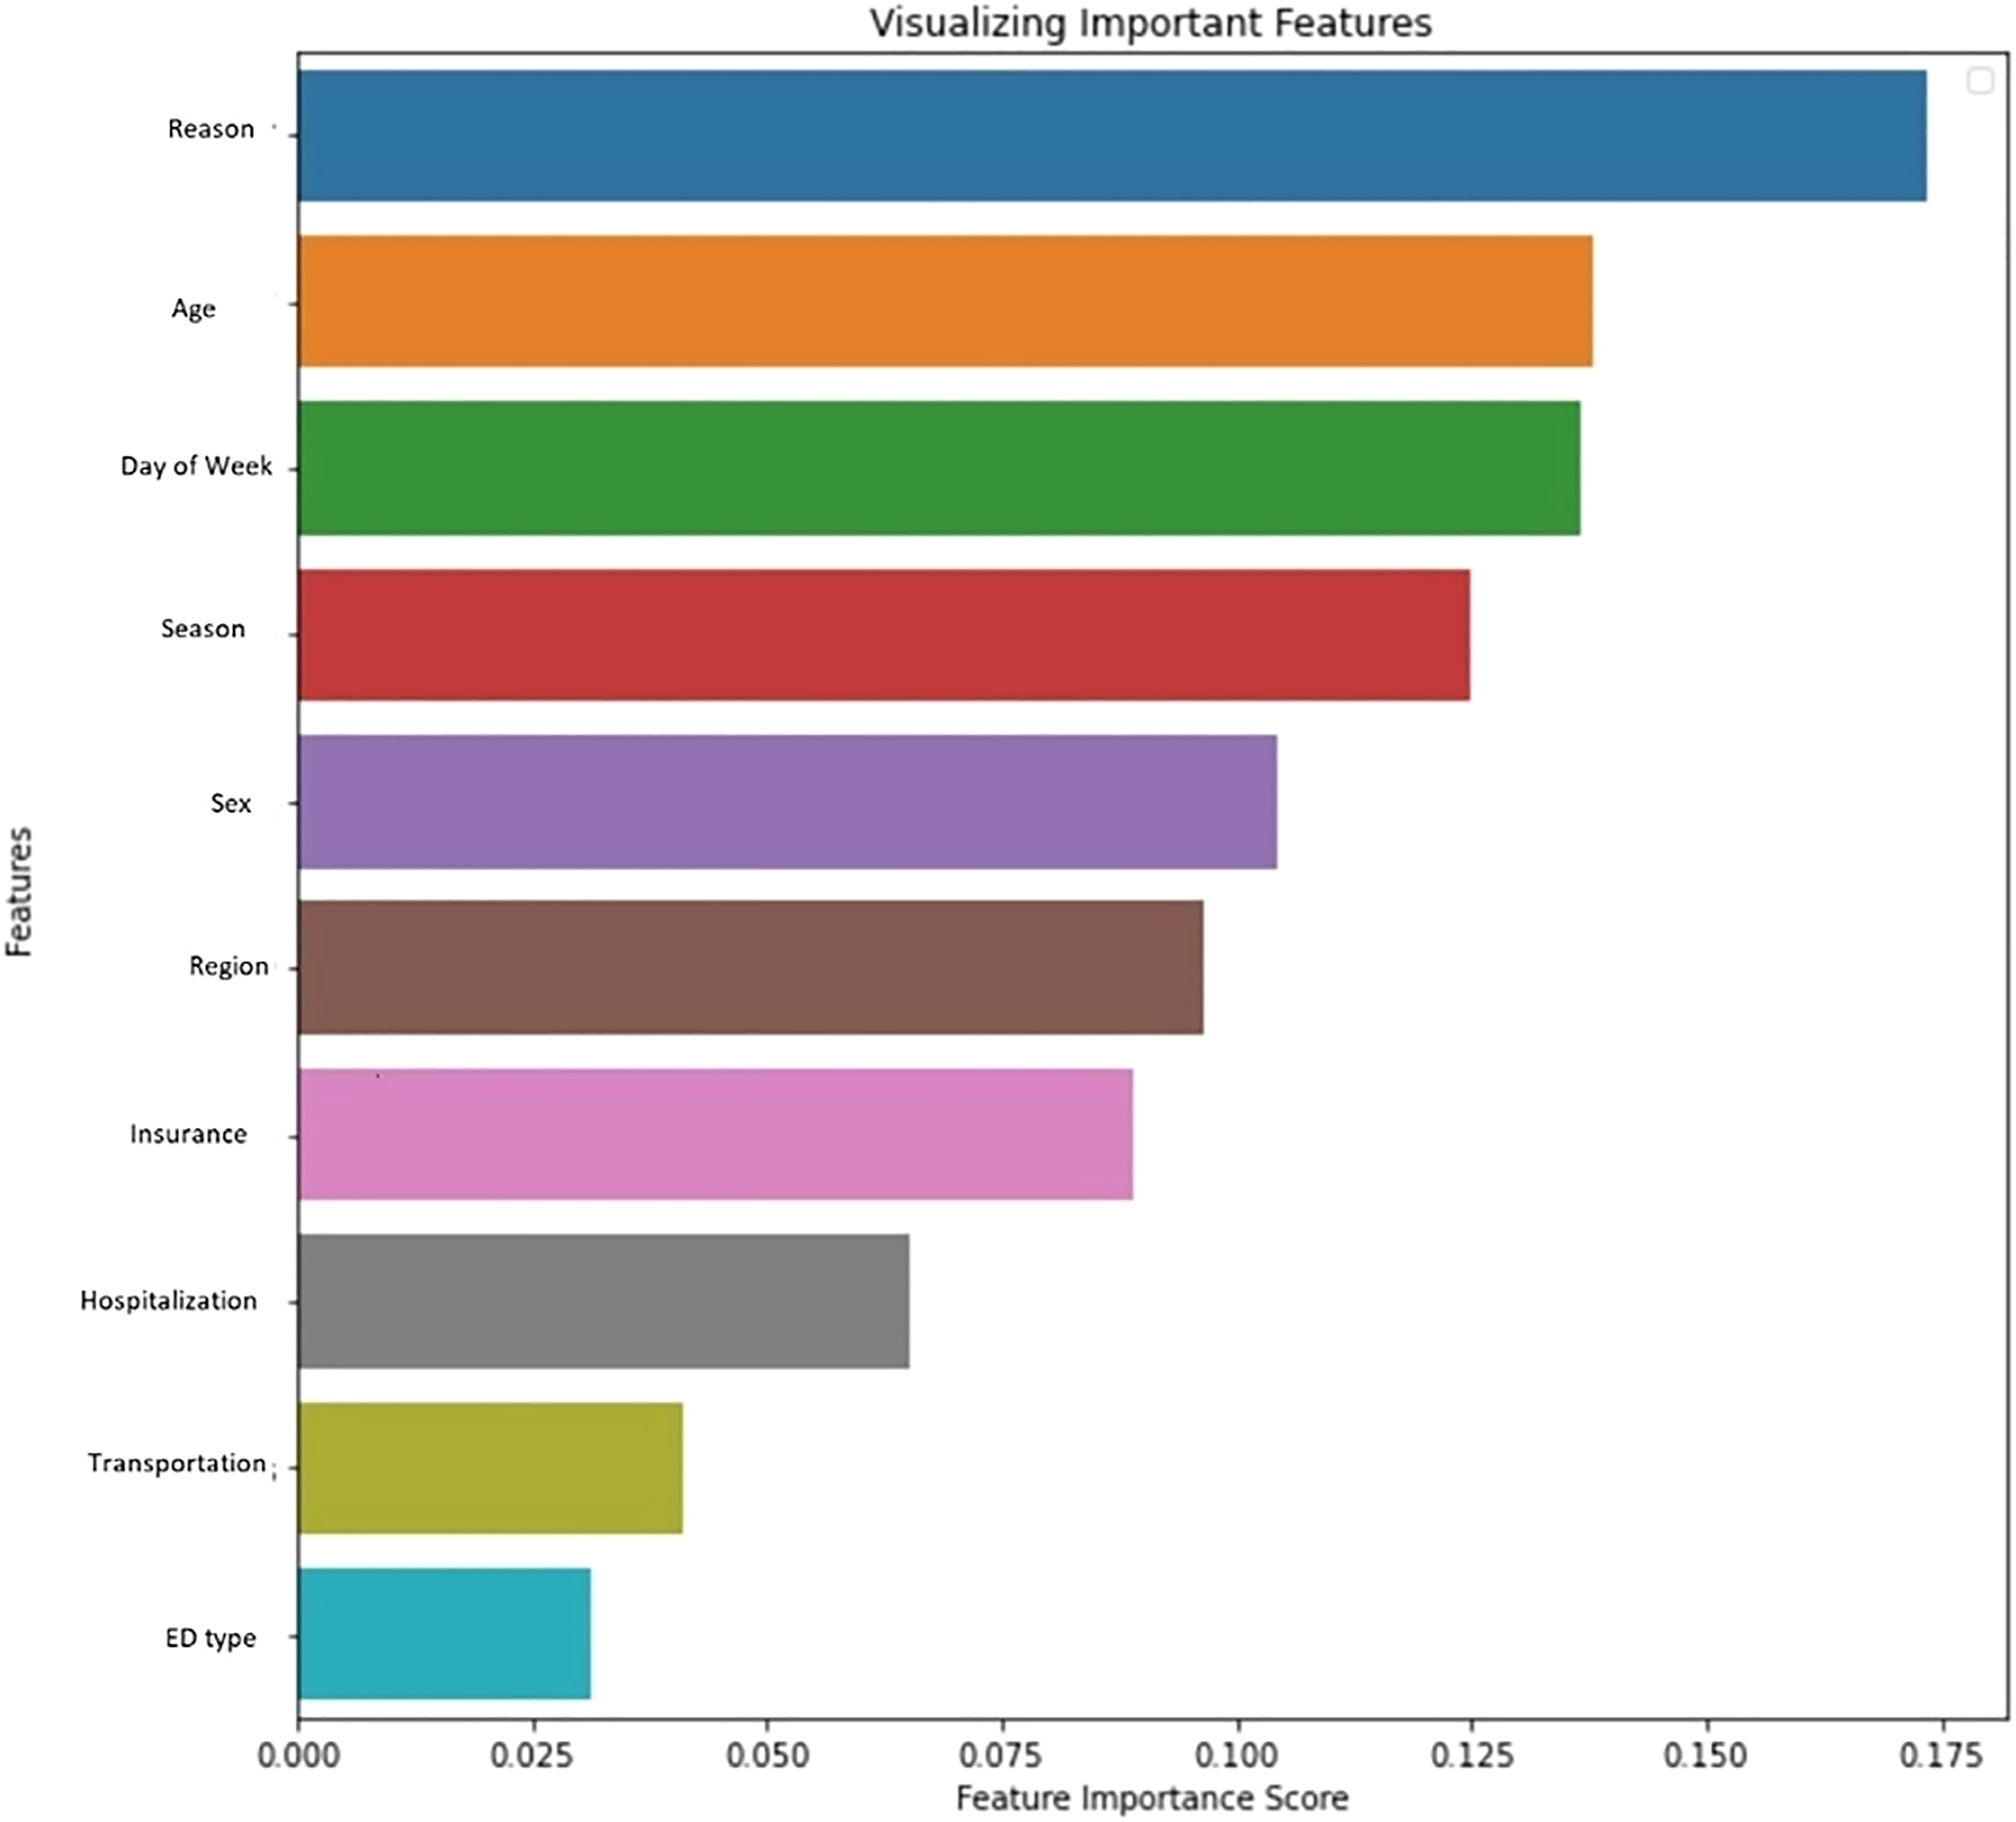
Discussion
Our study evaluated the performance of four ML classification algorithms and compared them to logistics regression for predicting frequent ED utilization among the Korean population. Random Forest was the best performing method with the highest precision and lower classification error. Other machine learning algorithms also outperformed logistic regression for predicting frequent ED users.
Our machine learning classification models with all variables showed higher accuracy than logistic regression. Interestingly, it is different from the reports in previous studies discussed in the ‘Related Work’ section 10–12. They found logistic regression to perform equally good or better than the other ML algorithms in their studies such as SVM, ADAboost or Random Forest. One possible explanation could be due to the different nature of our data compared to other studies (administrative vs. hospital/EMR data). Also, the data available for this study was not as large and was not affected by outliers or a high number of missing values. A future study with a larger dataset with a higher possibility of outliers and missing values would be required to verify the findings.
We took some necessary steps to make sure we reduce the risk of bias. Some examples were SMOTE (to address class imbalance) and K-fold cross-validation to reduce the bias toward overfitting. We evaluate and compare the Bagging method which is a bootstrap method with other algorithms. We also combined the algorithm with cross-validation for internal validity and preventing overfitting. Regarding our predictors, age was the only continuous predictors that we had, and we categorize it according to Korea demographic report. We used the Python GirdSearchCV package to tune the parameters for training algorithms. We made sure the tuning happened only on the training dataset, which means our test data remained untouched for external validation. However, we acknowledge a new set of data might be a better candidate to assess the generalizability of the models. Also model validation was based on resampling, which means that model development (all the steps that were used to build a model) was based on all available data. Since our data was not clinical, we did not perform decision curve analysis. Our study had several strengths. First, we had participants from a nation-representative sample of the Korean population and designed to account for differences in the likelihood of selection and differential response rates. Second, our data were collected over a considerable period (8 years) with seasonal data reflecting the seasonal ED visits pattern. Third, our data used medical records and prescriptions, which reduced the recall bias issues usually associated with self-reported data. Finally, we trained two machine learning algorithms (i.e. Bagging and Voting), which were not previously used in other studies. Both algorithms showed considerably improved performance compared to Adaboost and/or CART used in other studies.
Our study also had some limitations. First, there could be some vital missing records, which might not be retrievable or available. Second, our study samples were from medical data, and all patients received some service at EDs. However, there would be a small number of subjects who visited EDs but left without receiving any services. This might cause misclassification of an ED user and/or frequent user categories. Third, while there are some advantages to using administrative data, there is limited information on patients' clinical factors. Clinical factors may be crucial to better understanding the patient’s health utilization patterns. Although the focus of our study is the ML performance, including other socioeconomic factors such as income and occupation, which could be confounders and influence the explanation of the outcome will be necessary for developing appropriate interventions; therefore, additional analysis with the inclusion of socioeconomic as well as psychosocial factors is required to further explain the association between the outcome and the risk factors. Finally, calibration error results show there is still a chance for the ML models to be overfitted, although we took some necessary steps to reduce the risk of overfitting. We hypothesize that our dataset might be quite simple and small for ML modelling, which leads to overtrained data producing optimistic performance. The possibility of this limitation could inform future studies on the suitability of ML models for large mixed datasets, which yields a better perspective on their classification performance.
Our findings have implications for emergency department practices. By more accurate predictions of future ED visits, there is a great potential to reduce preventable and non-urgent ED visits by designing appropriate interventions based on the algorithms' predictions. For example, an increase in the number of visits due to injuries during summer is a potential focus area to design appropriate interventions.
Although the performance of ML algorithms was better than logistic regression, selecting a predictive method for a given problem would depend on the significance and complexity of the relationships between predictors. In machine learning a test set is used for external validation. In our study, 30% of our data was set aside to be used as the test set, which means that this set was not used in any way during training and validation (i.e. parameter tuning, model selection). The SMOTE resampling technique was applied to the training set only to ensure the test set represents the original data. For fitting the model, we used the resampled training set and used the test set to test the fitted model. We should also mention that since the splitting data to training and test subsets happens entirely at random, we do not know what percentage of 30% is positive outcomes (Frequent users). Although we can gain that information, we do not need to since we do not want to manipulate the test subset. Similarly, we are not aware of the number of frequent users (positive outcome) in the training set; therefore, we cannot decide the number of over-sampled and under-sampled cases in the frequent and infrequent users' classes, respectively. Again, this is possible to gain this information; however, this was not a concern for model fitting as we were not to change the randomly chosen subsets. Therefore, we believe that our test set, which is the non-transformed subset, contains only samples from the original data, so it is appropriate to evaluate model performances using the test set. K-fold cross-validation as well synthetic oversampling was used to address the overfitting problem. However, we are aware of as the possibility of overfitting, which was discussed as limitation. Applying the ML presented models on different set of data including more risk factors could assess the generalizability of the results.
Our study is a practical example of using machine learning for population health outcomes prediction. However, adding other risk factors such as psychosocial or other socio-economic characteristics, and/or using additional data sources will offer higher dimensionality and complexity. Thus, we could benefit more from machine learning approaches.
In summary, Random Forest with 98% precision, 95% sensitivity, and 3.8% classification error had the best predictive power. Logistic regression underperformed other algorithms with the lowest precision (65%) and sensitivity (67%), and the highest classification error (24.07%). Accurate prediction of frequent utilization of EDs is important for designing effective interventions to reduce the number of preventable visits and hence the cost of ED visits for healthcare systems. The results show that ML classification algorithms are robust techniques with predictive power for future ED visit prediction.
Supplemental Material
sj-pdf-1-jhi-10.1177_14604582221106396 – Supplemental Material for Comparative analysis of machine learning approaches for predicting frequent emergency department visits
Supplemental Material, sj-pdf-1-jhi-10.1177_14604582221106396 for Comparative analysis of machine learning approaches for predicting frequent emergency department visits by Razieh Safaripour and Hyun Ja “June” Lim in Health Informatics Journal
Footnotes
Acknowledgements
The authors thank all the study participants for generously joining this survey. The authors also thank the reviewers for their helpful comments.
Declaration of conflicting interests
The author(s) declared no potential conflicts of interest with respect to the research, authorship, and/or publication of this article.
Funding
The author(s) disclosed receipt of the following financial support for the research, authorship, and/or publication of this article: National Research Foundation of Korea (NRF); NRF-2020H1D3A2A01110927.
Supplemental Material
Supplemental material for this article is available online.
References
Supplementary Material
Please find the following supplemental material available below.
For Open Access articles published under a Creative Commons License, all supplemental material carries the same license as the article it is associated with.
For non-Open Access articles published, all supplemental material carries a non-exclusive license, and permission requests for re-use of supplemental material or any part of supplemental material shall be sent directly to the copyright owner as specified in the copyright notice associated with the article.