
Abstract
The umbilical cord is an organ that circulates oxygen and nutrition from mother to fetus during pregnancy. This study aims to classify the umbilical cord based on ultrasound images. The similarity of shape and coil between each class becomes a challenge. Therefore, it requires feature values that are relevant to the characteristics of these three classes. The condition of imbalanced data sets in this study is also an obstacle that causes the classifier’s performance to degrade on minority classes. Therefore, this study proposes a machine learning model capable of properly dealing with imbalanced data sets and recognizing the umbilical cord class.
Furthermore, this study proposes a new feature extraction method, namely, the umbilical coiling index (UCI), which directly adopts obstetricians’ knowledge. The proposed model consists of five stages: image preprocessing, feature extraction, feature selection, oversampling data using SMOTE, and Classification. Machine learning method observations were carried out comprehensively on five based classifiers: Random Forest, KNN, Decision tree, SVM, Naïve Bayes, and Multiclassifier. The results showed that the Random forest and Multiclassifier methods provide the highest accuracy, precision, recall, and F-measure performance in imbalanced data sets.
Introduction
The umbilical cord is a connective tissue or channel that connects the placenta and the fetus. It also serves as a source of life for the fetus by maintaining fetal viability (survival), facilitating its growth, aiding in the disposal of waste compounds, and transporting oxygen, nutrients, and antibodies in the womb. 1 This channel consists of three blood vessels: one umbilical vein and two arteries connecting fetal circulation with the placenta. Medical research on fetomaternal and obstetrics widely used the umbilical cord to determine fetal growth and development. Abnormalities in the shape and morphology cause blood flow disruption from the placenta to the fetus, as reported by Bosselmann et al. 2 Therefore, an obstetrician’s examination is critical, considering the risks of disrupting blood flow to the fetus, such as malnourishment. Ndolo et al., 3 Bosselmann et al., 2 and Kulamani et al. 4 stated that an assessment standard called the Umbilical Coiling Index (UCI) is used to determine the umbilical cord category. UCI is a standard for measuring the number of twists based on the total length of the umbilical cord. One twist is a 360-degree turn in the spiral shape of the umbilical vessel. UCI value is the measurement by dividing the number of coiling by the length of the umbilical cord. The umbilical cord is classified into three forms: Normocoiled, Hypocoiled (supposing the umbilical index is less than the 10th percentile), and Hypercoiled (assuming it is greater than the 90th percentile).1,5–10 The number of coils affects blood flow, oxygen, antibodies, and nutrients the fetus needs.7,11–13
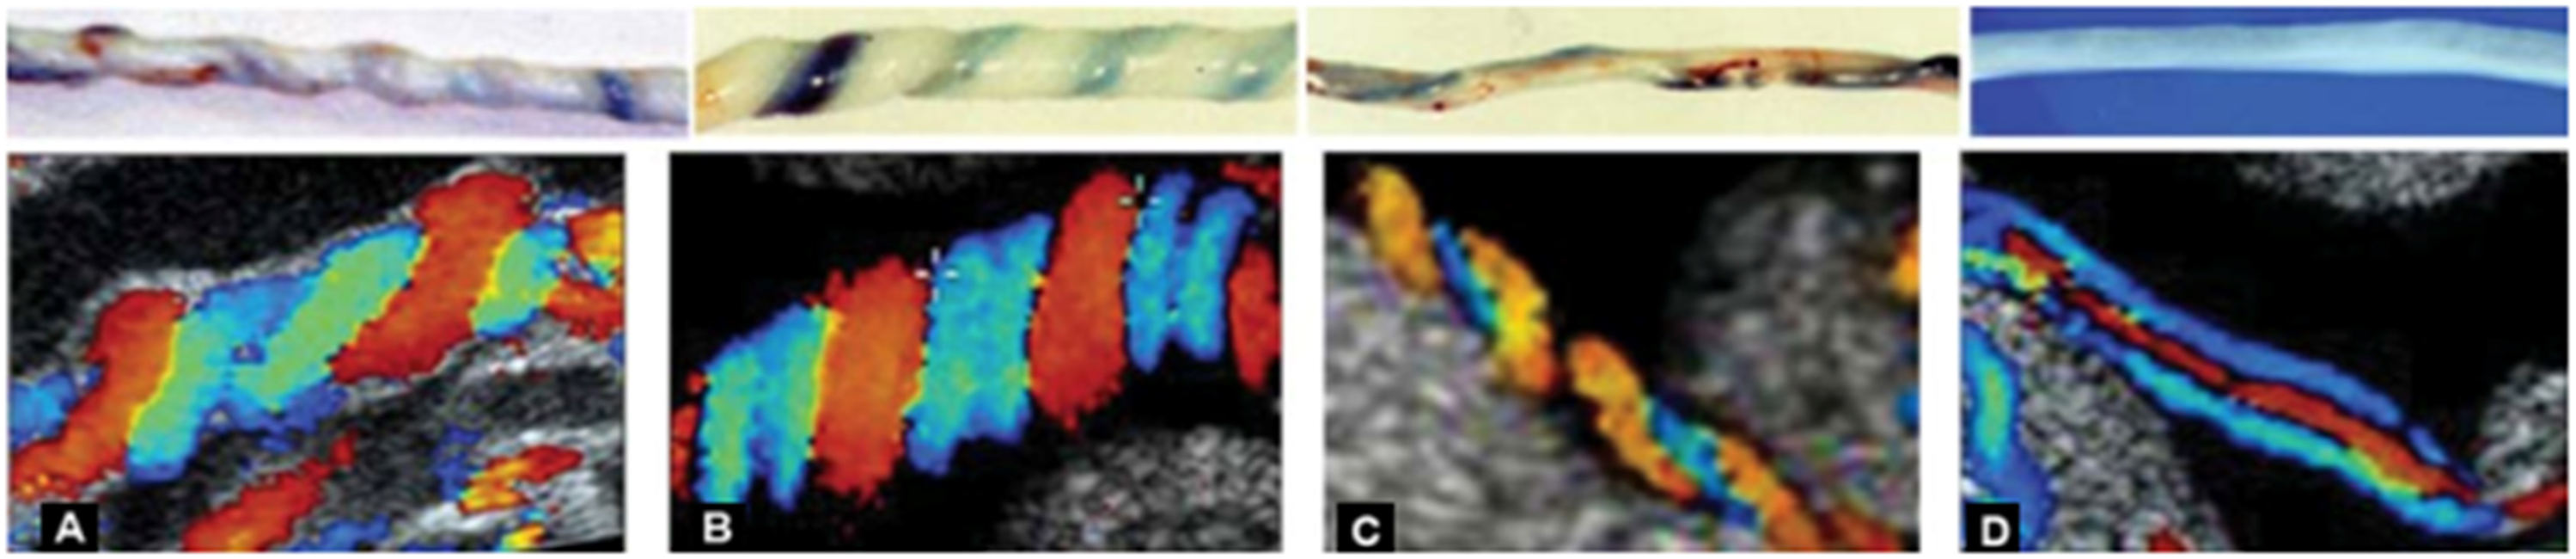
Figure 1 shows an example of the umbilical cord taken with an ultrasound machine using the Doppler effect. The color difference between red and blue indicates blood flow in the veins, while blue indicates the arteries. Hypocoiling conditions where there is no coil in the venous blood vessels from the arteries cause the umbilical cord to become prone to true knots so that it clogs the blood flow in the vessels. Three categories of Umbilical cord; (a). Normocoiled; (b, c). Hypercoiled; (d). Hypocoiled
1
.
The fetal umbilical cord is excluded from the mandatory routine examination by an obstetrician. However, when the obstetrician notices any abnormality, such as inappropriate fetal weight, the umbilical cord is one of the organs that need to be analyzed. The ultrasound machine does not provide the much-needed information about the anatomy and condition of the umbilical cord. Due to the essential role of the umbilical cord in fetal growth and development, it is imperative to solve this problem to provide supporting information to obstetricians when diagnosing umbilical cords that require prompt and appropriate medical actions.
Artificial intelligence technology, especially with the machine learning method, has been widely used to support this analysis and provide second opinions for clinicians in making a diagnosis. 14 One of the important steps in the machine learning model for medical image classification is feature extraction. This stage extracts the information contained in the image to provide a characteristic representation of an object or organ. An example is a study carried out by Acharya et al. 15 on breast cancer MRI images’ statistical and structural features. Moreover, there is an additional feature, namely, the Run Length Matrix, with a value based on the predetermined parameters’ gray tone, length, and direction.
Furthermore, Fajrin et al.16,17 combined the GLCM method with wavelet decomposition and entropy characteristics. The combination of these methods provided additional information regarding the nature of texture diversity and image randomness. The textural characteristics realized from a combination of the GLCM method and Two Dimensional Discrete Wavelet Transform (2D-DWT) were proposed by Beura et al. 17 It was carried out to obtain the accurate textural characteristics of the MRI breast cancer image using the Multiresolution Analysis concept. A similar model involving a combination of the 2D-DWT method and GLCM was proposed by Mohanty et al. 18 The difference lies in the division of the image on the region of interest (ROI) into several parts called blocks with a size of 64×64. The GLCM method was also applied to each sub-bands resulting in the wavelet decomposition of the ROI block. In addition to using MRI images, Belsare et al.19,20 used biopsy images to classify cancer into benign and malignant. This is different from the research carried out by George et al. 19 on textural features using the GLCM method. The study is performed on four different color channels: red, green, blue, and gray. Wu et al. 21 categorized breast cancer into Triple-Negative (TN) and Non-Triple-Negative (NTN). Several extractions such as texture, shape, and vascularity are used to determine the best combination of features in the test.
Limited studies on machine learning methods for fetal umbilical cord image classification make this study a pioneer in developing subsequent studies. Pradipta et al. 22 specifically carried out a study on fetal umbilical cord classification using the GLCM feature extraction approach and several morphological features. However, this study failed to use the specific characteristics adopted by clinical practitioners to assess the fetal umbilical cord ultrasound image. Applying obstetricians’ knowledge in the feature extraction process is expected to improve the machine learning models’ performance. This study proposed combining UCI and the GLCM method to improve the classification performance reported by previous studies. Furthermore, several classifier-based methods such as Random Forest, Support vector machines (SVM), Naïve Bayes, Decision tree, and K-nearest neighbors (KNN) were observed. The observation was also made by combining all classifiers into the Ensemble Multiclassifier method based on voting decisions.
Proposed Model
Generally, the proposed machine learning model consists of four stages: Image preprocessing, Feature extraction and Selection, Data oversampling, and Classification, as shown in Figure 2. Proposed Single classifier architecture for umbilical cord classification.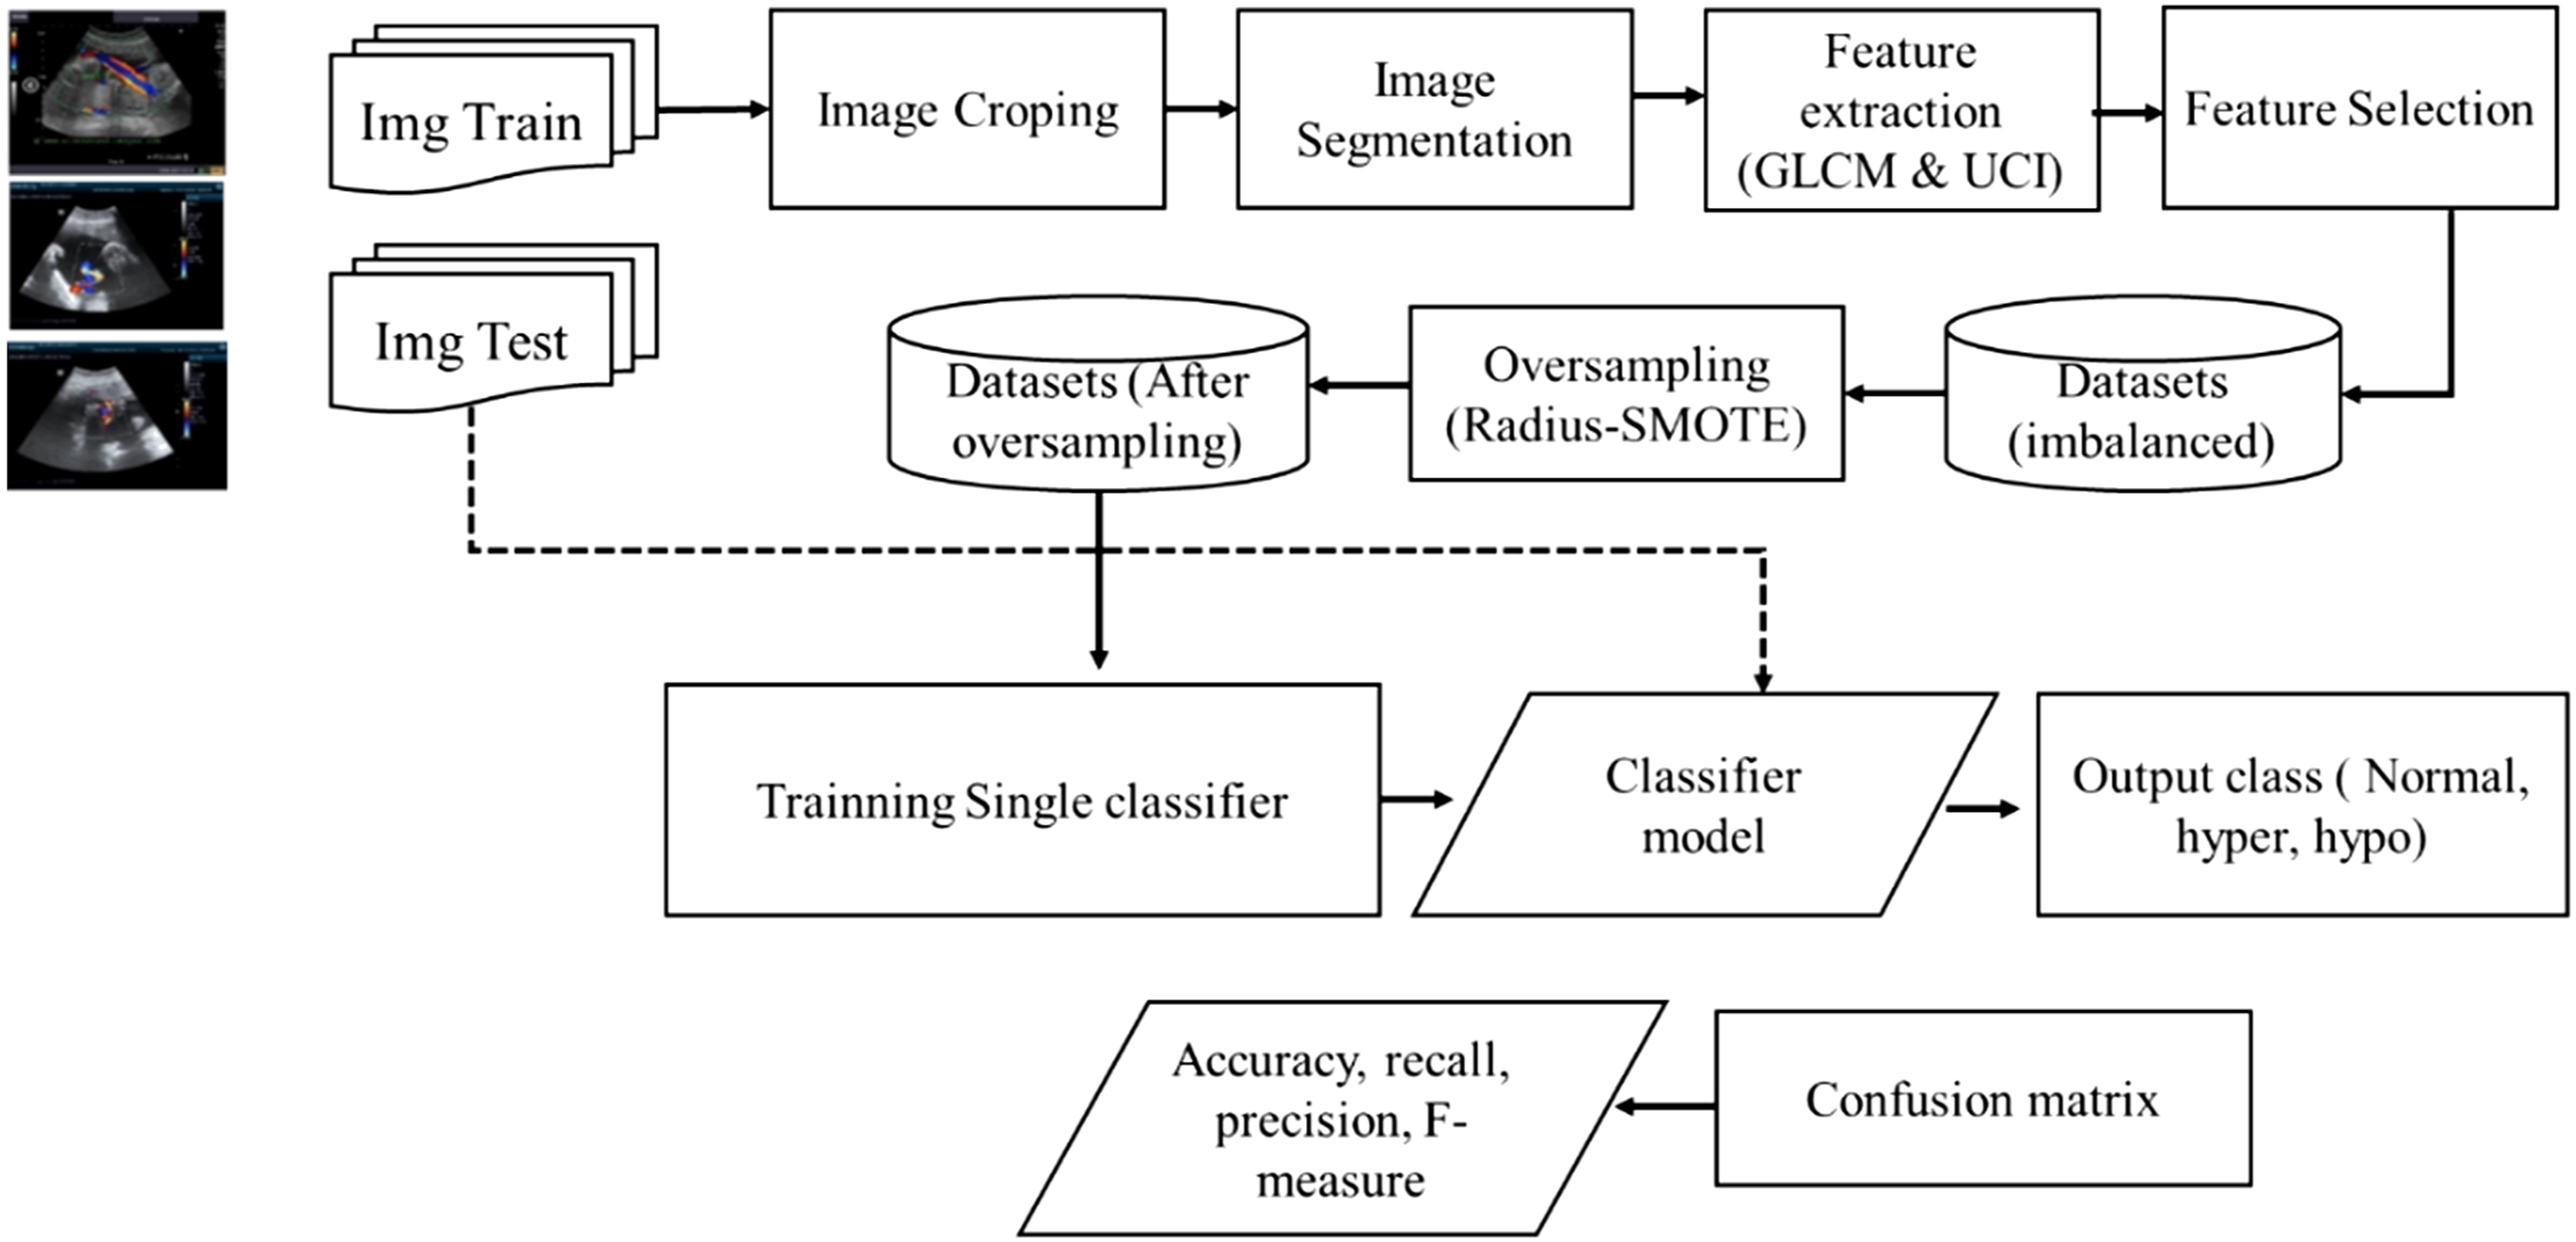
The multiclassifier voting classification is one of the methods included in the ensemble learning category. Moreover, the use of several classifiers to predict test data ensures accurate label output. The proposed method uses the majority voting method. Each classifier has a weight value in determining the final decision and the output label based on the most predicted class votes from the input data, as shown in Figure 3. Proposed Multi classifier architecture for umbilical cord classification.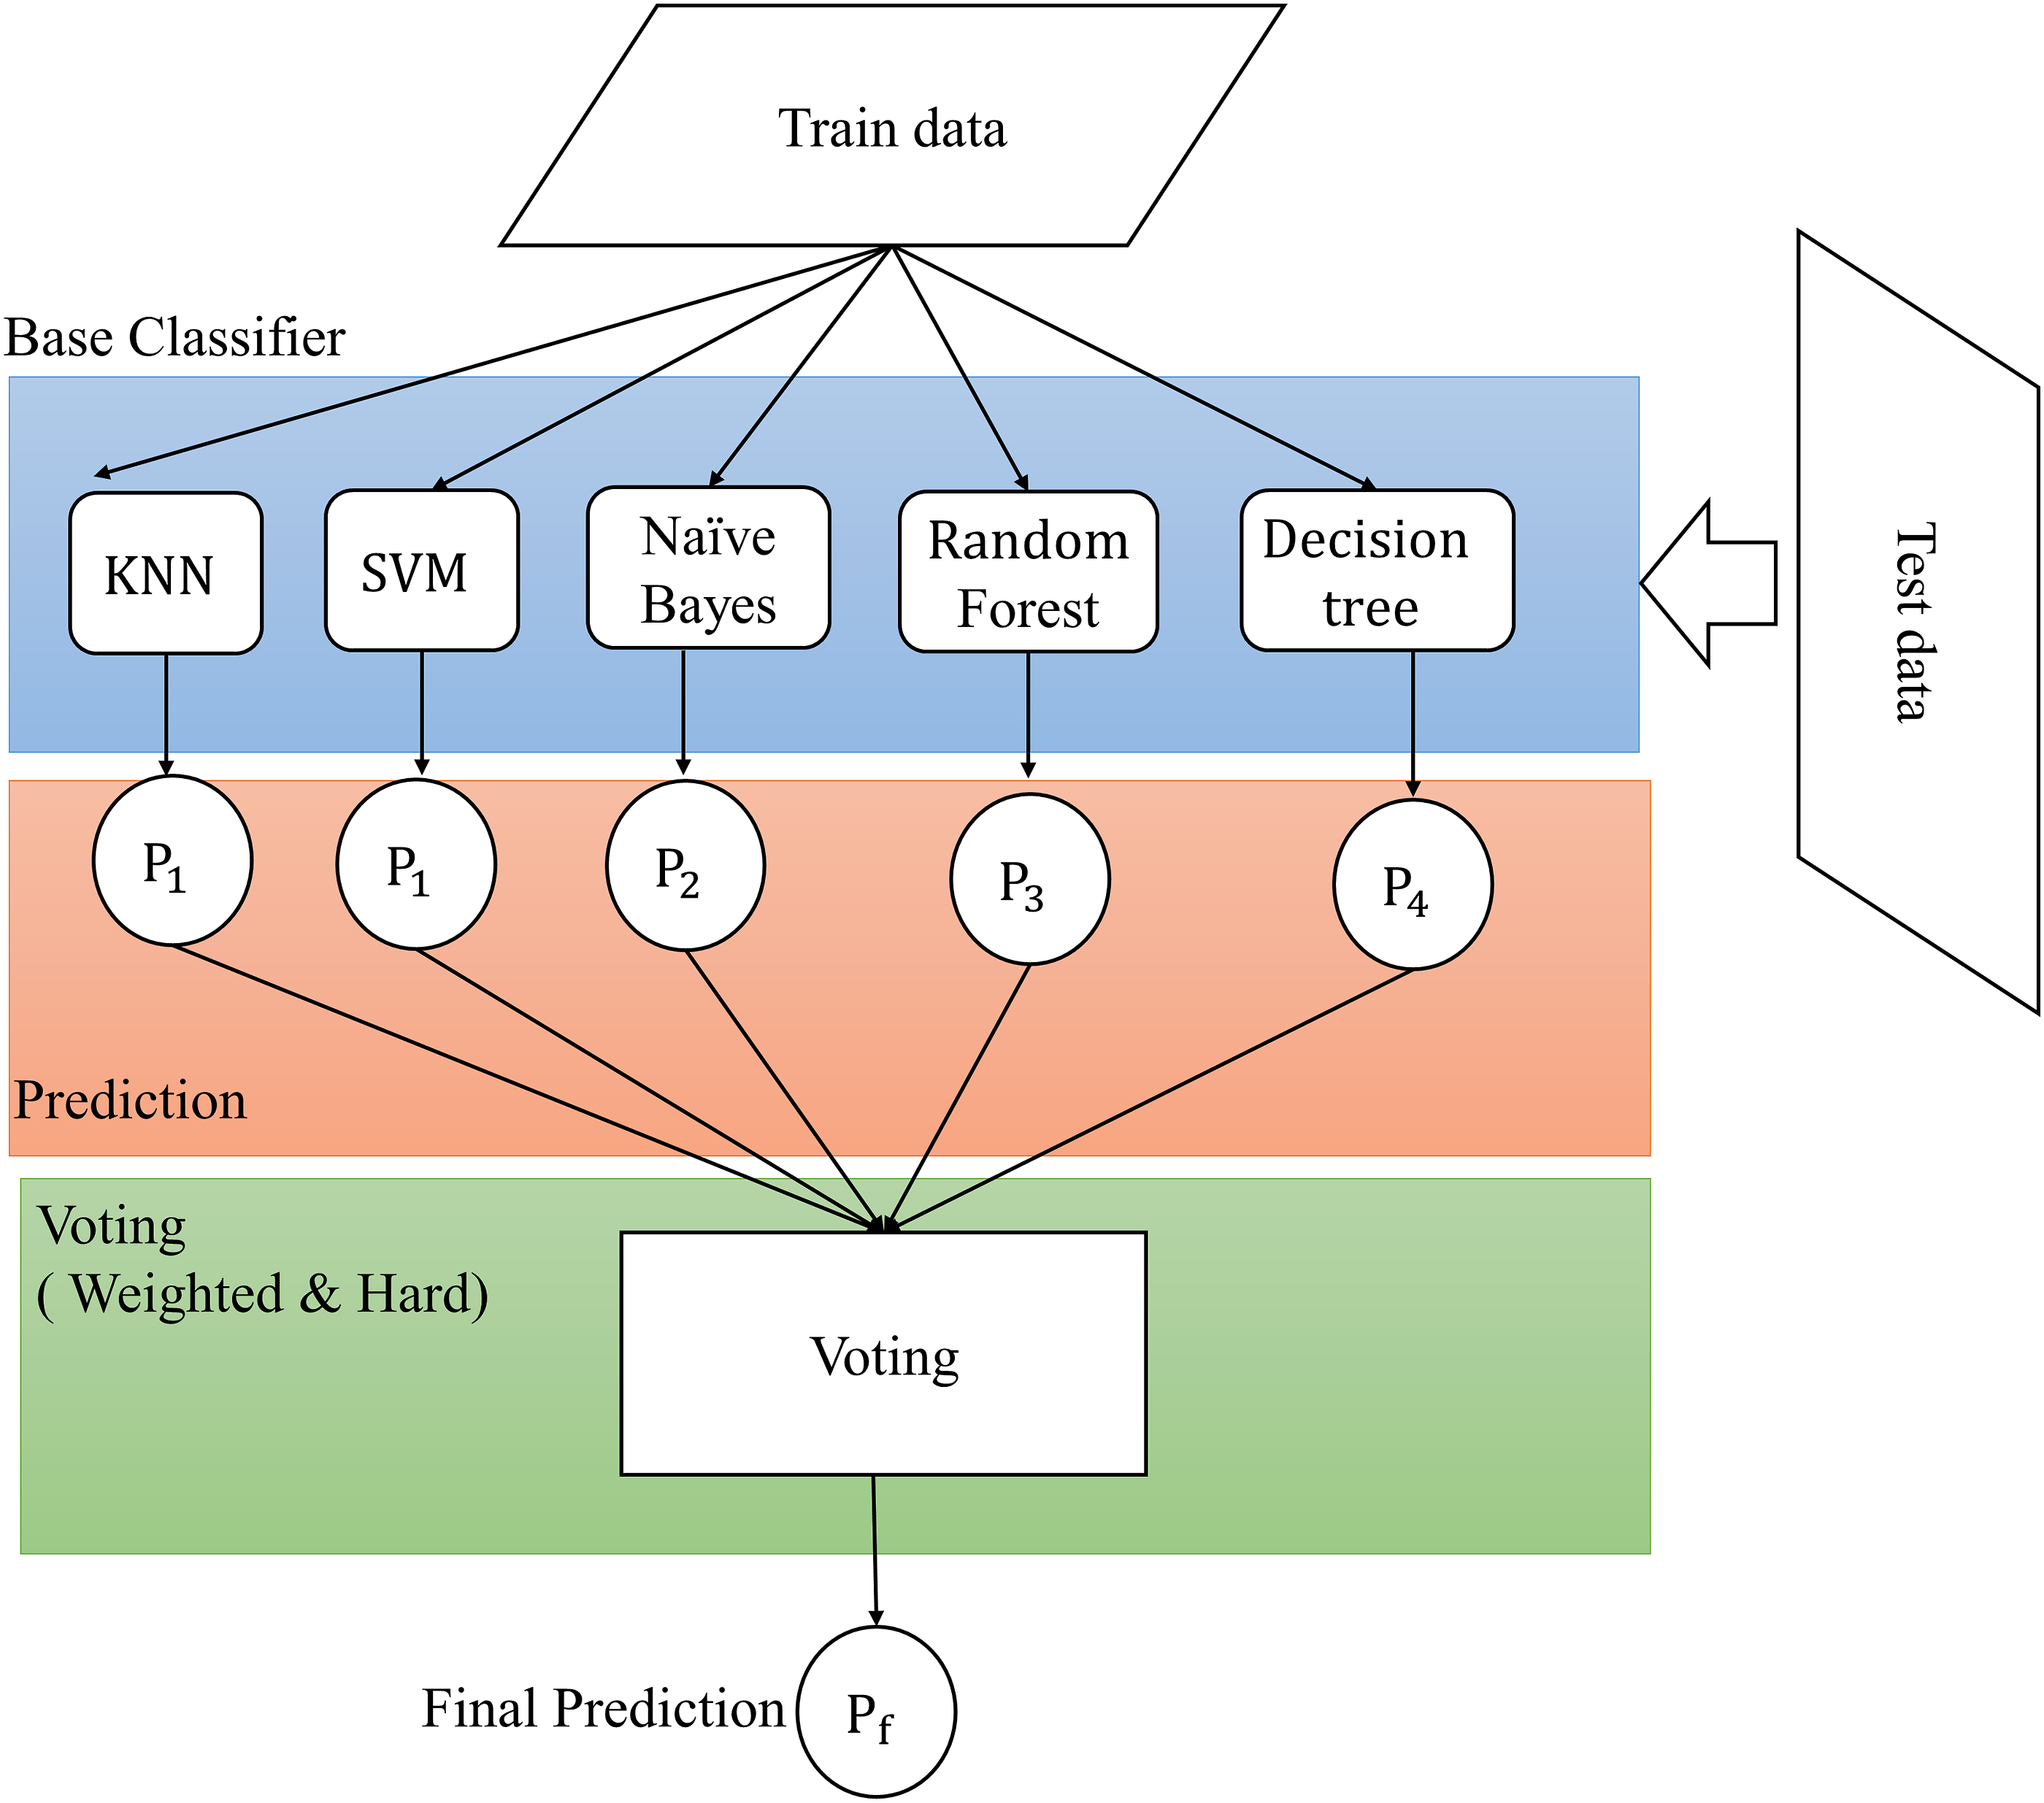
Image Dataset
The data comprises of the fetal umbilical cord image taken using a 2-dimensional Doppler ultrasound machine with specifications. Its retrieval and collection were carried out at Kasih Medika Obstetrics and Gynecology Clinics in Bali, Indonesia. The data is divided into three categories: Normocoiling, Hypocoiling, and Hypercoiling, taken from 8 to 32 weeks of gestation. Figure 4 shows an example of image data. The image dataset number of Normocoiling, Hypocoiling, and Hypercoiling classes is 108, 34, and 9 images and the labeling process of the entire image dataset is done by an obstetrician. From the number of datasets, it can be seen that there is an imbalanced data condition where the Hypercoiling class has a tiny amount of data compared to other classes. This imbalanced condition requires separate handling before the learning process on the classification algorithm is carried out. Example of Doppler ultrasound fetal umbilical cord image data; (a). Normocoiling; (b). Hypocoiling; (c). Hypercoiling.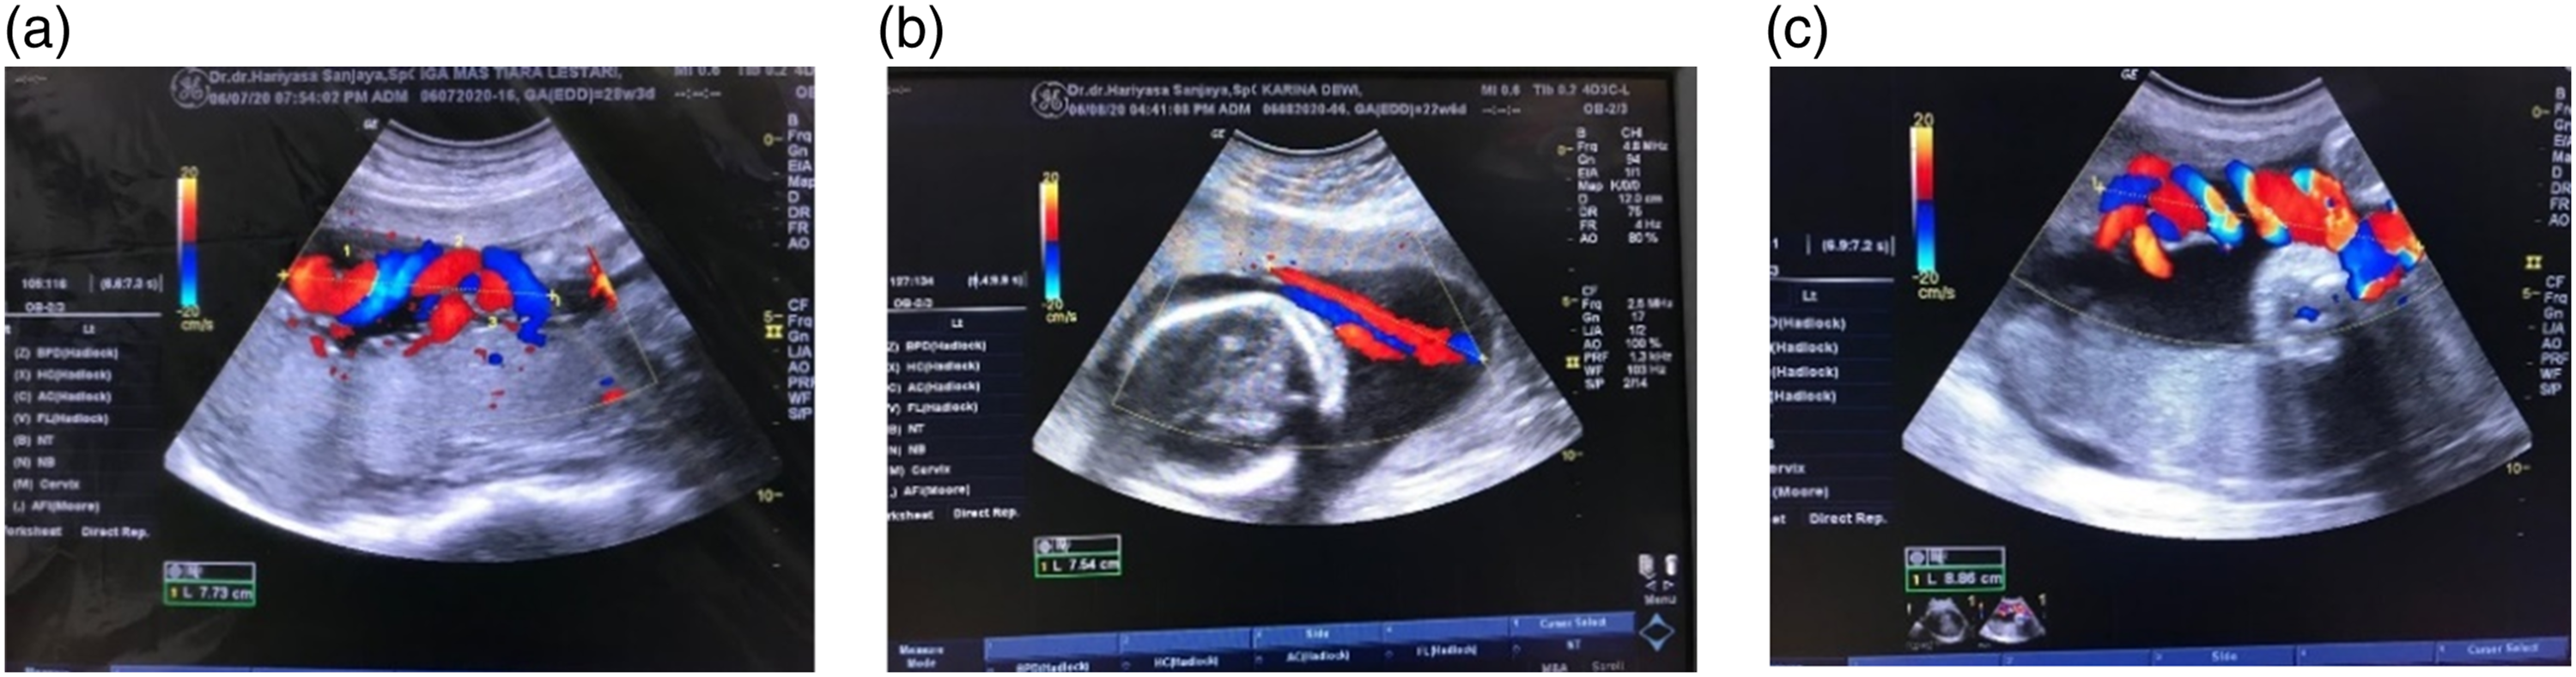
Image Preprocessing
The image segmentation process is carried out in the HSV (Hue, Saturation, Value) color space. The cropping of the original image aims to remove text or captions. The presence of information in text and numbers tends to interfere with the segmentation and feature extraction processes. This cropping approach changes the image size to 744 x 522 pixels. The second process involves transforming the color space from RGB (Red, Green, Blue) to HSV. After the conversion process, the segmentation method is applied with the threshold value sought for each hue, saturation, and value channel. The optimal threshold value is determined by observing the image histogram of each channel.
After determining the threshold value for object segmentation, the image edges are smoothened using the opening and closing morphological methods. The closing operation is useful for smoothing the contours and eliminating small holes in the segmented image. The final step involves the selection of the object’s largest region. This process is carried out by measuring the object area using the region props library in MATLAB. In addition, the results of this preprocessing stage are shown in Figure 5. Umbilical cord image preprocessing process; (a). Image segmentation by thresholding; (b). Opening and closing results; (c). Labeling object; (d). After region props operation; (e). RGB image after final preprocessing; (f). Grayscale image after final preprocessing.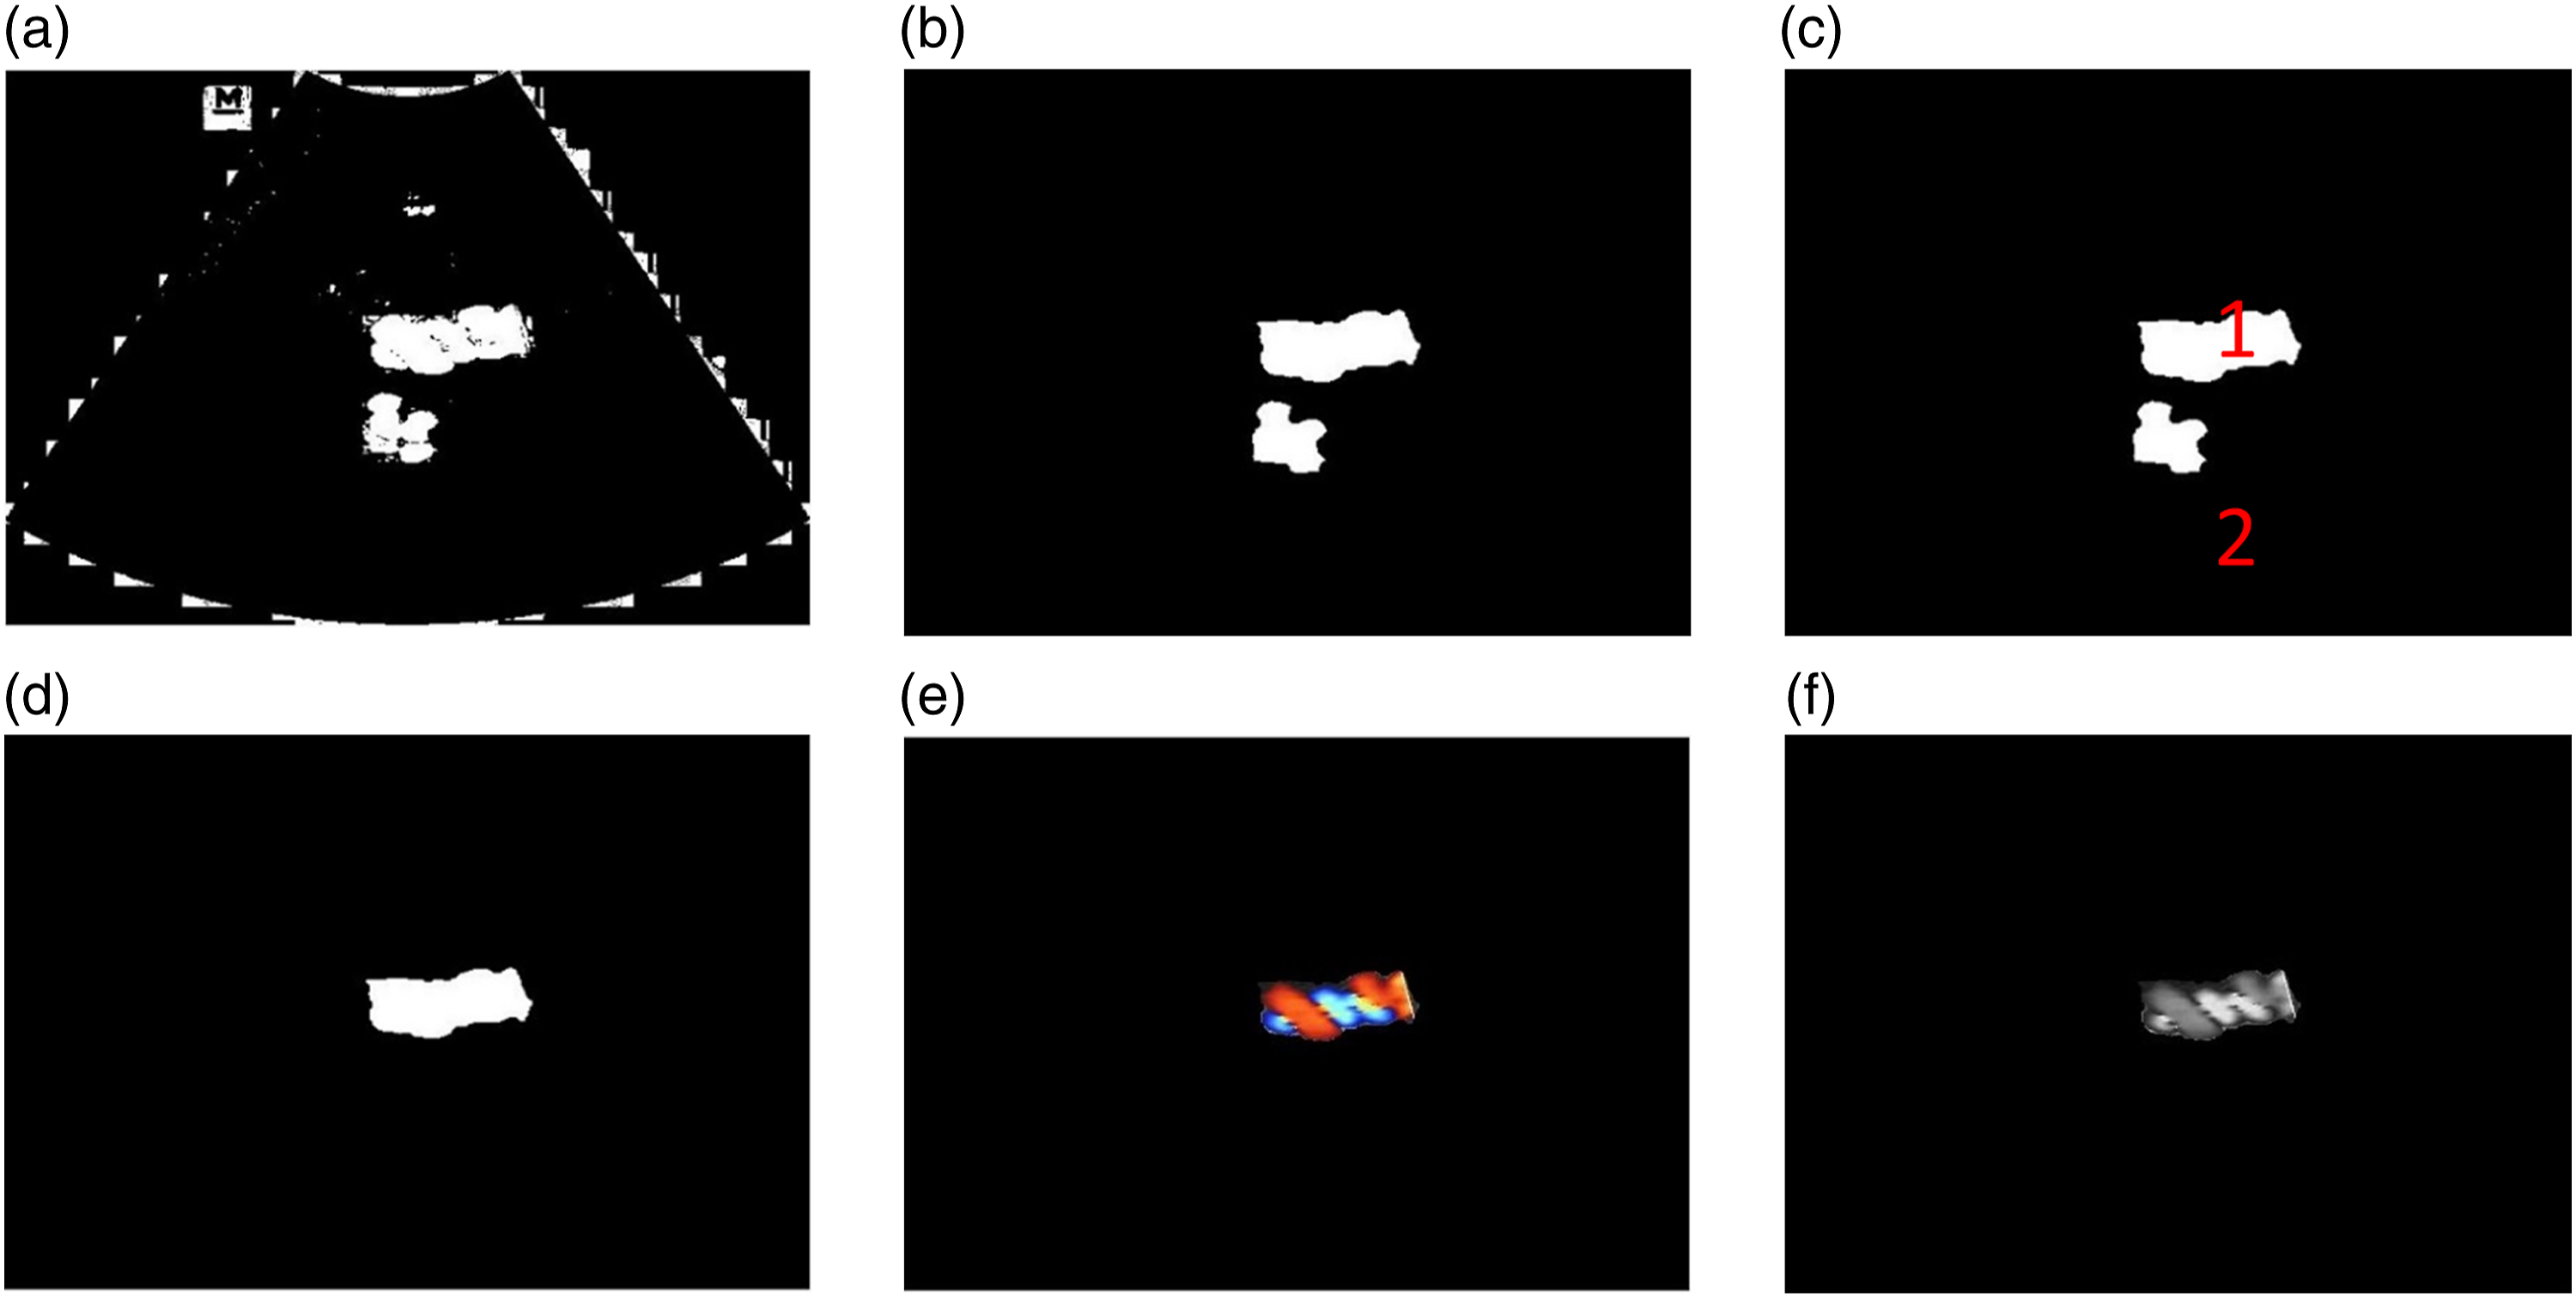
Texture Analysis With Gray level Co-Occurrence matrix (GLCM)
GLCM is used to detect textures by calculating the probability of the relationship between 2 neighboring pixels at a certain angle orientation distance.
23
This technique is used to obtain a second-order statistical value by calculating the probability of the close relationship between 2 pixels at a certain distance (d) and angle (θ). The θ value is dependent on the direction of the angle, namely,
The first step involves forming a concurrency matrix and determining the spatial relationship between the reference and neighboring pixels based on the angle (θ) and distance (d). The concurrency matrix is constructed using a second-level histogram. This matrix is a joint probability distribution of pixel pairs at a certain gray level. Figure 6 is an illustration of an image with size 4. Furthermore, the neighboring pixels are selected from the east (right) or at an angle of Illustration of Matrix co-occurrence in GLCM.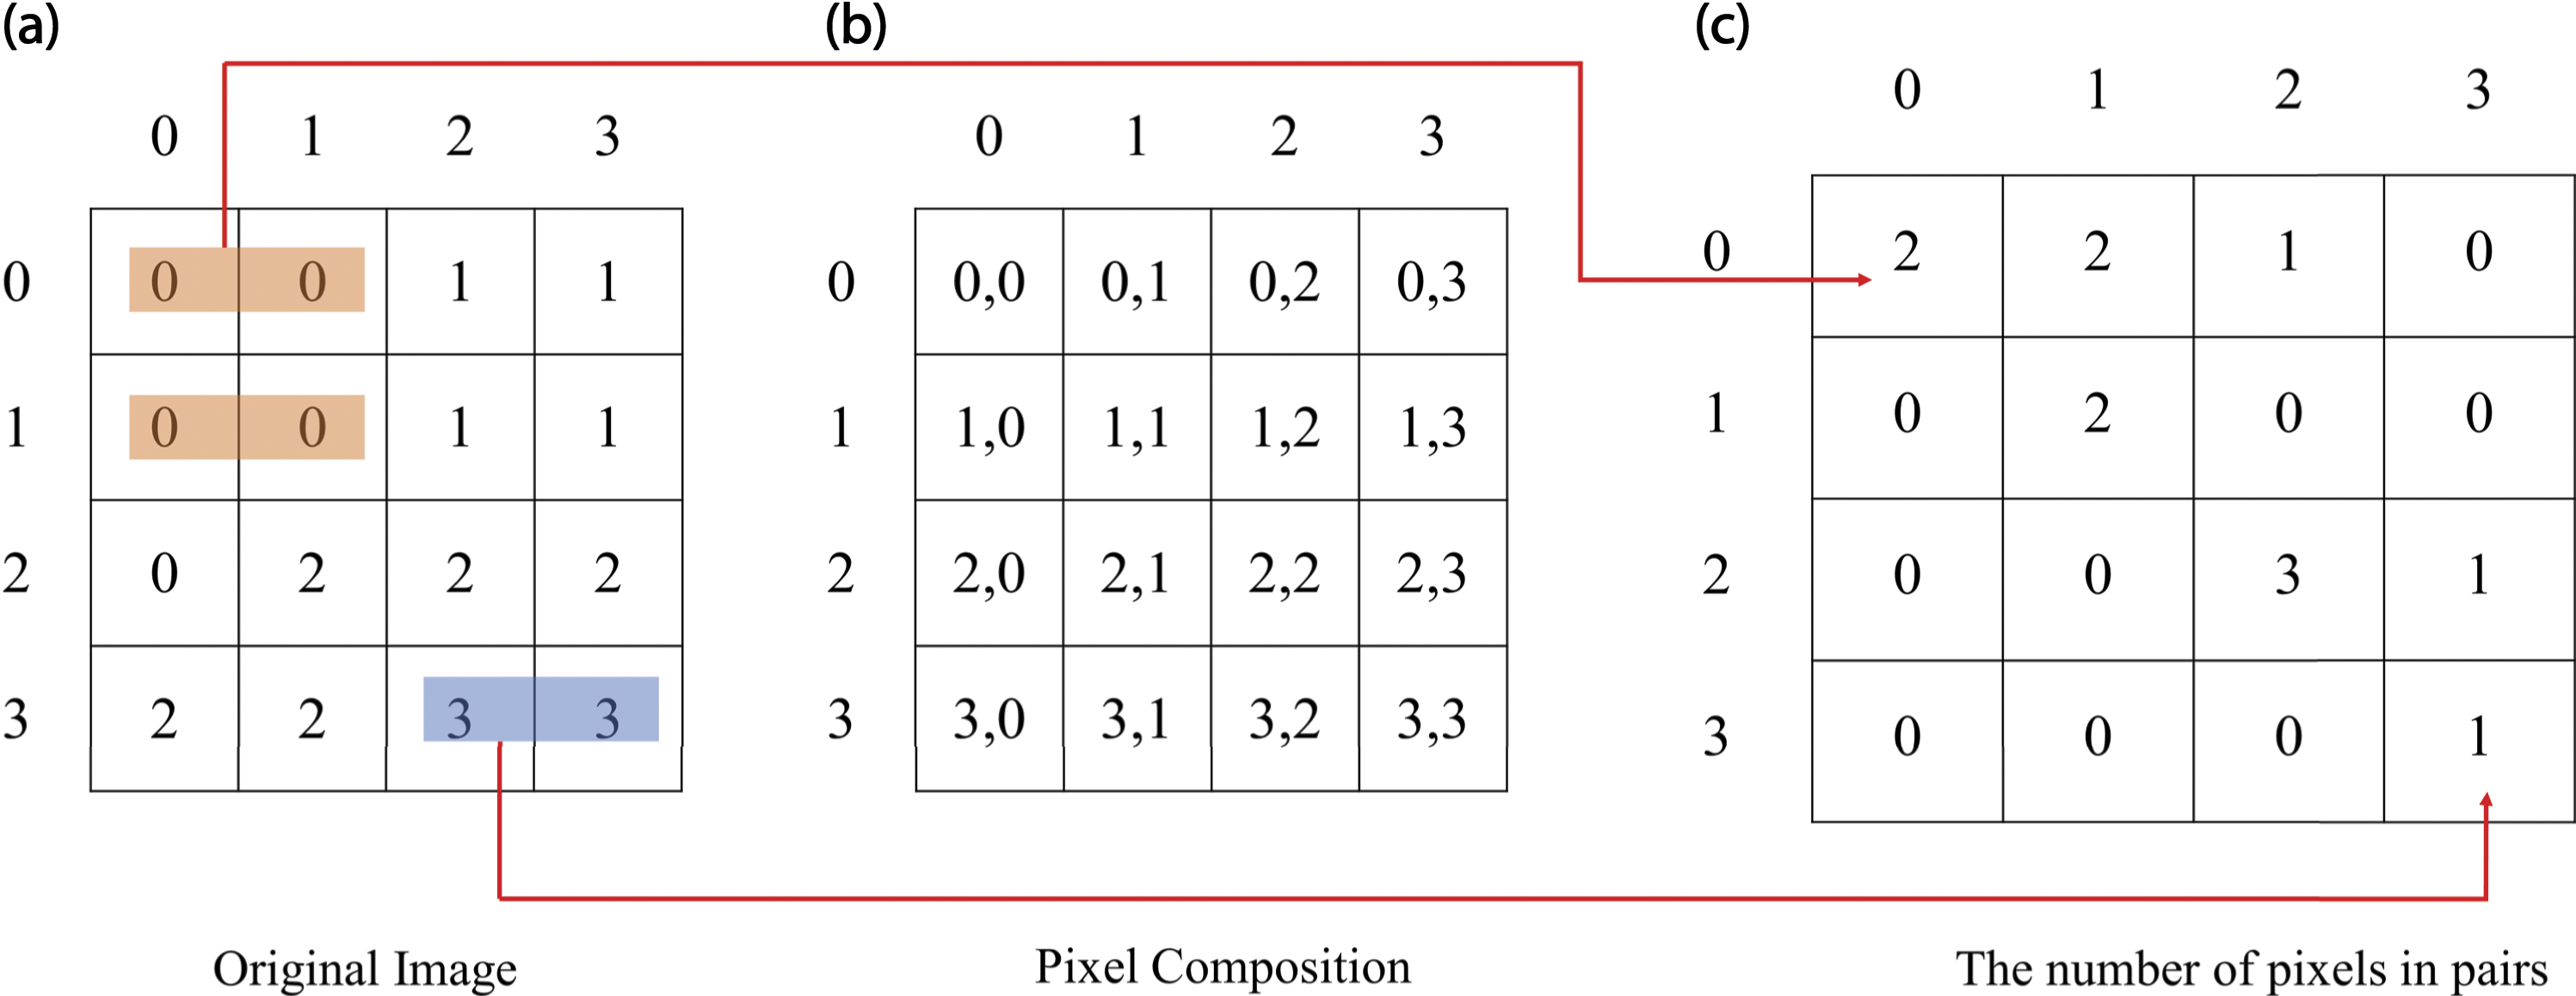


The second step involves the formation of a symmetrical matrix. The concurrency matrix C was initially known as its framework. This needs to be processed into a symmetric matrix by adding the transpose results to

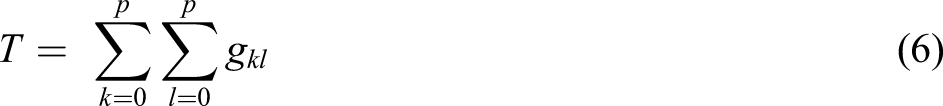
The third step is to normalize the symmetric matrix G to eliminate the dependence on image size. The GLCM values need to be normalized, thereby leading to the sum of 1. Equation (4) shows the normalization of each matrix element. After the normalization process, the feature values in the GLCM method are calculated


Umbilical Coiling Index (UCI)
Pseudocode UCI Feature extraction.
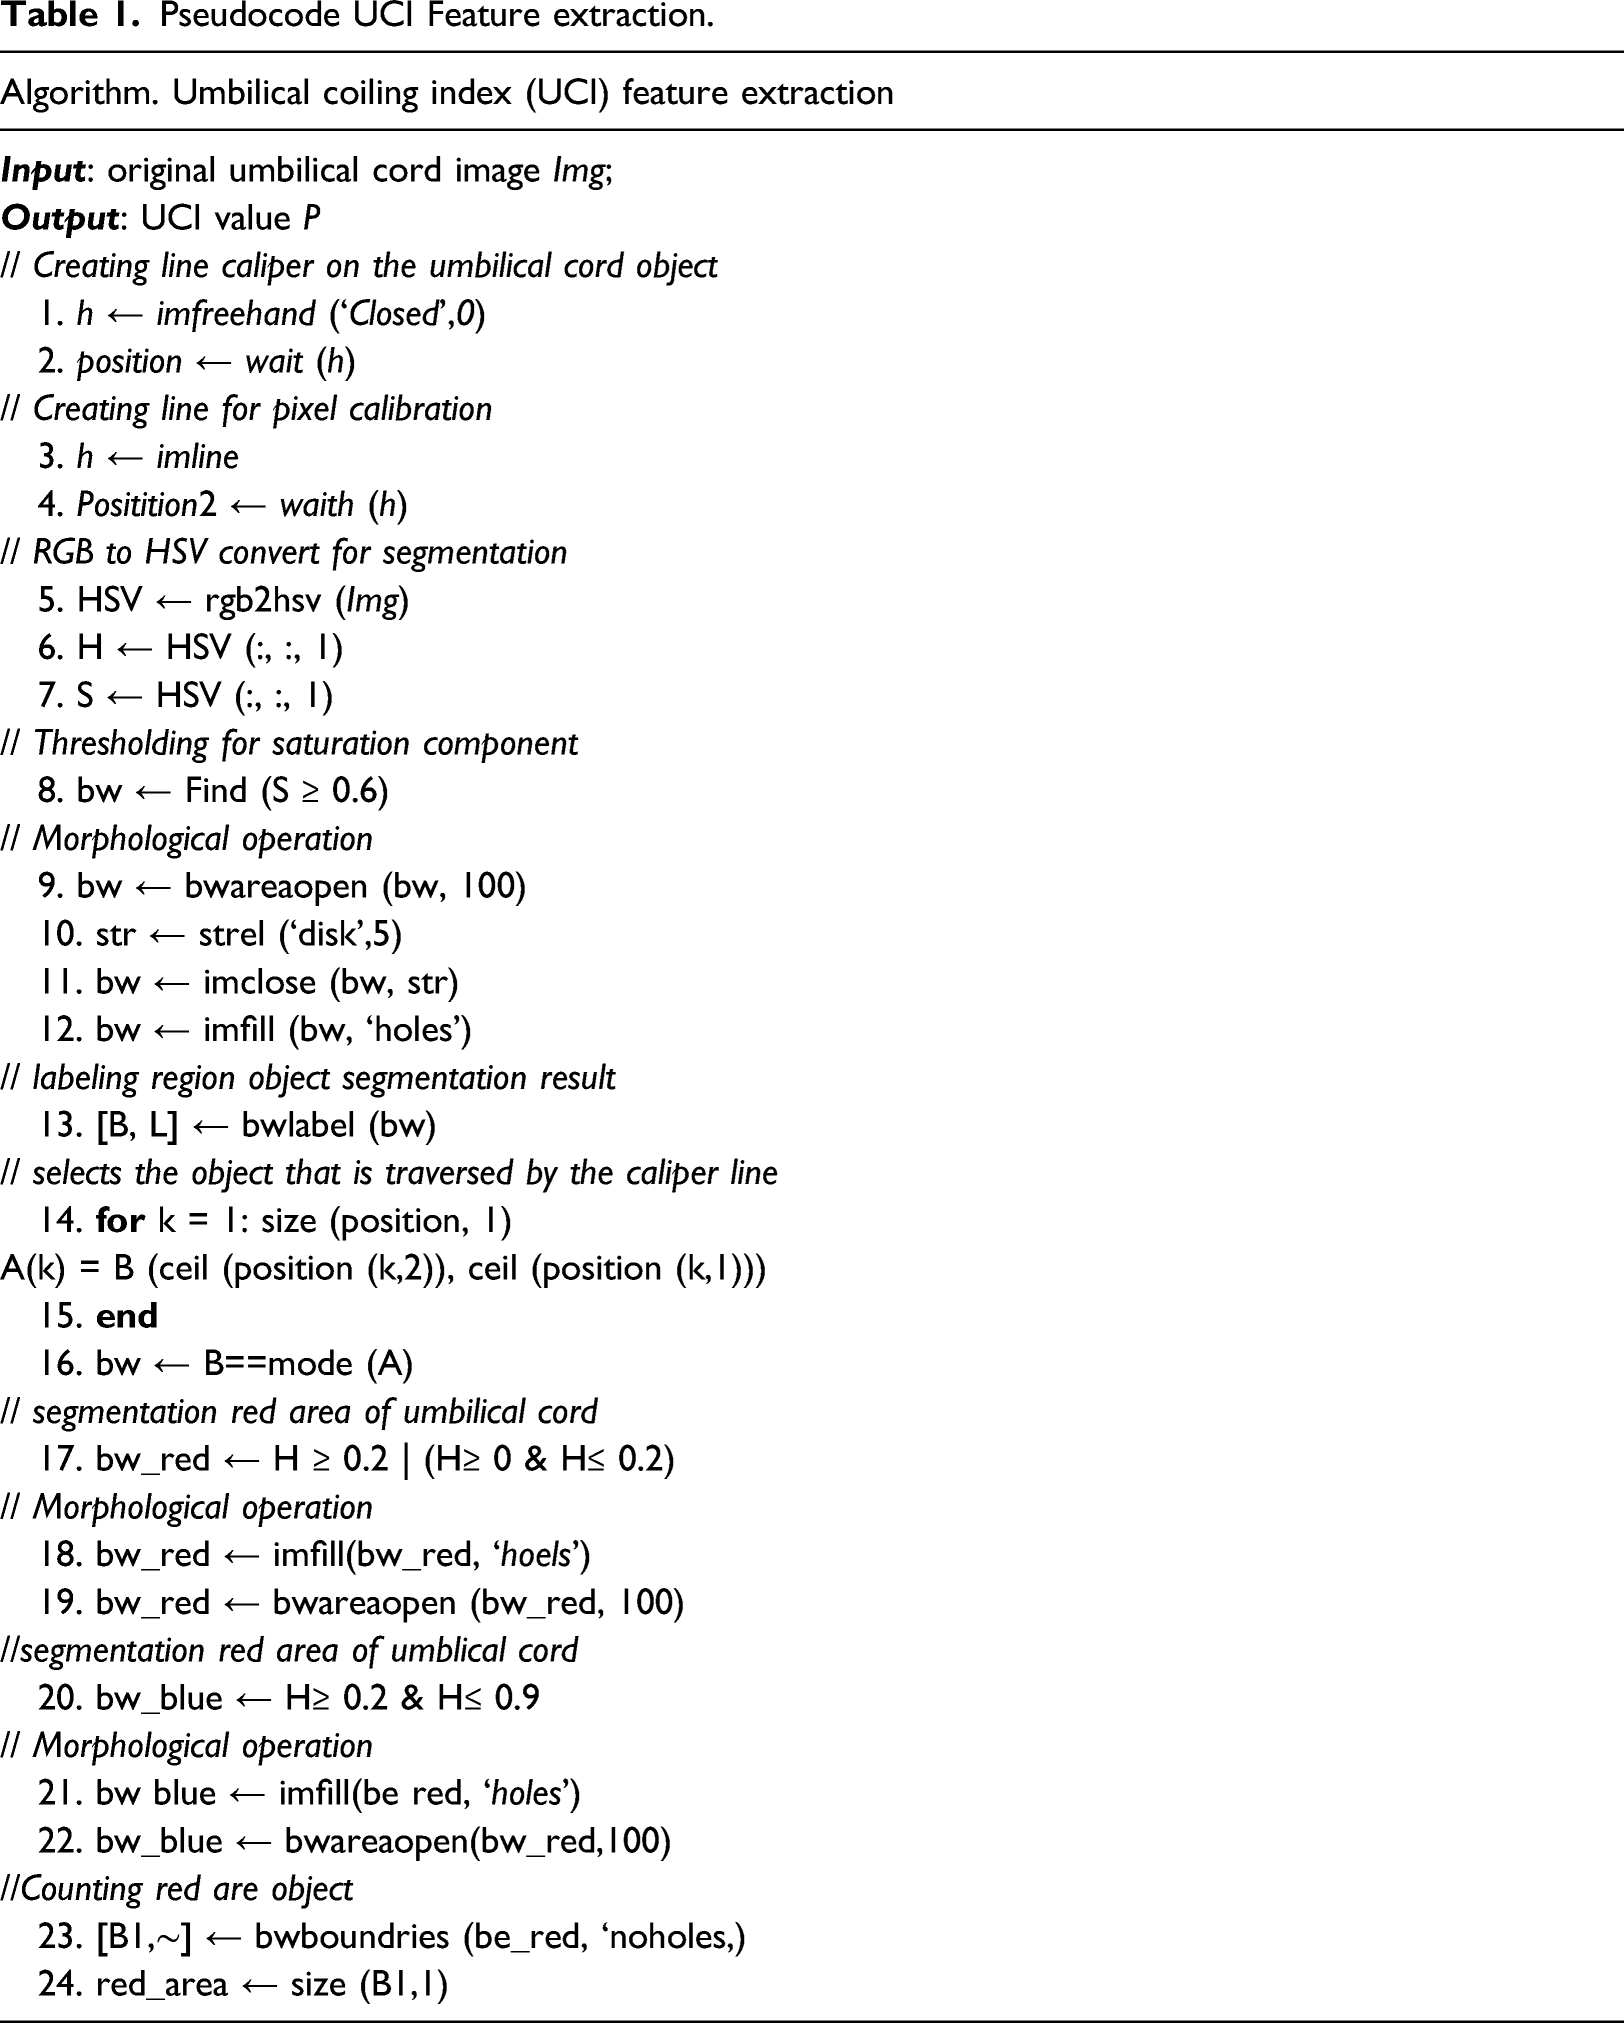
Meanwhile, the UCI values between 0.21 and 0.59 are included in the Normocoiled category. 2 Table 1 shows the pseudocode UCI feature extraction process proposed in this study. After the image input process, the first thing that needs to be performed is to determine the length of the umbilical cord object in the image by drawing a caliper line. This is drawn from the upper limit of the umbilical cord to the lower. The im-freehand function found in Matlab was used to determine the length and is shown in lines 1 and 2 of the Pseudocode. The image segmentation approach follows the caliper drawing process. This involves the thresholding method on the HSV image and is based on the saturation (S) component as depicted in lines 5 to 13.
Furthermore, the ROI of the object is determined based on the object traversed by the caliper line. This is carried out because the UCI analysis is also dependent on this procedure. To eliminate irrelevant small objects in the feature extraction process, morphological operations need to be performed.
The opening and closing operations are carried out based on the element structural size of 1000 and the Disk type. This is followed by selecting the fetal umbilical cord object. First, the labeling of each segmented object is carried out using the label function connected to elements in 2-D binary images (bwlabel), as shown in line 14. The next process is to select objects traversed by the caliper line as in lines 15 to 17. The row symbolizes the starting point of the caliper line, and column location coordinates in the image. Each pixel coordinate in the segmented image, namely, B traversed by the caliper line, is accommodated in variable A. The k value indicates the number of pixels that constitute the caliper line. Therefore, A(k) is the object in figure B, which contains the coordinates of the caliper stored in the variable’s position. Finally, the object transversed by the coil is selected using the mode function.
Subsequently, the number of pixels that constitute the length of the caliper line on the fetal umbilical cord object is counted. The pixel line length is obtained by calculating the Euclidean distance for each. The variable’s position stores the row and column coordinates of the pixel points that constitute the caliper line. Each pixel point is calculated using the Euclidean distance to the last column. Furthermore, all distances are summed up and stored in the variable n. However, this constitutes the number of pixels according to the caliper line length. The process of calibrating pixel values in centimeters (cm) is carried out using a reference point around the information area to the right of the ultrasound image. This is because taking pictures manually with a camera makes shooting distances and angles inconsistent or stable. This method makes each image have a different pixel size value consistent with the distance between the dots. The caliper line is symbolized by positioncal consisting of the coordinates of the positional starting (1,1) and ending points (2,2). This process is continuously repeated for each input; therefore, different values are obtained when the pixel units are calibrated in centimeters. The first calculation of the UCI value is carried out based on the number of coils in the umbilical cord. This is carried out by predetermining the number of blue (blue_area) and red objects (red_area) in the ROI.
One coiling of the cord consists of a pair of blue area and red area objects. To determine the number of red and blue objects, conducted by segmenting the substances that constitute the coil. These are segmented using the threshold method in the HSV color space. To get a blue object, the threshold value in the Hue channel needs to be greater than 0.2 and less than 0.9. Furthermore, the threshold value for the red object is a Hue value greater than 0.9 or 0 and less than 0.2. Figures 5(c) and (d) show umbilical artery and vein objects segmentation. Boundary detection is formed on each object using the bwboundaries function in Matlab to determine the number of objects detected as umbilical vein and artery. The number of objects is calculated using the size function. In Figure 7, it is detected that the number of umbilical veins and arteries is three each. It was therefore concluded that the number of coils is 3. However, when there is a difference in the number of objects detected, the number of coils becomes equivalent to the minimum number of veins and arteries. UCI feature extraction; (a). Original USG doppler image; (b). ROI segmentation result; (c). red_area segmentation result; (d). blue_area segmentation result; (e). Final result for UCI image and value.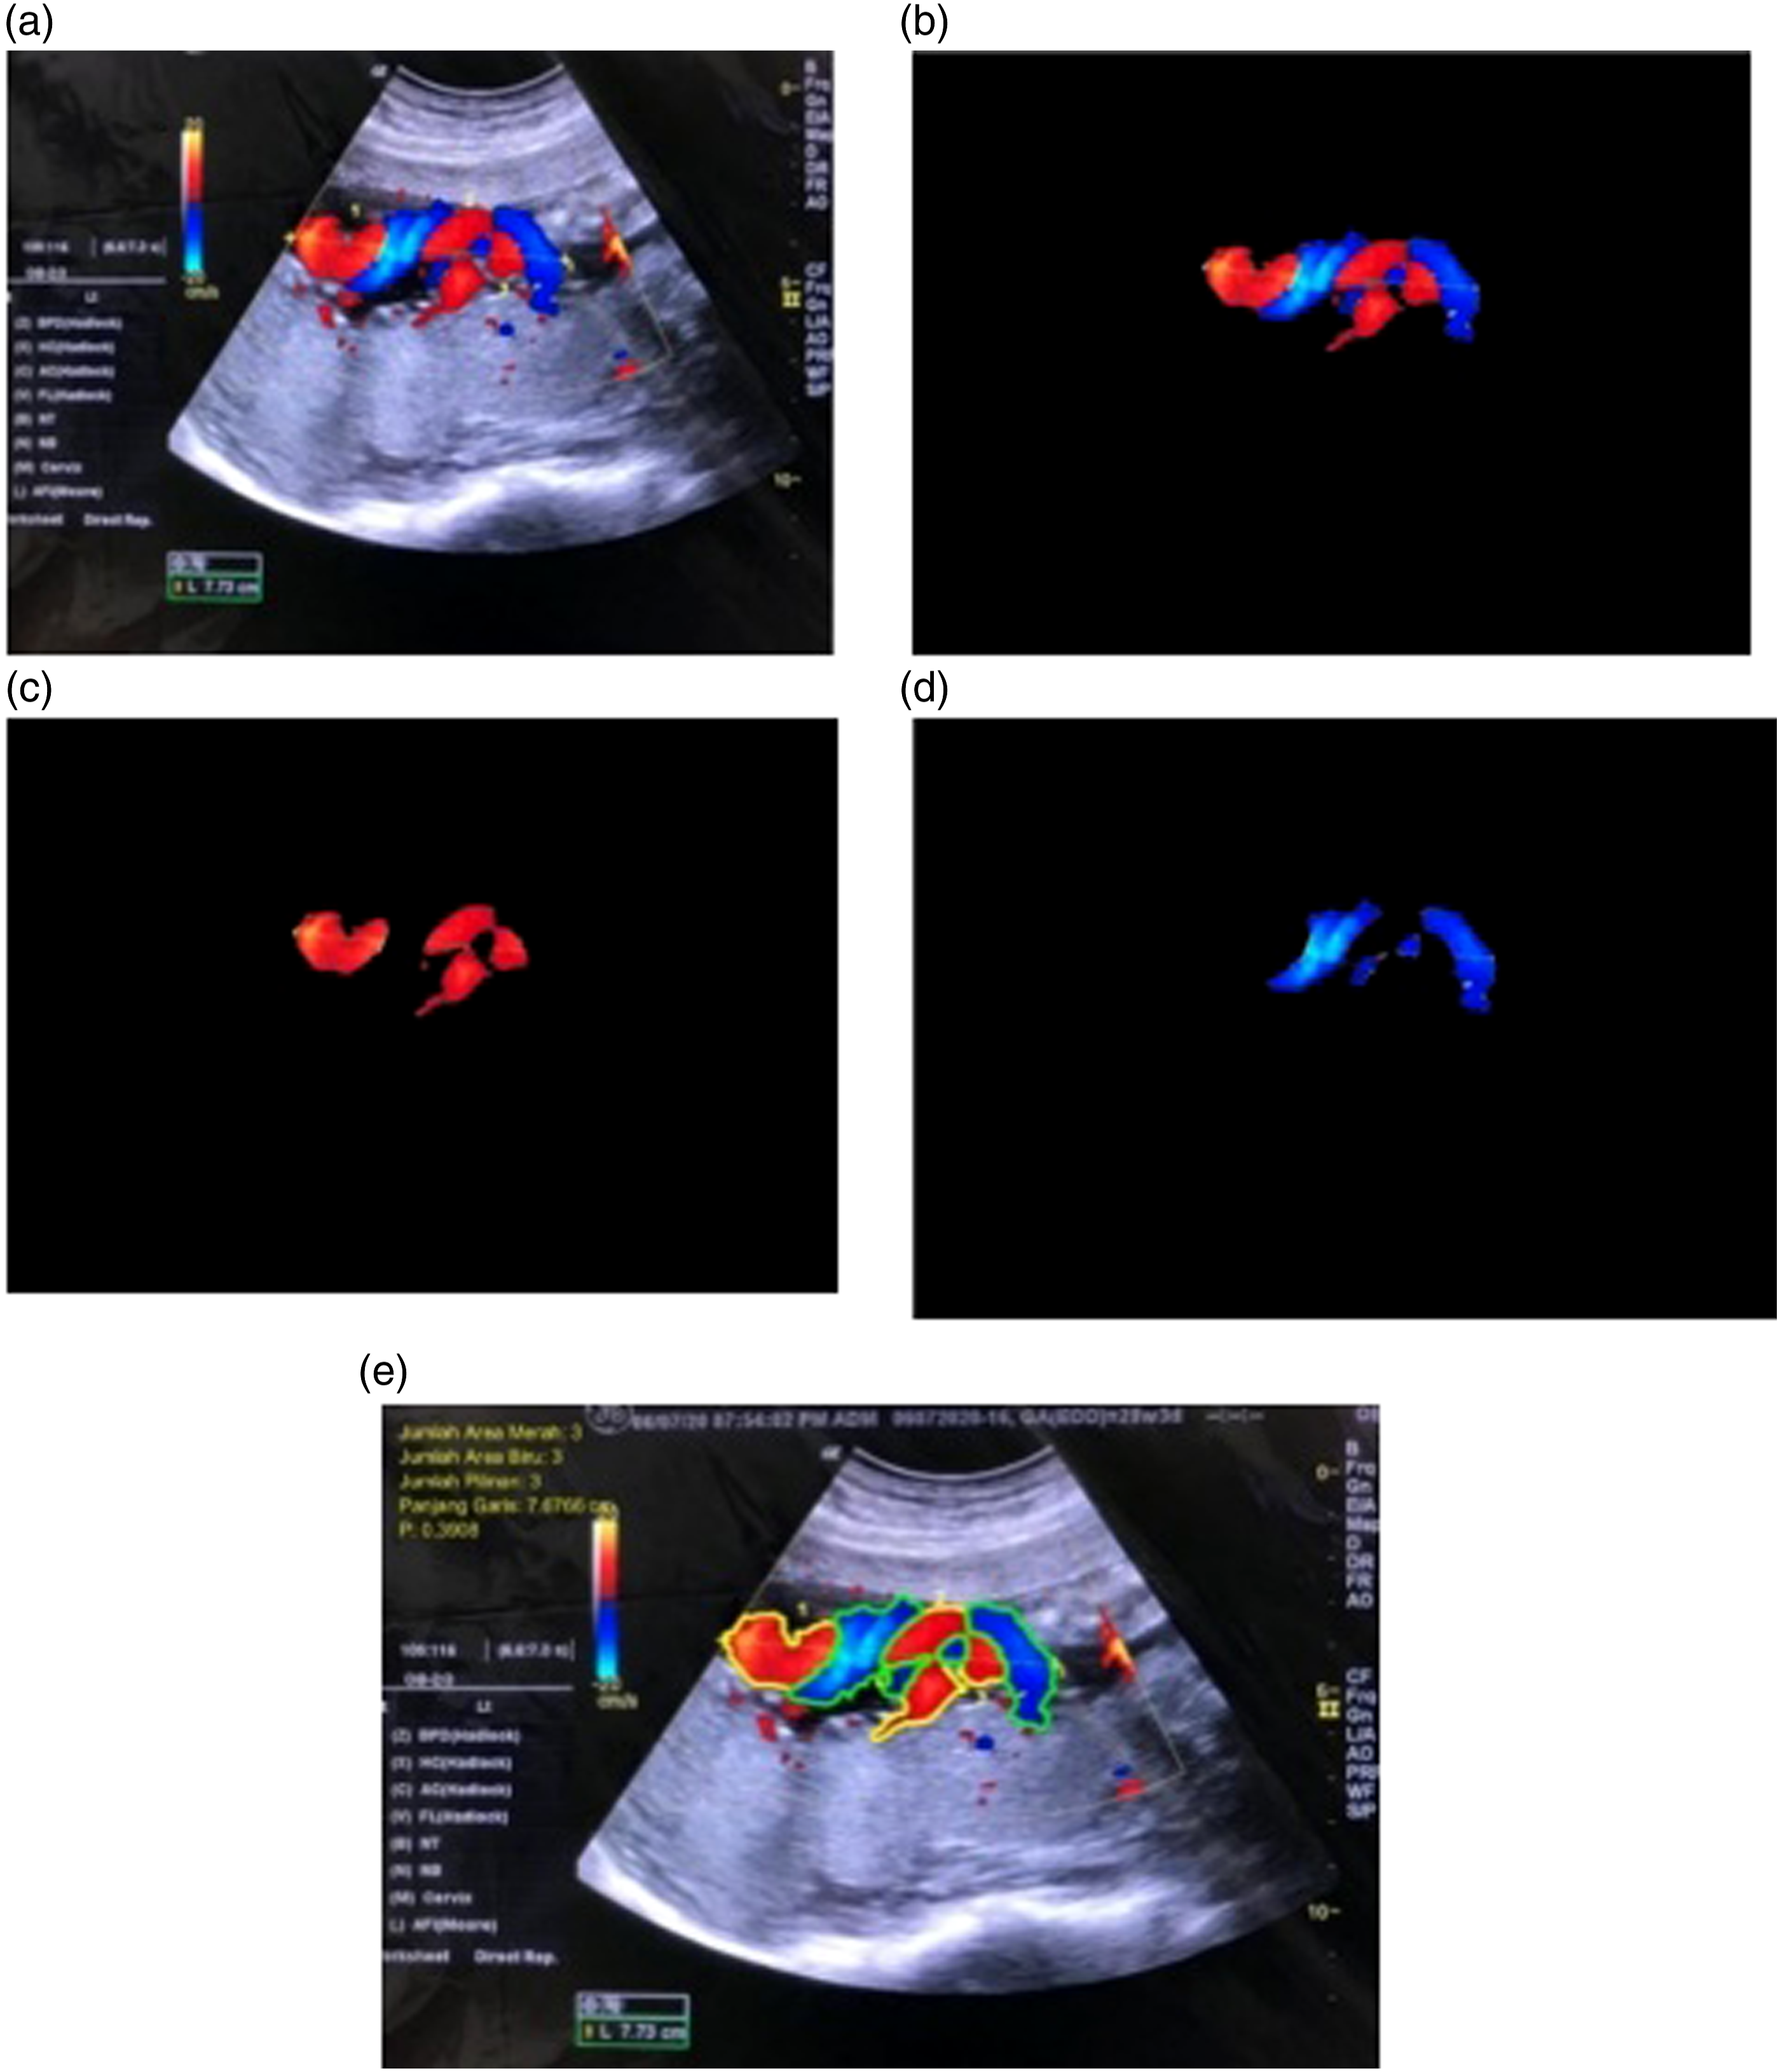
Synthetic Minority Oversampling Technique (SMOTE)
The SMOTE algorithm was first carried out by Chawla et al.
24
using oversampling and undersampling procedures in minority and majority classes. This algorithm was conducted by using several samples from the class and generating synthetic data from the k point to the nearest minority class. Oversampling is the process of adding new data to a class by resampling the minority. Conversely, undersampling reduces the data in a class till there is a balance. However, with the SMOTE oversampling approach, the amount of data in the minority class is added to the desired ratio. Therefore, the number of k-nearest neighbors randomly selected and commonly used is 5. The synthetic samples are created by calculating the distance between the selected feature vectors and their closest neighbors. Furthermore, random numbers between 0 and 1 were multiplied before being added to the previously selected feature vector. The flow chart of the SMOTE algorithm is shown in Figure 8. SMOTE algorithm workflow diagram.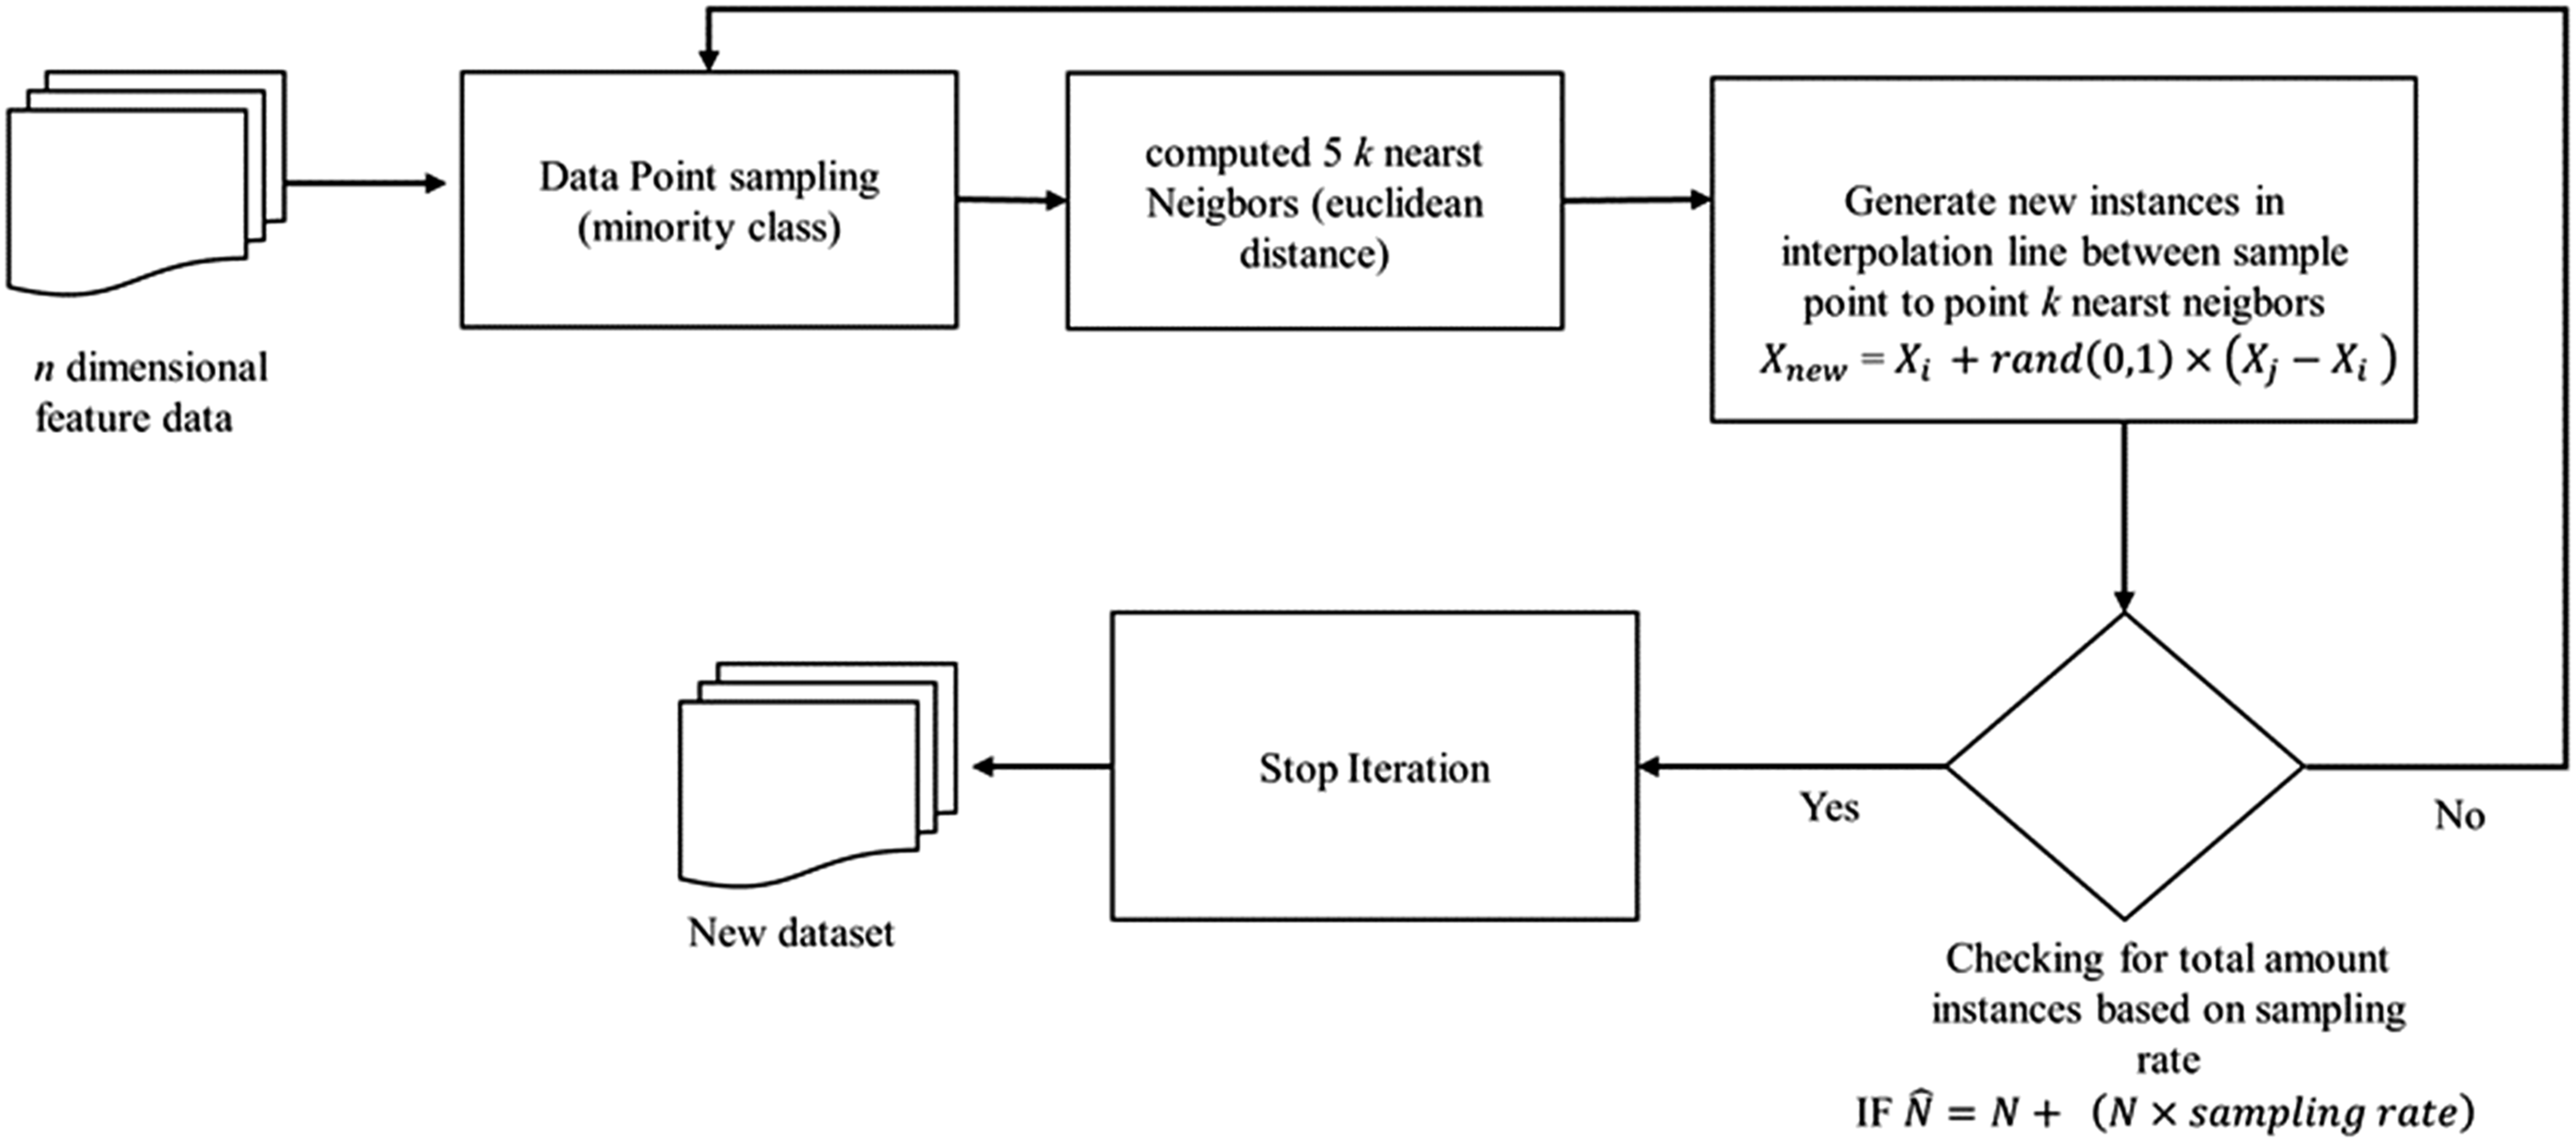
Result and Discussion
Experiment on Single Classifier
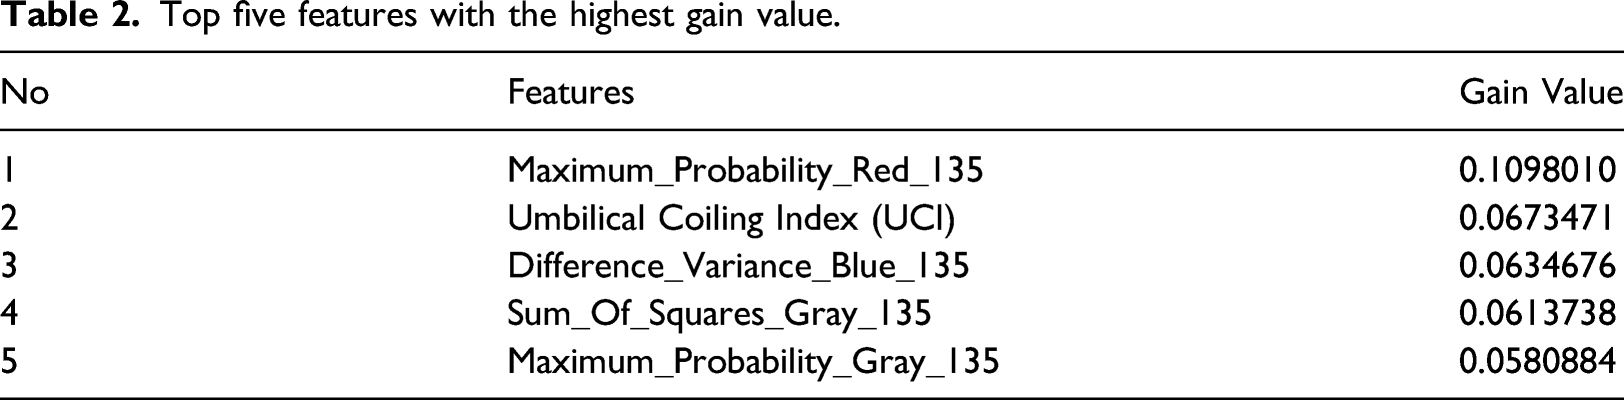
In this section, the umbilical cord feature extraction results serve as input in developing a predictive machine learning model. The total number of features generated from the extraction process is 353 consisting of 88 and 264 GLCM texture features for gray and RGB images. The first experiment involves the feature selection performance using the Information gain method. This experiment aims to determine the features that affect the performance of the machine learning model used. Information Gain is used to measure the relevance or influence of a feature on the results. This technique tends to reduce feature dimensions by measuring the entropy reduction before and after separation. In addition, 353 features are realized and ranked on the information gain value using the Sklearn Python library.
Top five features with the highest gain value.
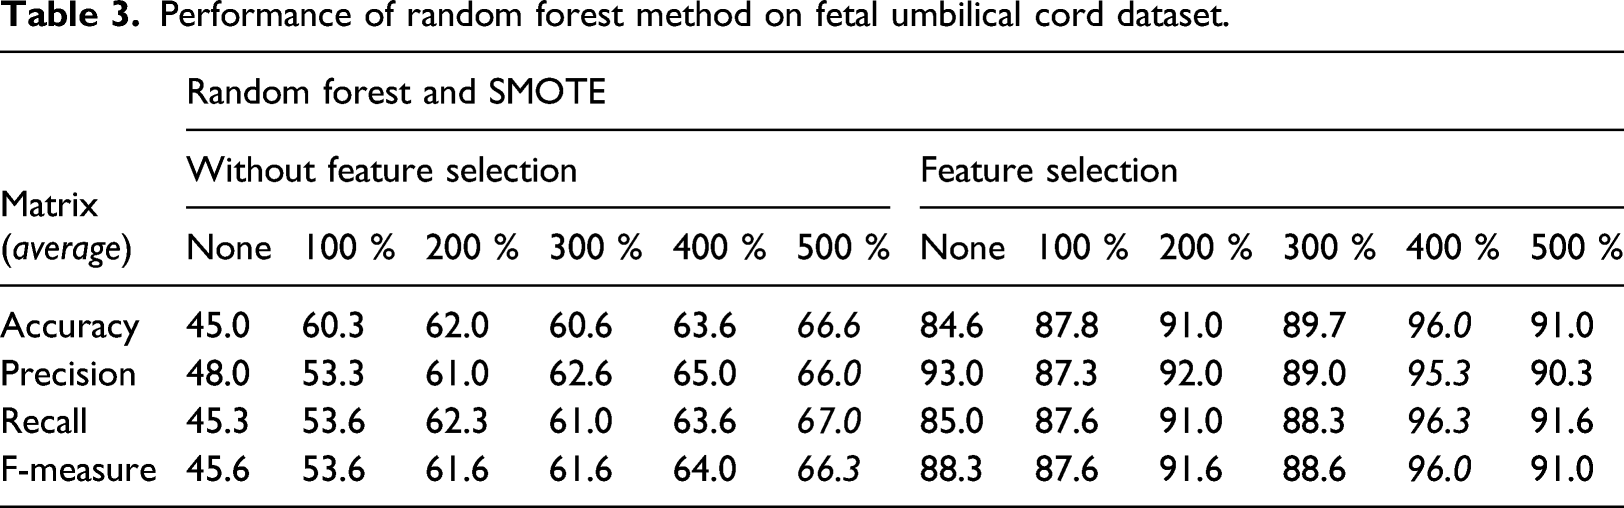
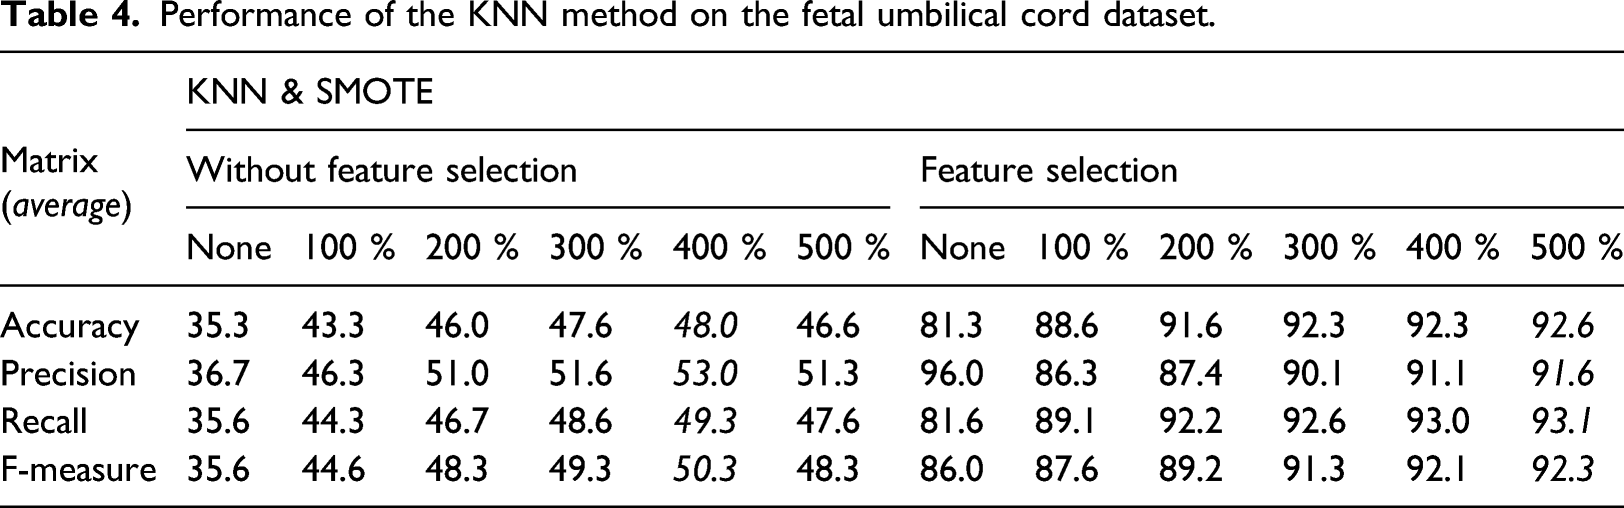
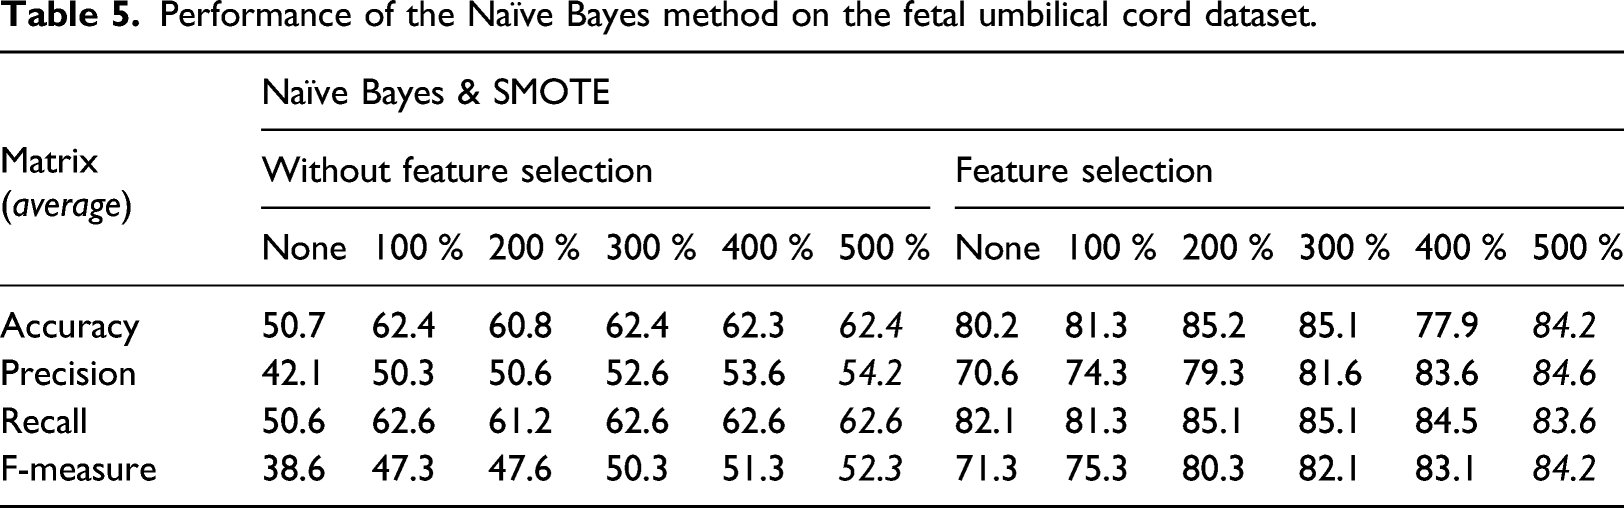
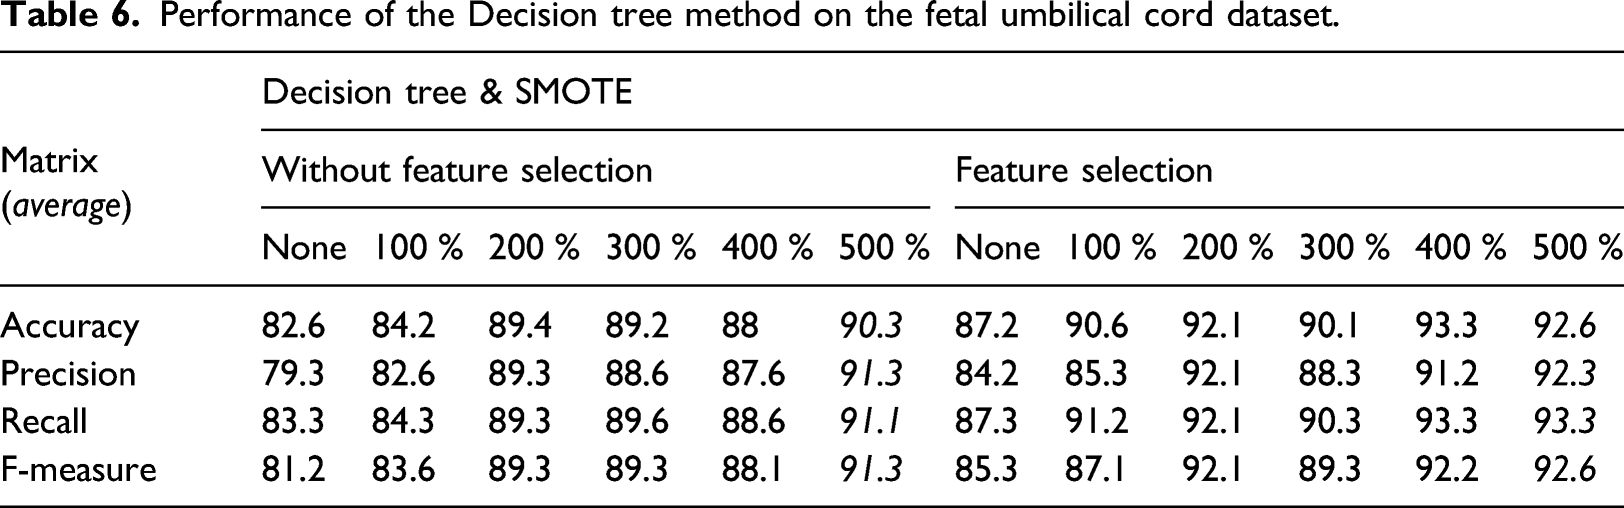
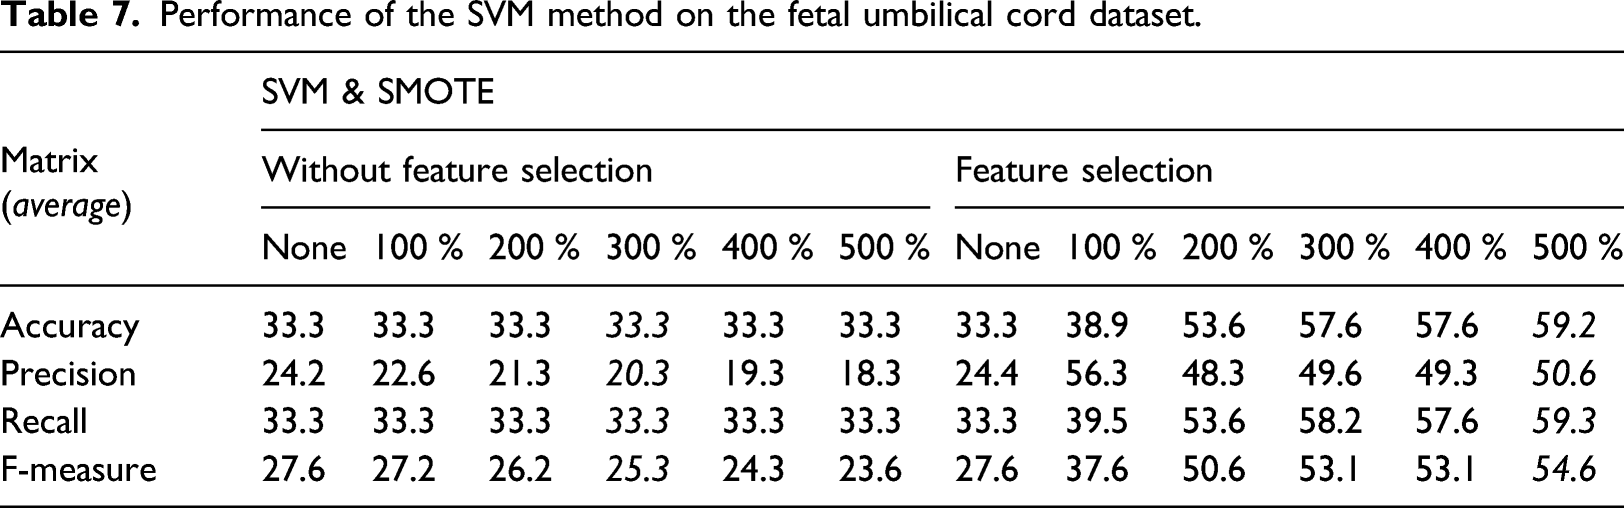
After the feature selection process, the dataset is oversampled on the minority class, namely, the Hypercoiling category. Sampling rate observations for the minority class were carried out based on relatively 100 to 500 percent. The test was carried out to determine the appropriate sampling rate value to be used for the umbilical cord dataset. SVM, Naïve Bayes, Random forest, KNN, Multilayer perceptron, and Decision tree (C.45) classification methods were observed by analyzing the accuracy, recall, precision, and F-measure performance. The Random forest parameters use a n_estimator of 10 criterion uses “entropy”, the maximum depth tree is unlimited, while the minimum split node is 2.
Performance of random forest method on fetal umbilical cord dataset.
Performance of the KNN method on the fetal umbilical cord dataset.
Performance of the Naïve Bayes method on the fetal umbilical cord dataset.
Performance of the Decision tree method on the fetal umbilical cord dataset.
Performance of the SVM method on the fetal umbilical cord dataset.
Experiment on Ensemble Multiclassifier Voting
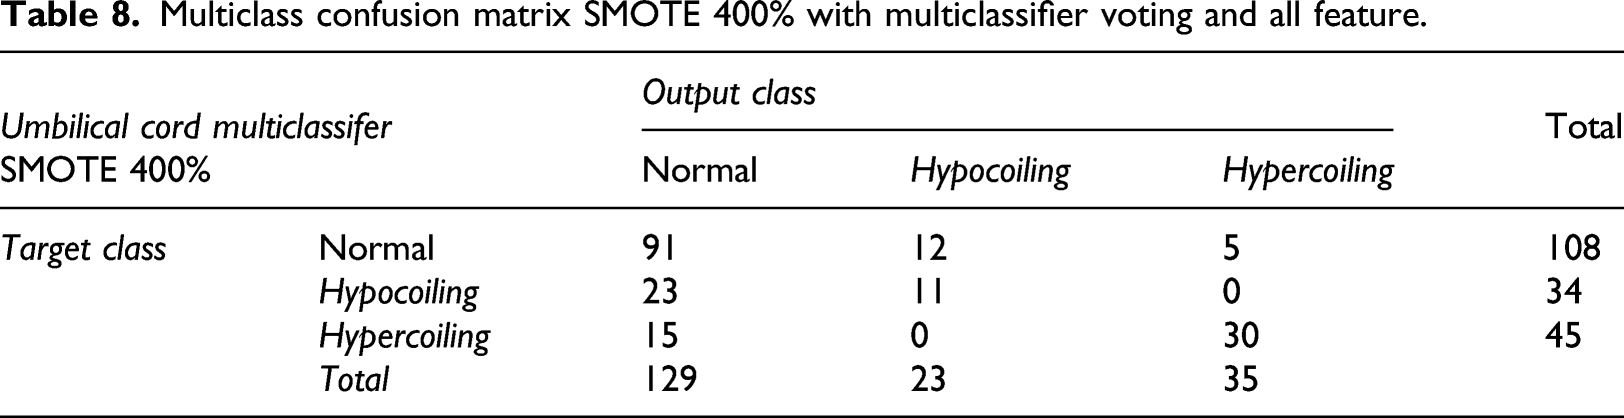
Multiclass confusion matrix SMOTE 400% with multiclassifier voting and all feature.
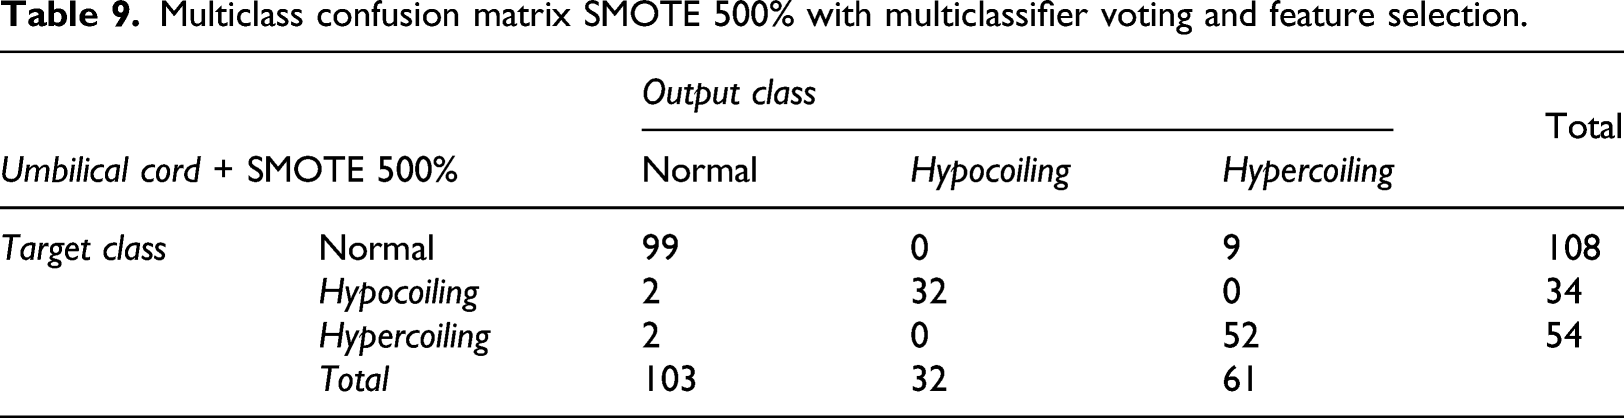
Multiclass confusion matrix SMOTE 500% with multiclassifier voting and feature selection.
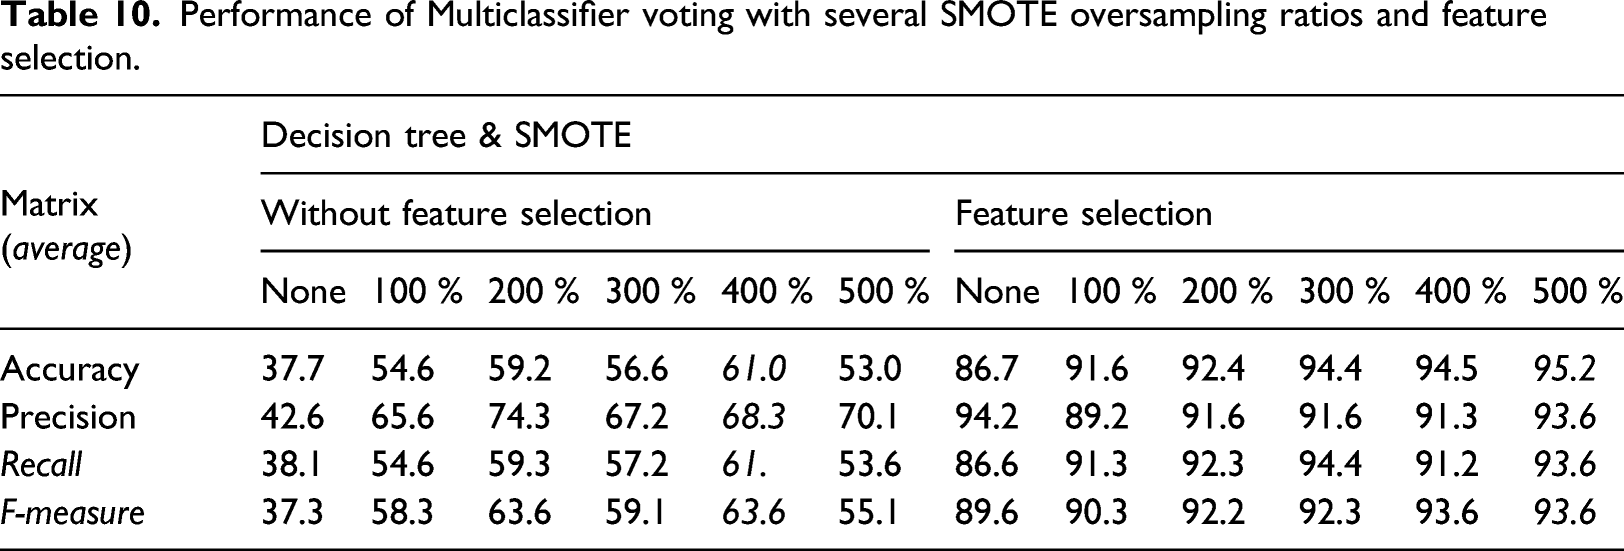
Performance of Multiclassifier voting with several SMOTE oversampling ratios and feature selection.
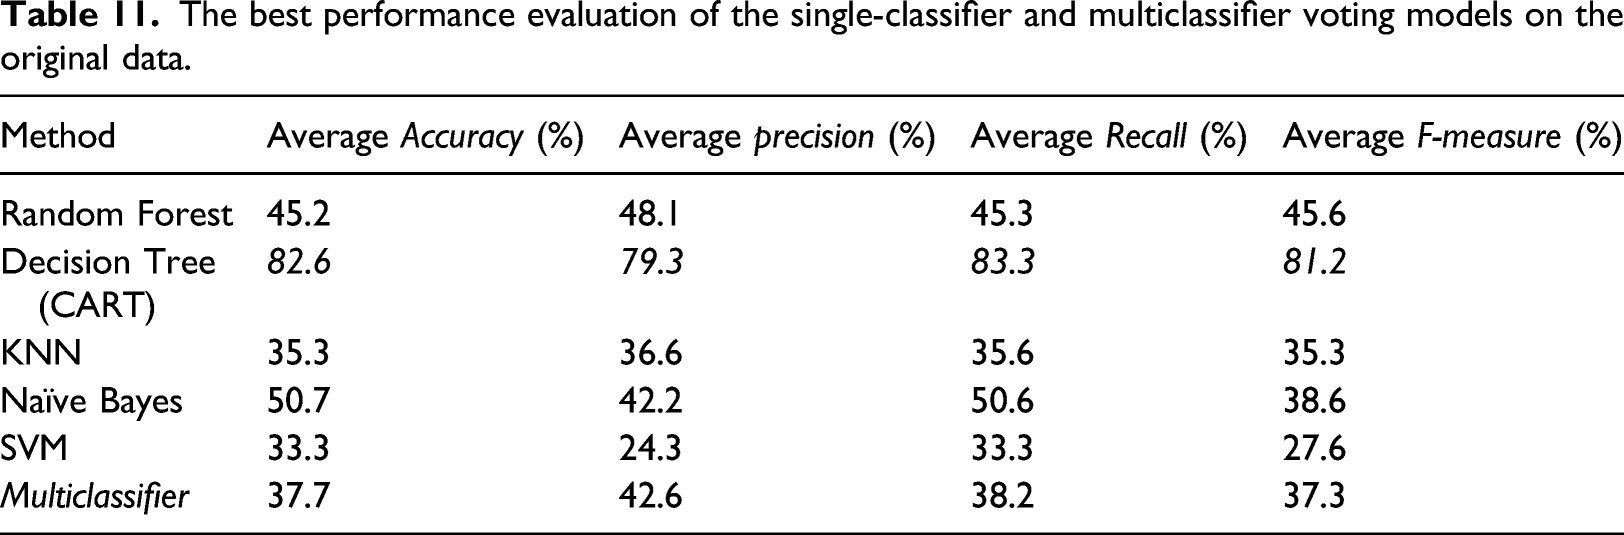
The best performance evaluation of the single-classifier and multiclassifier voting models on the original data.
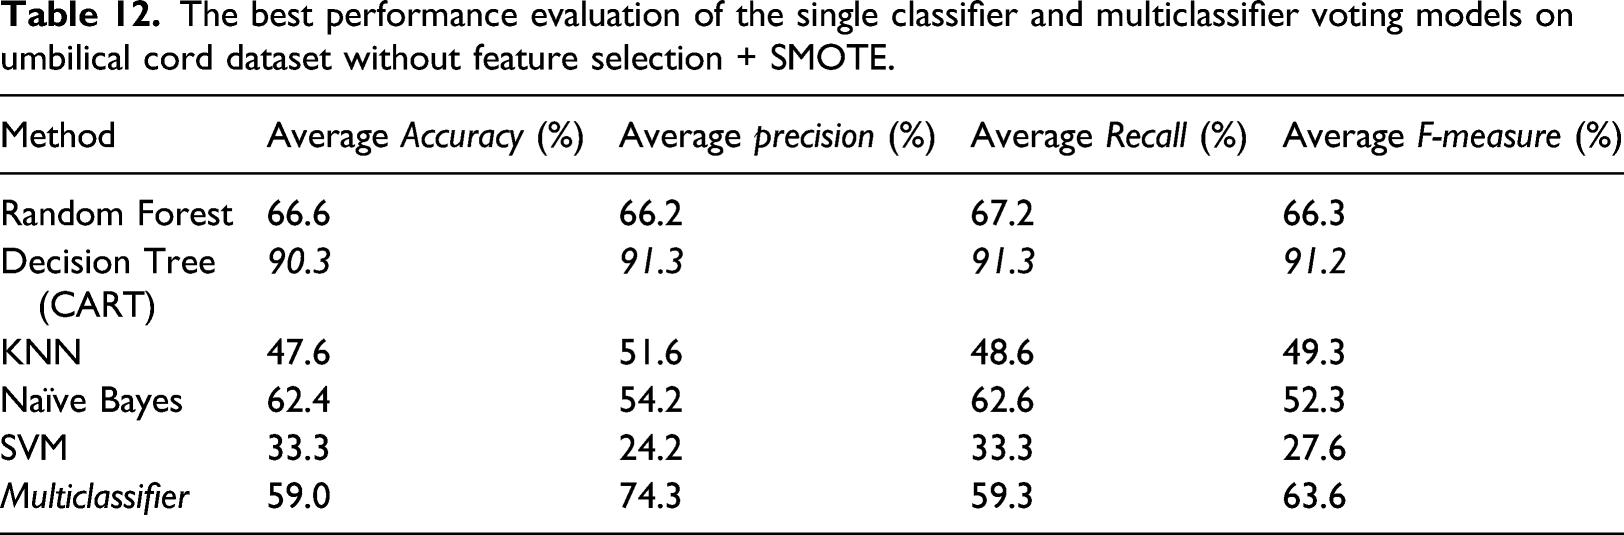
The best performance evaluation of the single classifier and multiclassifier voting models on umbilical cord dataset without feature selection + SMOTE.
Evaluation of the best performance of the single classifier and multiclassifier voting models on the umbilical cord dataset with feature selection + SMOTE.
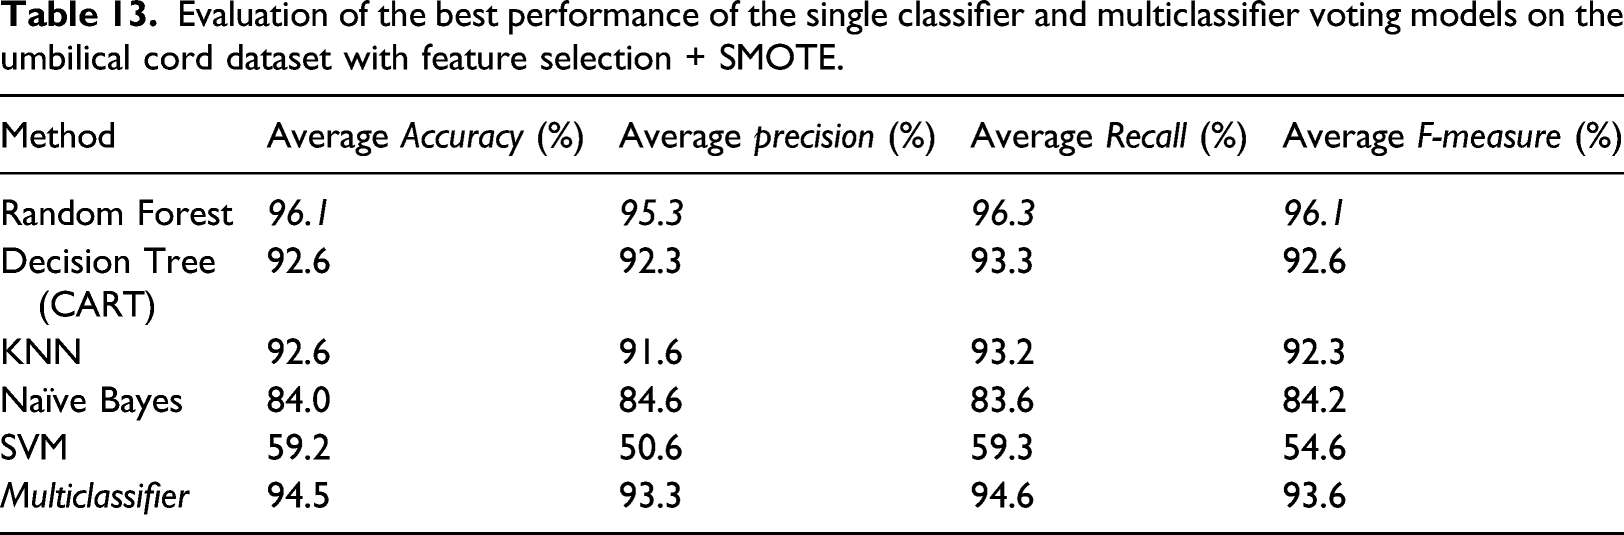
The final evaluation is based on the feature selection dataset and SMOTE oversampling. Moreover, the overall method shows improved performance compared to the previous experiment. However, the SVM method shows the reverse and does not affect the feature selection process or data oversampling. This is probably because the SVM algorithm is not suitable for large data sets. SVM does not perform very well when the data set has more noise, that is, target classes are overlapping. Methods involving an ensemble learning approach such as Random Forest and Multiclassifier voting showed the most significant improvement compared to other methods. These results indicate that the ensemble learning approach combined with data oversampling with the SMOTE method has succeeded in overcoming the imbalanced data problem in this study’s umbilical cord dataset.
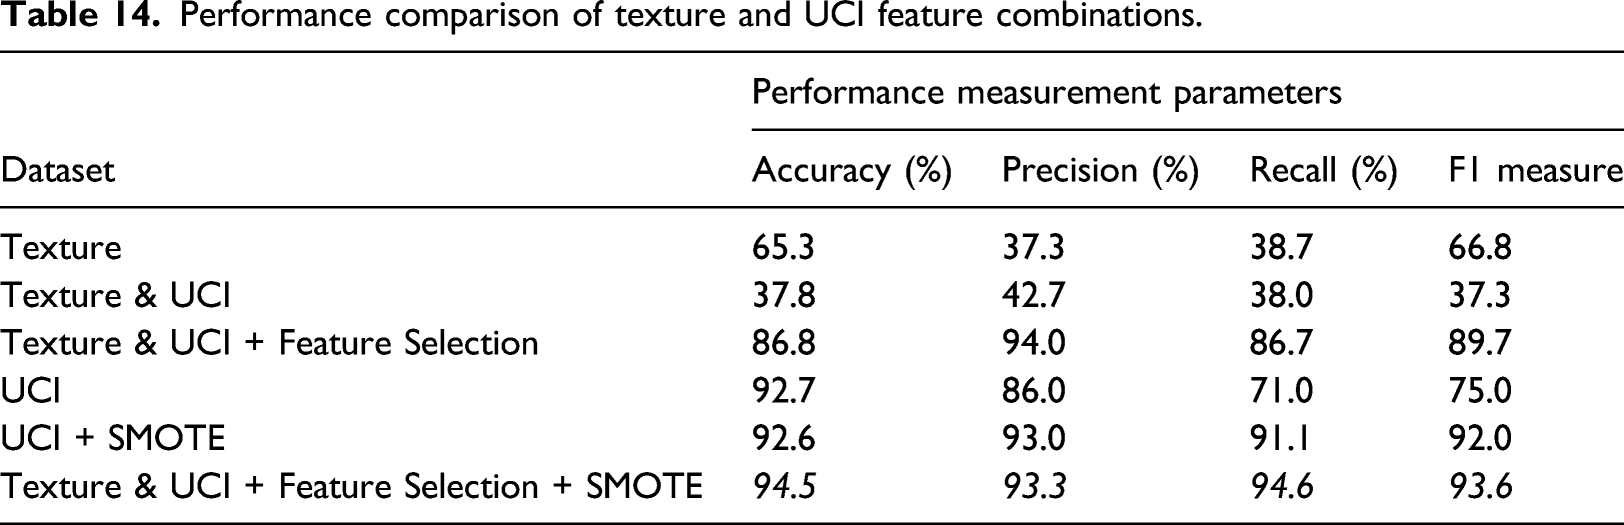
Evaluate the combination of features
Performance comparison of texture and UCI feature combinations.
Conclusion
This study proposes a machine learning model for fetal umbilical cord image classification based on 2-D ultrasound Doppler. Based on the experiment and test results, it is evident that the classification model in recognizing feature patterns with high dimensions was unable to produce a satisfactory performance. However, after the additional feature selection process and data oversampling, the model performance for each classification method showed a significant increase in performance. Based on data testing carried out both before and after feature selection and data oversampling, methods with ensemble learning approaches such as Random Forest and Multiclassifier voting have been proven to improve the classification results of the fetal umbilical cord. These two methods show the best classification results, including Random Forest, which realized an average accuracy, precision, recall, and F-measure of 96%, 95.3%, 96.3%, and 96%.
Furthermore, the Multiclassifier voting method achieved an average accuracy, precision, recall, and F-measure of 94.5%, 93.3%, 94.6%, and 93.6%, respectively. The results obtained show that the combination of UCI and GLCM features can provide very satisfactory performance. In the future, the proposed model in this study can be used as a reference for making artificial intelligence-based ultrasound machine prototypes so that they can provide supporting information to obstetricians when diagnosing umbilical cords that require prompt and appropriate medical actions.
Footnotes
Acknowledgements
The author would like to thank the Director of Research and Community Service (DPRM) Indonesia for helping with funding this research through the funding of the 2021 Doctoral Dissertation Research scheme.
Declaration of conflicting interests
The author(s) declared no potential conflicts of interest with respect to the research, authorship, and/or publication of this article.
Funding
The author(s) disclosed receipt of the following financial support for the research, authorship, and/or publication of this article: Director of Research and Community Service (DPRM) Indonesia through the 2021 Doctoral Dissertation Research scheme.