
Abstract
This work aimed to study the effect of confinement on weight and lifestyle using the Wakamola chatbot to collect data from 739 adults divided into two groups (341 case-control, 398 confinement). Nutrition score (0–100 scale) improved for men (medians 81.77–82.29, p
Keywords
Introduction
On March 11th, 2020, the WHO declared the outbreak of the coronavirus (COVID-19) pandemic. 1 COVID-19 is caused by the coronavirus known as SARS-CoV-2 (severe acute respiratory syndrome coronavirus 2). 2 The first cases of the disease were detected in Wuhan, China, in late December 2019. 3 and it soon expanded around the world. Until May 19th, 2020, the WHO reported 4,425,485 confirmed cases worldwide, including 302,059 deaths (May 16th, 2020). 4
In response to this health crisis, the Spanish government declared a national emergency from March 15th, which led to the confinement of all the population that carried out non-essential activities to reduce the spread of the disease and the danger of a collapse of the healthcare system.
Recent studies highlighted the consequences of the confinement on people’s lifestyle, including reduced physical activity,5–7 unhealthy diet,8,9 or change to a healthier diet,5,9,10 a negative psychological effect, including post-traumatic stress symptoms, confusion, anger, 11 anxiety, depression, and sleep disorder.12–16 It also caused changes in people’s weight5,10,17–20 and had some long-term effects on cardiovascular disease, mainly related to an unhealthy lifestyle and anxiety. 8
In this context, telemedicine, mobile health, and other digital health interventions became highly relevant in managing the current global health emergency.21,22 Telehealth provides remote assessment and health care to people with COVID-19, even hospital patients. For those not infected, telehealth provides access to routine care without the risk of exposure in a crowded hospital or medical centre, 23 especially those with a higher risk of being affected (e.g. the obese, the elderly with pre-existing medical conditions such as asthma, chronic kidney disease, chronic lung disease, diabetes, those over 65, etc.24,25).
Chatbots have participated in the fight against COVID-19 26 as part of digital health, for example, the WHO launched a messaging service on WhatsApp and Facebook to keep people safe from coronavirus 27 providing up-to-date information on the pandemic, including symptoms and protective measures. It also offers real-time data to help government decision-makers. Apple updated the Siri voice chatbot to help people diagnose COVID-19 symptoms. 28 The Kanagawa Prefecture (Japan’s second-largest prefecture after Tokyo, with a population of about 9 million) launched an individualized support program using a LINE app chatbot. Data from this app are also used to study the mental health of family, friends, and co-workers of COVID-19 patients. 29 Rudini 30 also has a chatbot to diagnose COVID-19 symptoms.
Early studies pointed to obesity as a major COVID-19 factor, 25 while the existing evidence highlights the fact that diet profoundly affects people’s immune system and disease susceptibility. 31 Chatbots have been used to study the obesity epidemic 32 as well as promoting healthy habits to prevent weight gain in the adult population 33 and children. 32 Recently Zhang et al. 34 published a brief literature review on the use of chatbots in promoting physical activity and a healthy diet. The study concluded that there was a need for more interdisciplinary work to continue developing AI techniques to improve chatbot’s relational and persuasive capacities to change physical activity and diet behaviors with strong ethical principles. During the pandemic and mobility restrictions, these systems could become more relevant due to the difficulties of accessing face-to-face professional guidance and control.
In December 2019, the university involved in the study launched the Wakamola chatbot to assess the risk of overweight and obesity by collecting data on socio-demographic variables, eating habits, and physical activity. This chatbot calculates the user’s Body Mass Index (BMI) and scores related to overall health, diet, and physical activity. It also collects sitting and sleeping hours and creates a social network connecting users.
This paper analyses the data collected by Wakamola from a university community during a normal (case-control) and the pandemic confinement to study its effect on weight, eating habits, physical activity, and time spent sitting and sleeping.
Materials and methods
Ethics
This study was approved by the Ethical Committee of the Universitat Politècnica de València (UPV, Ethical Code: P7_12_11_2018).
Hypothesis
We hypothesised that confinement could lead to changes in eating habits, physical activity, and sitting and sleeping time.
Selection of participants and study design
A cross-sectional study based on a self-report questionnaire was carried out to study changes due to confinement. The questionnaire was implemented in the Wakamola Telegram chatbot. The study involved participants from a Spanish university (students, teachers, and staff). Participation in the study was completely free and voluntary. All the user’s data were anonymous and no personal identification data was collected. The university population involved consisted of 31,310 people, of which 26,483 were students, 1897 administrative staff, and 1930 teaching and research staff. 35
The participants were invited to join the study by two institutional emails. The first email was sent on October 17th, 2019, before the pandemic (case-control). The second was launched on April 21st (confinement). Both emails included a brief description of the study and a link to Wakamola in Telegram.
We included all the participants 18 years and older (Adult, Older Adult), and all the sexes that completed the questionnaire (See Figure 1).
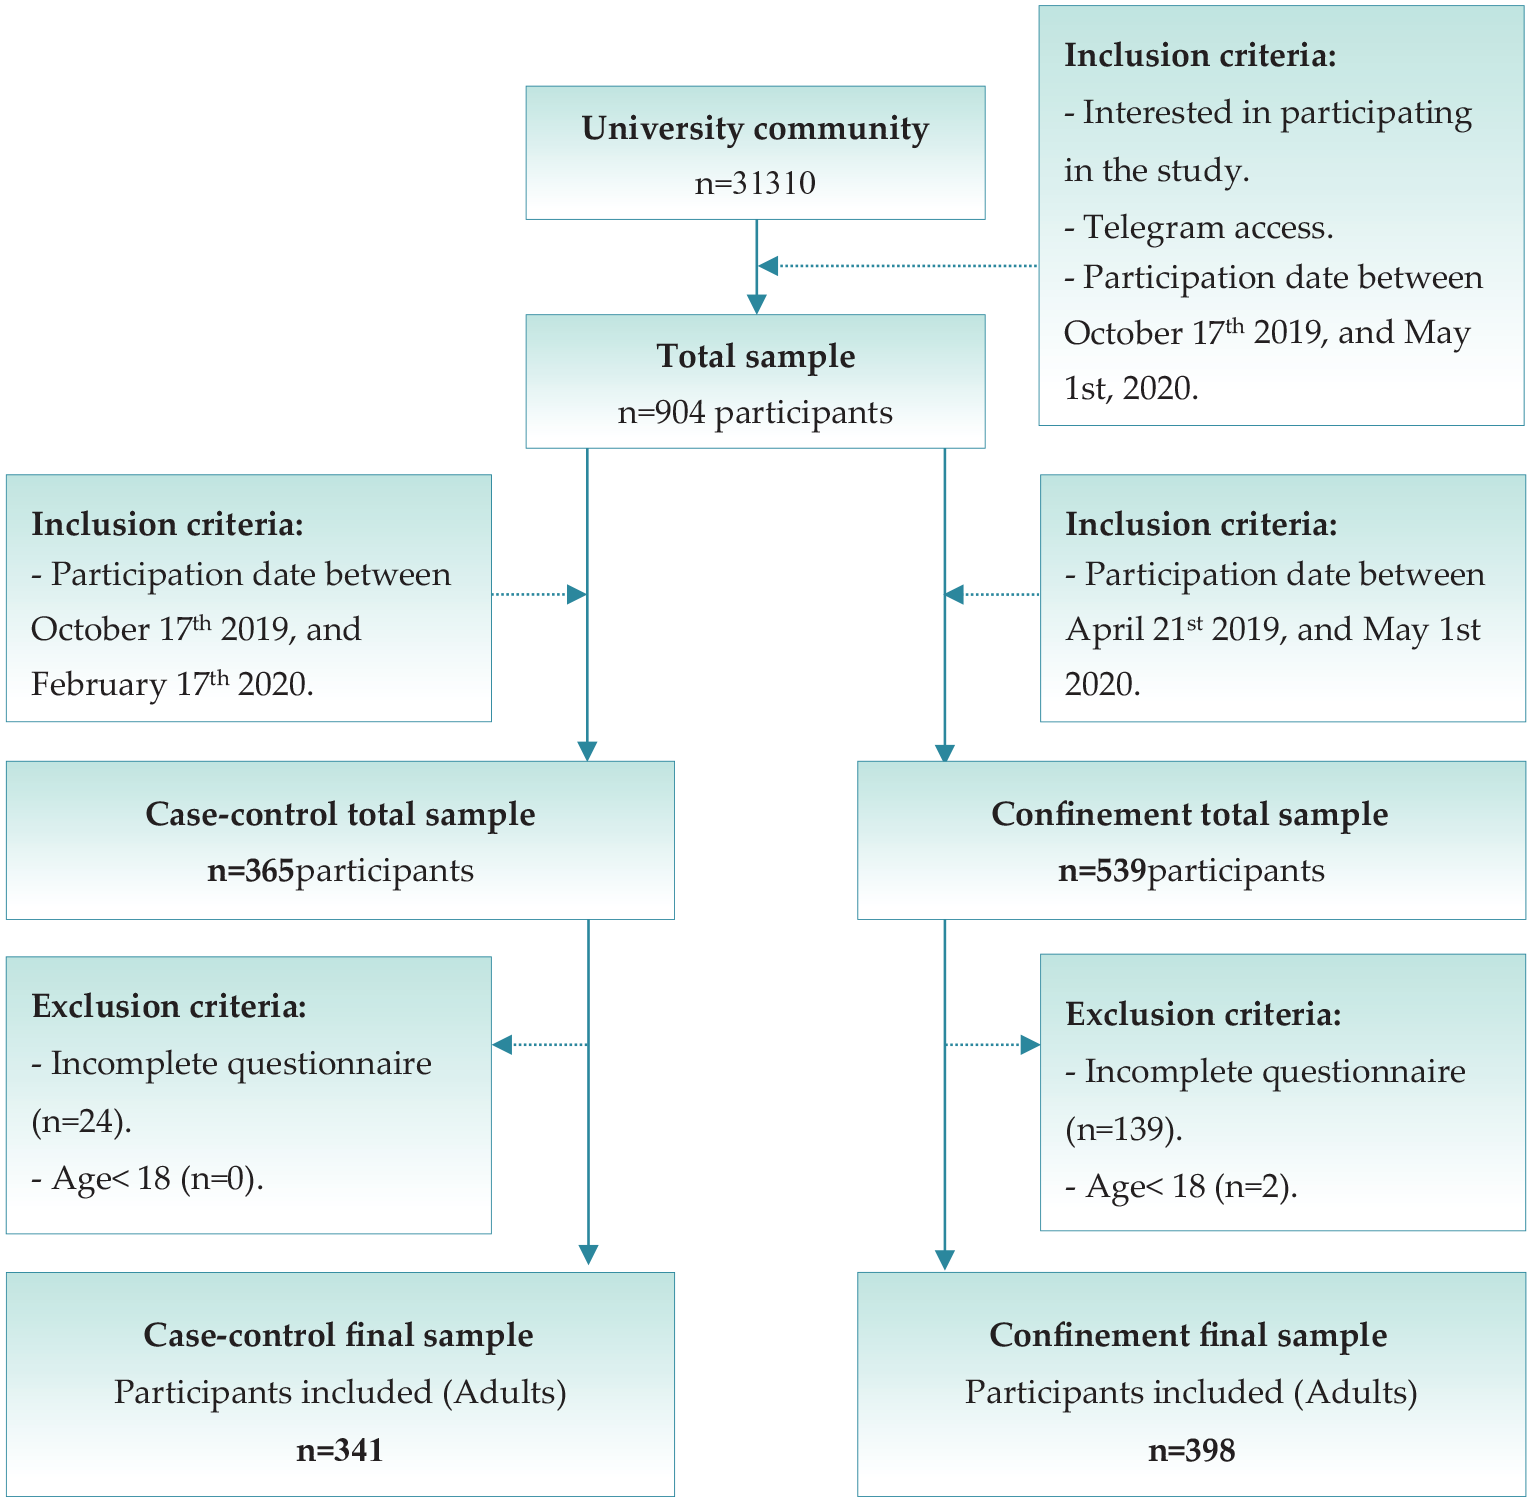
Inclusion and exclusion criteria flow chart.
Instruments and variables
Wakamola (available in Spanish, English, and Catalan) was designed under a user-centred approach in Telegram (Figure 2) to identify risk factors associated with obesity and overweight. The chatbot asks questions on diet, physical activity, the time spent sitting and sleeping, potential diseases, socio-demographic variables, and social network. The questions are organised into four sections: Personal, Diet, Physical Activity, and social network. 36
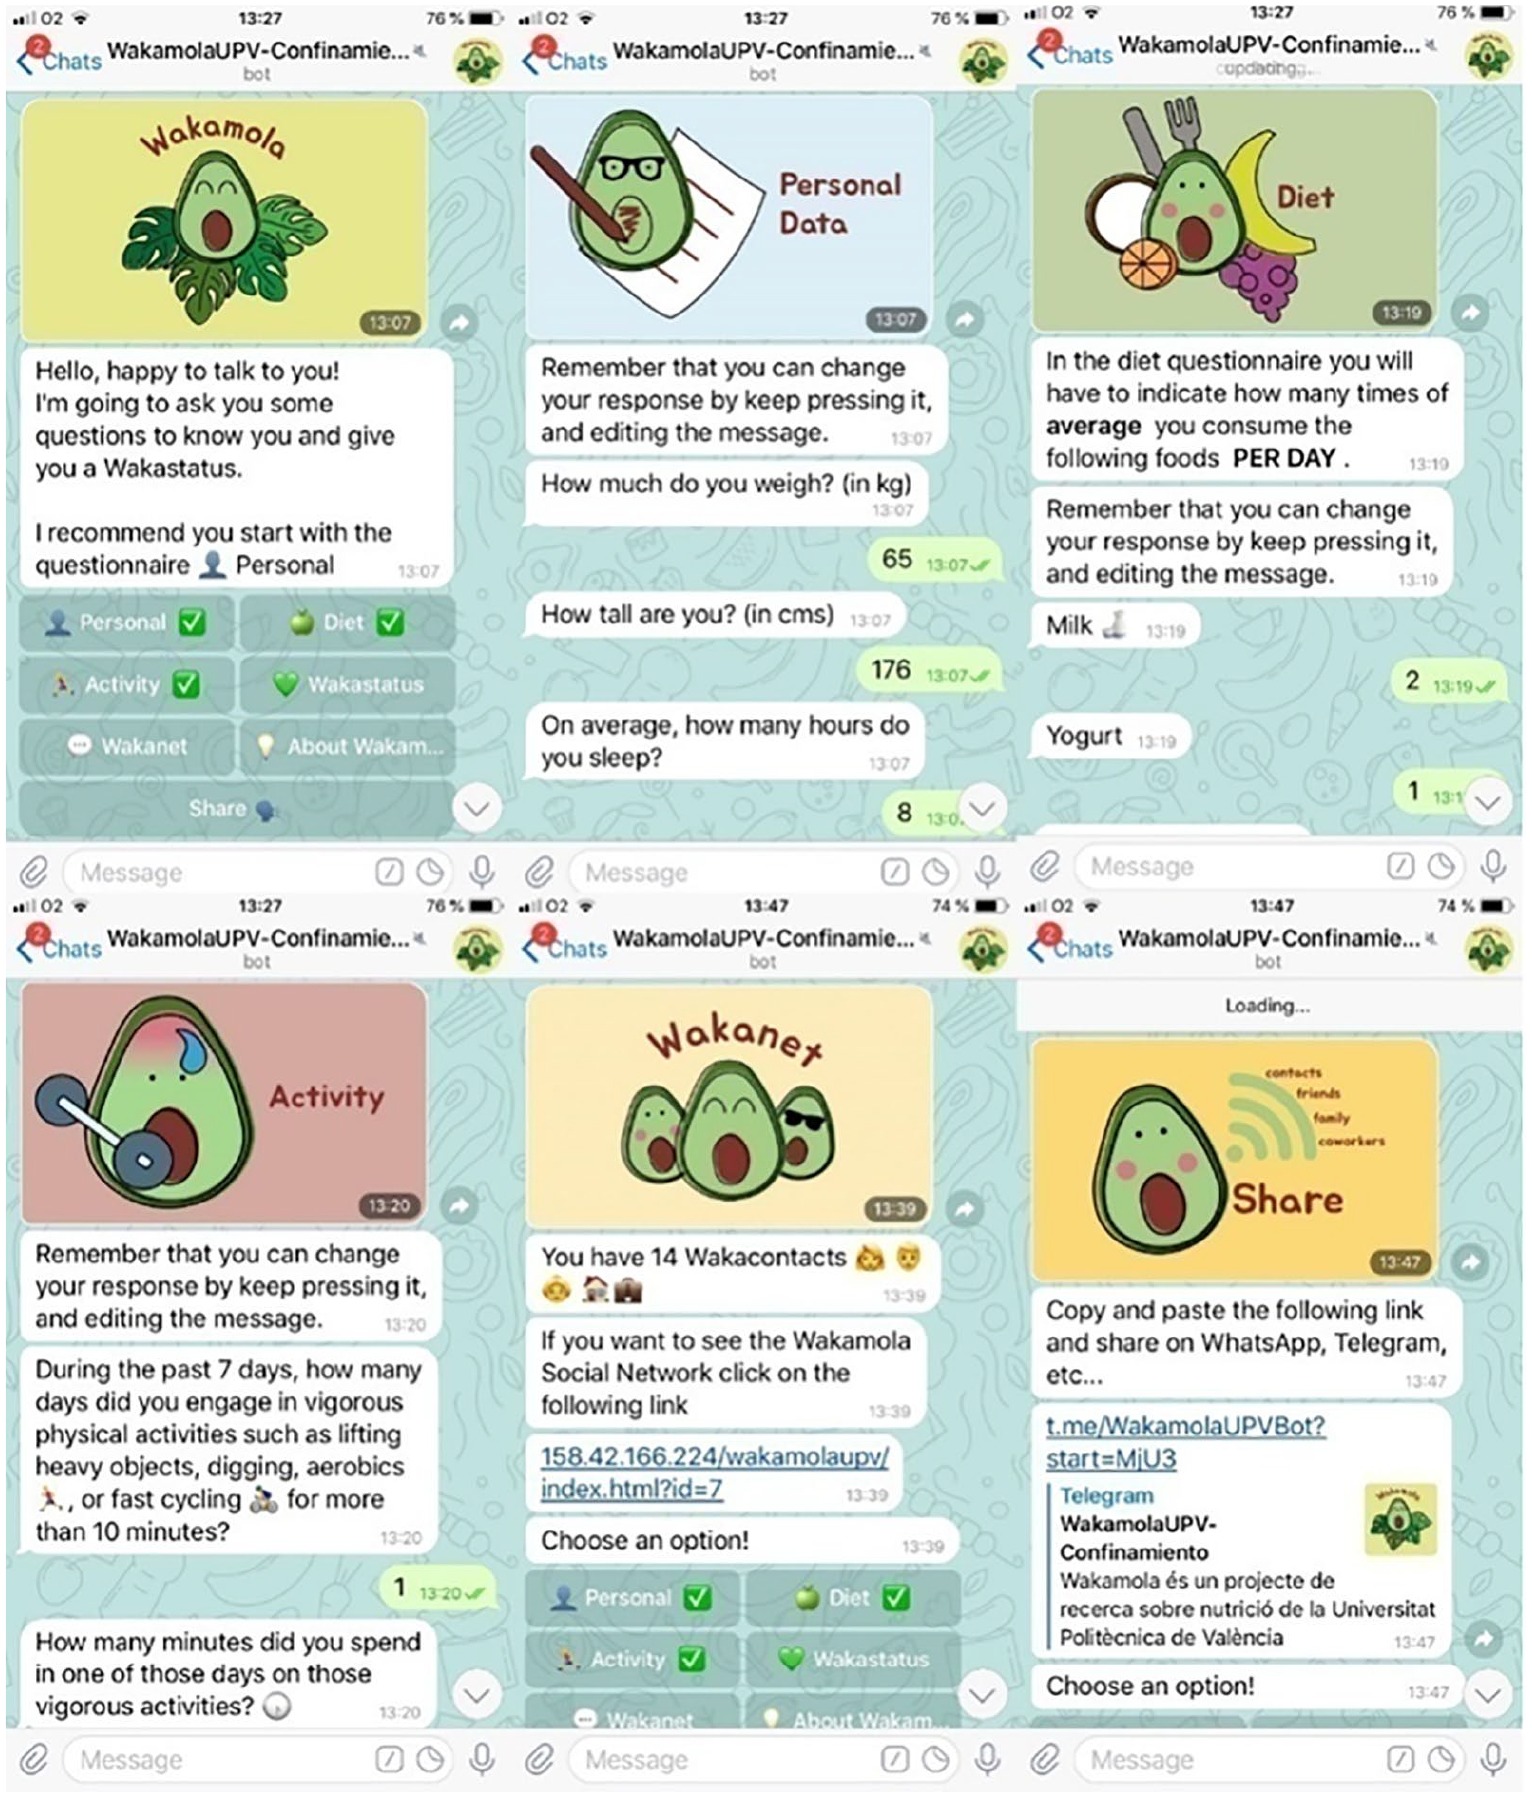
Wakamola chatbot screenshots from diet, activity, network, and sharing section.
The “Personal” section comprises 16 questions on weight, height, gender, age, level of education, marital status, how many people are at home, main activity (i.e. study/work), zip code, hours of sleep cigarettes smoked, a diagnosis of hypertension, diabetes, high cholesterol, or cardiovascular disease. Clinicians have defined these questions for further data analysis regarding overweight and obesity factors. From the weight and height data collected, the Body Mass Index (BMI) score is calculated, assigning 100 points to Normal weight (18.5–24.9 kg/m2); 75 point for Overweight (25–29.9 kg/m2) or Underweight (<18.5 kg/m2); 50 points for Obesity Class 1 (30–34.9 kg/m2); 25 points if Obesity Class 2 (35–39.9 kg/m2); 0 point for Extreme Obesity Class 3 (⩾40 kg/m2). 37
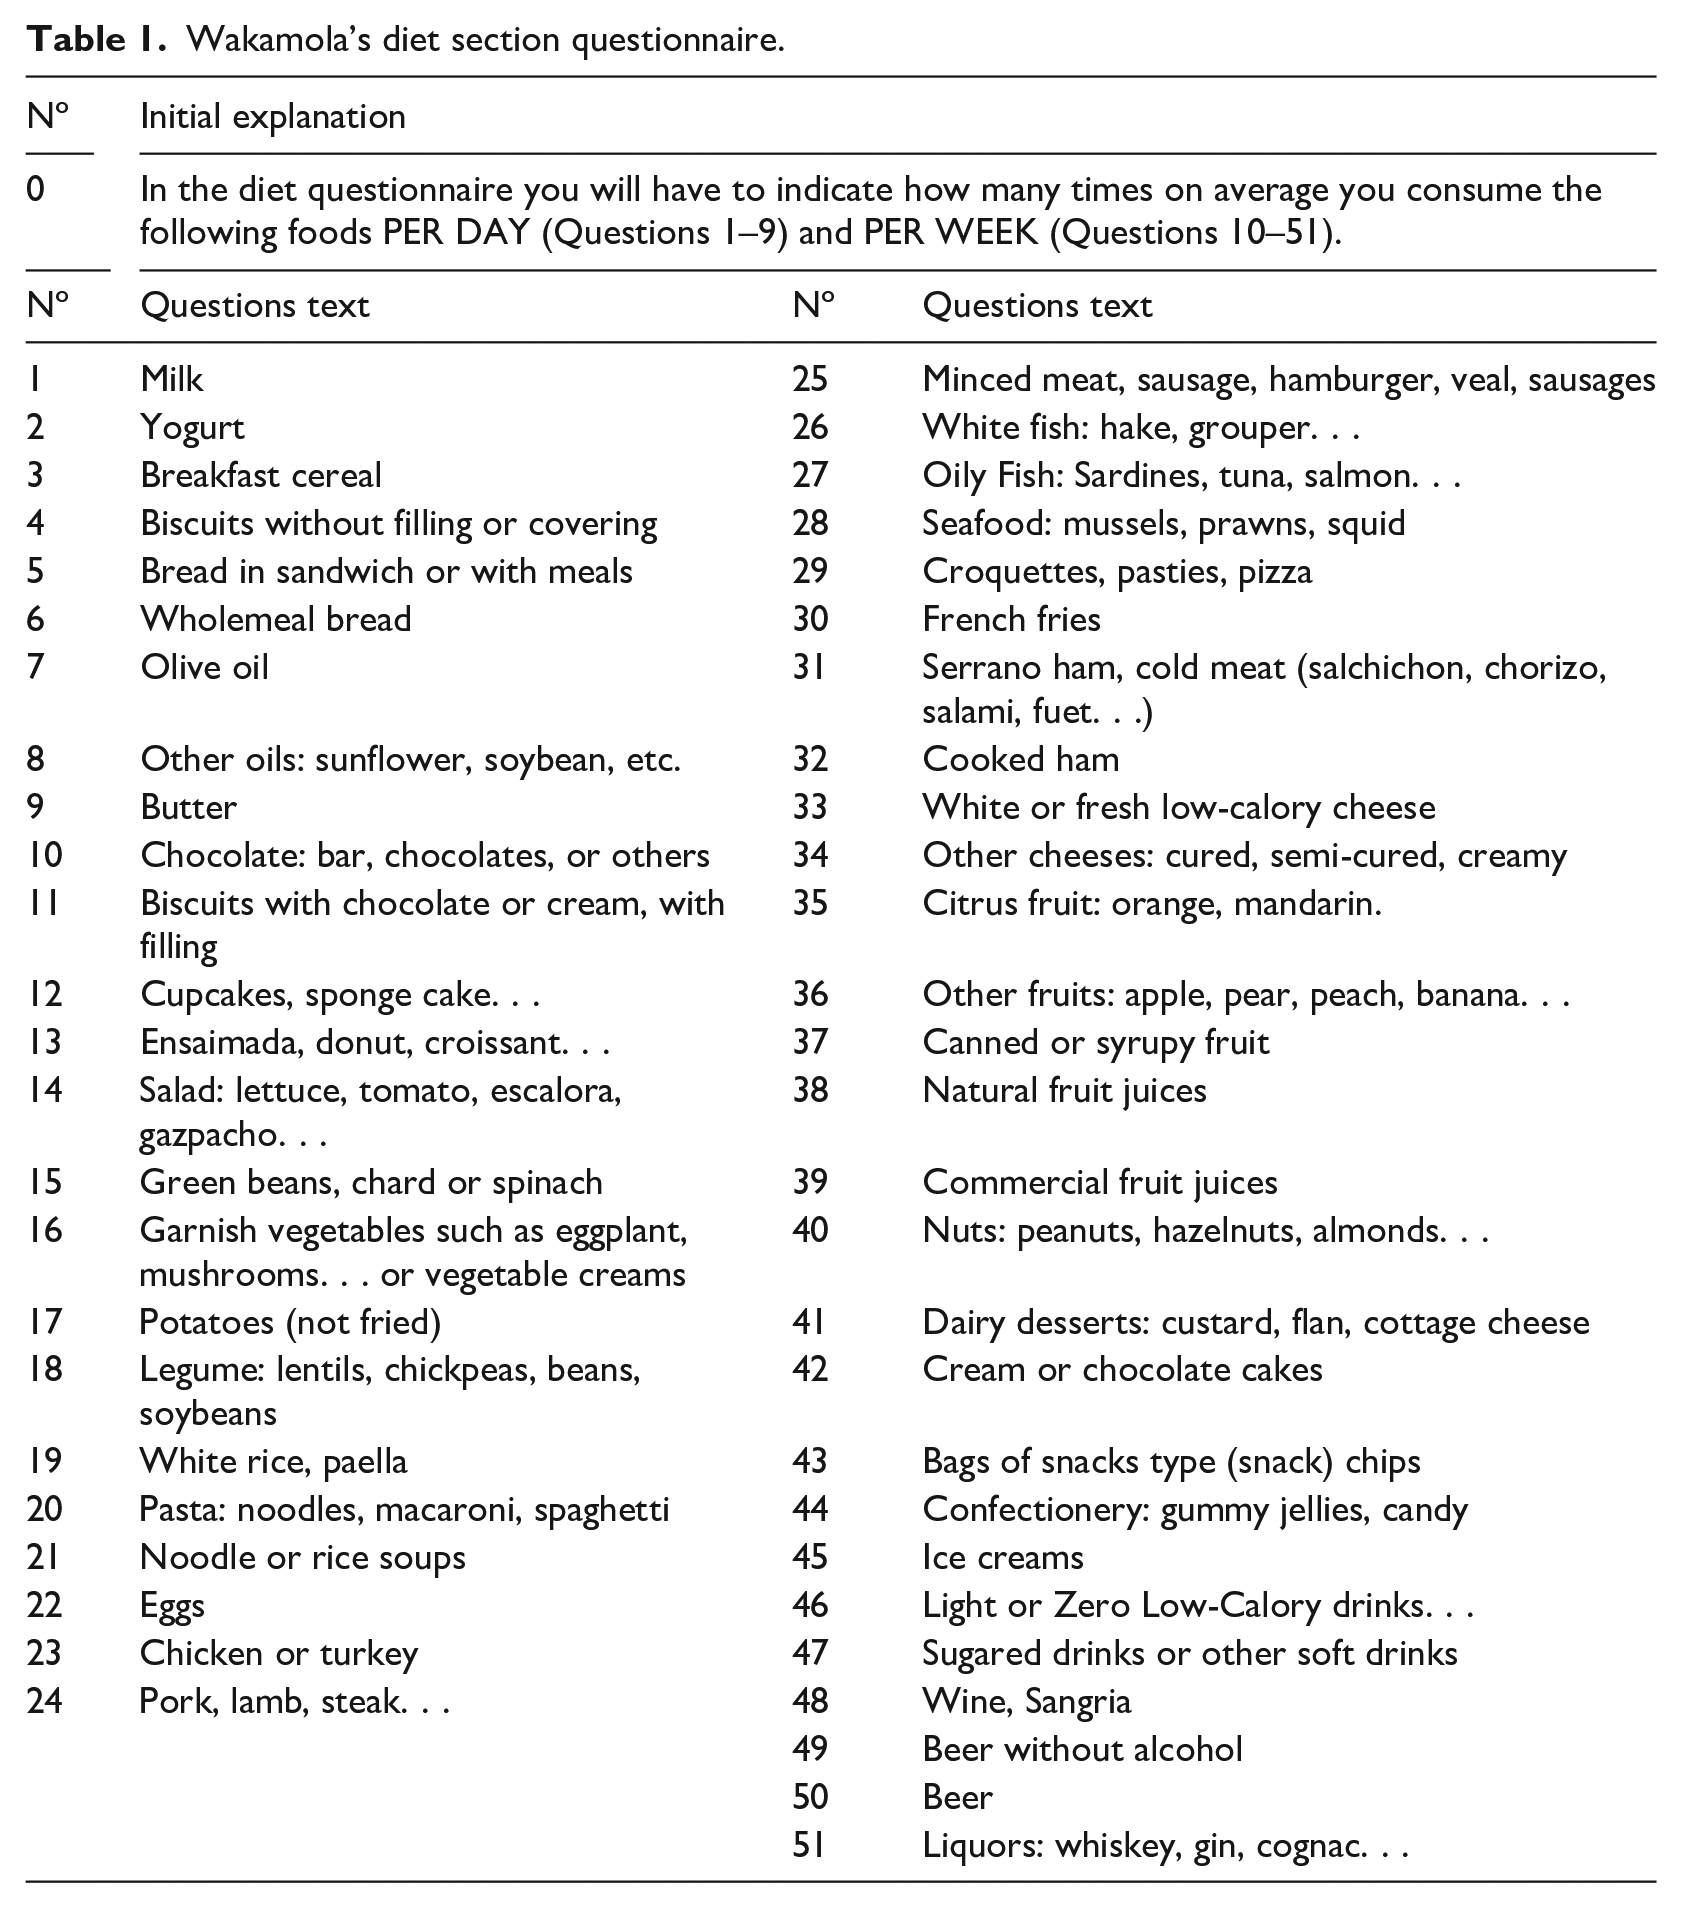
There are 51 questions regarding food consumption frequency adapted from “Short questionnaire on frequency of dietary intake” 38 (see Table 1). Diet question responses (real values) are scored from 1 to 10 based on the “Spanish diet quality according to the healthy eating index.” 39 The lower the score of the item, the less healthy its consumption. The items not included in this index were scored by experts in nutrition according to the Mediterranean Diet Pyramid. 40 Each food item is scored according to its food group (see Supplemental Table S1) and its frequency of consumption (see Supplemental Table S2). Then all the items’ scores are added up and normalized on a 0–100 scale to calculate the Nutrition score. Table 1 shows an example of the diet questions in the chatbot.
Wakamola’s diet section questionnaire.
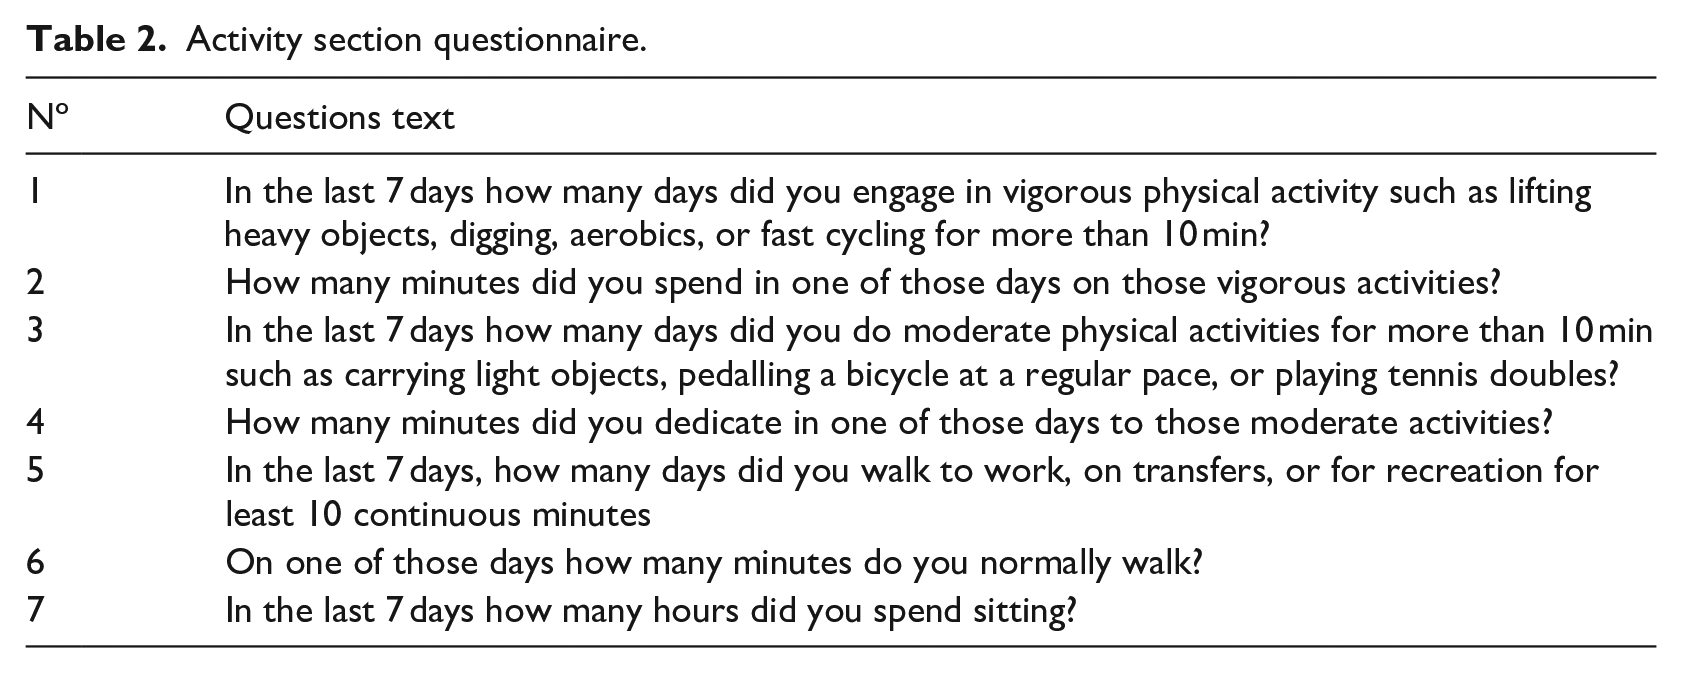
There are seven activity questions about the intensity and duration of the activity adapted from the International Physical Activity Questionnaire (IPAQ) 41 (see Table 2). According to the IPAQ index, the Activity score is calculated by multiplying the activity intensity (measured in METs), weekly frequency, and duration. The index is then normalised on a 0–100 scale to obtain the Activity score, with an upper limit of 1800 Mets-min-week (Highly Active level). 35
Activity section questionnaire.
The Wakanet section shows users’ number of contacts in Wakamola. The user can share the chatbot in the Sharing section by sending a message including a link to the chatb in Telegram. He can then view the network graph in this section through a link to the graphical viewer web tool. 42 The Social score is calculated according to equation (1). The Social score (0–100 scale) depends on the number of contacts and their Wakastatus. We included this score to promote sharing Wakamola and as a reward to reflect users’ obesity and overweight problem concern with their social environment. However, the weight of the Social score in the final Wakaestatus score was limited (see Maxnetwork in equation (1)).
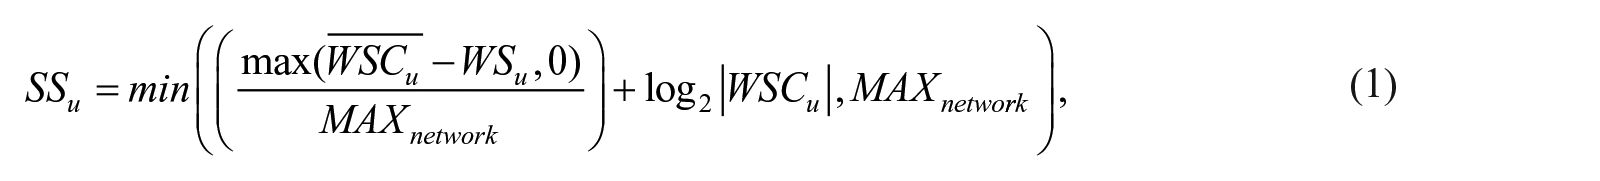
Where:
SSu: Social score of user u
WSu: wakastatus of user u
WSCu: wakastatus of user u
The Wakastatus section provides a Wakastatus score between 0 and 100 and represents the user’s overall health status. It is calculated by adding the normalised BMI, Nutrition, Activity, and Social scores.
Data collection
The first data were gathered from October 17th 2019 to February 27th 2020 before the confinement (case-control). The second was launched from April 21st to May 1st, 2020, when strict mobility restrictions were imposed on most of the population. During confinement, people were allowed to go shopping for food and medicines and go to banks and medical centres. In both studies, the chatbot asked about the previous week’s diet (food frequency), physical activities and sitting and sleeping time, among others.
Statistical analysis
Data were analysed using Statgraphics Centurion XVII software. The descriptive analysis applied the counts and percentages for categorical variables and median, mean and standard deviation for continuous measures. Density and Q-Q plots were used to check normality visually and tested by the calculated standardized skew and standardized kurtosis. The non-parametric Mann–Whitney U test was applied to test significant differences in weight, BMI, frequency of food consumption, physical activity measurements, sitting and sleep time, and Wakamola scores.
Results
Participants’ characteristics
Nine hundred and four subjects participated in the study, 365 in the case-control, and 539 in confinement. We excluded those who did not meet the inclusion criteria (24 in case-control and 141 in confinement) (see flow chart in Figure 1).
Three hundred and forty one participants were included in the case-control period (147 women and 194 men), 214 students and 127 workers from 143 different post codes. Among obesity-associated diseases, 18 participants indicated hypertension (8 also indicated cholesterol, 1 diabetes, 1 cardiovascular disease); 2 diabetes, 39 high cholesterol, and 9 cardiovascular diseases, 34 were smokers (19 women and 15 men).
During the confinement period, 398 people were included (232 women and 166 men), 275 students, and 123 workers from 166 different post codes. Of the diseases associated with obesity, 30 cases had high cholesterol (2 also diabetes and 4 hypertension), 7 had diabetes, 15 hypertension, and 14 suffered cardiovascular diseases. Again, only 40 participants were smokers (26 women and 14 men). Since there were differences in men and women’s participation in both scenarios, we compared lifestyles by gender.
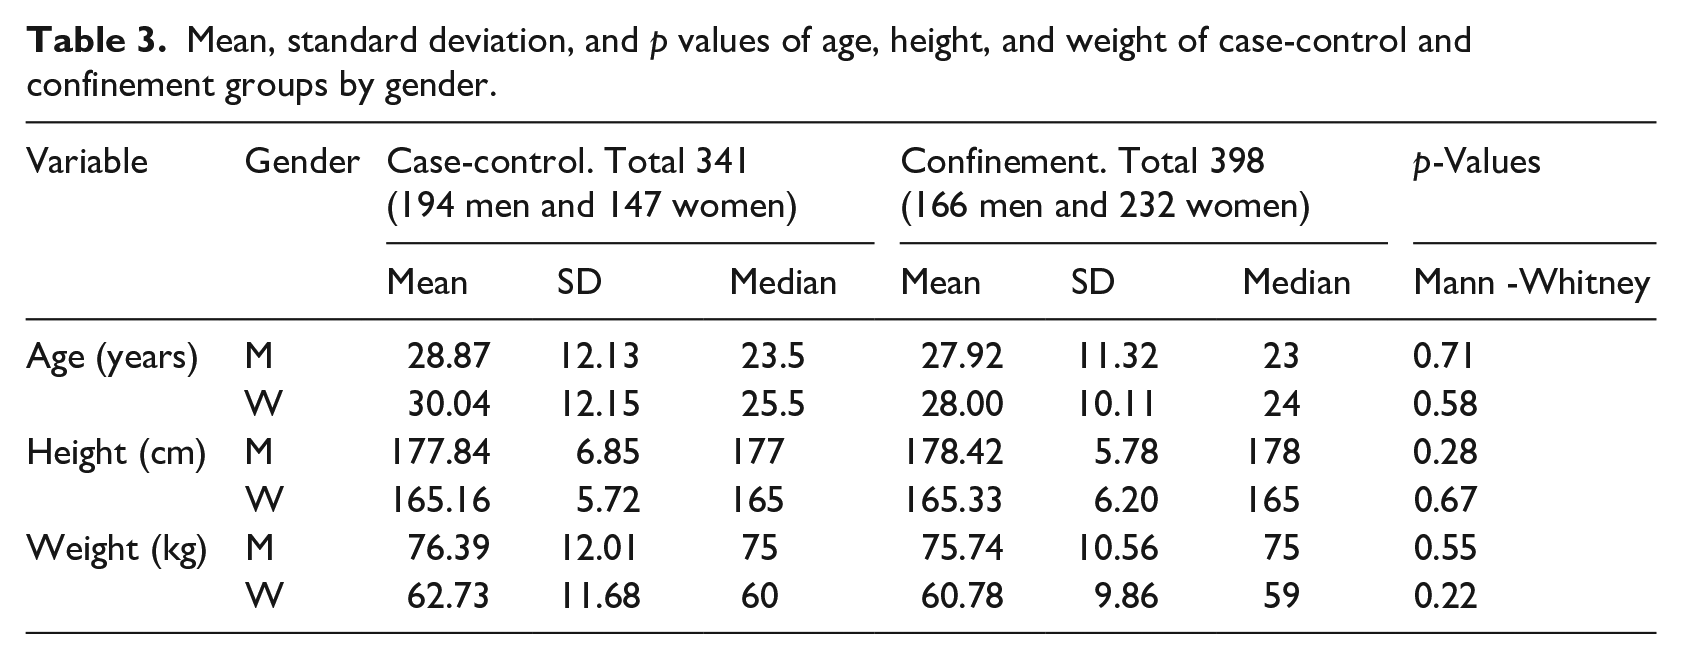
For the age, height, and weight variables we tested the normality for men and women samples in case-control and confinement, applying Q-Q and Density plots and calculating the standardized skew and standardised kurtosis. Only height presented a normal distribution for men and women in both cases. Table 3 shows the mean, standard deviation, median, and p-values of the Mann-Whitney test of age, height, and weight in both groups for men and women, respectively. According to the p-values calculated, there are no significant differences in age, height, or weight for men and women between the groups, with a confidence level of 95%.
Mean, standard deviation, and p values of age, height, and weight of case-control and confinement groups by gender.
Body mass index and Wakamola scores case-control versus confinement
The BMI and Wakamola scores were calculated in both study cases for men and women. We also compared them to identify significant differences with a confidence level of 95% applying the Mann-Whitney test (Table 4).
Mean, standard deviation, median, and p values of the BMI and Wakamola BMI, overall status, nutrition, activity, and social scores of case-control and confinement. Values of BMI <18.5 kg/m2 indicate underweight; 18.5–24.9 kg/m2 indicate normal weight; overweight 25–29.9 kg/m2; obesity (Class 1) 30–34.9 kg/m2; obesity (Class 2) 35–39.9 kg/m2; extreme obesity (Class 3) ⩾40 kg/m2. 37
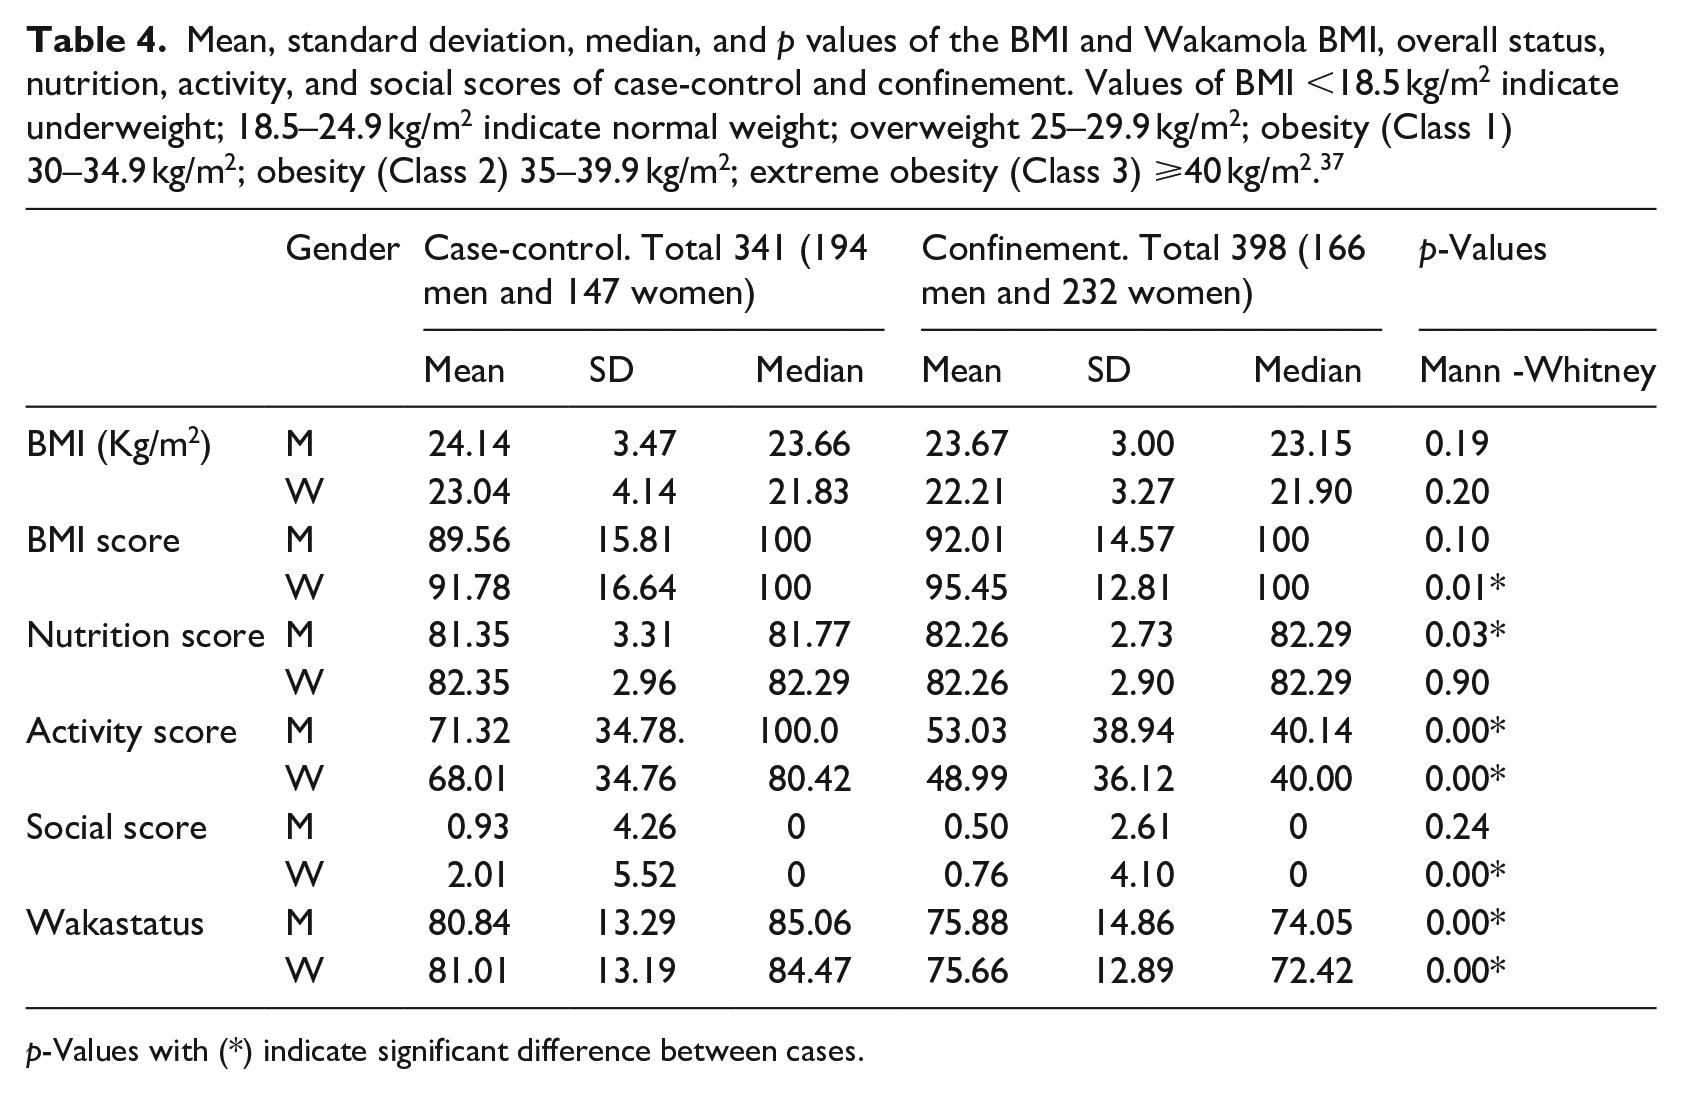
p-Values with (*) indicate significant difference between cases.
The BMI medians indicate normal weight for men and women in both groups, with no significant difference between cases with a confidence level of 95%. We found significant differences in the BMI score and Social Score, but only for women. There were significant differences for both genders in the Nutrition, Physical Activity, and Wakastatus scores (see Table 4).
Comparison of type of food and frequency of consumption
There was a significant difference between cases in consuming certain foods for both men and women, although they changed between genders (Tables 5 and 6). In confinement, men significantly reduced their consumption of pastries (doughnut, croissant, . . .), French fries, low-calory drinks, light or zero. . ., and sugared drinks or other soft drinks while in confinement they significantly increased their consumption of vegetables (green beans, chard, or spinach), potatoes (not fried), and salad (see Table 5, Figure 3).
Foods with significant differences in weekly consumption between case-control and confinement by men.
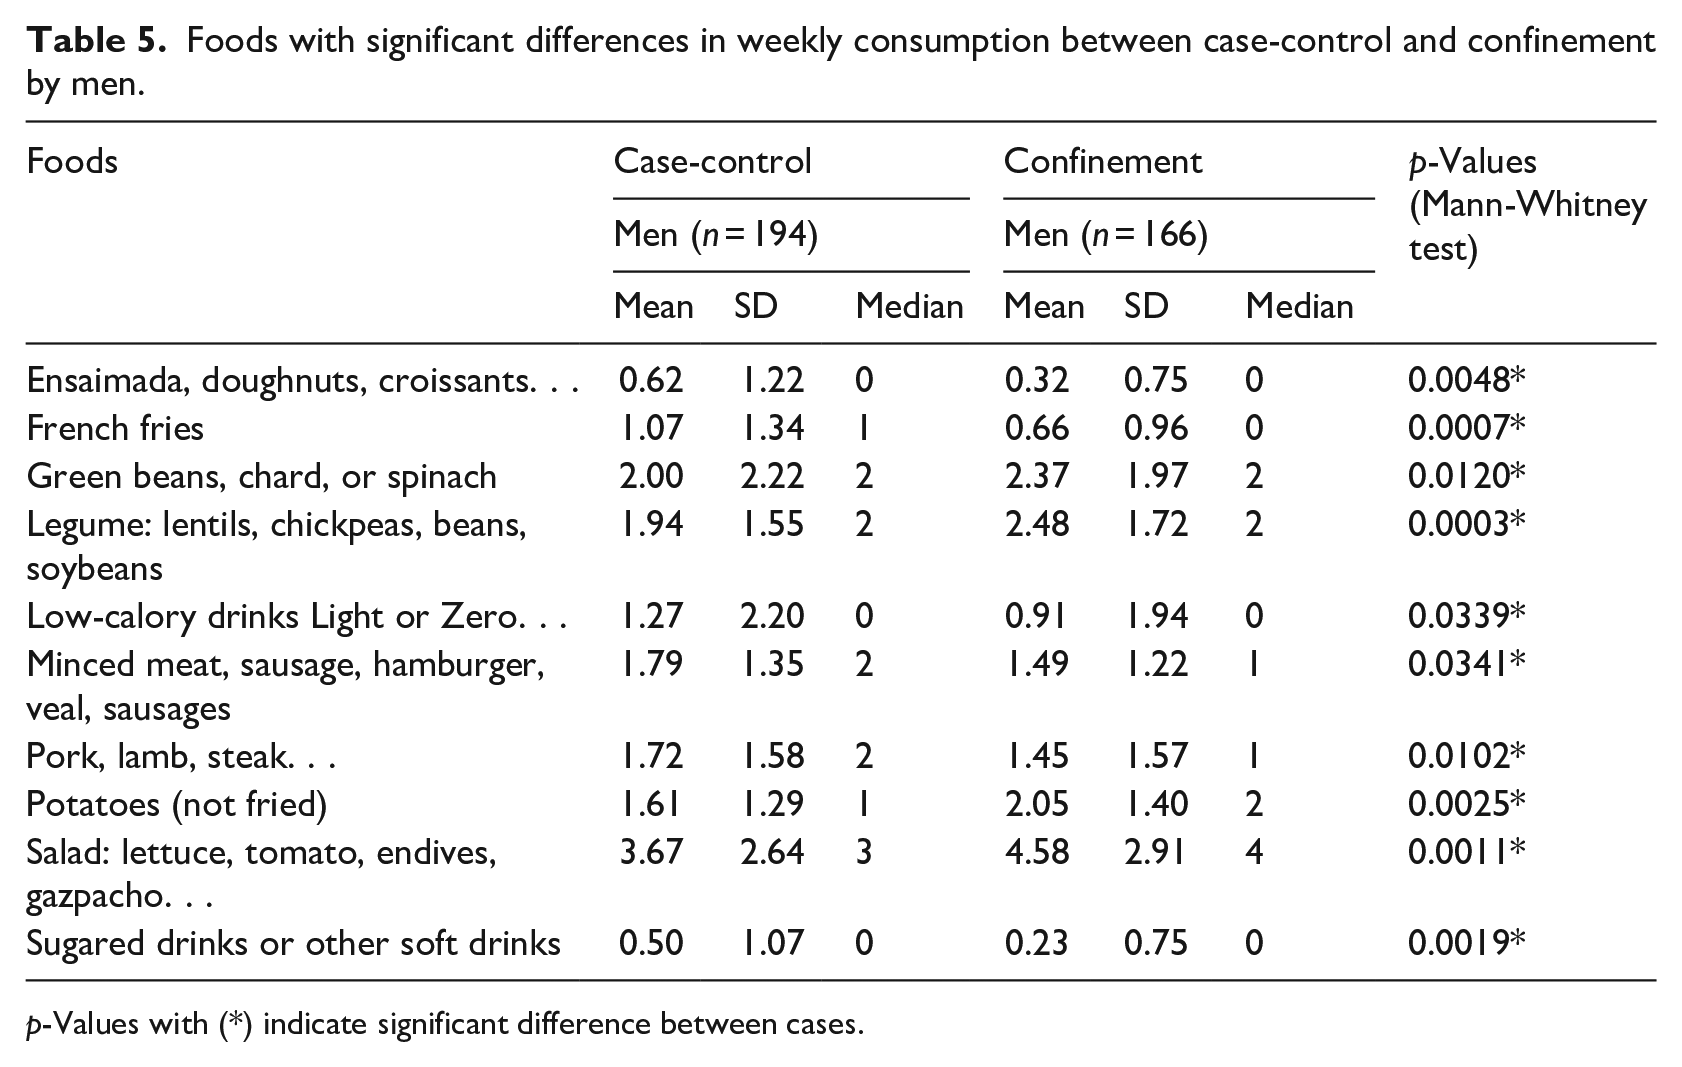
p-Values with (*) indicate significant difference between cases.
Comparison of significant differences in women’s weekly food consumption between case-control and confinement.
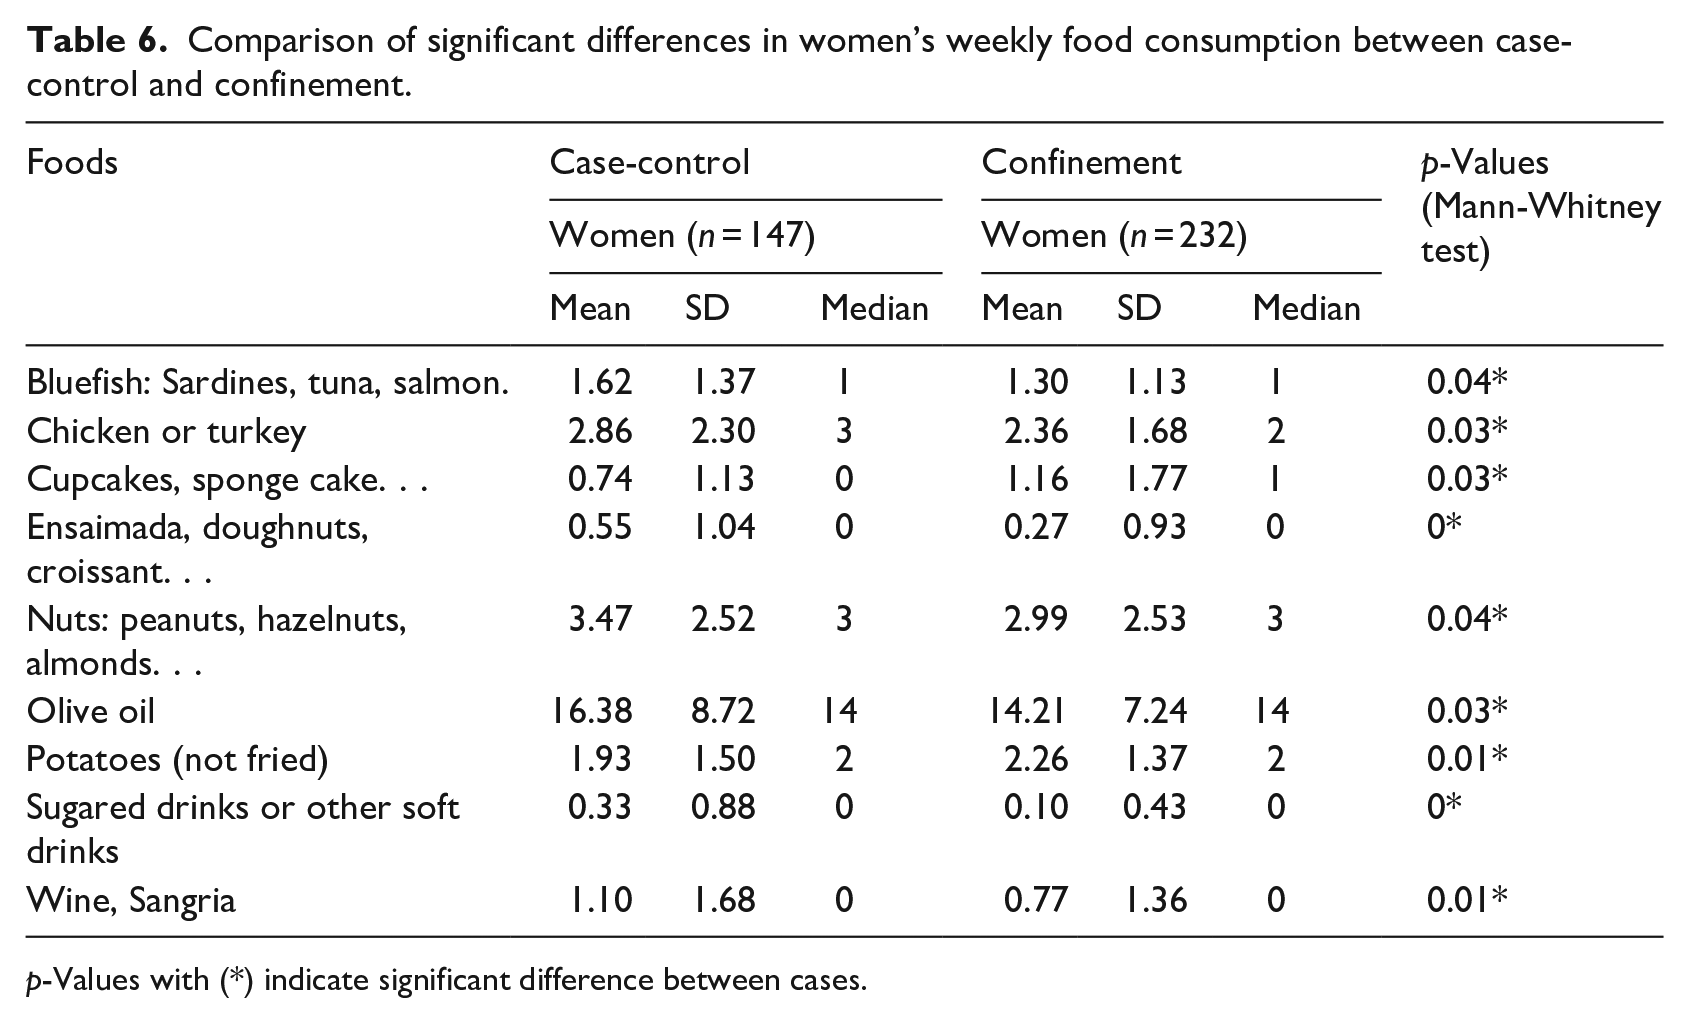
p-Values with (*) indicate significant difference between cases.
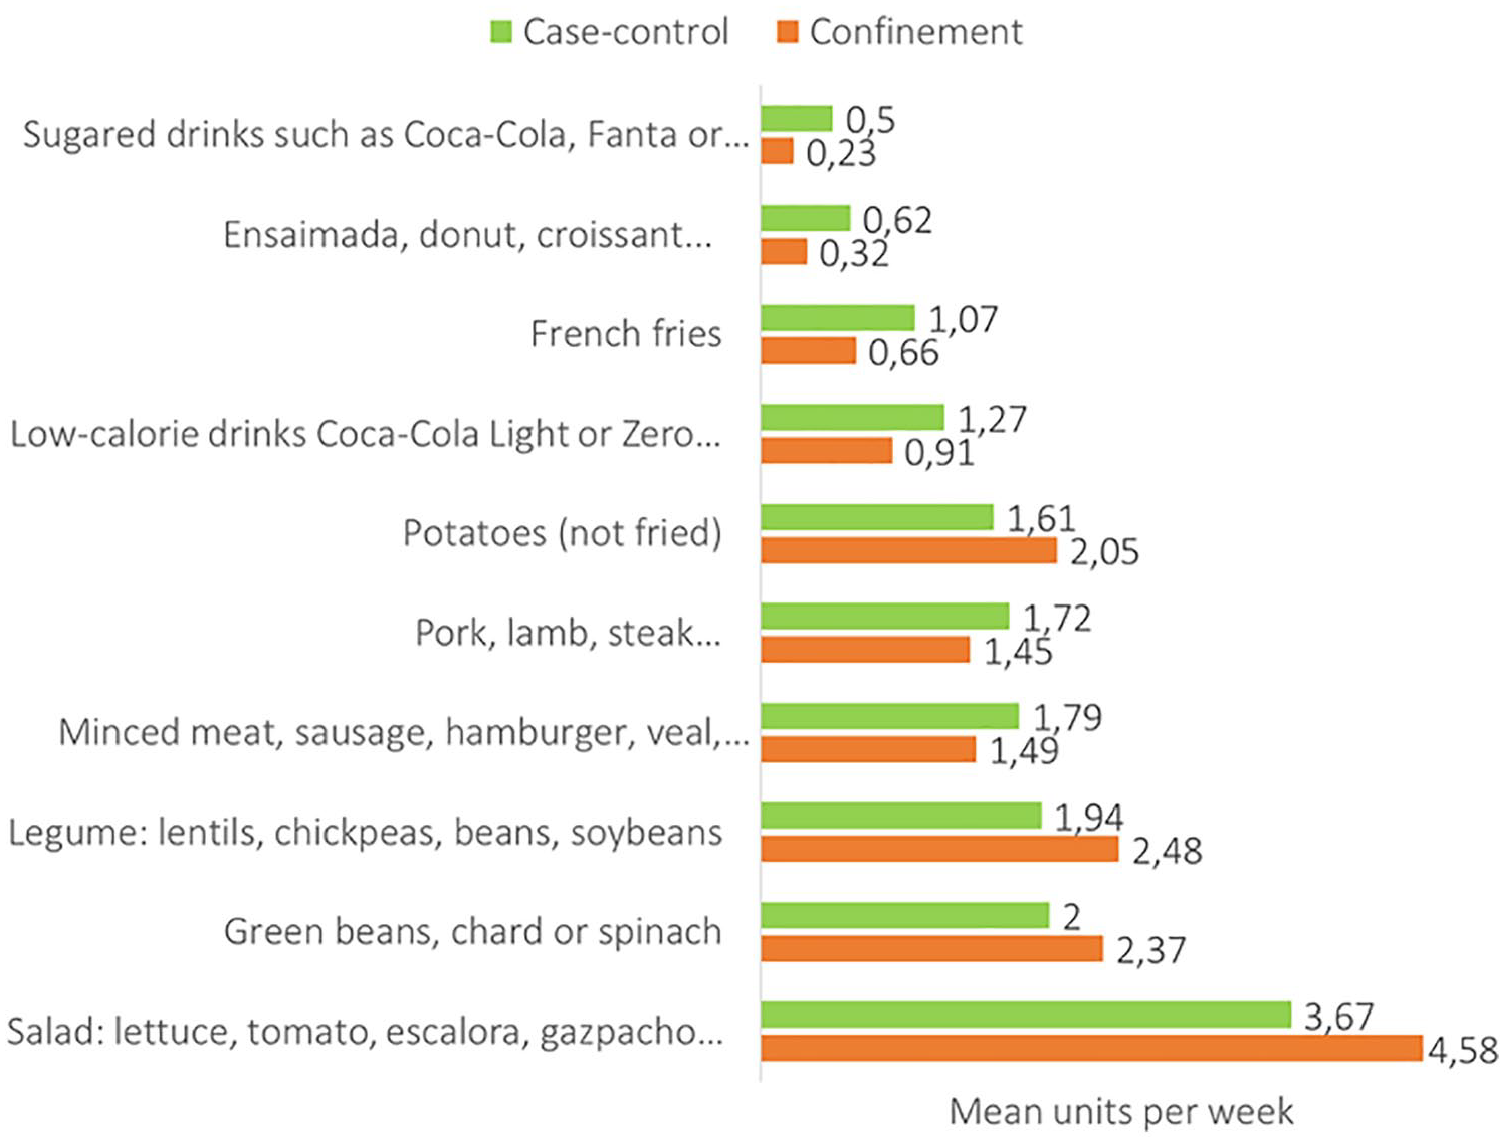
Foods with significant differences in weekly consumption between case-control and confinement by men.
Women in confinement significantly decreased their consumption of oily fish, chicken, or turkey; pastries; nuts; olive oil, sugared, or other soft drinks and wine. However, their consumption of potatoes and cupcakes, sponge cake increased (see Table 6, Figure 4).
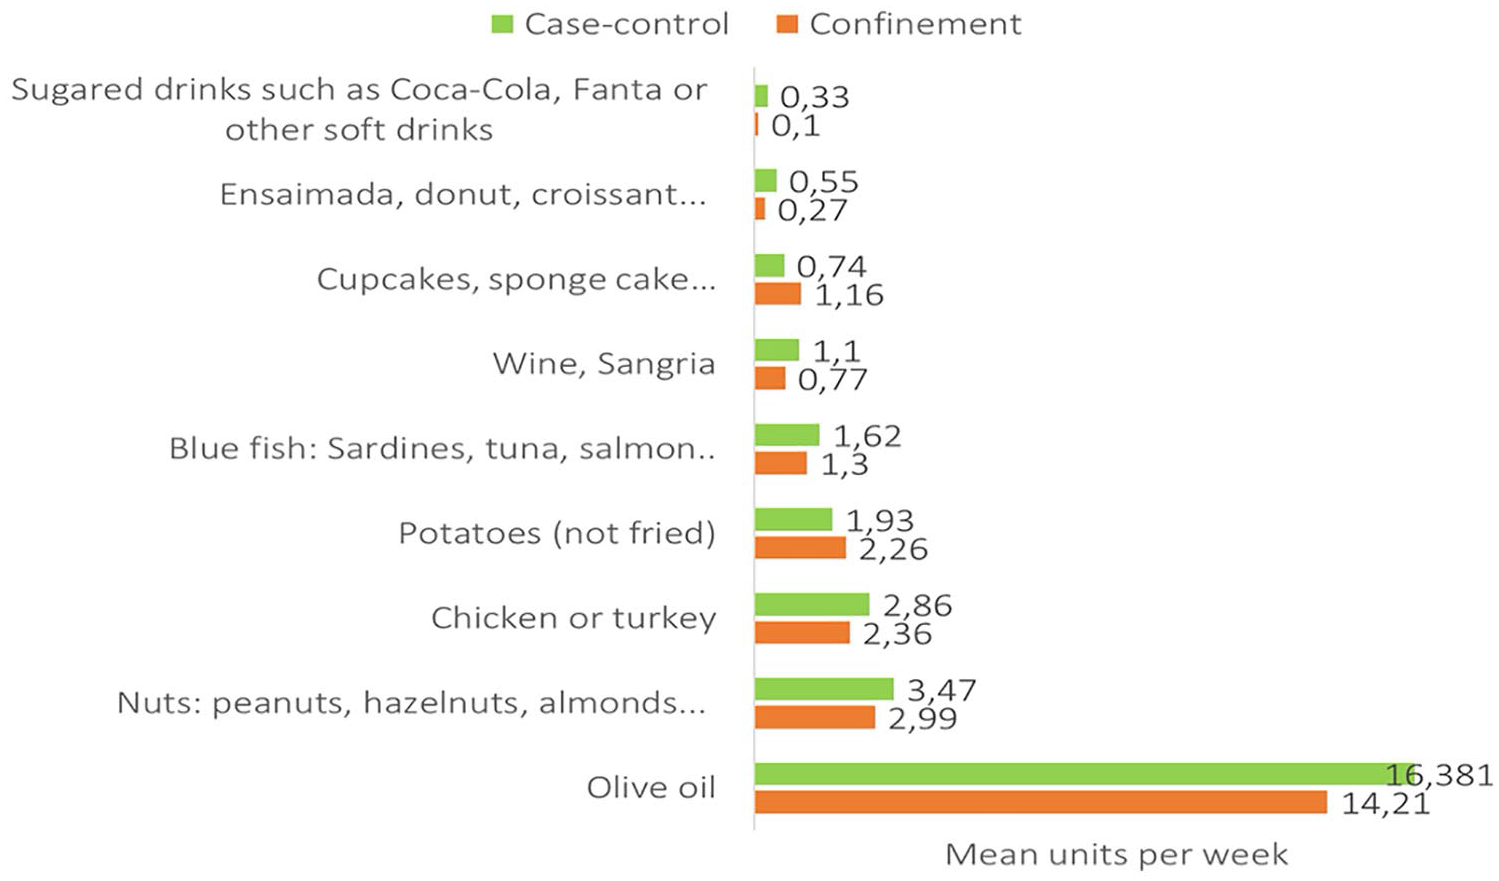
Comparison of significant differences in women’s weekly food consumption between case-control and confinement.
Physical activity and sleeping time
We found significant differences in physical activity and sleeping hours between groups in men and women in case-control and confinement, with a confidence level of 95% (Table 7).
Comparison of physical activity and time sleeping in case-control versus confinement.
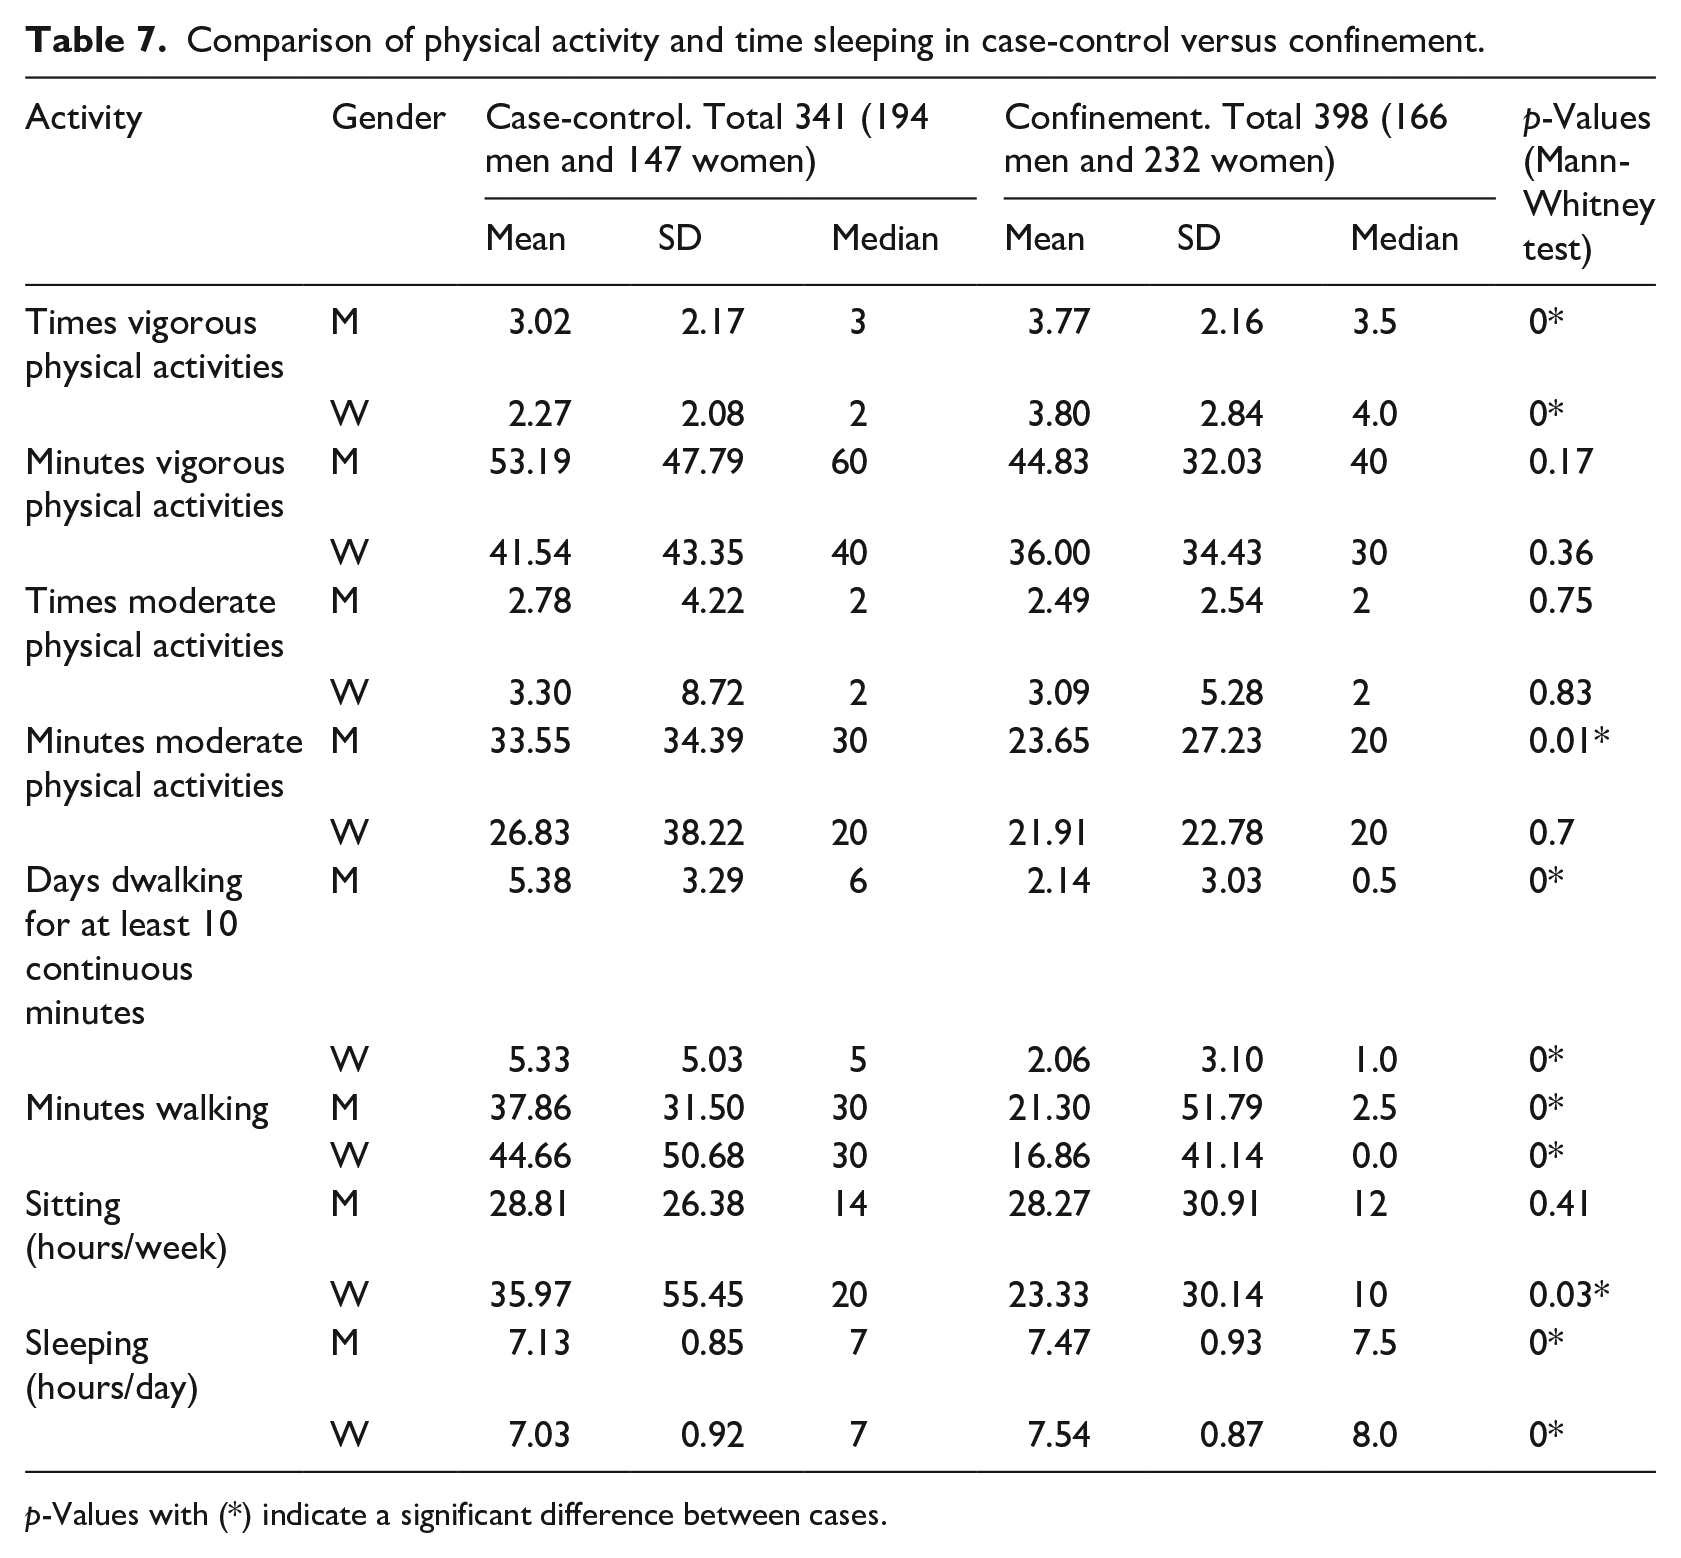
p-Values with (*) indicate a significant difference between cases.
Men increased the number of times per week they practised vigorous activities, with no differences in the duration of these sessions. No differences were found for men practising moderate activity weekly, but the duration of these sessions decreased. As expected, the times and duration of weekly walks at least 10 min for men significantly decreased in confinement. Women increased the number of times they practised vigorous activity in confinement, with no differences in the duration of these sessions. There were no significant changes in moderate activity between cases for women. The time walking more than 10 min per week decreased significantly in confinement for women; the walk duration also decreased in confinement. The hours spent sitting significantly decreased for women with no differences for men. Men and women slept longer in confinement. All these differences are summarized in Table 7.
To assess and compare the level of physical activity, we used the International Physical Activity Questionnaire (IPAQ). 41 . Men’s physical activity level decreased from high level in case-control to a medium level in confinement. Women remained at a medium level of physical activity despite the confinement (see Supplemental Table S5).
Discussion
To our knowledge, this is the first study to examine the effect of confinement on weight, BMI, eating habits, physical activity, and hours spent sitting and sleeping by gathering self-reported data through a chatbot. We analyzed these variables for 739 adults belonging to the university community (students, teachers, and staff) in two cohorts at different times: 341 users in the case-control group (October 2019 to February 2020) and 398 users in the confinement group (April 21st to May 1st, 2020).
Data collection methods used to study diet, physical activity, and weight in confinement
Recent worldwide studies have analyzed the effects of confinement on weight, eating habits, and physical activity. Most of these studies collected data through online web questionnaires on Google forms,5,10,18,43 SurveyMonkey,19,44 or others platforms (not specified).17,45 Some studies used phone interviews6,46 or institutional databases. 47 However, none of them used a chatbot to collect the data. We here propose a chatbot as a novel method of collecting data to study changes in weight and lifestyle in a confinement context. Previous studies found that chatbots can be more engaging for users to complete questionnaires.48,49 They are thus more likely to answer questions through a chatbot than in a questionnaire or interview because they associate them with entertainment and social and relational factors and they are curious about what they view as a novel phenomenon. 50 Some recent studies analysed the advantages of chatbots over web surveys. Kim et al. 51 found that chatbots reduced respondent satisfaction behaviour (tend to generate satisfying responses instead of accurate responses to reduce the cognitive burden 52 ). They also produced high-quality data and encouraged user engagement compared to a web survey. The lack of an interviewer causes response quality problems in web surveys and a chatbot can prevent these problems by partly performing the role of a human interviewer. Besides, a chatbot’s casual tone as the one used by Wakamola may help users to recall human-to-human interaction, 51 improving their emotional connection. 48 Celino and Re Calegari 53 showed that users appreciate the conversational form and prefer it to web surveys. From a data collection point of view, the conversational method is as reliable and has a higher response quality than a web survey. Wambsganss et al. 54 found that participants using chatbot surveys showed higher response quality and social presence than a web survey. In a health context, Te Pas et al. 55 concluded that patients preferred a chatbot questionnaire over a computer questionnaire as the chatbot was faster, although real-time to completion of both questionnaires did not differ. Based on these studies, chatbots are a feasible alternative to traditional online and computer surveys to improve collected data quality and user experience.
Confinement effects on weight
According to recent evidence, confinement can cause changes in people’s weight, with either a weight gain5,10,17–20 or weight loss,19,20 while there may also be no weight changes at all. 56 Our study found no significant variation in men and women’s weight between the case-control and confinement. However, there was a slight decrease in weight for both genders (Table 3). This result could be explained by the fact that most participants kept practising physical activity regularly (Table 7) and ate healthier food in confinement (Tables 5 and 6), which may have contributed to preventing weight gain. Fernandez-Rio et al. 51 studied (4379 Spanish citizens 16–84 years old) and found that most participants declared no weight changes. Physical activity and optimism were protective elements for weight change. More significant weight variability was observed in males and obese individuals and symptoms of depression were linked to greater weight changes.
We found that the BMI medians in men and women indicated normal weight in the case-control and confinement groups (Table 4), without showing a significant variation between cases. This result could have been influenced by the predominance of students (young adults) in both cases (62% of participants in case-control, 69% in confinement (mean age 28.8 years and 27.92 years in confinement)), both values corresponding to young adults (19–40 years of age). Numerous studies have reported age-related increases in body weight and fatness after young adulthood. 57 The nutrition score indicates a healthy level for men and women in both cases (Table 4), contributing to the normal weight levels.
There was a statistically significant difference between the median women’s BMI score in case-control and confinement with a confidence level of 95%; medians were higher (healthier) in confinement than in case-control (Table 4). This result reflects an increase in women’s normal weight level in confinement.
More in-depth research will be necessary to explain the discrepancies between these studies.
Confinement effects on diet
Recent research highlights that confinement changes people’s eating habits.5,6,9,10,19,43,45–47,58 Our study found significant differences in the consumption of some types of food by men and women between the cases (Tables 5 and 6). For men in confinement, consumption of foods with a low-frequency intake recommendation in the Mediterranean Pyramid 40 (e.g. pastries) decreased; French fries, minced meat, sausages, hamburgers, veal and sugared drinks, or other soft drinks. However, confinement increased the consumption of foods associated with the Mediterranean diet 40 such as green beans, chard or spinach, legumes, potatoes (not fried), salad, and gazpacho (tomato soup with oil and bread). These results could indicate a change in healthy eating habits for men in confinement. Some authors also observed changes to a healthier diet, for example, Sánchez-Sánchez et al. 5 observed that adherence to the Mediterranean Diet slightly increased during confinement. 5 Rodríguez-Pérez et al. 10 also found an improvement in dietary behaviour with a higher intake of fruit, vegetables, and legumes, and a lower intake of red meat, alcohol, fried foods, or pastries. Górnicka et al. 9 found changes in the dietary patterns of 47% of the participants in their study (n =2381 adults), 28% changed to a prohealthy diet pattern and 19% to an unhealthy diet pattern, with no changes in diet for the rest of the participants (53%). A prohealthy diet is associated with an increase in the intake of vegetables, fruit, whole grains, pulses, fish, and water, with a reduced discretionary food intake. The unhealthy diet was associated with an increased intake of processed meat, fast food, ice cream, commercial pastry and alcohol, salty snacks, and homemade pastry and confectionery.
For women, significant differences are also found in the consumption of some food types (Table 6). Women in confinement significantly reduced oily fish, chicken or turkey, nuts, and olive oil consumption, doughnuts, croissants, sugared drinks, soft drinks and wine, recommended at low frequency levels in the Mediterranean diet. 40 Although there was an increase in the consumption of cupcakes and sponge cake, the authors hypothesise that this increase was due to the longer time available for cooking desserts as entertainment during the confinement. Górnicka et al. 9 found an increase in homemade pastry and confectionary intake in approximately 70% and 80% of respondents. Further study will be needed to confirm this.
We found statistically significant differences in the nutrition score for men between the case-control and confinement groups, with a confidence level of 95% from a median of 81.77 in case-control to 82.29 in confinement (healthier). The nutrition score was a little higher in women than men in case-control but increased for men in confinement to reach similar scores. No significant differences were appreciated in women (Table 4) for this score. The nutrition score in confinement indicated a healthy level for men and women (82 points out of 100) (Table 4). This could be explained by the above-mentioned change to healthier food types in confinement (Tables 5 and 6). Shopping for food and its preparation was an essential activity in people’s daily lives in this period, which may have contributed to promoting healthier eating.9,20,59,60 Górnicka et al. 9 found higher adherence to the prohealthy dietary change pattern in respondents who ate more homemade meals.
In short, there is evidence that confinement affected people’s eating habits. However, as some studies showed changes to healthier habits5,9,10 as in the present study, while others reported an increase in unhealthy ones6,9,17,47 besides an increased appetite,18,58 so that there is a need for an in-depth study of dietary changes in confinement and their effects, for which the Wakamola chatbot would be a useful tool. It could also help in self-assessments (Wakastatus) and promote healthy habits in a confinement.
Confinement effects on physical activity
There is evidence that confinement affects physical activity.5,10 Most of the studies report a decrease in physical activity,5–7,9,10,18 although Di Renzo et al. 58 indicate a slight increase.
We found statically significant differences in the activity score for both men and women between the medians in case-control and confinement with a confidence level of 95%. The men’s median in case-control was 100, and 40 in confinement, the higher being healthier (Table 4). For women, the median was 80.42 in case-control, less than men, and decreased to 40 in confinement (Table 4). These results indicate a decrease in both genders’ physical activity consistent with recent studies.5–7,10,18
According to our IPAQ results, men increased the number of times per week they practised vigorous activities, with no differences in session duration in confinement. No differences were found in the times they practised moderate activity each week but their duration decreased (Table 7), in disagreement with the study of Castañeda-Babarro et al., 7 in which men reported reduced vigorous and moderate activities. These authors studied the physical activity of 3800 healthy Spanish adults (mean age 42.7 years) during confinement by applying the IPAQ short version. 61
In our study women increased the number of times they practised vigorous activity, with no differences in session duration and no significant changes in moderate activity between cases (Table 7). Castañeda-Babarro et al. 7 found that women reduced their vigorous activity but increased moderate activities.
This discrepancy with Castañeda-Babarro et al. 7 could be because of differences between the studies regarding sample size, period evaluated and age of the participants, with a smaller size, a longer period, and a greater presence of young adults in our sample.
The weekly physical activity of men in confinement decreased from a high to medium level. Women’s physical activity remained at a medium level in confinement (see Supplemental Table S5).
The time spent walking more than 10 min per week, as expected, decreased significantly in confinement for men and women and the duration decreased in confinement (Table 7), in agreement with Castañeda-Babarro et al. 7
Castañeda-Babarro et al. 7 found that sedentary time increased in men more than in women. In our study sedentary time significantly decreased for women, with no differences for men, while there were significant differences in sitting hours per week for women in confinement, from a median of 20to 10 h/week. There were no significant differences for men in sitting hours per week in confinement, with a median of 14–12 h/week (Table 7).
These results indicate that people went on practising physical activity despite confinement, although we found a decrease in physical activity in both men and women during confinement caused by its restrictions on movement (Table 7). However, this has been shown not to have an impact on weight gain.
Sleep in confinement
Confinement led to widespread changes in the sleep routine.12–14,62,63 In our study, men and women slept longer in confinement (median 7.5 h men and 8 h women), men increased by 24 min and women by 51. The increase could be explained by people not needing to spend time travelling to work. The recommended time for a good rest in adults is 7 h/day. 64 Although we found an increase in sleeping time, due to our study’s limitations we could not confirm its quality. Several authors also observed an increase in sleeping time and highlighted its worse quality. 62 According to Cellini et al., 13 during home confinement sleeping time markedly changed, with people going to bed and waking up later, but paradoxically also reporting lower sleep quality. Marelli et al. found a worsening of sleep quality and insomnia symptoms during confinement. Romero-Blanco et al. 63 reported that the mean time students spent in bed was higher during lockdown than before but its quality worse.
Future Wakamola chatbot improvement should include questions about the quality of sleep, for example, to allow calculation of the Pittsburgh Sleep Quality Index (PSQI), 55 for a better understanding of sleep changes during confinement. 65
Strengths and limitations of the study
This study’s main strength is including a chatbot as a novel technique to interact with people during the most critical period of confinement and data collection to confirm changes in eating habits (food frequency), physical activity, and sitting and sleeping time. The clarification of the effect of lockdown on lifestyle could lead to preventive actions to avoid overweight, obesity, and associated diseases. However, we are also aware of some limitations. The cohort of the pilot study may not be representative due to selection bias and sample size. Also, Wakamola is only available for Telegram app users and for these reasons our results are not necessarily representative of the university’s general population as a whole.
Conclusions
This study confirmed changes in eating habits, physical activity, and sitting and sleeping time in a Spanish university community during the confinement period. Dietary habits improved during this period, the consumption of fattening foods decreased significantly (confectionary and sugar drinks), and men ate more vegetables, salad, and legumes. Weekly physical activity decreased in men from a high to medium level, while women remained at a medium level. The number of walks per week decreased significantly and men and women slept longer. Women spent less time sitting, with no differences for men. The global health indicator (Wakastatus) decreased significantly for both men and women due to less physical activity. Healthy nutrition and moderate activity contributed to avoiding a higher BMI, which remained at normal weight levels despite mobility restrictions.
After analyzing the changes that took place in confinement we can conclude that the recommendations on the importance of maintaining a healthy diet, exercising regularly, and ensuring adequate rest during confinement may have positively influenced the university community in the study.66,67
On the other hand, this study highlights the usefulness of the Wakamola chatbot in collecting data to study lifestyle habits in a population during the COVID-19 pandemic. The user-centred design favoured the participation of users in case-control and confinement. The data collected is of particular interest for analysing lifestyle changes due to the exceptional circumstances. The Wakamola chatbot turned out to be useful to contact users in confinement and collect data on their weekly habits, and allowed us to obtain the mean population BMI and changes in weight and lifestyle that could be useful to guide preventive actions against overweight and obesity, while the information on dietary habits could help to study dietary patterns,54,64 the relationship between nutrition and obesity and other diseases.65,66
This chatbot could also be used not only to collect data but also as an interactive tool to promote home-based physical activity and healthy diets, help obesity screening, prevalence studies, and in monitoring confined populations.
Supplemental Material
sj-docx-1-jhi-10.1177_14604582211017944 – Supplemental material for How the Wakamola chatbot studied a university community’s lifestyle during the COVID-19 confinement
Supplemental material, sj-docx-1-jhi-10.1177_14604582211017944 for How the Wakamola chatbot studied a university community’s lifestyle during the COVID-19 confinement by Sabina Asensio-Cuesta, Vicent Blanes-Selva, Manuel Portolés, J Alberto Conejero and Juan M García-Gómez in Health Informatics Journal
Footnotes
Author contributions
Funding acquisition, J.M.G.-G.; investigation, S.A.-C., J.A.C., J.M.G.-G.; software, V.-B, M.-P; supervision, S.A.-C. and J.M.G.-G.; writing—original draft, S.A.-C., J.A.C., J.M.G.-G., and V.-B.
Funding
The author(s) disclosed receipt of the following financial support for the research, authorship, and/or publication of this article: This work was supported by FONDO SUPERA COVID-19 by CRUE-Santander Bank grant “Severity Subgroup Discovery and Classification on COVID-19 Real World Data through Machine Learning and Data Quality assessment (SUBCOVERWD-19).”
Supplemental material
Supplemental material for this article is available online.
References
Supplementary Material
Please find the following supplemental material available below.
For Open Access articles published under a Creative Commons License, all supplemental material carries the same license as the article it is associated with.
For non-Open Access articles published, all supplemental material carries a non-exclusive license, and permission requests for re-use of supplemental material or any part of supplemental material shall be sent directly to the copyright owner as specified in the copyright notice associated with the article.