
Abstract
Background:
The Movember funded TrueNTH Global Registry (TNGR) aims to improve care by collecting and analysing a consistent dataset to identify variation in disease management, benchmark care delivery in accordance with best practice guidelines and provide this information to those in a position to enact change. We discuss considerations of designing and implementing a quality of care report for TNGR.
Methods:
Eleven working group sessions were held prior to and as reports were being built with representation from clinicians, data managers and investigators contributing to TNGR. The aim of the meetings was to understand current data display approaches, share literature review findings and ideas for innovative approaches. Preferred displays were evaluated with two surveys (survey 1: 5 clinicians and 5 non-clinicians, 83% response rate; survey 2: 17 clinicians and 18 non-clinicians, 93% response rate).
Results:
Consensus on dashboard design and three data-display preferences were achieved. The dashboard comprised two performance summary charts; one summarising site’s relative quality indicator (QI) performance and another to summarise data quality. Binary outcome QIs were presented as funnel plots. Patient-reported outcome measures of function score and the extent to which men were bothered by their symptoms were presented in bubble plots. Time series graphs were seen as providing important information to supplement funnel and bubble plots. R Markdown was selected as the software program principally because of its excellent analytic and graph display capacity, open source licensing model and the large global community sharing program code enhancements.
Conclusions:
International collaboration in creating and maintaining clinical quality registries has allowed benchmarking of process and outcome measures on a large scale. A registry report system was developed with stakeholder engagement to produce dynamic reports that provide user-specific feedback to 132 participating sites across 13 countries.
Keywords
Background
A wide range of provider-specific quality of care indicators are reported by clinical registries to understand whether optimal care is being provided and to identify where gaps in practice and service provision occur. 1 While clinical quality registries are increasingly viewed as important for quality assurance, the impact of performance feedback into practice hinges on the design and interpretability of the report as well as how the quality indicators are subsequently used in practice.
The TrueNTH Global Registry (TNGR) is a Movember funded, international registry established to understand variation and improve quality of care for men diagnosed with localised prostate cancer. 2 Movember is a global philanthropic organisation committed to improving men’s health. Currently 132 participating sites across 13 countries contribute data to the registry. Data from local data centres (LDC) are transmitted every 6 months to the Data Coordination Centre located at Monash University, Australia. The governance structure of the TNGR, the role and responsibility of LDCs and participating sites have been previously reported. 3 A set of 33 evidence and consensus-based quality indicators has been selected through a Delphi process. 4
Currently, no universal design tool or guidelines exist for how quality of care should be benchmarked and reported. It remains undetermined the extent to which statistical principles should be applied to the performance measures and how easy it is for recipients of the report who may have limited statistical literacy to decipher them. Working towards optimising the balance between statistically sound data presentation and simplicity is key. In an international registry, such as TNGR, diversity in languages is another important consideration. Information which is portrayed using figures is arguably more easily comprehended compared to a narrative description. 5
Here we discuss considerations of designing and implementing benchmark reports for an international clinical quality registry. During development, we sought to determine the most effective visual presentation of data quality, the quality indicators and a suitable reporting platform to distribute confidential reports to international contributors.
Methods
Literature review
A scoping review was carried out to determine the various methods of visually displaying data in the field of health (Ovid Medline and EMBASE) and economics (EconLit). Search strategy is outlined in Supplemental File 1. In total, the review identified 320 articles on Medline, 323 articles on EMBASE and 1843 articles on EconLit. Three articles were particularly informative in outlining different ways of presenting data.6–8 Two overarching concepts for presenting data were identified, (a) data at a single time point and (b) data demonstrating change over time. We further categorised data displays into those which reported one or more than one outcome on the same display.
Working groups
Primary working group
A working group was convened to understand current data display approaches, share findings of the literature review and source ideas for new innovative data presentation approaches. Working group participants comprised members of the TNGR Executive Committee and representatives nominated by the Executive Committee (n = 12). The primary working group identified the purpose of the reports, viz:
To provide participating LDCs/sites with easily interpretable (readable) and informative (clinically and statistically meaningful) feedback on their performance;
To allow them to compare their results with other contributors;
To produce visual presentations that facilitate a cycle of continuous improvement;
To display an early warning signal if outcomes begin to deteriorate;
To maintain confidentiality of all participating LDCs/sites.
Expanded working group
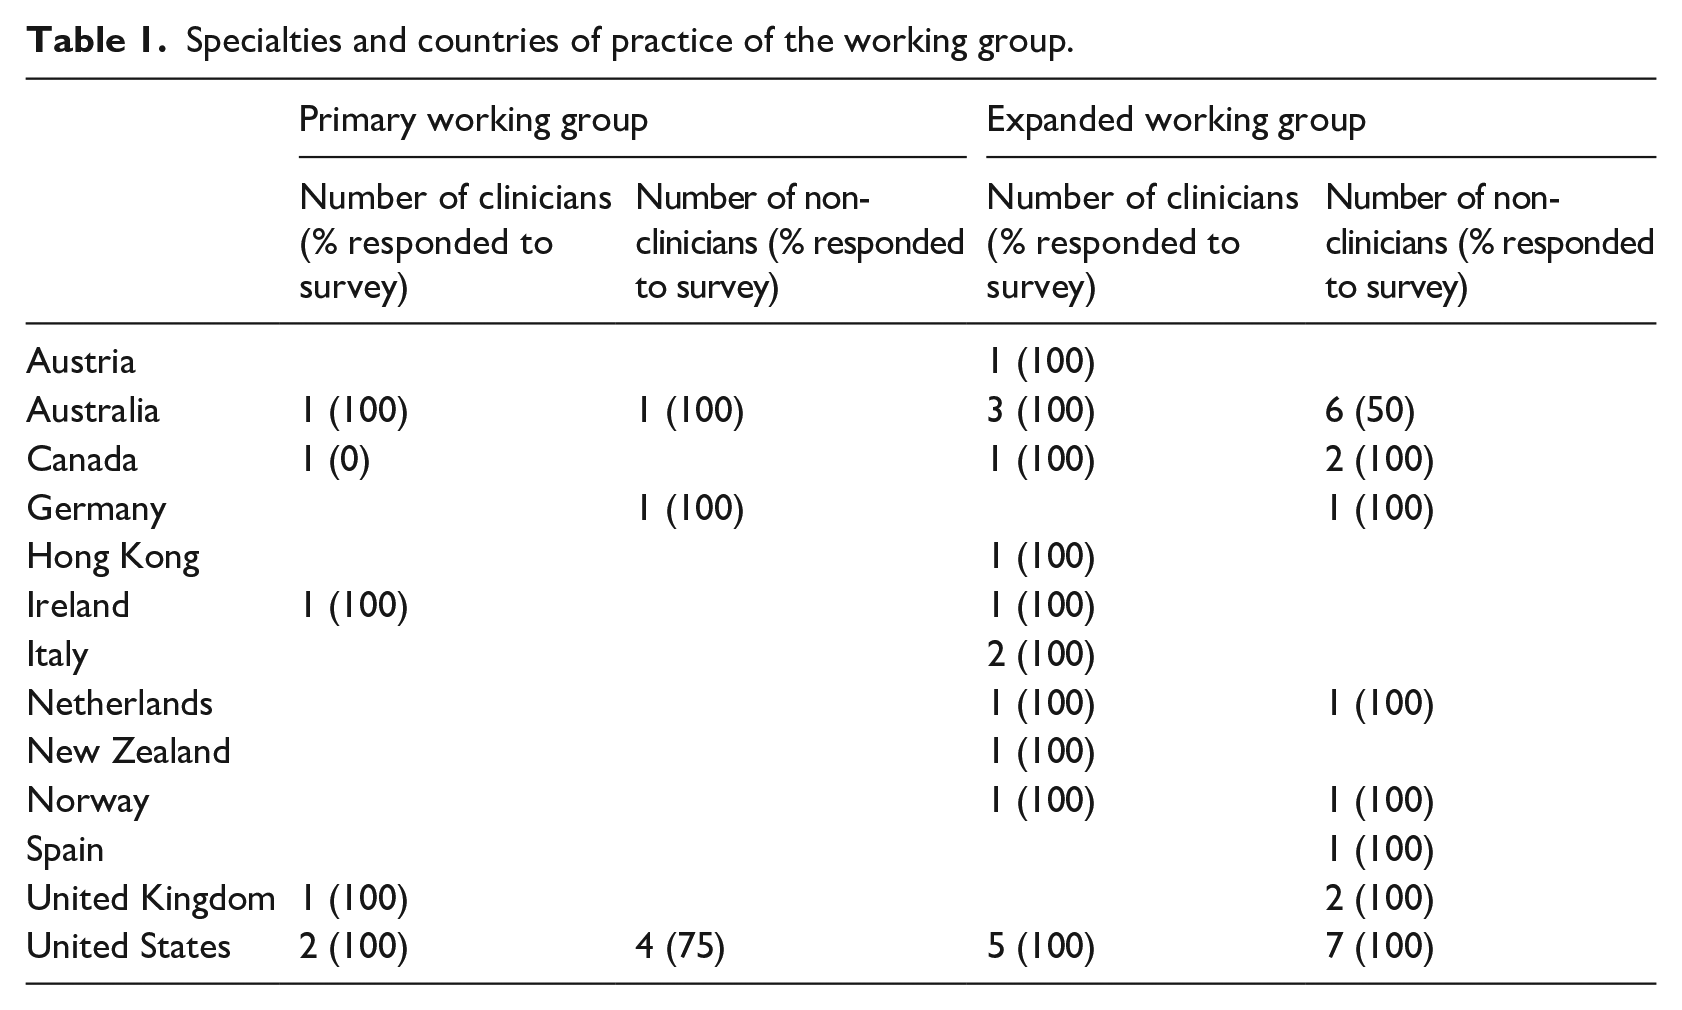
As the project developed, the primary working group was expanded to gather a wider range of views on data presentation from TNGR participants. Local data centres were asked to nominate at least one working group participant to participate in the project. The skills of participants were diverse, with representation from urology, radiation oncology, hospital administration, epidemiology, statistics/biostatistics, psychology, data science, registry managers and the funder (Table 1).
Specialties and countries of practice of the working group.
Surveys
Two surveys were conducted. The first survey was delivered to the primary working group members (Table 1) following a videoconference to obtain suggestions to supplement the literature review (Supplemental File 2a). Following the first survey, feedback from the working group was summarised into favourable and unfavourable factors of each design alternative. A subsequent survey was developed and distributed to the 38 members of the expanded working group following a workshop, described below (Supplemental File 2b).
Workshop
A 3-hour workshop was held with the expanded working group members. Participants were provided with (1) the literature review, (2) the results of the initial survey and (3) the summary document of favourable and unfavourable attributes of each design developed by the primary working group. Workshop participants were asked to ameliorate the display or provide alternative methods of presenting data if they thought it could be improved.
Survey design
The survey was designed to identify the best approach to displaying the following four types of data (Figure 1):
Indicators with binary outcomes at a single (static) time point (requirement 1). The goal of the visualisation was to provide a broad overview of how a site performed against an indicator associated with quality of care, and enable sites to compare their result with others in the specified reporting period. For this, participants were asked to preference simple bar charts, waterfall charts and funnel plots.
Indicators with more than one outcome of interest at a static time point (requirement 2). The goal of the visualisation was to provide a broad overview of how a site performed against an indicator with multi-dimensional outcomes, and enable sites to compare their result with others in the specified reporting period. For this, participants were asked to preference scatter-plot, eclipse chart, bubble chart and radar chart.
Indicators showing change over time (requirements 3 and 4). The goal of visualisation was to evaluate if the site’s performance is improving/deteriorating over particular reporting periods. For this, participants were asked to preference box-plots, line-plots, time-series, sequential probability ratio test (SPRT) and dual y-axes time-series.
Other questions in the survey included display options for a dashboard as a summary of performance (requirement 5). The goal of the dashboard was to provide an overview, ‘one-page summary’ of how the site performed across all indicators associated with quality clinical care. This included comparing the site’s result in the current reporting period against previous reporting period and how the site performed in comparison with others. For this, participants were asked to preference traffic light and heat map.
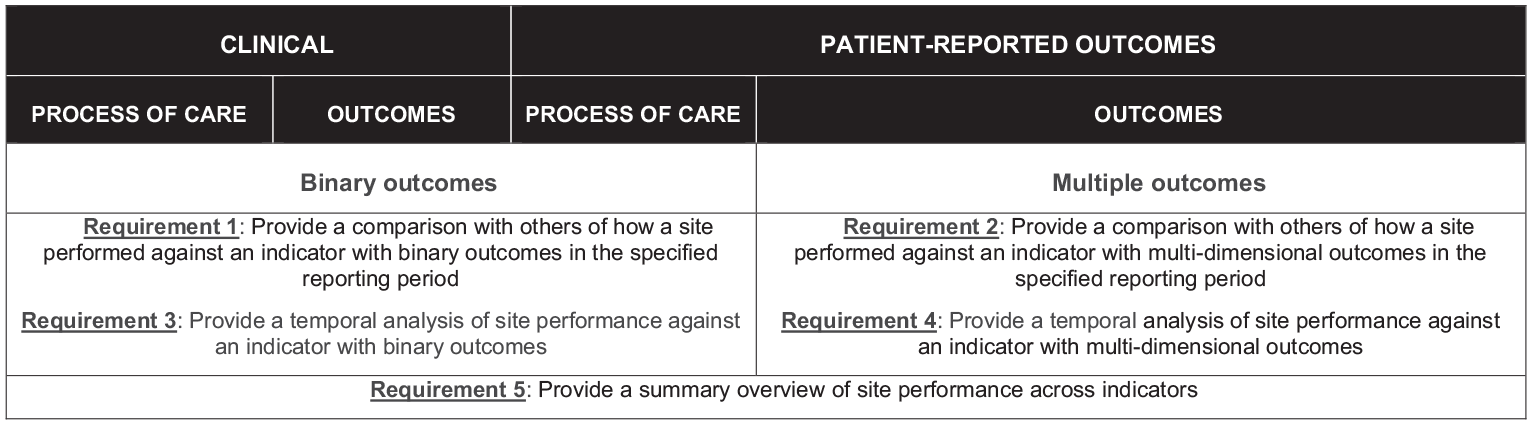
Requirements of the data presentation for the TrueNTH Global Registry Quality of Care report.
Reports were adapted to cater to TNGR stakeholder requirements from reporting at a local level to a country wide level (an LDC-level, a participating site-level or a country level).
Consultation sessions to develop reports
Survey results were used to assist in developing a template quality of care report and inform the consultation process. In total, 11 consultation sessions were undertaken with members of the expanded working group to further inform the final report. Participants of both workshops and subsequent consultation sessions are outlined in Supplemental File 3b. Consultation meetings were held after core sections of the report were developed. Each consultation meeting was held over 1 hour via videoconference. The developing work was provided in advance of each meeting and members were asked to either provide feedback in advance of, or during the meeting. Core questions addressed at these meetings related to the interpretability of the data displays, layout of the report and the text used in the report.
Statistical analysis
Two methods were used to analyse the survey results. For survey questions which the participants had to select one preference among all the given options, percentages of respondents’ selected individual graphical display were calculated. For the survey questions in which the participants were asked to compare graphical displays to each other and rank them in order of preference, the average score was calculated by applying largest weight to the respondent’s most preferred display and the least weight to their least preferred display.
Ethics approval
The development of quality indicators is a component of the TrueNTH Global Prostate Cancer Outcomes Registry approved by the Alfred Health Human Research Ethics Committee (HREC/16/Alfred/98) Protocol version 2.0 (7 September 2017).
Results
Survey 1 achieved an 83% response rate (5 clinicians/5 non-clinicians) and survey 2 achieved a 93% response rate (17 clinicians/18 non-clinicians).
Types and frequency of reporting
Clinician and non-clinician views differed regarding the health system level to which reporting should be delivered. While most non-clinicians preferred reporting at participating site-, LDC- and country-level, clinicians did not feel country-level reporting was necessary, as some countries only comprised of one LDC/site and thus would misrepresent the data. There was consensus that to avoid reporting bias, the quality indicator report should provide information on the completeness of data used to generate the indicators.
Most working group participants indicated a preference for registry contributors to receive reports every 6 months to align with the TNGR data submission period and that time series reporting should include data aggregated over a 3-year reporting period.
Report output
Dashboard
Consensus was reached on the creation of a dashboard to provide an overview of each of the 33 quality indicators and completeness of the reporting of data elements used in the indicators. A performance summary chart was used in the dashboard to provide a visual summary of the site’s performance and how the performance in the current reporting period compared with that in the previous report.
Each quality indicator in the performance summary chart demonstrates the unit of measure (participating site/LDC) in relation to the population minimum, first quartile, median (second quartile), third quartile, maximum and an aspirational target (determined using the Aspirational Benchmarks of Care approach described by Kiefe et al. 9 ). Figure 2 shows the ‘How to Interpret the Performance Summary Chart’ section of the report where readers are given guiding information on how to read and interpret the plots that appear in the report.
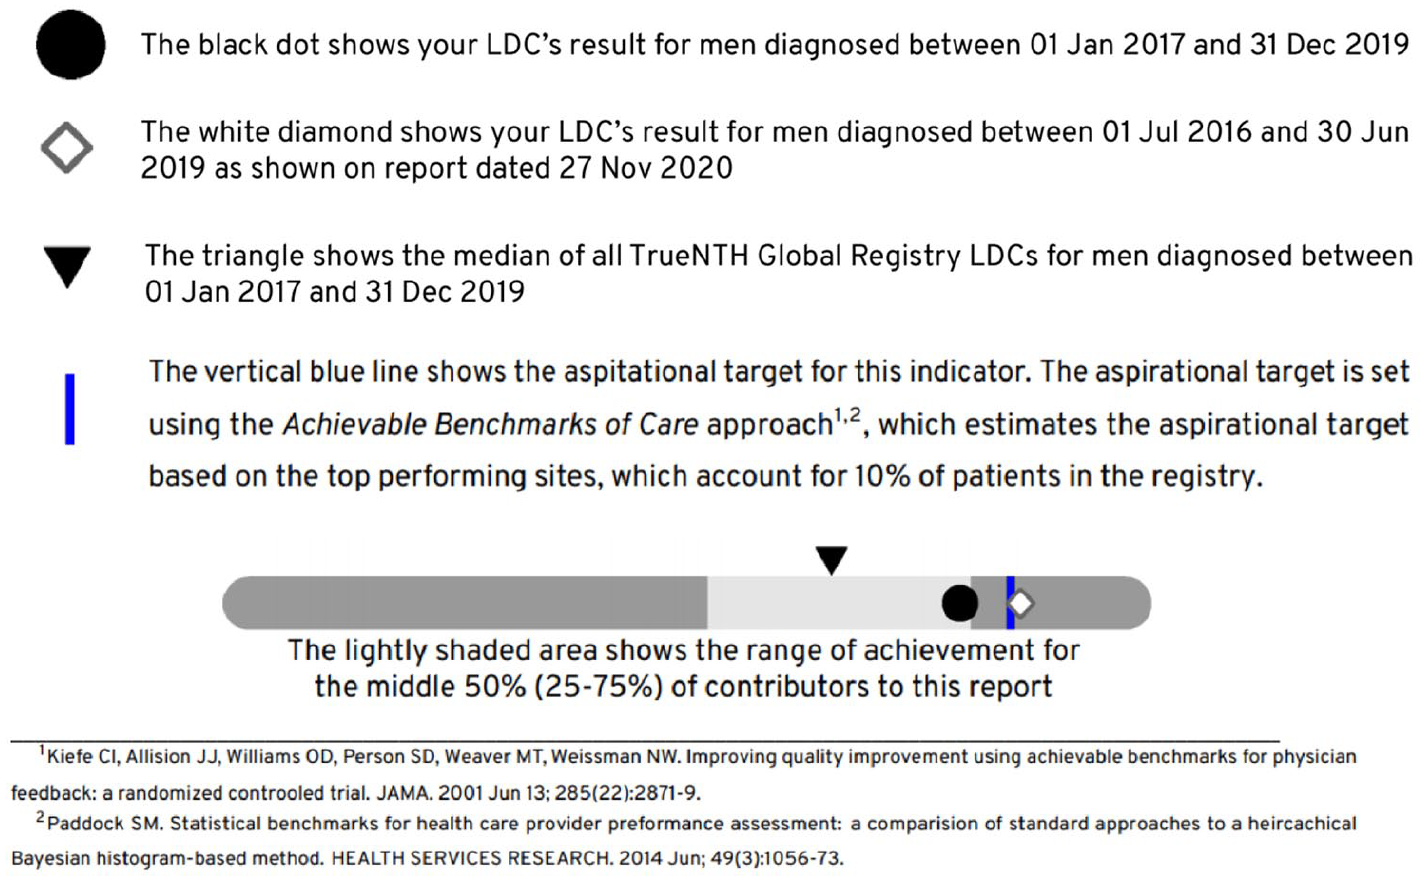
Performance summary charts were used in the TrueNTH Global Registry report to provide a basic overview of an LDCs’ performance for each quality indicator in relation to the population minimum, first quartile, median (second quartile), third quartile, maximum and an aspirational target.
Static reports displaying performance of quality indicator as binary outcomes
Funnel plots with control limits at 95% and 99.8% were preferred above other charts such as a bar chart, a line chart or box and whisker plot to display quality indicators with binary outcomes (Figure 3).
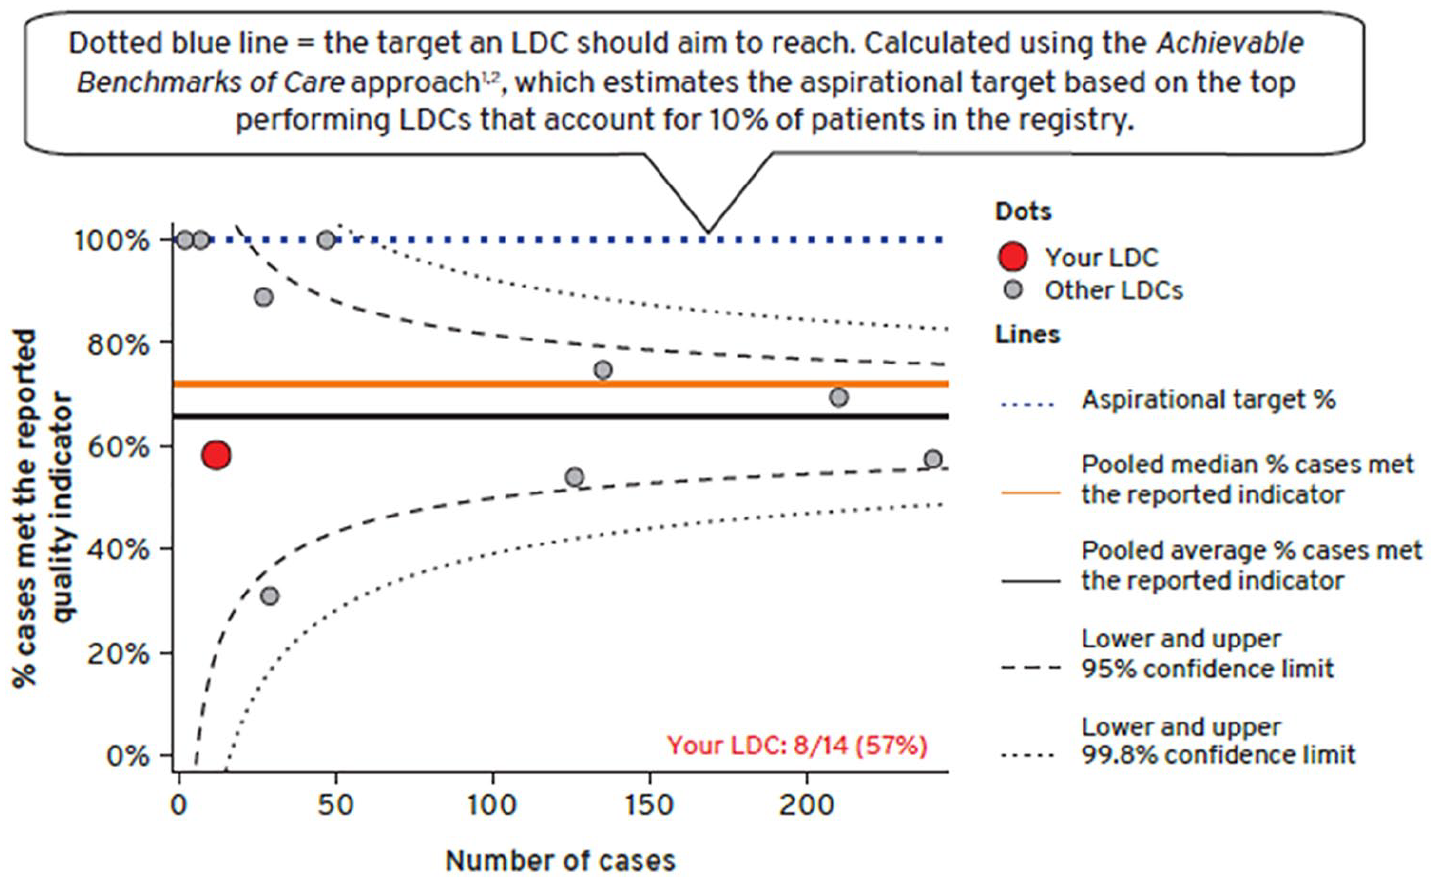
Funnel plot was used to convey an LDCs’ performance for each quality indicator in comparison to all other LDCs’ over a 3-years reporting period.
Static reports displaying performance of quality indicator for multiple outcomes
A bubble plot was preferred by the working group to display the multiple outcomes of interest in one chart. The bubble plot displayed the sexual, urinary and bowel domains individually. The function scores were displayed on one axis and the extent to which men were bothered by their symptoms on the other axis. The size of the bubble corresponded to the volume of survey responses received by the unit contributor, relative to the overall population. The plot was divided into four quadrants, where contributors who performed above their peers’ average (better domain function score and lesser number of mens who reported moderate/big problem) were positioned in the right upper quadrant (Figure 4). Some of the respondents expressed concern that radar charts 10 would not be easily grasped by the registry audience. The use of confidence ellipses was also not highly preferred.
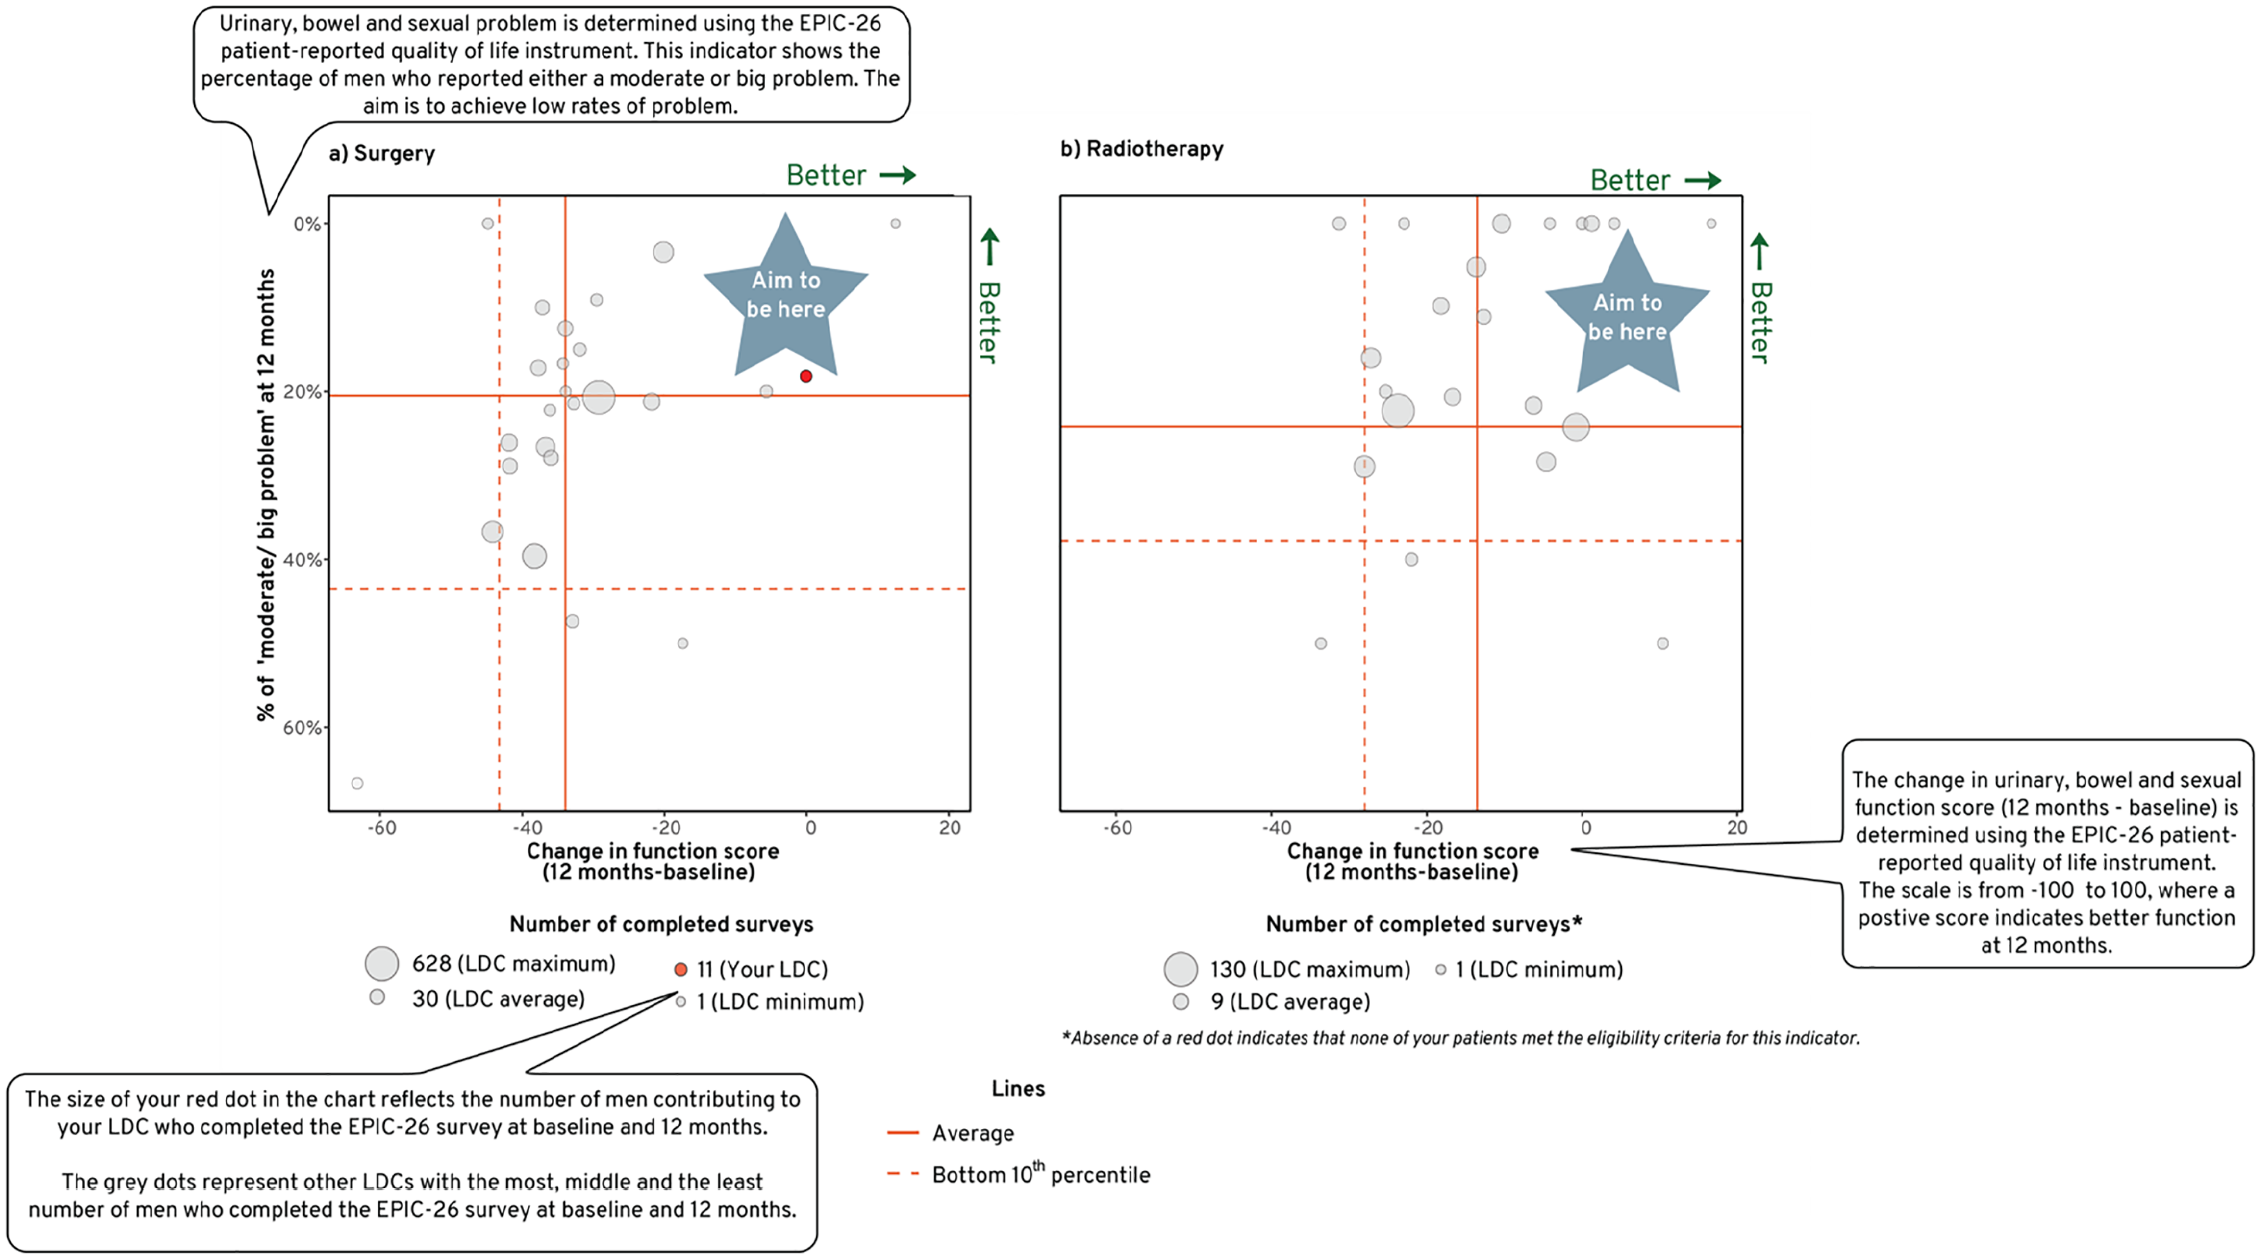
Bubble plot was used to convey an LDCs’ performance for sexual, urinary and bowel function scores and the extent to which men contributing to that LDC were bothered by their symptoms in comparison to all other LDCs’ over a 3-years reporting period.
Reports displaying change in performance of quality indicator over time
The purpose of a clinical quality registry program is to provide a platform for healthcare providers to monitor their performance over time whilst allowing them to compare their outcomes with others, or to external benchmarks. Viewing how performance measures change over time can reveal a story that cannot be seen in a static chart.
To accommodate this need, time-series figures were added to each indicator to show a site’s performance (relative to the population’s) in meeting the quality indicators over time (Figure 5). Some members of the working group expressed concern with presenting a sequential probability ratio test (SPRT) chart 11 due to the excessive complexity in its interpretation. Consensus was reached to aggregate 3 years of reporting period at 6 monthly intervals and to present 95% confidence interval to each time point to account for variability and precision in the data (Figure 5).
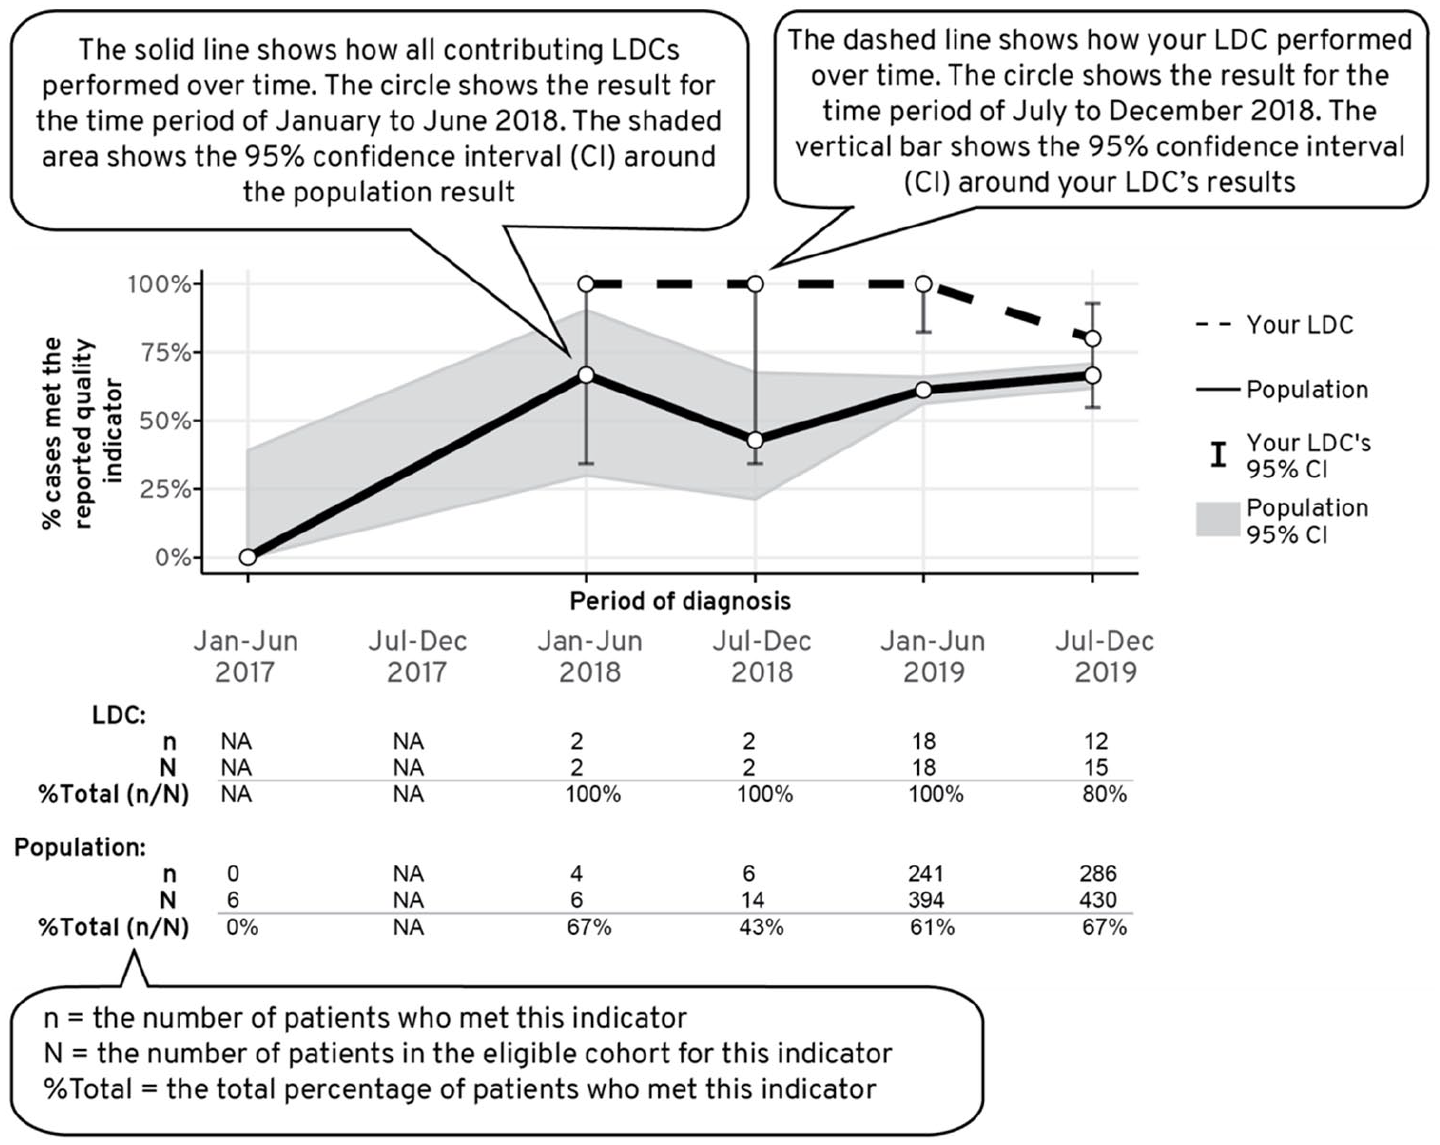
Time series chart was used to convey how a LDCs’ performance for each quality indicator varied across time in comparison to the population average.
In terms of reporting multiple outcomes over time, the dual y-axes time series was initially considered. Function score was presented in the primary y-axis, the extent to which men were bothered by their symptoms was presented in the secondary y-axis and the period of follow up was presented on the x-axis. However, at the subsequent consultation session, the expanded working group noted that the graph suffered from ‘information overload’ and advised to present each outcome as an individual time series.
The reporting development platform
Most respondents indicated a preference for an interactive report. However, given the size of the project (>100 participating sites); consideration of time to set up a reporting platform which enables each LDC/site to visualise their own performance in comparison to other anonymised contributors; and expense in licencing subscription for commercial Business Intelligence solutions, a decision was made not to develop an interactive format in the early stages of the project.
R was selected as the software program in which to develop the reports, principally because of its excellent analytic and graph display capacity, open source licencing model and the large global community of developers and users sharing code to enhance the program. The use of R Markdown provided a versatile document framework that can combine multiple coding languages (e.g. R, Python, STAN) and authoring languages (e.g. LaTeX, HTML). This allows for data to be processed, analysed, visualised and compiled in an accessible document format such as portable document format (pdf), HTML or word. In our case, it enabled generation of reports in a pdf, which allowed creation of paged and printable reports combining text and static graphs. Reports were typeset by embedding the LaTeX authoring language in the document, which enabled a versatile yet reproducible way of adhering with industry (Movember) style guideline.
Report development
The initial phase of report generation involved obtaining a database extract which was read, filtered and formulated into quality indicator scores using R scripts (Figure 6). Indicator-specific inclusion and exclusion criteria were used to identify the denominator of men eligible for each quality indicator during a defined period. The rate of performance for each unit (participating site/LDC) was presented as the proportion of eligible men attributed to that unit in the denominator who met criteria for the quality indicator (e.g. men contributing to an LDC/ a participating site who had PSA level documented at diagnosis over a 3-year period).
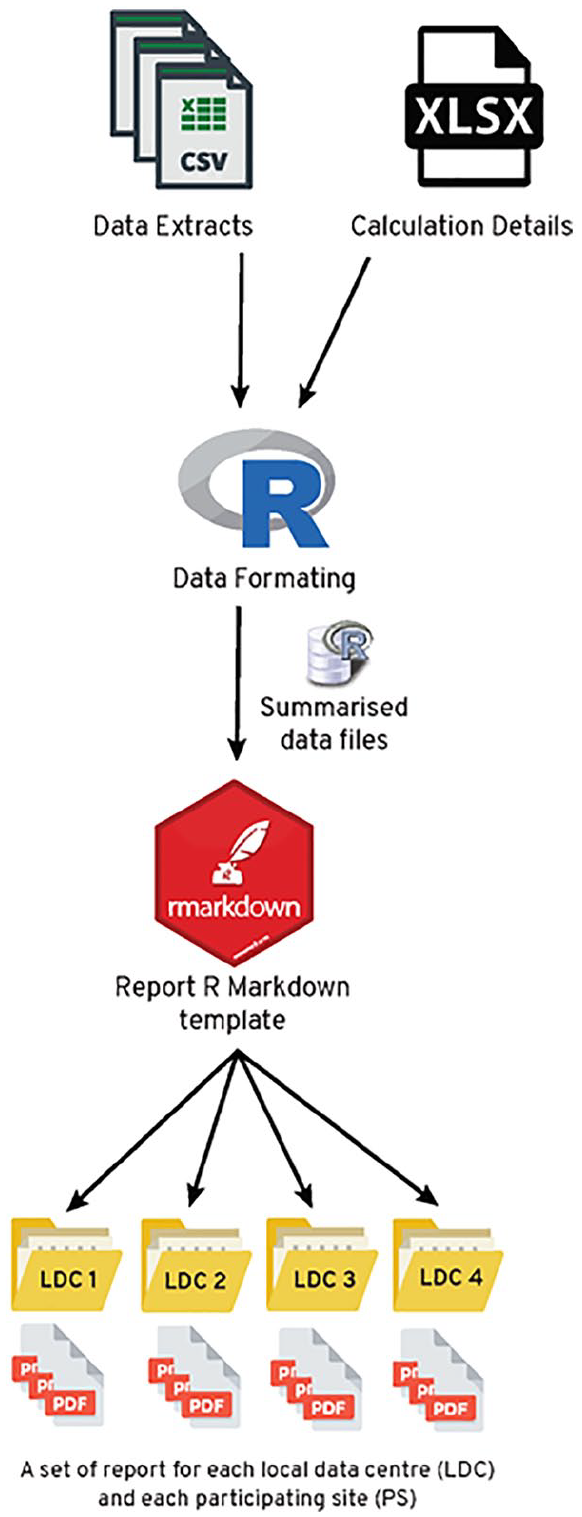
The workflow for generating quality indicator reports in R. Data is mapped to calculation details for each quality indicator and formatted (i.e. summarised) for use within the plots of the report. Within an R Markdown template, data, text, tables and plots are dynamically generated for each LDC/site.
Aggregated data (numerator and denominator for each quality indicator) were used to generate tables and figures within R codes in the R Markdown document. These figures were formatted alongside dynamic descriptions, titles and statistics that were mapped from spreadsheets (Calculation Details.xlsx in Figure 6) accessible to collaborators external to the R Markdown interface.
Once data were formatted from the raw data to summarise data frames, they were exported to the R Markdown template; here they dynamically filled tables, plots and text sections with results specific for the LDC/site. The report was then rendered into a pdf that was customised to a given LDC/site.
Developing design features and dissemination strategy
A number of design strategies were implemented to enhance the clarity of the report. An explanation of how to interpret each chart was incorporated at the front of the report. Colour-coded side banners were added to pages to correlate with the subheadings banner in the dashboard (Figure 7). Funnel plots within individual indicator were constructed uniformly to reflect good performers at the top and the poor performers at the bottom. Similarly, the working group preferred having unidirectional performance summary charts in the dashboard which demonstrated better score as a contributor’s dot moved to the right.
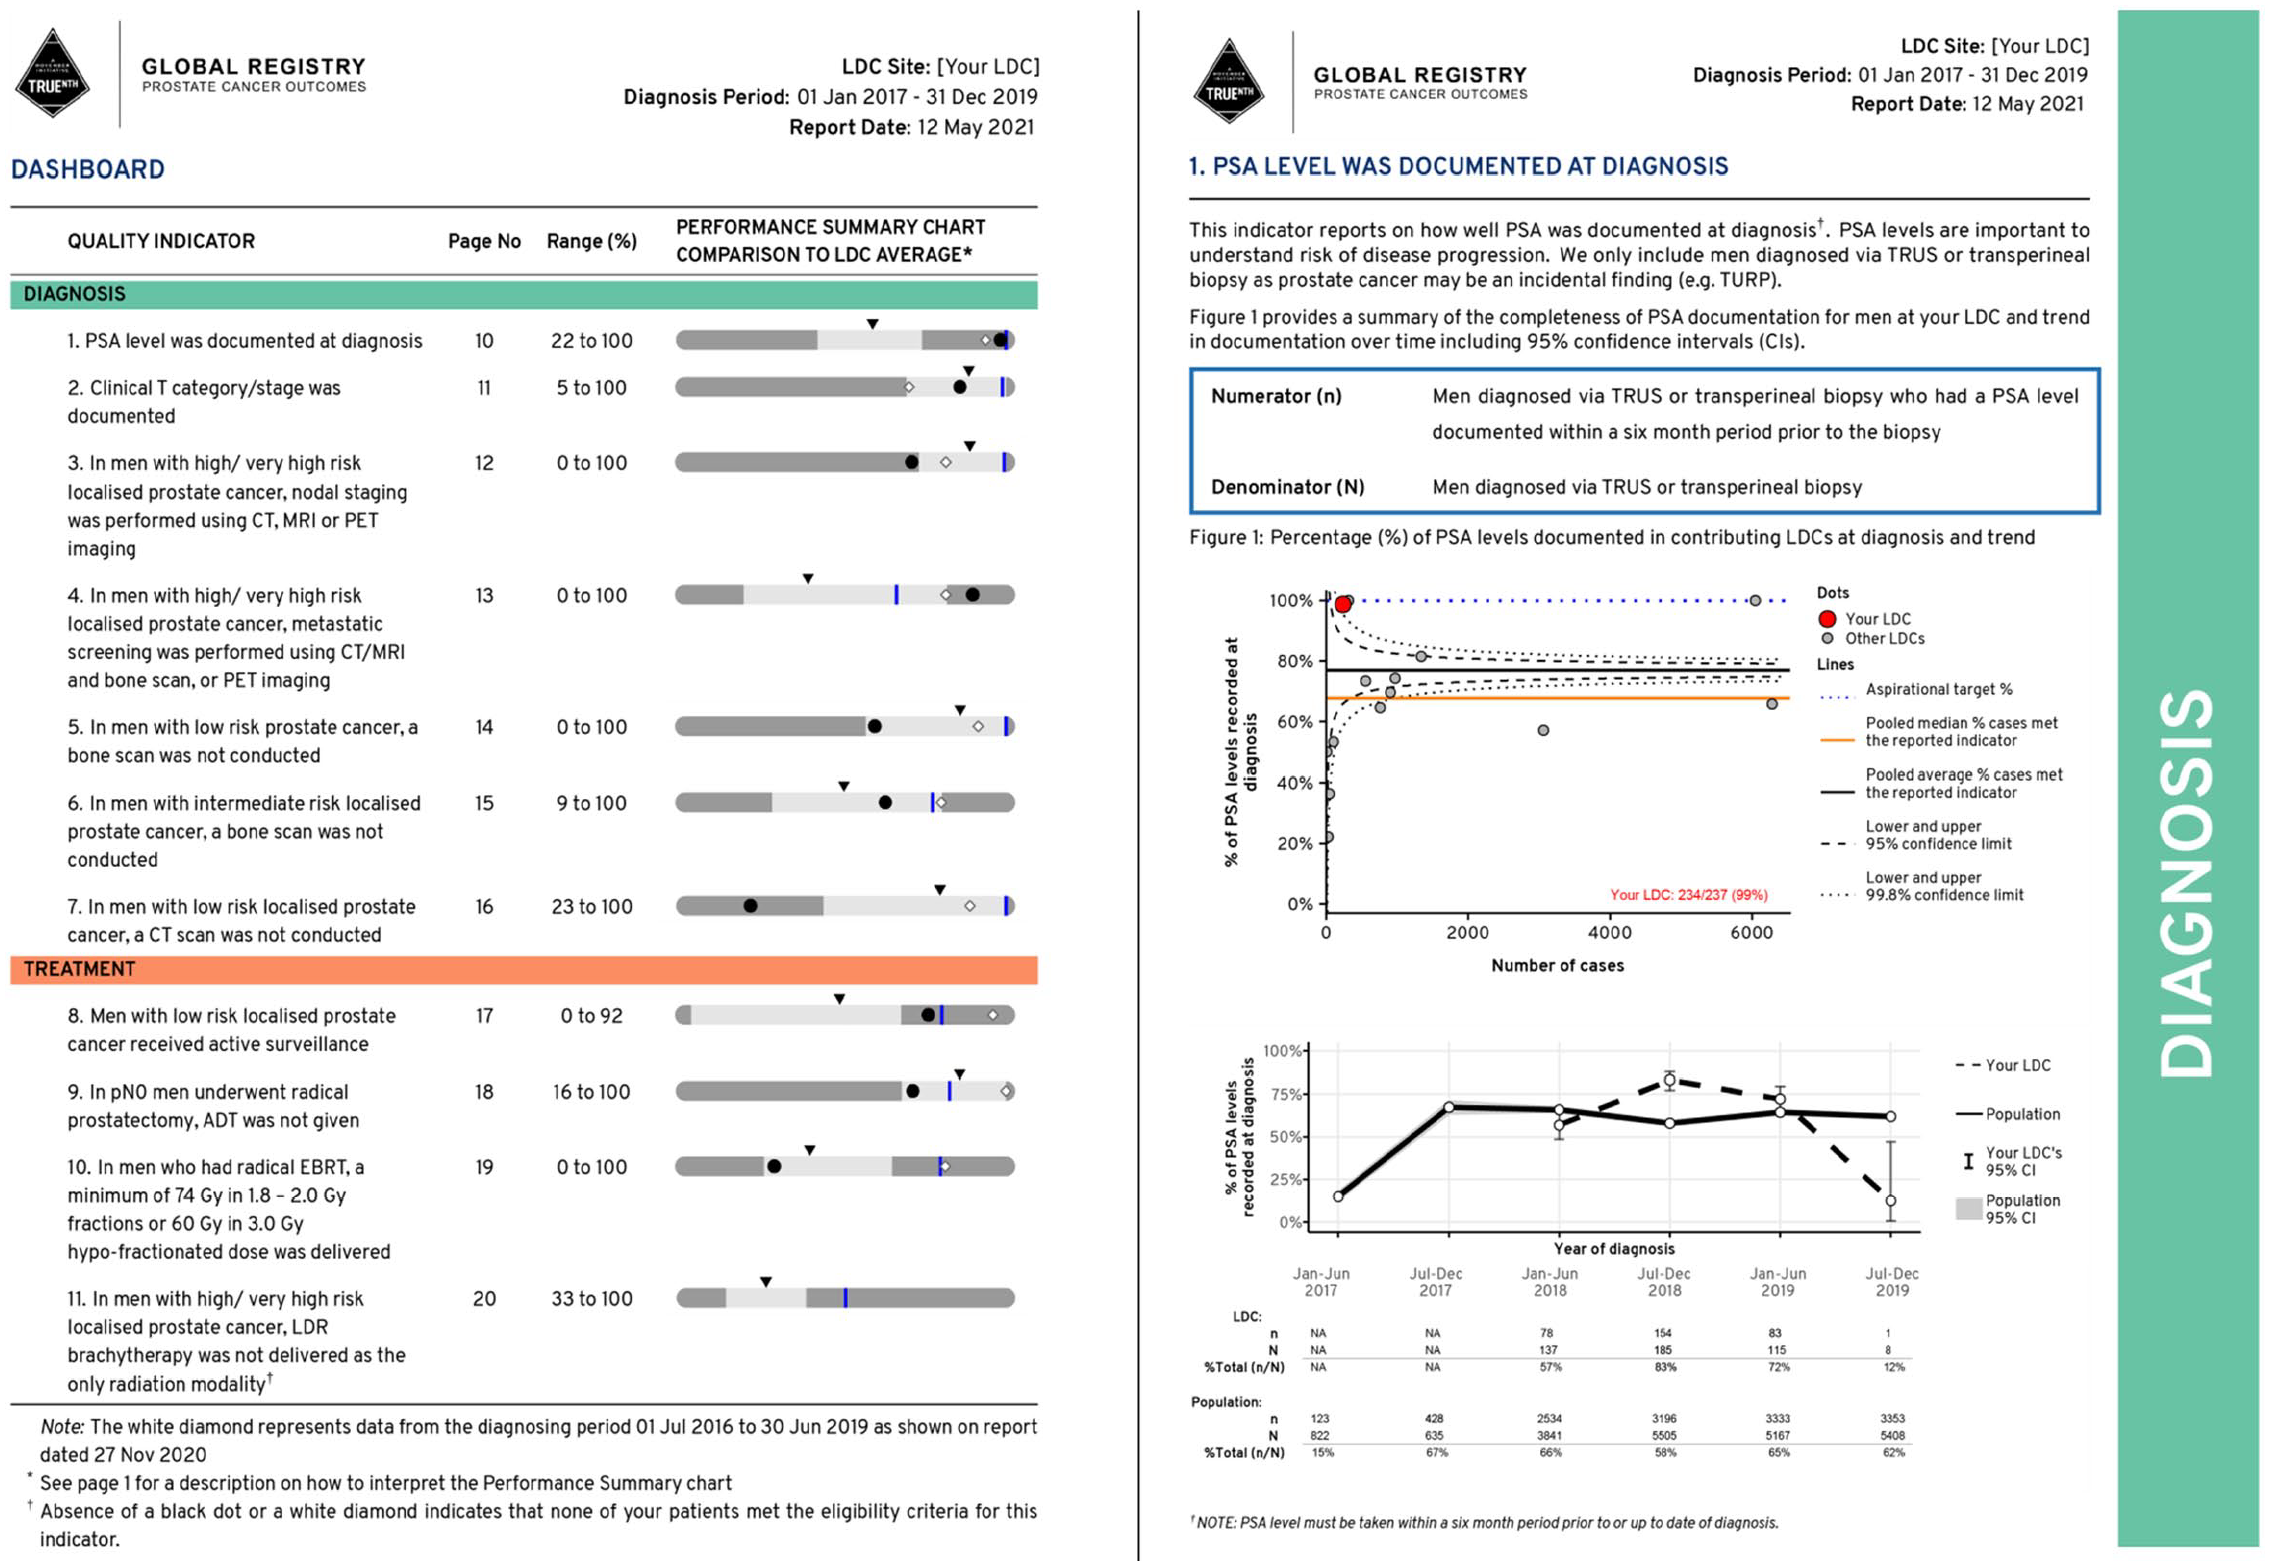
An example of the TrueNTH Global Registry dashboard and the main report page.
Report deployment
A ‘Report’ page was added to the TrueNTH Global Registry data submission portal 3 which allowed authenticated users to download reports. Logics to manage access to files based upon LDC membership and email notification system to send emails to LDC users when a new report became available were created. LDC users also required to re-enter password to download their reports. TNGR administrators are able to log into the TNGR web portal to view activity in terms of report download by the LDC users.
Question and answer sessions were also held to provide opportunity for registry data managers and principal investigators to explore the reports and to ask questions. A ‘frequently asked question (FAQ)’ page was created as a reference point for registry data managers. This page also contains information on indicator-specific inclusion and exclusion criteria and is accessed via the TrueNTH Global Registry data submission portal. 3
Discussion
Clinical quality registries provide regular feedback to individual providers with a view to developing best practices with respect to particular areas of care, 12 reduce unwarranted variation and assist with implementation of practice changes. 1 Despite their vast potential, reporting methodology and feedback mechanism vary considerably across registries and their impact has not been fully realised.13–16 Choosing the appropriate method of data presentation is essential to ensure that valid and accurate interpretations are made regarding the performance measure. Conversely, reports including poorly-selected data presentation can convey misleading information.
Funnel plots with control limits at 95% and 99.8% were selected for use by TNGR to present quality indicators with binary outcomes. Although not as widely used as league charts,13,15,17 funnel plots accounted for varying provider’s volume which suited the longitudinal nature of the registry. It should be noted that there were dissenting views on the use of control limits, with some participants feeling that inference was of little value in this setting and that use of control limits favours low volume providers, who are less likely to fall outside the control limits for a given level of suboptimal performance.
A study by Schmidtke et al. 18 demonstrated that participants were likely to identify outliers when using funnel plots when compared to league charts. Being able to accurately identify the outlying data may motivate efforts by healthcare providers to reflect and instigate improvements in their local practice. Insufficient provider’s volume and low event rates could compromise the precision of estimates of true underlying performance. A previous study examining surgical mortality as an indicator of hospital quality demonstrated that combining 3 years of data was considered sufficient for institution-level measures. 19 However, it is acknowledged that the volume performed in an arbitrary 3-year period by a provider is different for different medical conditions and for very high-volume interventions shorter periods are appropriate.
Scatter plots 20 and radar charts 10 have been used successfully by others to report multi-dimensional aspects of care. A previously published study plotted physician adherence to indicators in a bubble plot to motivate physicians’ performance in adhering to guidelines for management of colorectal cancer. 21 In this study, the standard error for individual adherence performances was expressed as a bubble. In our report however, the bubble represented the population size of each LDC/site. Given the variability in how a bubble plot may be used across clinical practices, information and training are required to avoid misinterpretation of information.
The time-series graphs were seen as providing important information to supplement the static charts. Approaches used by existing registries varied widely, ranging from box plots of annual performance measures, 13 bar charts broken down by quarterly performance measures, 17 to more sophisticated statistical process control charts.22,23 Sequential monitoring using control charts has been shown to be more sensitive than funnel plot as it displayed details of the history of outcomes at a particular LDC/site and thus, facilitated an early detection of outliers. 23 It uses a cumulative log scale on the y-axis and time on the x-axis. The TNGR working group preferred simple time-series to SPRT charts because the y-axis showed an event rate (e.g. positive margin rates) which was easy for clinicians to interpret.
There is overwhelming evidence that performance feedback improves adherence to process guidelines and health outcomes.24,25 The data specifically referencing dashboards as the mechanism of performance feedback, compared to reports or interactive systems, is less clear. This may be because what defines a ‘dashboard’ compared to other forms of feedback is open to debate. The TNGR quality of care report incorporated the dashboard performance summary chart to provide a snapshot of contributor’s performance in regard to quality indicators. In the absence of an acceptable international benchmark,13,14 the TNGR adopted the Achievable Benchmarks of Care. 9
Timely and routine feedback enables health providers to systematically monitor their quality of care. Diversity in the frequency of reporting is evident across clinical quality registries. Some registries provided hospital-level data to participating sites every 3 months,12,15 others every 6 months 26 and others annually. 13 In TNGR, quality of care reports are distributed to participating countries every 6 months to align with the TNGR data submission period. This approach enabled each performance measure to be reported based on the most up-to-date data.
Strengths and limitations
There are several limitations when designing and implementing a quality of care report for the TNGR. There is inevitably a subjective aspect to the selection of the data presentation based on the level of expertise and personal experience of the working group participants. Variation in graphical attributes within the questionnaire such as colour, line style and other design patterns may potentially confound the results of participants’ preferences. It is acknowledged that with a different composition of working group, the selected data presentations could have been significantly altered. Comprehension of quality of care reports by diverse audiences is paramount to the success of a registry quality improvement program.27–29 As the TNGR quality of care report is published exclusively in English, this may limit the ability of a non-native English-speaking audience to communicate the results to their local practitioners. A number of strategies were implemented to mitigate this issue. Feedback on the language and terms used in the reports was sought from our international contributors including those who came from non-English speaking background. We also added interpretation text, colour coded report sections and provided user guides.
The strength of this project includes the heterogeneity of our working group participants, bringing important local perspectives and experience to discussion. There were inevitably dissenting views among working group members. Finding the balance between simplicity and statistical fidelity was echoed throughout workshops and the subsequent consultation meetings. Data presentation must be easy to interpret with consideration that not all stakeholders are well versed in statistics, but data presentation cannot be oversimplified to prevent misinterpretation of LDCs/sites performance.
The working group members were also engaged throughout stages of report development to further modify layout, text, colour schemes and figures, particularly as reports progressed from theoretical models to those containing real data from contributing sites. As the TNGR is still in its infancy, we are unable to sufficiently quantify if this report will improve outcomes. However, to our knowledge, this is the first registry which strives to improve prostate cancer care globally by using a consistently defined international dataset.
Future proposed activity
As the registry matures, evaluation of the existing designs will be undertaken to identify usability problems/barriers, utilizing tools such as user experience evaluation questions by Lam et al. 30 A translational research action plan will also be developed and implemented to prioritise variances that need to be addressed. In addition, future implementation studies to assess the effectiveness of strategies to facilitate adherence and the impact of adhering to the evidence-based recommendations may also be carried out.
Conclusion
Data visualisation plays an integral role in communicating information derived from registry to healthcare providers. To enhance its effectiveness, performance measures should be reported in a comprehensive, concise and easy-to-understand manner to allow rapid identification of trends and outliers while adapting a scientifically sound data display technique. Using an R Markdown framework, we developed a registry report system that would produce multiple dynamic pdf reports that provide user-specific feedback to data managers and participating countries. We provide feedback through visualisation of a contributor’s success rate in completing 33 quality indicators in comparison to other anonymised contributors. The TNGR quality of care and data completeness reports have undergone rigorous consultations during development. The TNGR performance metrics will be regularly re-evaluated to ensure continued validity and accuracy.
Supplemental Material
sj-pdf-1-jhi-10.1177_14604582211015704 – Supplemental material for Establishing a global quality of care benchmark report
Supplemental material, sj-pdf-1-jhi-10.1177_14604582211015704 for Establishing a global quality of care benchmark report by Fanny Sampurno, Justin Cally, Jacinta L Opie, Ashwini Kannan, Jeremy L Millar, Antonio Finelli, Andrew J Vickers, Caroline M Moore, Christoph Kowalski, Claire Foster, Dan A Barocas, David Galvin, Jean-Paul Van Basten, John L Gore, Julia Ferencz, Keith A Lawson, Khurshid R Ghani, Lorna Kwan, Olli Saarela, Sarah E Connor, Sebastian Dieng, Susan Linsell, Timo FW Soeterik, Paul Villanti, Mark S Litwin and Sue M Evans in Health Informatics Journal
Supplemental Material
sj-pdf-2-jhi-10.1177_14604582211015704 – Supplemental material for Establishing a global quality of care benchmark report
Supplemental material, sj-pdf-2-jhi-10.1177_14604582211015704 for Establishing a global quality of care benchmark report by Fanny Sampurno, Justin Cally, Jacinta L Opie, Ashwini Kannan, Jeremy L Millar, Antonio Finelli, Andrew J Vickers, Caroline M Moore, Christoph Kowalski, Claire Foster, Dan A Barocas, David Galvin, Jean-Paul Van Basten, John L Gore, Julia Ferencz, Keith A Lawson, Khurshid R Ghani, Lorna Kwan, Olli Saarela, Sarah E Connor, Sebastian Dieng, Susan Linsell, Timo FW Soeterik, Paul Villanti, Mark S Litwin and Sue M Evans in Health Informatics Journal
Supplemental Material
sj-pdf-3-jhi-10.1177_14604582211015704 – Supplemental material for Establishing a global quality of care benchmark report
Supplemental material, sj-pdf-3-jhi-10.1177_14604582211015704 for Establishing a global quality of care benchmark report by Fanny Sampurno, Justin Cally, Jacinta L Opie, Ashwini Kannan, Jeremy L Millar, Antonio Finelli, Andrew J Vickers, Caroline M Moore, Christoph Kowalski, Claire Foster, Dan A Barocas, David Galvin, Jean-Paul Van Basten, John L Gore, Julia Ferencz, Keith A Lawson, Khurshid R Ghani, Lorna Kwan, Olli Saarela, Sarah E Connor, Sebastian Dieng, Susan Linsell, Timo FW Soeterik, Paul Villanti, Mark S Litwin and Sue M Evans in Health Informatics Journal
Supplemental Material
sj-pdf-4-jhi-10.1177_14604582211015704 – Supplemental material for Establishing a global quality of care benchmark report
Supplemental material, sj-pdf-4-jhi-10.1177_14604582211015704 for Establishing a global quality of care benchmark report by Fanny Sampurno, Justin Cally, Jacinta L Opie, Ashwini Kannan, Jeremy L Millar, Antonio Finelli, Andrew J Vickers, Caroline M Moore, Christoph Kowalski, Claire Foster, Dan A Barocas, David Galvin, Jean-Paul Van Basten, John L Gore, Julia Ferencz, Keith A Lawson, Khurshid R Ghani, Lorna Kwan, Olli Saarela, Sarah E Connor, Sebastian Dieng, Susan Linsell, Timo FW Soeterik, Paul Villanti, Mark S Litwin and Sue M Evans in Health Informatics Journal
Supplemental Material
sj-pdf-5-jhi-10.1177_14604582211015704 – Supplemental material for Establishing a global quality of care benchmark report
Supplemental material, sj-pdf-5-jhi-10.1177_14604582211015704 for Establishing a global quality of care benchmark report by Fanny Sampurno, Justin Cally, Jacinta L Opie, Ashwini Kannan, Jeremy L Millar, Antonio Finelli, Andrew J Vickers, Caroline M Moore, Christoph Kowalski, Claire Foster, Dan A Barocas, David Galvin, Jean-Paul Van Basten, John L Gore, Julia Ferencz, Keith A Lawson, Khurshid R Ghani, Lorna Kwan, Olli Saarela, Sarah E Connor, Sebastian Dieng, Susan Linsell, Timo FW Soeterik, Paul Villanti, Mark S Litwin and Sue M Evans in Health Informatics Journal
Supplemental Material
sj-pdf-6-jhi-10.1177_14604582211015704 – Supplemental material for Establishing a global quality of care benchmark report
Supplemental material, sj-pdf-6-jhi-10.1177_14604582211015704 for Establishing a global quality of care benchmark report by Fanny Sampurno, Justin Cally, Jacinta L Opie, Ashwini Kannan, Jeremy L Millar, Antonio Finelli, Andrew J Vickers, Caroline M Moore, Christoph Kowalski, Claire Foster, Dan A Barocas, David Galvin, Jean-Paul Van Basten, John L Gore, Julia Ferencz, Keith A Lawson, Khurshid R Ghani, Lorna Kwan, Olli Saarela, Sarah E Connor, Sebastian Dieng, Susan Linsell, Timo FW Soeterik, Paul Villanti, Mark S Litwin and Sue M Evans in Health Informatics Journal
Supplemental Material
sj-pdf-7-jhi-10.1177_14604582211015704 – Supplemental material for Establishing a global quality of care benchmark report
Supplemental material, sj-pdf-7-jhi-10.1177_14604582211015704 for Establishing a global quality of care benchmark report by Fanny Sampurno, Justin Cally, Jacinta L Opie, Ashwini Kannan, Jeremy L Millar, Antonio Finelli, Andrew J Vickers, Caroline M Moore, Christoph Kowalski, Claire Foster, Dan A Barocas, David Galvin, Jean-Paul Van Basten, John L Gore, Julia Ferencz, Keith A Lawson, Khurshid R Ghani, Lorna Kwan, Olli Saarela, Sarah E Connor, Sebastian Dieng, Susan Linsell, Timo FW Soeterik, Paul Villanti, Mark S Litwin and Sue M Evans in Health Informatics Journal
Supplemental Material
sj-pdf-8-jhi-10.1177_14604582211015704 – Supplemental material for Establishing a global quality of care benchmark report
Supplemental material, sj-pdf-8-jhi-10.1177_14604582211015704 for Establishing a global quality of care benchmark report by Fanny Sampurno, Justin Cally, Jacinta L Opie, Ashwini Kannan, Jeremy L Millar, Antonio Finelli, Andrew J Vickers, Caroline M Moore, Christoph Kowalski, Claire Foster, Dan A Barocas, David Galvin, Jean-Paul Van Basten, John L Gore, Julia Ferencz, Keith A Lawson, Khurshid R Ghani, Lorna Kwan, Olli Saarela, Sarah E Connor, Sebastian Dieng, Susan Linsell, Timo FW Soeterik, Paul Villanti, Mark S Litwin and Sue M Evans in Health Informatics Journal
Footnotes
Acknowledgements
We would like to thank Mr Arturo Ramos Santracruz, Ms Anh Tran and Ms. Shu-Yu Tew for their contribution in the development of the TrueNTH Global Registry Quality of Care report. We acknowledged Helix Team at Monash University, Melbourne, Australia in assisting the development of the ‘Report’ page in the TrueNTH Global Registry web portal. This work was also supported by the Monash eResearch Centre and Helix at Monash University and by using the Monash University hosted Secure eResearch Platform (formerly known as Safe Haven).
Author contributions
FS, JC, JLO, AK, JLM: design the work, the acquisition, analysis; SME: design the work, the acquisition, analysis and supervision; all authors: interpretation of data, have substantively revised it and have read and approved the manuscript.
Declaration of conflicting interests
The author(s) declared no potential conflicts of interest with respect to the research, authorship, and/or publication of this article.
Funding
The author(s) disclosed receipt of the following financial support for the research, authorship, and/or publication of this article: This work was supported by the Movember Foundation.
Supplemental material
Supplemental material for this article is available online.
References
Supplementary Material
Please find the following supplemental material available below.
For Open Access articles published under a Creative Commons License, all supplemental material carries the same license as the article it is associated with.
For non-Open Access articles published, all supplemental material carries a non-exclusive license, and permission requests for re-use of supplemental material or any part of supplemental material shall be sent directly to the copyright owner as specified in the copyright notice associated with the article.