
Abstract
Untreated caries is significant problem that affected billion people over the world. Therefore, the appropriate method and accuracy of caries detection in clinical decision-making in dental practices as well as in oral epidemiology or caries research, are required urgently. The aim of this study was to introduce a computational algorithm that can automate recognize carious lesions on tooth occlusal surfaces in smartphone images according to International Caries Detection and Assessment System (ICDAS). From a group of extracted teeth, 620 unrestored molars/premolars were photographed using smartphone. The obtained images were evaluated for caries diagnosis with the ICDAS II codes, and were labeled into three classes: “No Surface Change” (NSC); “Visually Non-Cavitated” (VNC); “Cavitated” (C). Then, a two steps detection scheme using Support Vector Machine (SVM) has been proposed: “C versus (VNC + NSC)” classification, and “VNC versus NSC” classification. The accuracy, sensitivity, and specificity of best model were 92.37%, 88.1%, and 96.6% for “C versus (VNC + NSC),” whereas they were 83.33%, 82.2%, and 66.7% for “VNC versus NSC.” Although the proposed SVM system required further improvement and verification, with the data only imaged from the smartphone, it performed an auspicious potential for clinical diagnostics with reasonable accuracy and minimal cost.
Keywords
Introduction
Untreated caries is historically recognized as being a crucial biological, social, and financial burden on health care systems in general and on patients themselves in particular. 1 Since it is not life-threatening, a number of patients with untreated caries only seek treatment at late stages when serious complications might have already developed and can lead to significant acute and chronic conditions with high cost of treatment. Therefore, early detection of dental caries is an extremely desirable fundamental issue for strategies to prevent dental caries, such as fissure sealants, fluoride remineralization therapies, or other remineralizing products. 2 In order to enhance clinical decision-making in dental practices as well as in oral epidemiology or caries research, an appropriate and accurate method of caries detection is required urgently. 3
In medicine, Artificial Intelligence (AI) has been gradually becoming more popular and widely applied in diagnosing and treating patients more quickly and accurately, it also helps to reduce the risk of complications so that patients can speedy recovery. Among the wide scope of applications, AI has demonstrated magnificent performance in an effort to detect carious lesions in the field of dentistry as well. The majority of prior research has applied Neural Networks to process and analyze different types of dental X-ray images for detection and diagnosis of dental caries. In order to detect caries lesions in bitewing radiographs, Devito et al. 4 developed a multilayer perceptron neural network and concluded that their network improved the diagnostic results by 39.4%, while Srivastava et al. 5 developed Fully Convolutional Neural Networks with the recall, precision, and F1 score were 80%, 61%, and 70%. Yet, the intention of these two methods only closely considered and analyzed X-ray images of dental caries on proximal surfaces. Kositbowornchai et al. 6 generated a neural network to identify artificial carious lesions using images from a charged-coupled device (CCD) camera and intra-oral digital radiography. The sensitivity and specificity of their model were 77% and 85% using CCD images; 81% and 93% using digital radiography. Since the system evaluated artificial caries, which could not represent the characteristics of natural caries lesions, the performance of this method has been assessed only to a limited extent. Ali 7 developed a deep neural network to detect dental caries in X-ray images with accuracy was 97%, but the type of dental X-ray images was not mentioned in this method. In 2018, Lee et al. 8 proposed a deep learning-based convolutional neural network algorithm to diagnose dental caries in periapical radiographic images with high accuracy. The accuracy of their classifier was 89% for premolar, 88% for molar, and 82% for both premolar and molar models. In spite of achieving high sensitivity and specificity detection system, the main drawback of the above methods is that these authors did not refer to caries classification system, which was used to classify carious lesions into different categories. Further, the complex and nonlinear structure of deep neural networks is effective in classification tasks but also inexplicable prediction models.
The dental X-ray images also have their own limitation in diagnosing: bitewing X-ray was not afforded to perspicuously distinguish between sound surfaces, initial caries activity, or early/late cavitated lesions; in panoramic x-ray, the detailed information of each individual tooth is not specific and slightly blurry image can be produced, where caused inaccurate measurements.9,10 Thus, visual-tactile examination, the most widespread diagnostic method for daily clinical practice, is necessary for caries detection. In 2005, ICDAS II (International Caries Detection and Assessment System) criteria were introduced as a scoring system to detect caries lesions and become a helpful diagnostic tool with an evidence-based system for clinicians, caries researchers, and oral epidemiologists.
Clinically, visual-tactile examination was physically made by dentists, so that to assist in visual examination using AI algorithms, digital images were the best choice to analyze teeth surface. With the advancement in technology, digital photographs have been employed in dentistry fields in many different ways. 11 The precise description of caries stages following ICDAS II criteria has helped dental photography become more popular in cariology field.12,13 Through a literature review, the assessments of photographic images as a caries detection method had greater sensitivity than a visual examination on extracted permanent teeth, 3 and using images to diagnose dental caries was not statistically different. 14 A previous study by Umemori et al. 15 concluded that the analysis of digital images of occlusal surfaces can be use as a diagnostic tool for tooth decay with 86% sensitivity and 86% specificity. Unfortunately, only a few AI-related studies in the literature using color photographic images to detect and classify dental caries. Ghaedi et al. 16 proposed an automated method for the detection and scoring of the optical images of tooth occlusal surface with the accuracy, sensitivity, and specificity are 86.3%, 83%, and 91.7% respectively. Berdouses et al. 17 presented an automated caries diagnostic system (ACDS) for the diagnosis of occlusal caries lesions of posterior permanent teeth from photographic color tooth images. The accuracies of this method were 83% (seven classes) and 86% (three classes), while the sensitivity, and specificity 80% and 74% respectively.
In addition, it was reported in the literature that the current recommendation is to employ Digital Single Lens Reflex (DSLR) cameras for dental photography, 18 and obtained digital images were used to diagnose caries lesions as well as other dental diseases.12,13,19 But, due to the professional skills request and special flash set up, DSLR cameras are less convenient to widely apply. Currently, smartphones are not only mobile devices with advanced computing ability and connectivity relative to a contemporary cell phone but also equipped built-in cameras, which allows users to easily take a high-quality picture.20,21 In spite of the fact that application of dental photography has rapidly increased in recent years, research evidence for the advantage of smartphone cameras in oral epidemiology is insufficient.22,23
As mentioned above, Neural Networks are powerful algorithms in classification, but only if you are able to control overfitting problems. Consequently, we propose to use Machine Learning (ML), the robust computational techniques that could detect complicated patterns from large noisy datasets. Several ML algorithms such as tree-based algorithm, K nearest neighbors, Naïve Bayes, Support Vector Machine. . . are reported in the literature to address medical issues. Stanzione et al. 24 employed J48 decision tree alone and in combination with ensemble learning methods for the Prediction of Fuhrman grade in clear cell renal cell carcinoma from MR images. Carlo et al. 25 distinguished functional from non-functional pituitary macroadenomas by texture analysis on MRI images by applying three classifiers (decision tree, Multinomial Logistic Regression (MLR), K nearest neighbor). Moreover, the potential of the ML approach was demonstrated to perform predictive analysis of acuity and variability of eye-positioning using features extracted from oculography by Improta et al. 26 As part of a broader family of ML methods, Support Vector Machines (SVM) has demonstrated excellent performances in analyzing medical data for classification of heart disease by Bhatia et al., 27 cancer genomic by Huang et al., 28 and drug discovery-relevant applications by Heikamp and Bajorath. 29
However, as far as we know, no previous caries research has used smartphone photos as input data for ML models, mostly owing to doubt of the quality of obtained images. We, therefore, considered analyzing caries properties like objects in smartphone color images to investigate whether ML algorithms can accurately recognize and classify caries lesions on occlusal surfaces of extracted teeth based on well-established knowledge of ICDAS II system by choosing SVM algorithm as a preliminary classifier. The solution proposed here addresses only the problem of the new dataset, which was generated by us. Since the obtained images are from the smartphone, the dataset can be easily created without any special technical request for data acquisition, which means possible to enhance the training dataset for further investigation.
Materials and methods
Sample selection
From a group of extracted teeth collected at Hanoi Medical University and National Hospital of Odonto—Stomatology, 620 unrestored molars and premolars teeth were selected, each tooth was numbered from 1 to 620 as their identity. These extracted teeth were cleaned carefully and then stored in thymol to prevent microbial contamination.
Producing images
Each extracted tooth was photographed using a smartphone (Samsung Note 8) within built-in LED light Photobox (40 × 40 × 40 cm) (see Figure 1).
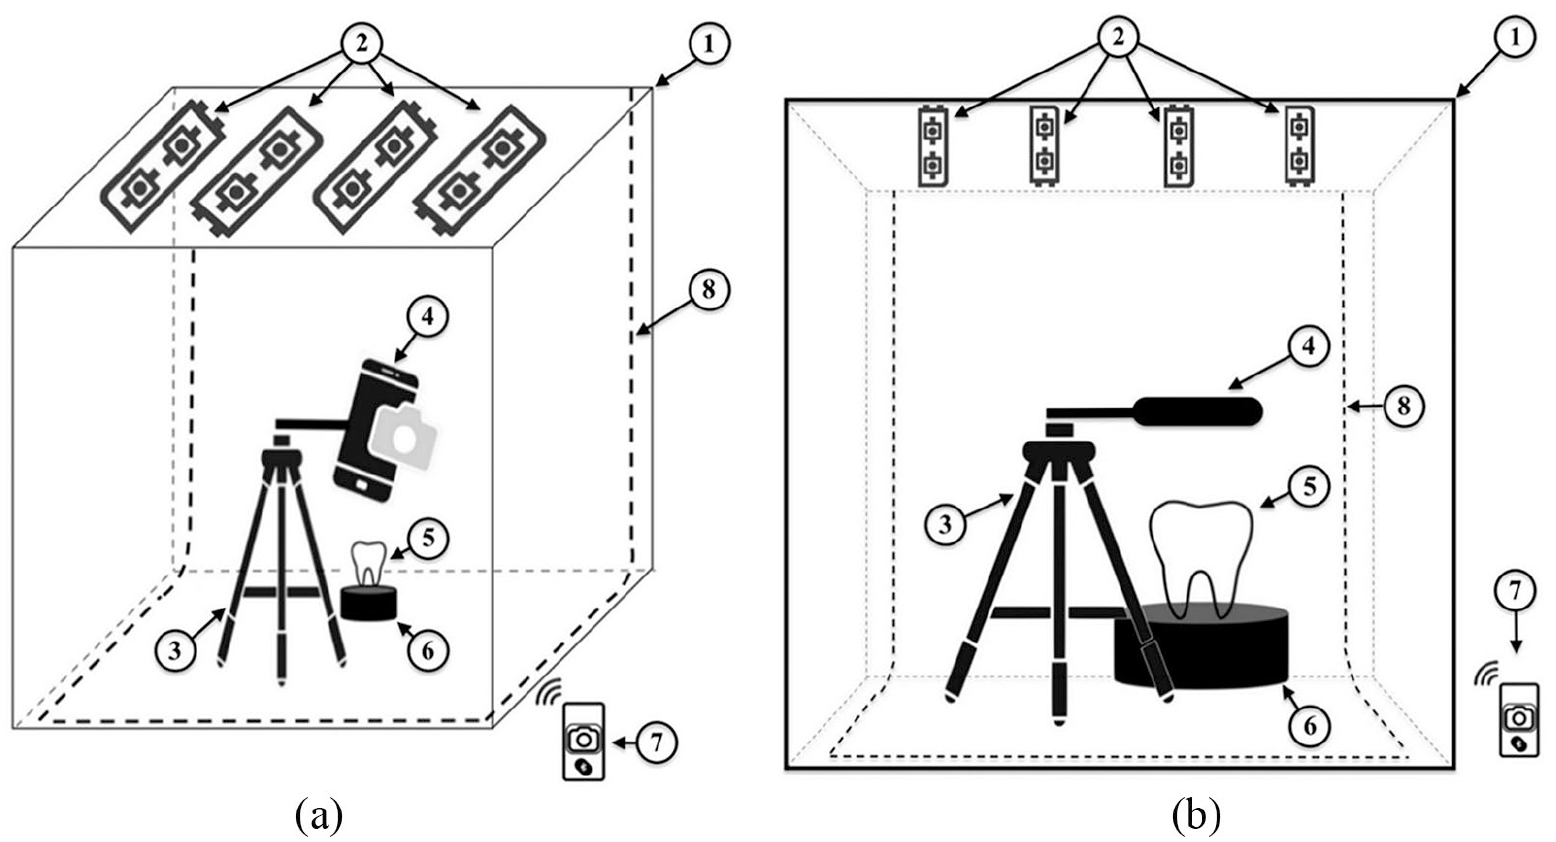
Setup for producing images: (a) side view and (b) front view. 1. Photobox, 2. LED light source, 3. Tripod mount holder stand, 4. Smartphone, 5. Stand base, 6. Teeth specimen, 7. Bluetooth remote control, 8. Black screen backdrop.
Photo assessment
Four dentists were calibrated and trained to ICDAS II examination protocol. After selecting a digital record, each dentist reviewed images and comment on the dentition status for each tooth on a predefined assessment chart. The diagnosis of caries by visual examination of all dentists through images would be reviewed to distinguish differences in evaluation. This procedure would be repeated until an inter-examiner agreement is reached >75%, which was made following discussion. A Kappa value of at least 0.8 would be needed. 30
Labeling dataset
The obtained images were labeled based on diagnosis of four dentists after photo assessment as ground-truth. Due to insufficient data for each code of ICDAS II criteria, we decided to combine it with American Dental Association Caries Classification System, 31 and get the new labels as below:
Sound: Code 0—“No Surface Change.”
Initial: Code 1 + Code 2—“Visually Non-Cavitated.”
Moderate: Code 3 + Code 4—“Early Cavitated.”
Advanced: Code 5 + Code 6—“Late Cavitated.”
We also merged two Code: Moderate and Advanced into “Cavitated” due to the appearance of occlusal surfaces to simplify dataset for model training. Final dataset consists of three classes: “No surface change,” “Visually Non-Cavitated,” and “Cavitated” (see Table 1). This grouping method was also employed by Ghaedi et al. 16 and Berdouses et al. 17
Data attributes.

Image pre-processing
A sequential procedure using OpenCV software package was performed for image processing 32 (see Figure 3).
After pre-processing, a few images appeared to lose a large portion of the occlusal surface and were discarded from the dataset. Therefore, the dataset retained a total of 587 images in which NSC class-73, VNC class-220, C class-294.
Machine learning
SVM learning for classification
Support Vector Machine (SVM), a powerful binary classifier, which was first proposed by Cortes and Vapnik in 1995. 33 Let’s consider, we have a sample dataset:

where xk, feature vector and yk, class label
Training data from two different classes are separated by hyperplane:

At so-called dual space, SVM generates separating hyperplane between two classes of data. Also, it defines a margin on both sides of hyperplane. SVM algorithm transforms problem of “finding best hyperplane” into an optimization problem by minimizing in the following cost function:
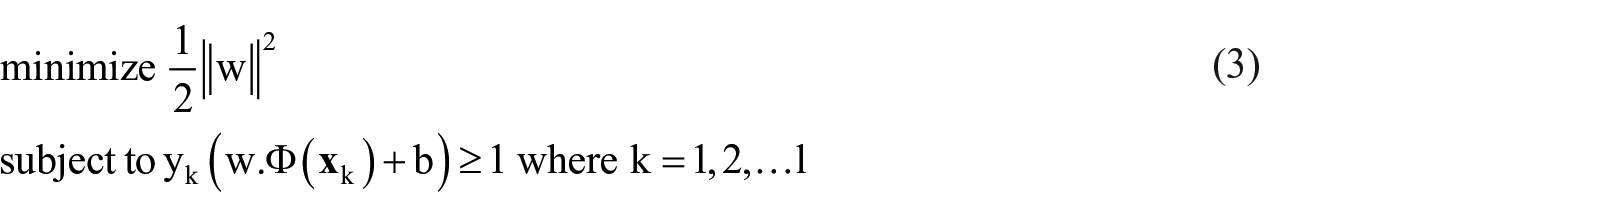
When training data is linearly separable, (3) can be transformed:
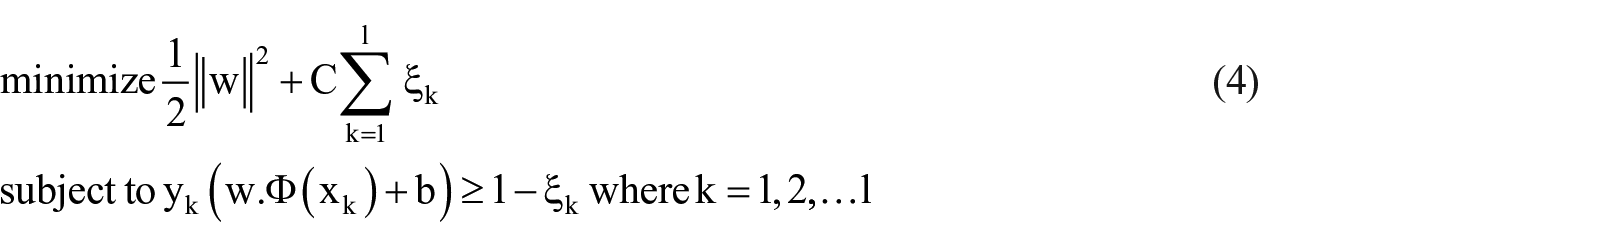
To solve the above optimization problem, by saddle point for the Lagrange multiplier, equation (4) is transformed into dual problem:
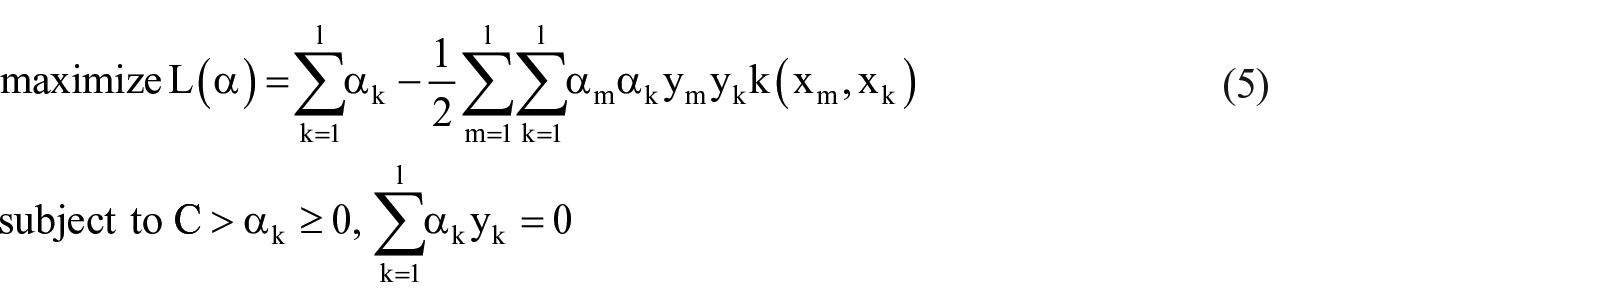
Where kernel—a symmetric function, is defined as:

The decision function, which is determined by solving optimization problem in (5) during training:

In order to perform SVM generalization, there are three hyperparameters that should be well set up: kernel function, kernel parameter, and parameter C. Parameter C specify the tolerance for misclassification, help to manipulate over-fitting of model. And the right decision in choosing kernel function could tremendously affect performance of an SVM model.
The overall workflow of proposed methodology is illustrated in Figure 2.
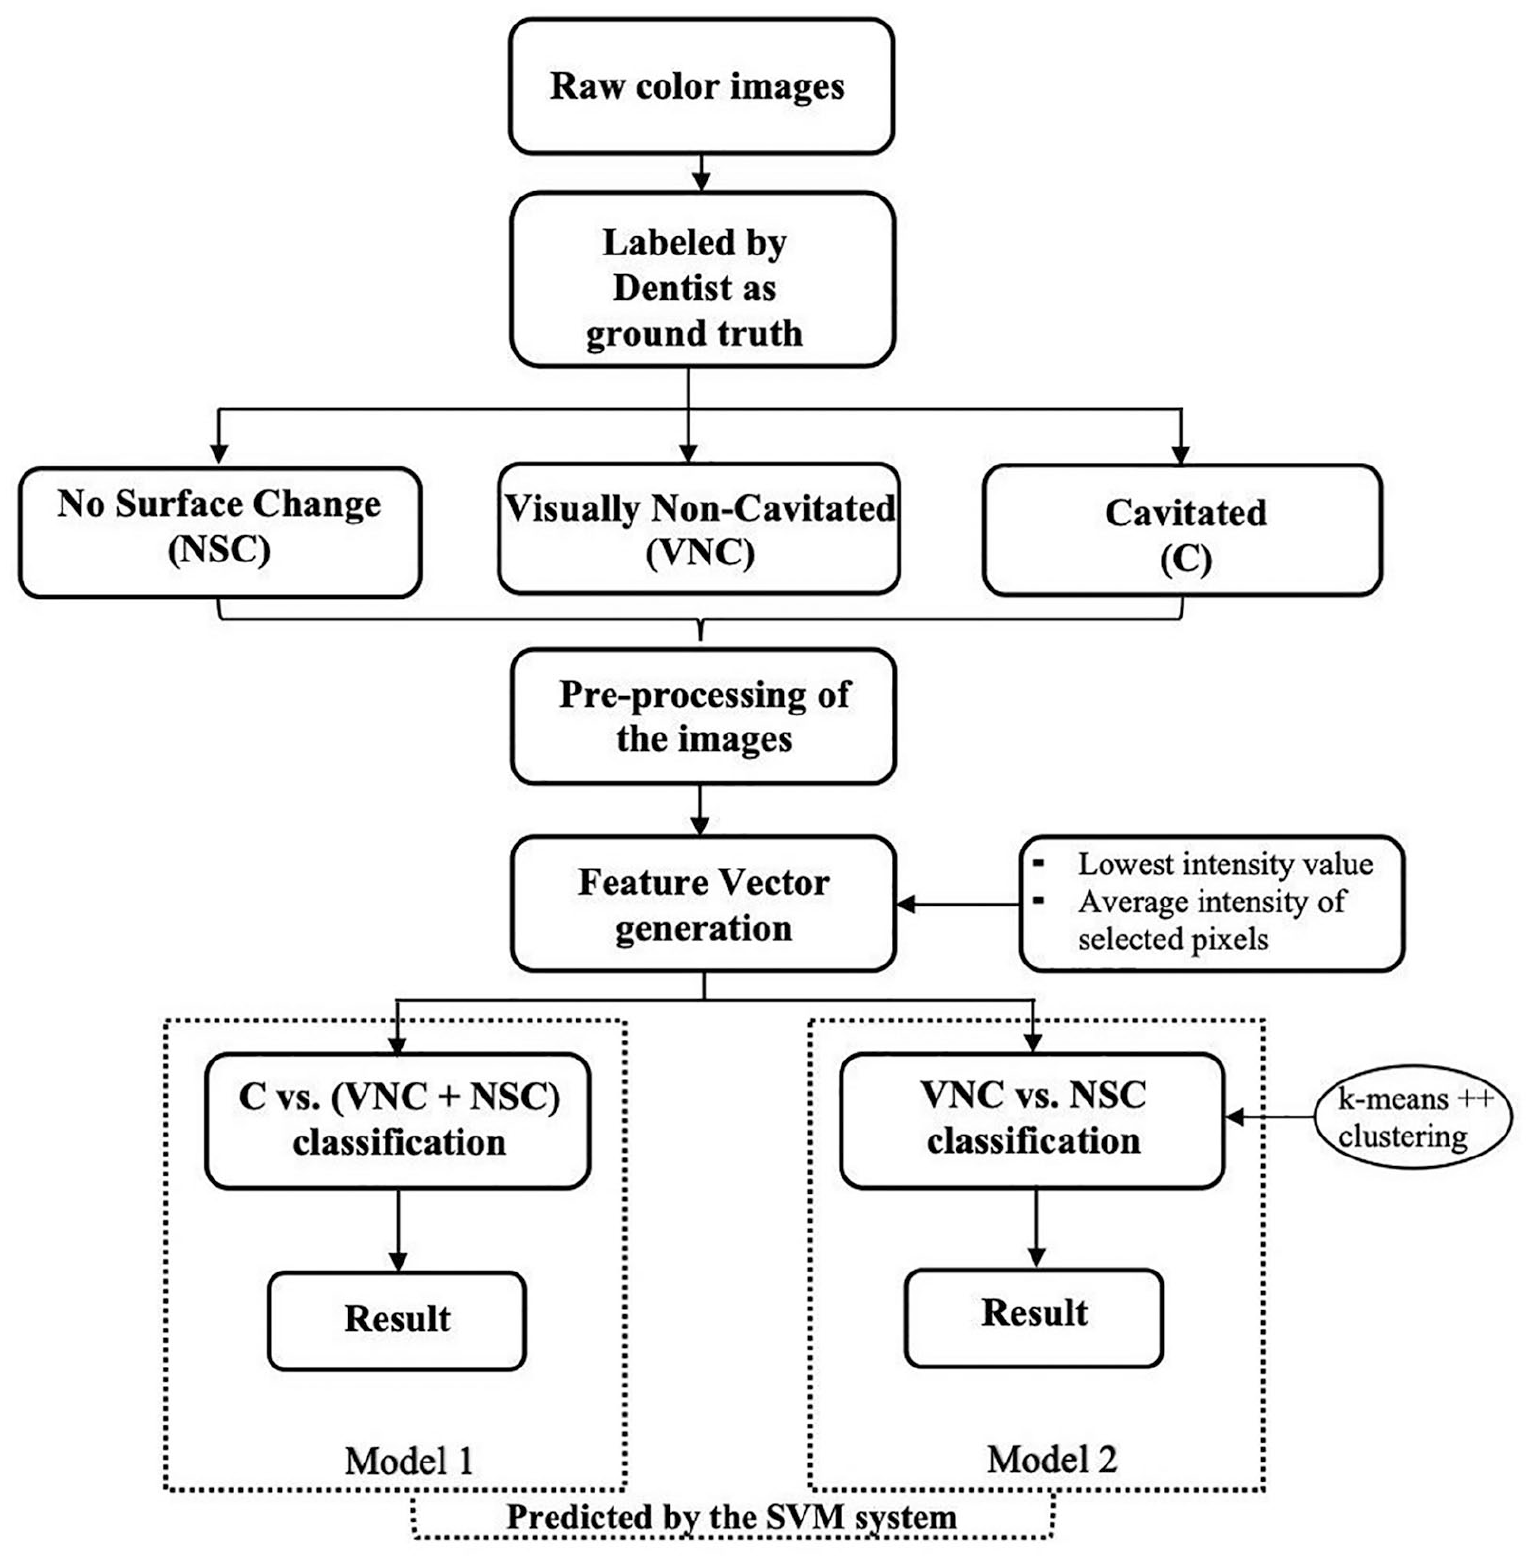
Schematic representation of the proposed methodology.
Feature generation
A color image contains three channels—Red (R), Green (G), and Blue (B) channels. Higher gray level intensity says white color and lower gray level says black color. In RGB image rendering system, in at least one of the channels, darker regions of different colors possess comparatively lower intensity than the surrounding. Carious lesions in a digital image can be described as non-whitish and/or darker regions comparing the whitish regions (sound regions). The center is the darkest (lowest intensity) and it fades to white (highest intensity) from the center to edges. By taking a range from the lowest intensity up to a certain threshold is expected to detect the carious lesions—darker regions of the entire image in at least one channel.
The initial feature vectors (FV) were generated for each channel of each image, and then were joined together to create the final FV (see Figure 3).
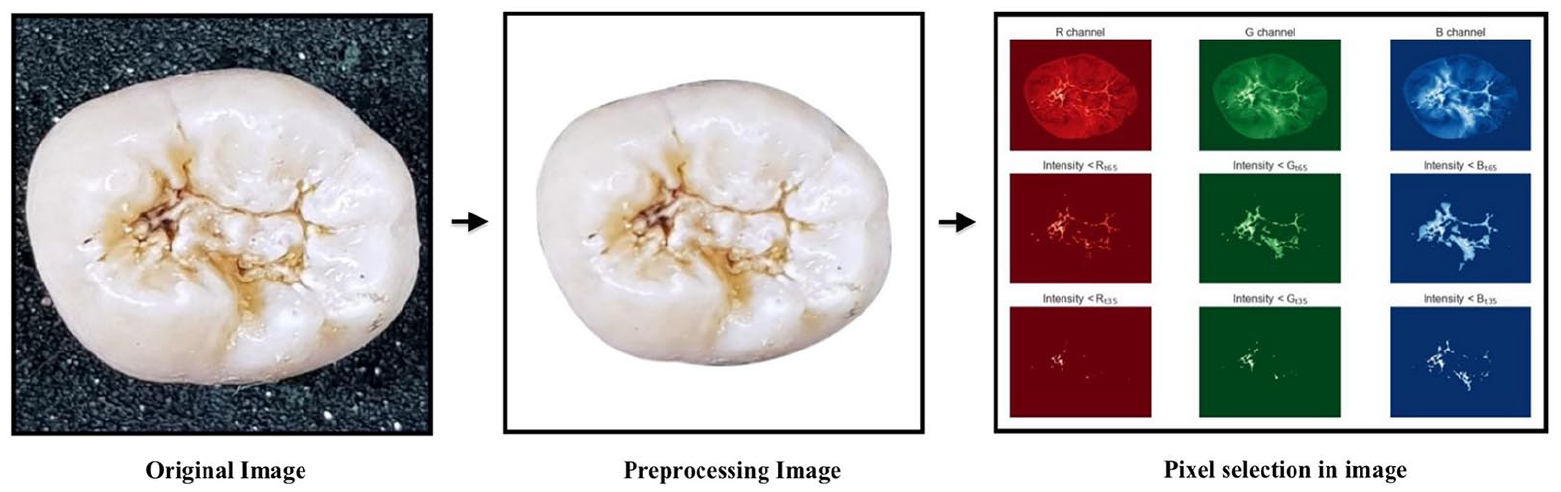
Example of pre-processing image and feature vector generation.
Experimental setup
Before applying SVM, the training FVs were normalized and the calculated normalization parameters were stored. Then, the validation and FVs were normalized using stored parameters before testing model performance. The scikit-learn software package was applied. 34 SVM training hyperparameter C = 1 was set. The linear kernel was used.
Experiment on C versus (VNC + NSC) classification
The total images were randomly divided into three datasets: Test set—20% from each class of the images; Training set and Validation set—remaining 80%. This experiment was repeated for 10 times. Afterward, six-fold Cross-Validation (CV) was applied to evaluate models.
From each experiment, the model with highest validation accuracy (best model) was selected and the test accuracy of the selected model was recorded. The model with least deviation between validation accuracy and test accuracy was chosen as the best model among 10 experiments.
Experiment on VNC versus NSC classification
NSC class was randomly divided into three datasets: Training set—60% data points, Validation set—20% data points, and Test set—20% data points. Keeping Test set fixed, the selection of Training and Validation set for NSC was repeated 10,000 times.
From VNC class, 20% of data points were randomly selected to form Test set. However, since the number of NSC is much less than number of VNC, we were looking for approaches to select a few training data points from VNC class. In an effort to tackle the sample imbalance issue, three clusters were obtained from entire VNC class by applying k-means++ algorithm on normalized FVs. 35 Test set was discarded from each cluster. Afterward, 15 data points from each cluster were randomly selected as training samples for VNC class and the remaining data points were Validation set. Keeping Test set fixed, the training and validation sample selection for VNC class was also repeated for 10,000 times.
Results
C versus (VNC + NSC) classification
The average CV accuracy of 10 experiments has been reported in Table 2. It was observed that mean of all average CV accuracy was 89.8% ± 0.63%, the average CV accuracy of best model was 94.36% ± 2.11%, and the average test accuracy of best model 91.52% ± 2.08%.
Results of C versus (VNC + NSC) classification experiment.

Bold values denote the best-performing model.
CV: Cross validation; SD: Standard deviation; SVs: Support vectors
From each experiment, one best model was chosen depending on CV accuracy of trained models. In cases, where multiple models had highest and equal CV accuracy were provided by the same experiment, model with fewer Support vectors was chosen as the best one. Based on this decision rule, the best model from Experiment ID 5 with accuracy 92.37% and number of SV [51,51] was considered as the best model in this classification (Table 2). Considering C class as positive class and (VNC + NSC) as negative class, our best model showed sensitivity 88.1% and specificity 96.6% (see Table 3 for details).
Confusion matrix of best model in C versus (VNC + NSC) classification experiment.

Positive class: C; Negative class: VNC + NSC.
VNC versus NSC classification
The training, test, and validation set for NSC class comprised of only 43, 15, and 15 data points respectively, whereas it was 45, 45, and 130 for VNC class. In the clustering result of VNC class, the biggest cluster got 104 data points, whereas the smallest one got 34 data points (see Table 4).
k-Means++ clustering result of the entire VNC class.

The average validation accuracy of best 10 models was 85.83% ± 0.23%, while the average test accuracy was 81.17% ± 1.58% (see Table 5).
Results of VNC versus NSC classification experiment.

Bold values denote the best-performing model.
SVs: Support vectors.
In this classification, the smallest deviation in test accuracy and validation accuracy was observed in model ID 7826 with test accuracy—83.33% was considered as best model (Table 5). The results of this model in sensitivity 82.2% and specificity 66.7% (see Table 6 for details). Model ID 5544 was the model that had least number of SV.
Confusion matrix of best model in VNC versus NSC classification experiment.

Positive class: VNC; Negative Class: NSC.
Discussion
Based on smartphone color images, we developed an automated two-step SVM classification system for caries detection. The accuracy, sensitivity, and specificity were 92.37%, 88.1%, and 96.6% in C versus (VNC + NSC) classification, whereas they were 83.33%, 82.2%, and 66.7% in VNC versus NSC classification. The results of the experiments found clear support for the possibility of using smartphone color images for dental caries detection by ML method. With the aim of developing computer-aided automate occlusal caries detection, there are few studies used ICDAS II system as their references,16,17 but none of them used smartphone images, which can capture images of intact occlusal tooth surfaces, which is exceedingly useful to visualize potential caries lesion. Furthermore, photograph by an ordinary smartphone was a non-invasive methodology, totally harmless, and did not subject patients to radiation exposure. Compare with other expensive digital cameras, smartphones were readily affordable and easy-to-carry devices can provide potential benefits in implementation of dental public health investigation, especially in suburban areas.
It is well-known that to evaluate performance of ML method, multiple classifiers had been employed in order to select the most appropriate in terms of classification accuracy. The choice of using SVM as the only classifier to demonstrate the feasibility of our methodology due to many reasons. First, SVM is well-known as an old candidate for ML classifiers with stable behavior in real systems. 36 SVMs automatically select their model size and SVM can deal with the biggest problem with Neural Networks, but are less prone to overfitting. 37 Moreover, SVM training does not require time-consuming and computational resource-consuming, new models can be evaluated and tested within minutes. Second, in our study, the dataset should be classified into three categories, but the multi-class classification such as decision tree, Random Forest, Random Tree, Naïve Bayes, K-nearest neighbor. . . can be ineffectively performed because of our imbalanced dataset. By generating two different SVM models in two-step classification, we have reduced our classification problem from multi-class to binary class (Multiclass as One-Vs-The-Rest and One-Vs-One). So, the results confirm that this a good choice for current data.
Overall, our system provided a substantial improvement over the previous studies that achieved accuracy was 86.3% by Ghaedi et al., 16 while it was 83% (seven classes) and 86.24% (three classes) by Berdouses’s system 17 (see Table 7). This improvement is chiefly accounted for by two observations. First, our dataset is larger with 620 teeth images. Ghaedi et al. used 88 images, while 103 images (12 in vivo, 91 in vitro) were used by Berdouses et al. As most of the standard ML algorithms required well-balanced class distribution or expected cost of misclassification are equal, the problem of small number of samples or imbalanced data undermined substantially learning process. 38
Comparison of the proposed methodology with other works of the literature.

Second, by pixel selection and average intensity-based features from RGB channels, we noted that almost useful values were maintained at a good level during training process. Conceptually, the images were supposed to have higher intensities in all three channels when it has no abnormalities on occlusal tooth surfaces. The average intensity dropped gradually as carious lesions appeared or progressed. And, selecting normal areas together with abnormal areas was equivalent to increasing average intensity in entire selected area. In both C and VNC, the center portion of lesion had lowest intensity. So, 35P scheme produced average intensity features of lower value than actual alone in C and whereas it produced almost accurate average intensity features in VNC. This lowered intensity in C did not lose discriminatory information in FVs as C were expected to have lower average intensity than VNC. In addition, 65P scheme in VNC produced slightly higher average intensity than actual one. But, this increase in average intensity for VNC did not hamper classification as it was compatible with 35P scheme. Subsequently, NSC has no caries related abnormalities so the selected pixels, for both 35P and 65P schemes, had highest average intensity in most of the images.
In heatmap of normalized feature vectors (see Figure 4), the fluctuations of dataset were shown differently in two classifications. In Figure 4(a), we can definitely differentiate between C class and (VNS + NSC) class based on indicated color, where FVs of C class were much darker than of (VNS + NSC). But, in Figure 4(b), the difference in color was not really enough to distinguish VNS class and NSC class. This result can be explained as follows, VNC class or we can call it early-stage caries with indistinctive changes, which only can visually record after drying the occlusal tooth surfaces. Hence, most of the model’s failure cases were belong to “VNC versus NSC” classification.
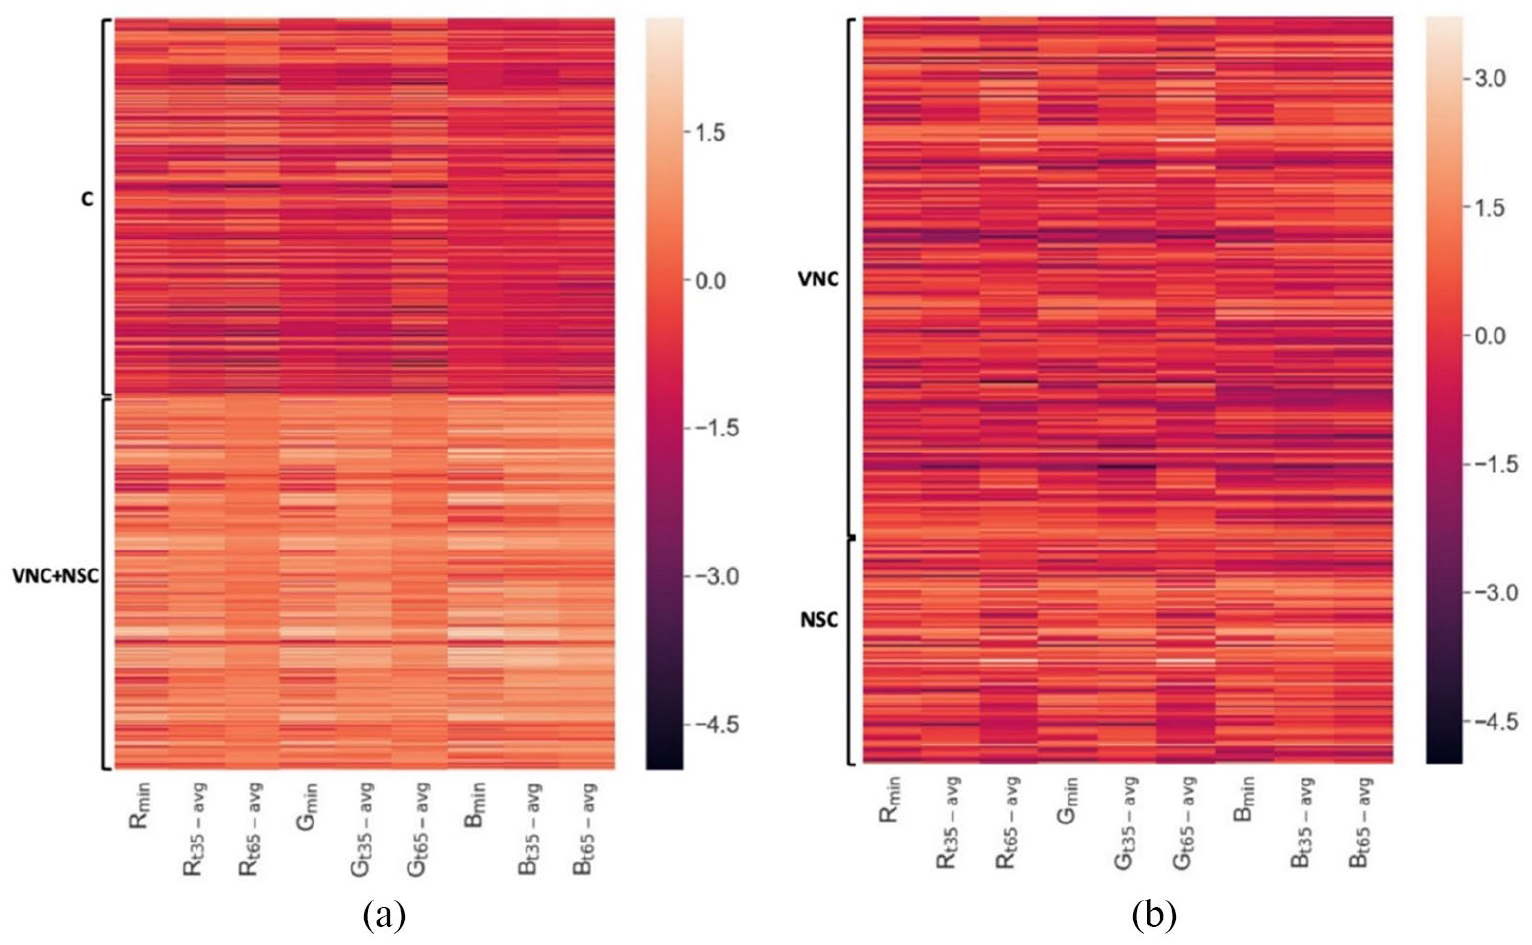
Heatmap showing the normalized Feature Vectors of the dataset: (a) FVs from “C versus (VNC + NSC)” classification and (b) FVs from “VNC versus NSC” classification.
Although the current FV generation method was sufficient in encoding discriminatory information for most of the images, it could not produce good FV in cases of occlusal tooth surfaces with confounding factors such as dental plaque, stains, shadow effects (see Figure 5).
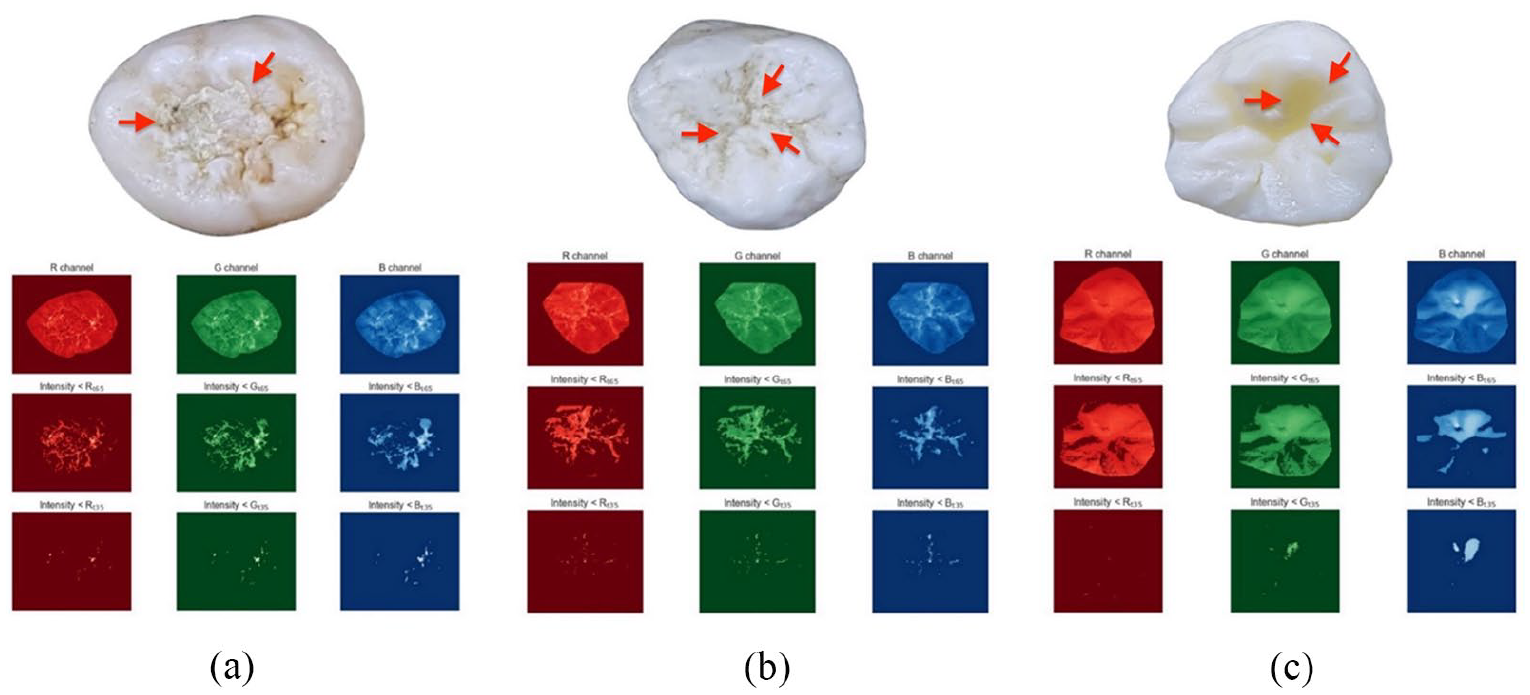
Examples of abnormalities on tooth occlusal surface (indicated by red arrow): (a) dental plaque, (b) stains, and (c) shadow effects.
In the future, we acknowledge different ways in which our work could be extended. Even though we increased the number of images to form larger datasets for model training, we could not deal with insufficient datasets and imbalanced data issues, especially in NSC category. In order to overcome this issue, more NSC images are required to draw a conclusion. Finally, the continued in vivo studies with full dental arch images should be considered to verify the performance of proposed SVM system. However, not like in vitro images, which were only images of single extracted teeth, in vivo datasets can be affected by many factors such as change of angles/directions from smartphones camera to teeth surfaces leading to heterogeneity during data collection. Therefore, we are developing a mobile application for taking pictures in order to uniform the obtained data. Besides it, automated tooth segmentation and annotation functions will also be integrated inside the mobile application so that the SVM system can be appropriately implemented.
Conclusion
In this work, we developed an automated methodology to detect and classify dental caries lesions based on smartphone color images according to ICDAS II system. Our results lead to building up an AI integrated mobile application, which could be used as a tool for assisting people in giving an early warning about their oral healthcare conditions and can be got well-timed treatment in dental clinics or hospitals. Further, this application also can assist dentists to reduce the time for clinical examination in each patient with more unbiased and accurate diagnoses. Future investigations are necessary to validate the kinds of conclusions that can be drawn from this study.
Footnotes
Acknowledgements
The authors acknowledge Dr. Vu Manh Tuan, Dr. Truong Thi Hieu Hanh, Dr. Nguyen An Nghia, School of Odonto-Stomatology, Hanoi Medical University for their contribution to data assessment. The authors would like to thank Dr. Kuo-Sheng Cheng, Department of Biomedical Engineering, National Cheng Kung University for his supports.
Declaration of conflicting interests
The author(s) declared no potential conflicts of interest with respect to the research, authorship, and/or publication of this article.
Funding
The author(s) received no financial support for the research, authorship, and/or publication of this article.
Statement of ethics
This study conformed to the ethical guidelines of the Declaration of Helsinki (1975) and was approved by the Institutional Review Board – Hanoi Medical University for Ethics in Biomedical research implementation (Reference No. 21/HMU IRB).