
Abstract
Epidemiological studies suggest that bipolar disorder has a prevalence of about 1% in European countries, becoming one of the most disabling illnesses in working age adults, and often long-term and persistent with complex management and treatment. Therefore, the capacity of home monitoring for patients with this disorder is crucial for their quality of life. The current paper introduces the use of speech-based information as an easy-to-record, ubiquitous and non-intrusive health sensor suitable for home monitoring, and its application in the framework on the NYMPHA-MD project. Some preliminary results also show the potential of acoustic and prosodic features to detect and classify bipolar disorder, by predicting the values of the Hamilton Depression Rating Scale (HDRS) and the Young Mania Rating Scale (YMRS) from speech.
Introduction
Bipolar disorders are a common and complex form of mental disorder, ranking as one of the most disabling illnesses with a prevalence of about 1% in European countries, and up to 2.4% worldwide. Although this seems to be a small percentage, it becomes one of the most complex mental conditions. Patients with bipolar disorder experience episodes of abrupt mood changes, alternating mania (euphoria) and depression phases. But beyond these complex mental episodes, this disorder is also dynamic, with a typically relapsing-remitting course, and it becomes often a long-term and persistent illness. 1 Moreover, patients with bipolar disorder have shown to be at high risk of premature death due to comorbid cardio-vascular diseases. 2 In fact, several studies have demonstrated that bipolar disorder has become the sixth leading cause of disability worldwide, with a rate of death by suicide up to 15 % among the most severe cases.1,3–5
Since bipolar disorder alternates depression and manic phases, it is generally assessed by the research community by means of several standard clinical scales, which account for the severity of both depression and mania. The most relevant ones include the Hamilton Depression Rating Scale (HDRS), 6 and the Young Mania Rating Scale (YMRS). 7 These rating scales are commonly provided by clinicians and take about 20–30 min to complete. YMRS rates 11 items related to mania (elevated mood, increased motor activity-energy, sexual interest, sleep, etc.) and it is based on the report from patients over the previous two days, and upon clinical observations made in a clinical interview. The scale ranges from 0 to 60, where higher scores indicate more severe mania, and its final aim is to evaluate manic state at baseline and over time. Similarly, HDRS rates 21 different items related with depression (depressed mood, feelings of guilt, suicide, insomnia, etc.), although only the first 17 compute to the final score, to indicate a degree of depression at baseline and over time. The final score ranges from 0 to 50, where higher scores indicate more severe depression.
Automatic home monitoring of mood instability can allow for early intervention on prodromal symptoms and potentially influence the course of illness. Over the last years, several electronic self-monitoring platforms for regular computers and smartphones have been developed.8,9 However, these systems usually do not have the capacity to collect objective data on patient behaviour, and most of them do not include a feedback loop between the patients and the mental healthcare providers. Recent projects such as PSYCHE [www.psyche-project.org] and MONARCA [www.monarca-project.eu] 10 use information and communication technologies for the treatment of bipolar disorder. However, they are either intrusive for the patients due to the number of sensors needed, or they do not explore the role of the caregiver. Instead, the NYMPHA-MD project 11 defined a framework for continuous patient monitoring to identify early warning signs of deviations in mood and attitudes suggesting the onset of a depressive or maniac episode, which, in turn, will allow for early intervention. 12 PULSO Ediciones S.L. won the NYMPHA-MD Pre-Commercial Procurement bid with the MoodRecord project, where the Universitat Pompeu Fabra (Barcelona) developed the speech module analysis.
In recent literature, speech has been shown to be a potential indicator for bipolar disorder detection in a few works,13,14 apart from being a ubiquitous and non-intrusive identifier. In general, systems relying on the speech signal to detect or assess mental disorders can be classified into those using acoustic-dependent features, and those using context-dependent features. 15 Systems using context-dependent features require the word transcriptions to infer linguistic features (see, for instance, the use of semantic information 16 or lexical features 17 to identify psychosis, schizophrenia and bipolar disorder). Contrarily, acoustic-dependent systems rely mainly on extracting speech-based features regardless of the linguistic content, such as spectral characteristics, voice quality features, or speech prosody. Although the context-dependent linguistic features can be very informative achieving generally better performance, they are highly dependent on language and the corresponding transcriptions from speech. The aim of the presented work is to explore the usability of speech in its acoustic form as a language-independent system for home monitoring for patients with bipolar disorder, by implementing a machine learning regressor capable of predicting the values of HDRS and YMRS scales from speech, thus providing a user-friendly tool and helpful information to patients and clinicians. Moreover, we show its integration and implementation in a smart daily-life system, specifically in the framework of the NYMPHA-MD project.
The structure of the current paper unfolds as follows. Section ‘Speech as a ubiquitous and non-invasive health sensor’ briefly overviews the use of speech as a ubiquitous and non-intrusive health sensor. Section ‘Bipolar mood status detection from acoustic and prosodic information’ presents some preliminary experiments on the prediction of mania and depression scales through speech-based information. Section ‘Patient continuous supervision through mobile app’ describes the MoodRecord mobile application created for patient continuous supervision in the framework of NYMPHA-MD; and finally, sections ‘Discussion’ and ‘Conclusion’ sketch the discussion and conclusions of the work, respectively.
Speech as a ubiquitous and non-invasive health sensor
Among all the biometric identifiers, voice has special characteristics that make it an exceptional health indicator. Moreover, speech is a non-invasive signal, ubiquitous and easy to record, with non-expensive equipment required, 18 which makes it especially suitable for home monitoring applications. Despite its high variability between speakers, speech is highly dependent on their physical and emotional conditions,19,20 making it suitable to detect changes on these conditions.
Speech can provide two different types of information: (i) the content of the message, composed by the words and their meanings as a result of a cognitive process and (ii) the acoustic information extracted from the voice sound, produced by the coordinated physical activity of several organs. Variations of specific acoustic features (F0, intensity and duration) over time comprise what is known by prosodic information, conveyed through the intonation, stress and rhythm elements, respectively, which can reflect the emotional aspects of the individual. In this project we focus on the second type, whose features can be extracted in a language independent manner, thus allowing a broad application to different countries with many different languages (as it was the case on the NYMPHA-MD project). In the following subsections, we introduce the potential use of speech for medical diagnosis, specifically the use of prosodic information for the analysis of the mood status and bipolar disorder.
Acoustic and prosodic information
Voice has been largely used to detect several physical and mental pathologies, being acoustic parameters related to voice quality (e.g. jitter, shimmer and harmonics-to-noise ratio) some of the most used for these purposes. 21 By way of example, jitter and shimmer have been recently used for the detection of Parkinson’s disease,22–25 Alzheimer,26,27 post-traumatic stress, 28 multiple sclerosis and dysarthria,29,30 thyroid patients 31 and coronary heart disease, 32 among many others.
Speech prosody consists of the following elements: intonation –perceived by listeners as a variation in time of the fundamental frequency–, stress –as variation of loudness– and rhythm –as the variation of sound duration. 33 Prosody is crucial in oral communication34,35 and in expressing different emotional states. Furthermore, prosody has been shown to be more robust to channel noise than other spectral-based speech features, 36 at it can be extracted in its acoustic form without the need of the corresponding text transcription.
Acoustic and prosodic parameters for bipolar disorder detection
Several works in the literature have reported the usefulness of acoustic features based only on voice characteristics (from now on, acoustic features) to detect emotional states such as depression and mania. In Shinohara et al., 37 for instance, several voice quality features such as pitch rate, jitter, shimmer and harmonic-to-noise ratio indices were shown to be indicators for patients with some kind of disorders in contrast to healthy people, measured by means of a voice disability index over spontaneous speech recordings in contrast to healthy people. In Vicsi et al., 38 jitter, shimmer and first and second formant frequencies differed significantly in depressed speech. In Pan et al., 39 fundamental frequency, formants and cepstral coefficients were explored for bipolar detection. In a similar way, Shimizu et al. 40 analysed the chaotic behaviour of vocal sounds in patients with depression and Zhou et al. 41 proposed a new feature value based on the nonlinear Teager energy operator to classify speech under stressed conditions. Other voice quality characteristics were further studied in Scherer et al. 42 and Hargreaves et al. 43 to detect depression and post-traumatic stress disorder, and it has also been shown that pressure of speech is a powerful indicator for mania states. 44
The use of prosodic features also in its acoustic form (from now on prosodic features), has been shown to be highly relevant to identify emotions,45,46 which leads to think of its usefulness in the detection of bipolar disorder –although the literature in this field is less exhaustive. See, for instance, the use of intonation (pitch contour) in Guidi et al., 47 and rhythm features in Gideon et al. 48
Bipolar mood status detection from acoustic and prosodic information
The current section presents some preliminary experiments on the use of speech-based features for the detection of bipolar disorders. Since the data collected were not exhaustive, the aim of these experiments is to show the potential of speech features to classify individuals’ speech into depression and mania scales. The following subsections describe the gathering of data and feature extraction in the MoodRecord application, the setup for bipolar status detection and the corresponding preliminary results.
Data recording and feature extraction
The original recordings were acquired by two of the EU procurers working in the project, namely Consorci Sanitari Parc Taulí (CSPT, Barcelona), and Provincia Autonoma di Trento (PAT, Trento). The recordings were carried out by bipolar patients gathered from the two institutions, using the MoodRecord application, and further processed with Praat, a free computer software package for speech analysis. 49 The recordings had an average duration of 26.0 s, and an average effective duration (excluding silences) of 18.5 s.
We developed a Praat-based module to extract acoustic and prosodic features from the sound files. These features were then used to train machine learning models to detect mania, depression and normal states by means of YMRS and HDRS scales. The selection of the acoustic features was mainly based on existing literature. Thus, several works, as seen in previous sections, have reported the use of fundamental frequency (F0), formants and voice quality features. Other few works have also reported the use of prosodic features based on intonation and rhythm. We used a similar set of acoustic features, which lead to the following nine features:
Fundamental frequency (one feature): mean value of F0.
Formants (two features): first formant frequency (F1) and second formant frequency (F2).
Voice quality (six features): relative value of jitter, absolute value of jitter, relative value of shimmer and relative value of shimmer, 50 noise-to-harmonics ratio (NHR) and harmonics-to-noise ratio (HNR).
Moreover, we also extracted nine prosodic features, based on the following three prosody elements:
Intonation (four features): maximum value of F0, minimum value of F0, range of F0, slope of F0.
Stress (one feature): mean value of intensity.
Rhythm (four features): ratio of pauses, speech rate, articulation rate and average syllable duration. 51
In total, we extracted 18 features from each of the patients’ speech. For the extraction of F0 and its related features, we used the auto-correlation method in Praat with an interval of 10 ms and a Hanning window of length 40 ms. Although rhythm features could have been accurately extracted from the corresponding transcripts, they were extracted by adapting the Praat script found in De Jong and Wempe 50 to keep the system language independent. The mean F0 and intensity values were used to normalise the F0- and intensity-based features, respectively, to avoid speaker dependence. Thus, F0-based features were computed as distance in semitones with respect to the mean value of the individual. Voice quality parameters jitter and shimmer were also normalised by means of F0 and intensity, respectively. After normalisation, F0 and intensity were left out and the remaining 16 features (eight voice quality and formant features plus eight prosodic features) were used for the detection experiments.
Bipolar status detection
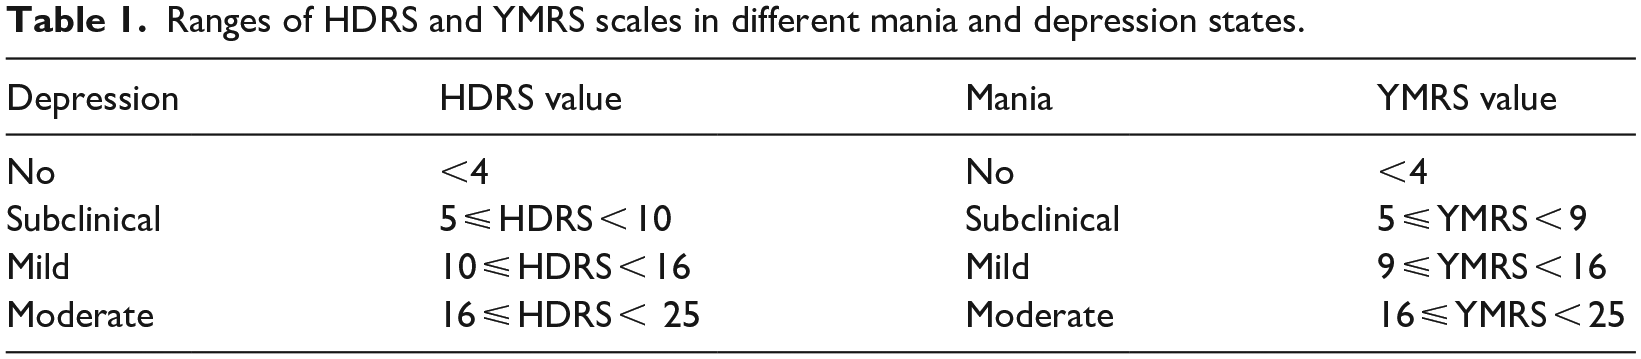
The detection of mood status in MoodRecord application was performed by means of regression algorithms using the extracted speech features. To this end, doctors annotated the different speech recordings according to YMRS and HDRS scales so that the system can learn from such scores to point out the occurrence of mania or depressive episodes. Specifically, the detection of depression and mania states was based on the range of scales and mania/depression assessments 52 indicated in Table 1, considering also the case of ‘no mania’ and ‘no depression’ (euthymic state). The scales were assigned to those audios yielding within 3 days before and after the date of the doctor’s assessment and thus the corresponding scale assignation.
Ranges of HDRS and YMRS scales in different mania and depression states.
Preliminary experiments
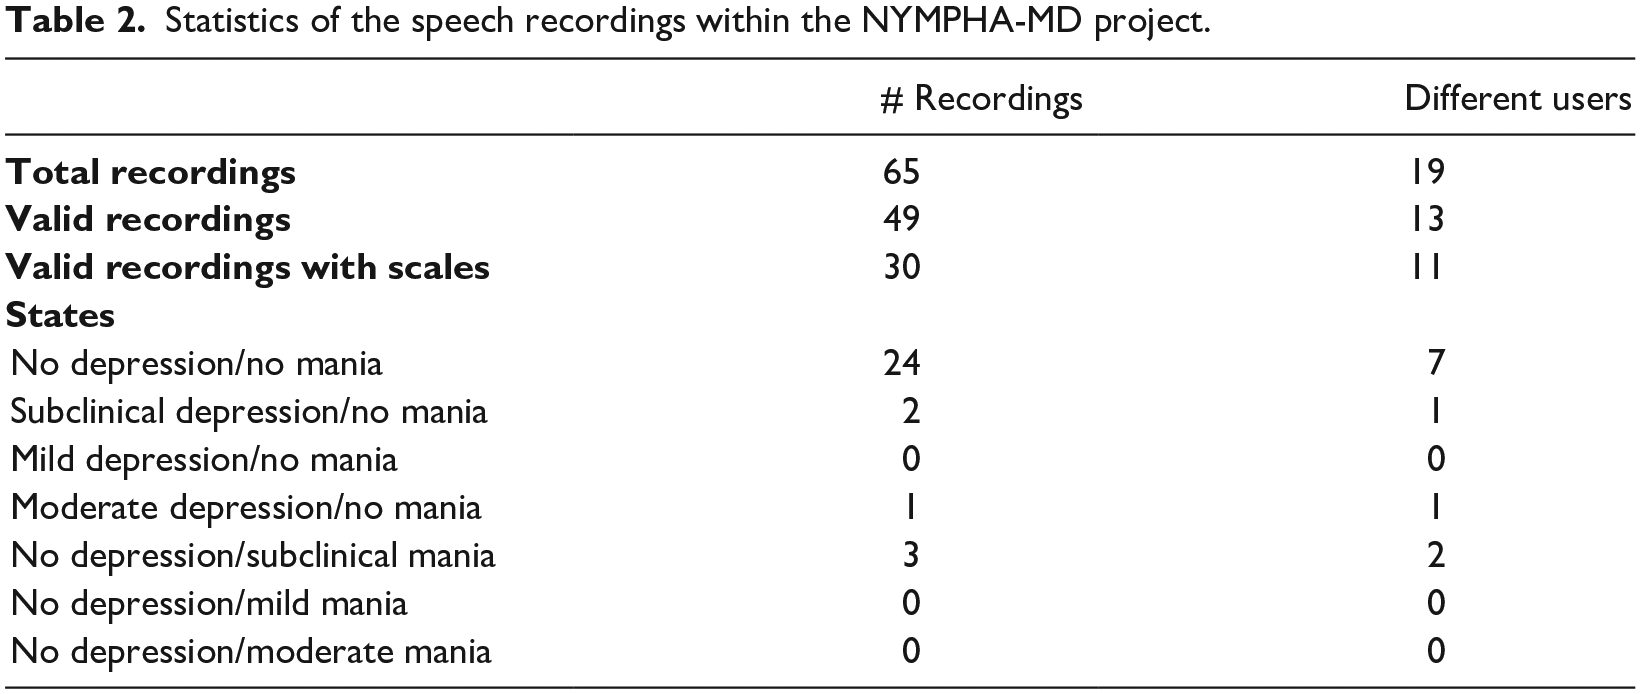
For an initial testing of the system, some preliminary regression experiments were performed within the framework of the project. An initial small database consisting of 65 recordings from 19 different real users and patients aged 23–69 years old was collected in the framework of the NYMPHA-MD project (see more details on patient recruitment in NYMPHA 53 ). After a careful check on the quality of the audios, only 49 of them – corresponding to 13 different users – were found to be recorded with enough quality. The remaining ones were too short – less than 2 s, empty, or containing only noise. Moreover, 15 recordings were shorter than 5 s, which could be used to extract acoustic features but were not suitable for computing reliable prosodic features over time, so they were not annotated with their corresponding HDRS and YMRS scales by the clinicians. For other recordings, clinicians were not available at the time of recordings. Since assessments had to be done in situ and within a short time range with respect to the recording time to be reliable, only 30 out of the valid audios could be annotated. Furthermore, the variability of the scales was rather low: a great majority of them were associated to ‘no depression’ and ‘no mania’ scales. Table 2 summarises these statistics.
Statistics of the speech recordings within the NYMPHA-MD project.
The regression experiments were performed on Weka, 54 using a leave-one-out (LOO) cross-validation method to ameliorate the lack of data. To predict the HDRS and YMRS values, three different regression algorithms were tested: linear regression, random forest and support vector regression with a radial kernel. Tables 3 and 4 show the results obtained in the prediction of HDRS and YMRS scales, respectively, in terms of root mean square error (RMSE) and using the following sets of features: (1) voice quality and formants, (2) prosody and (3) all features. Bold numbers represent the best-performing set of features for each regression algorithm. Moreover, Table 5 compares the best results obtained in the LOO for both HDRS and YMRS scales with 10- and 5-fold cross-validations. The results clearly show that the larger the number of folds, the better the accuracy achieved in the regression experiments.
Root mean square errors obtained in the prediction of HDRS values (LOO cross-validation).

Bold numbers refer to the best result for each regression algorithm.
Root mean square errors obtained in the prediction of YMRS values (LOO cross-validation).

Bold numbers refer to the best result for each regression algorithm.
RMSE values obtained using 5-, 10-fold and LOO cross-validation.
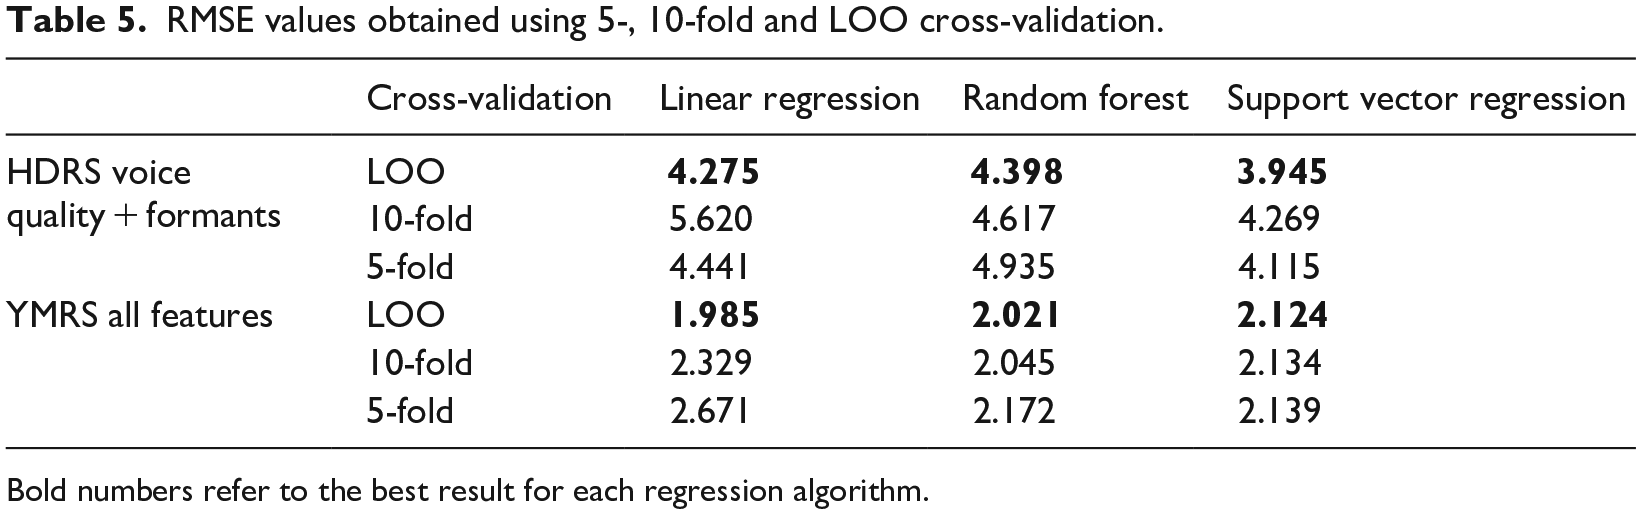
Bold numbers refer to the best result for each regression algorithm.
On the one hand, Table 3 shows that the best HDRS prediction is obtained by using only the voice quality plus formants set of features. In addition, among all the regression methods tested, support vector regression algorithm outperformed the other ones. On the other hand, Table 4 shows that the best YMRS prediction is obtained with the whole range of speech features. Unlike the HDRS prediction, prosody here provides useful information for the YMRS detection, which could be explained by the fact that manic speech is conveyed in a much higher degree by prosody, with higher variations in intonation and rhythm than depressed speech. In Figures 1 and 2 we have plotted the actual and predicted values for both HDRS and YMRS, respectively, for the 30 speech samples corresponding to the lowest RMSE obtained for each scale. The graphics show that the most extreme values are more difficult to be predicted due to the lack of representative training data. These results should be interpreted in caution due to the minimal number of valid recordings obtained. Moreover, most of the valid recordings were very close to the euthymic states, which limits the variability of the data used in the experiments. Note that, in the final application, since negative values make no sense in a real setting, negative predicted values are turned into 0 values. In the same way, large values are cut to the maximum HDRS and YMRS values (50 and 60, respectively).
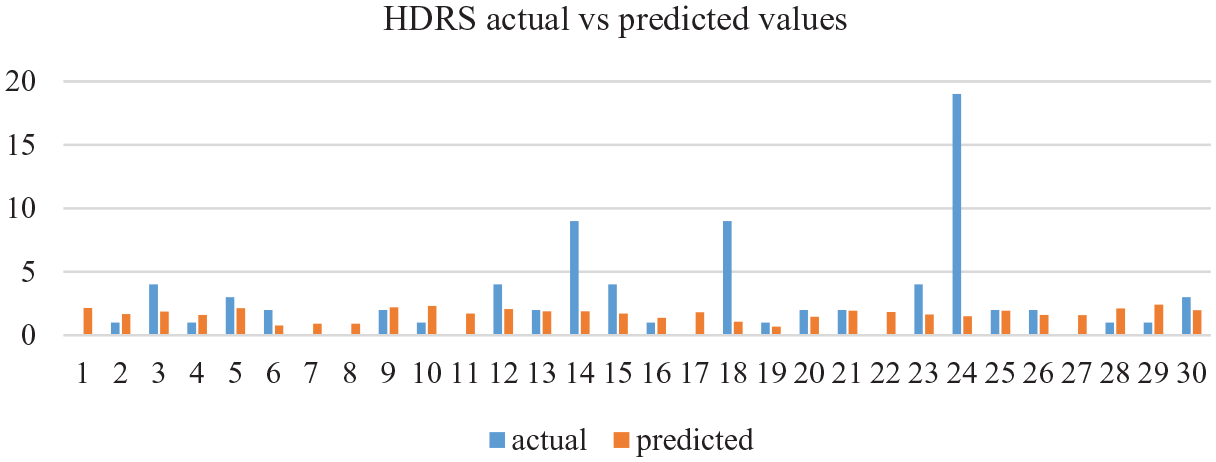
Actual HDRS values compared to the HDRS predicted values using voice quality and formant features through a support regression algorithm.
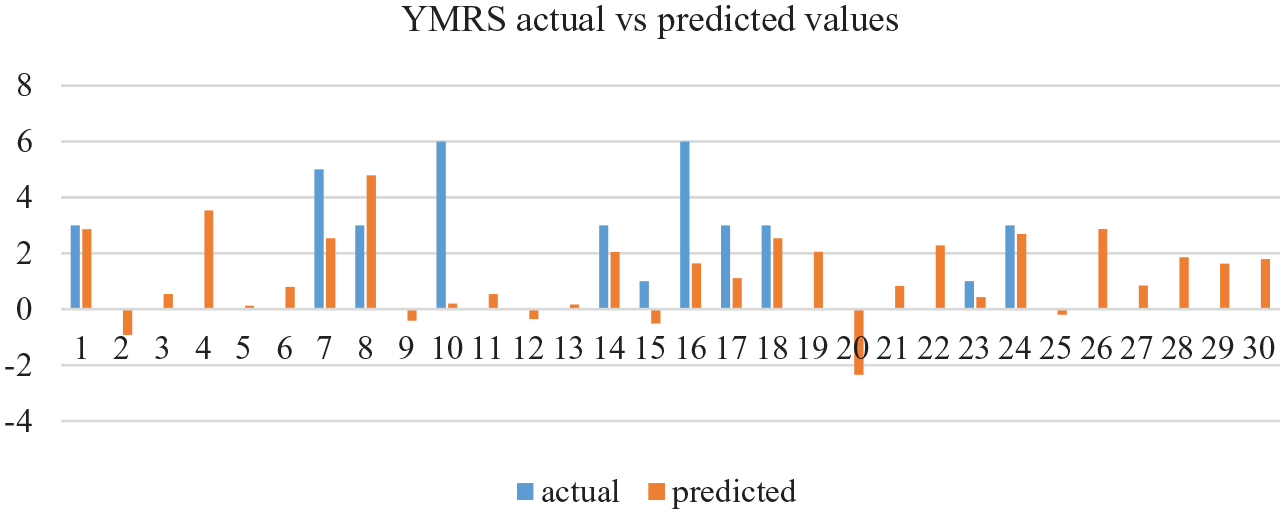
Actual YMRS values compared to the YMRS predicted values using all speech features through a linear regression algorithm.
Patient continuous supervision through mobile app
The application developed within the NYMPHA-MD aimed to provide a new way to manage patients diagnosed with bipolar disorder through the MoodRecord system that allows the estimation of the mood of the patient and the patient monitoring.
MoodRecord system
The MoodRecord system was designed to be used for patients (app functionalities) and healthcare professionals and caregivers (website functionalities, www.moodrecord.com). The patient registers a set of parameters related to their mood using the app. The website provides clinicians with all user’s data registered by the app to manage and track their patients’ disorders (Figure 3).
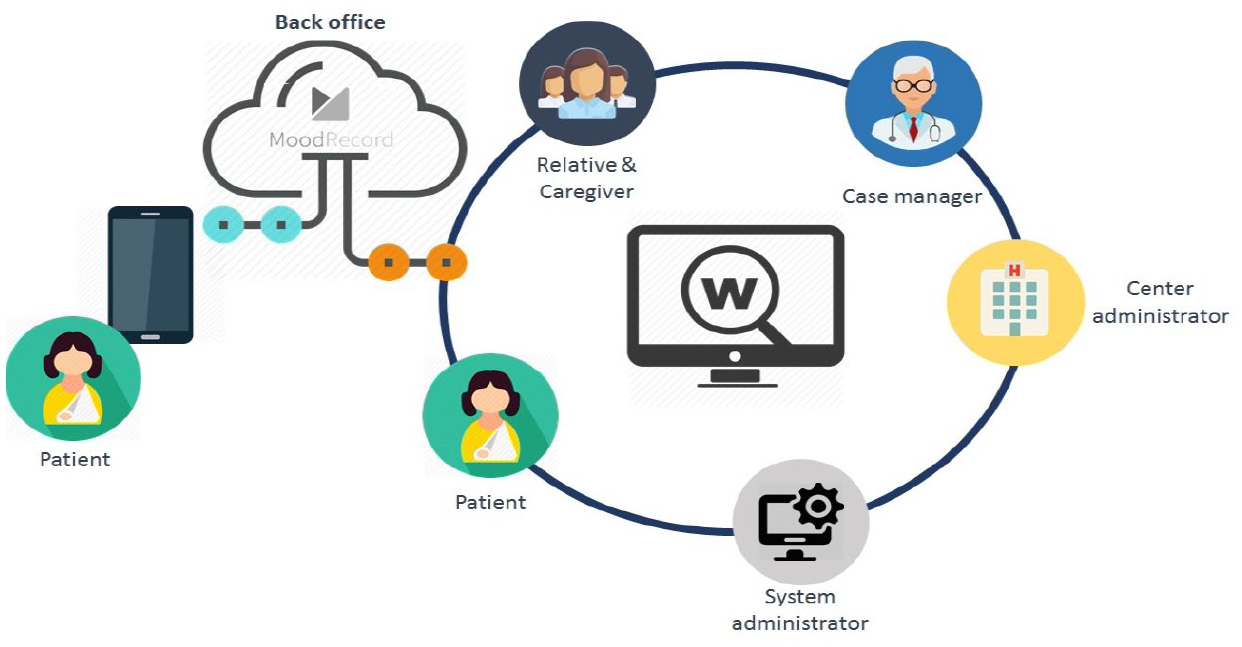
Diagram of the MoodRecord system architecture.
The flow starts when clinician registers new patients from the web interface and sends them their credentials. Patients are then able to access the application on Android or IOS smartphones and start registering the data related to their mood or health state following the weekly guideline defined by their case manager (see in Figure 3 the diagram of the MoodRecord system architecture).
The speech recordings in MoodRecord are performed through a module called Story of the day. In this module, the patients are asked to record a video explaining their day, and it includes two functionalities: face recognition, and speech pattern detection. The system is first calibrated to remove the microphone noise. After that, the Story of the day module is ready for the video/audio recording. Figure 4 shows the different steps followed in this process.
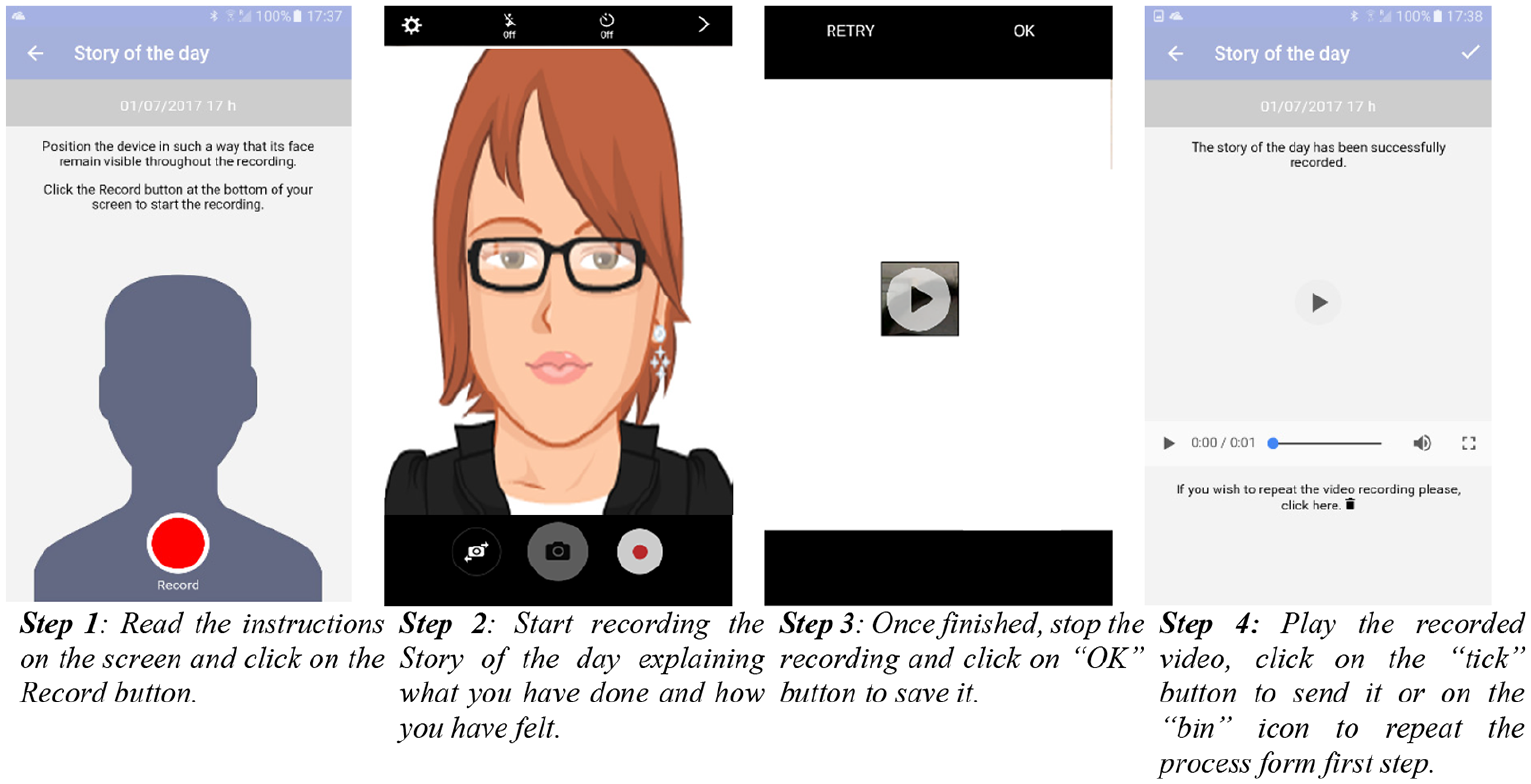
Story of the day registration.
The recorded video is then sent for speech analysis. Audio is separated from image and speech features are extracted for their analysis and further mania and depression scales prediction, based on the manually annotated speeches previously used to train the system. The system is initially built using the normalised speech features to develop a generic model. As training data is being collected, the system can be focused on the development of a personalised user model.
Medical supervision
The clinician sets up initial and follow-up visits, in which the patient status is revised and assessed again. Between such doctor visits, patients use the MoodRecord app to record a video through the Story of the day module so that they can be home monitored. Apart from audio and facial recognition algorithms, the system includes other patient parameters such as sleep quality, personal questionnaires, etc., which are checked online by the clinician. The system includes alarms that are raised when one of the indicators achieve a critical value.
Discussion
The preliminary experiments presented in the previous sections have shown the feasibility of voice features to detect bipolar status, since audio features can reflect both manic and depressive states. With respect to other existing works, the results are comparable when proving the usefulness of speech in bipolar status detection. Muaremi et al., 14 for instance, show that voice features are objective markers of emotional states in bipolar disorder –improved when combined with other data extracted from smartphones – and that they become more effective in the detection of mania than the detection of depression. Maxhuni et al., 13 on the other hand, test both prosodic and spectral speech features and find that both types have similar accuracy when tested together or in isolation. Our analysis goes beyond these works by testing the specific contribution of both prosodic and other acoustic features, and finds that, while prosody provides useful information for the YMRS detection (manic state), HDRS detection (depressive state) relies more on the non-prosodic acoustic features.
Our experiments could be improved by collecting more data to produce better machine learning models. Moreover, the short time used to test the application with patients implies that patients have been stable during the recorded period, and that they have not had any significant changes in their mood states –often, the mood status can change when turning into different seasons, so a collection period over six months would be needed for a better performance in the prediction algorithm–. The low data variability is a handicap for training the models. To overcome it, data collected in the future will automatically be used to improve both the individual and the generic models.
Conclusion
In this work, we have presented the use of acoustic and prosodic information as a health indicator; concretely, as an identifying factor of bipolar disorders. Speech is ubiquitous and easy to record, which makes it a suitable identifier for home monitoring systems. Some preliminary experiments on the use of acoustic and prosodic features in the framework of the NYMPHA-MD project have shown promising capabilities to detect different mood states from speech, overcoming those systems based only on voice characteristics, without an extra overload for the patient. Moreover, the MoodRecord application presented in the current work becomes a practical tool for a further medical supervision of the patient, leveraging the need of regular physical visits between patients and clinicians.
Although preliminary, the results show that, within the range of the available data, our speech-based algorithm is a potential tool for predicting different mood status in patients with bipolar disorders. Therefore, the use of speech and more linguistic-prosodic information should be thus further included in home monitoring health systems.
Footnotes
Acknowledgements
The authors would like to thank Ivan Latorre for his technical support and Giorgia Cistola for her help on the data preparation.
Author’s note
Mireia Farrús is now affiliated with Universitat de Barcelona, Barcelona, Catalonia.
Declaration of conflicting interests
The author(s) declared no potential conflicts of interest with respect to the research, authorship, and/or publication of this article.
Funding
The author(s) disclosed receipt of the following financial support for the research, authorship, and/or publication of this article: This work is part of the NYMPHA-MD project, which has been funded by the European Union under Grant Agreement No. 610462. The first author has been funded by the Agencia Estatal de Investigación (AEI), Ministerio de Ciencia, Innovación y Universidades and the Fondo Social Europeo (FSE) under grant RYC-2015-17239 (AEI/FSE, UE).