
Abstract
Here we present a mobile application that accurately determines the distance between an optical sensor and the human corneal limbus for visual acuity assessment. The application uses digital image processing and randomized circle detection to locate the cornea. Then, a reference scaling measurement is employed to calculate distance from the sensor to a user. To determine accuracy and generalizability, testing was conducted both with 200 static images, 25 images each of males and females for four ethnic groups from a facial image database, and live image streams from a test subject. Average absolute corneal radius error over 10 trials for the static images was 6.36%, while average absolute distance error for the live image streams was less than 1%. Subsequently, distance measurements were used to scale letter sizes for a Snellen Chart-based visual acuity assessment. This system enables monitoring of chronic retinal diseases, as patients can quickly and accurately measure their visual acuity through the mobile eye exam suite.
Keywords
Introduction
Vision is one of the most fundamental senses and a powerful means of interfacing with the world. Thus, it is imperative that vision can be accurately assessed and appropriate action can be taken when needed to improve eye-health. 1 Currently, however, visual acuity assessments (tests to determine sharpness of vision) require individuals to traverse the lengthy and often inefficient process of traveling to a clinical setting for testing. 2 Being able to instantly assess visual acuity would not only help the general population quickly determine whether prescriptions have changed, but also inform them of the early onset of cataracts, glaucoma, macular degeneration, and other harmful eye-related diseases.3,4
In particular, quick assessment of visual acuity would be especially beneficial to the elderly population, which may not have access to transportation to an ophthalmologist and is susceptible to age-related degenerative eye disorders. 5 It is estimated that in 2015, approximately 216.6 million people globally had moderate to severe vision impairment, and this number could rise as high as 399.0 million by the end of 2020. 6 Early detection of persistent eye-related diseases is critical in preventing the further deterioration of vision and nurturing overall eye-health.7–9
The proposed solution is a system that can provide an assessment of visual acuity using a mobile device such as a smartphone. Specifically, this system initially locates the user’s cornea and then compares the radius of the detected cornea, measured in image pixels, to a reference corneal radius measurement, thereby determining the distance from the cornea to the mobile device. A mobile application was developed, which uses this distance to determine the appropriate size of letters for a virtual Snellen test. Such a virtual eye exam consists of the patient dictating the letters of a mobile-generated Snellen chart, line by line, and being prompted to continue to smaller letters upon a successful reading. It has been extensively validated that the use of mobile technology devices to deliver an eye exam provides an accurate measure of visual acuity.10,11 As smartphones are becoming more ubiquitous around the world, they serve as an ideal medium for providing information about visual acuity to users.12,13 Within the United States alone, 56% of citizens own a smartphone and by 2020, it is estimated that there will be 6.1 billion users—approximately 66% of the world’s population. 14 Smartphones already have the necessary hardware (i.e. front facing camera and microphone) to develop an effective mobile app solution for determining visual acuity. Moreover, these hardware components are constantly being improved, which will continually enhance the accuracy of the algorithm and system proposed here. 15
The aforementioned approach allows a patient to utilize the front-facing camera on a smartphone to conduct a virtual eye exam. Through real-time determination of distance between the patient’s cornea and the optical sensor, the size of Snellen chart letters on the mobile device screen are dynamically configured at the beginning of the exam. Hence, the benefits are two-fold. First, the system allows for the patient to hold the mobile device in a comfortable position for the eye exam. Second, it ensures that the patient’s visual acuity is measured accurately with respect to the distance from which the patient is holding the mobile device. Ultimately, the Snellen equivalent, a quantitative visual acuity measurement, is displayed for the patient, for each eye tested. The iPhone application utilizes the front-facing camera to capture an image, and the aforementioned algorithm processes the image to detect the cornea and determine the distance between the optical sensor and cornea. This dynamic adjustment of letter size based on distance is critical. Current mobile vision assessment applications do not account for the user moving the device closer, relying upon a fixed distance calculation instead, and therefore introduce a great deal of inaccuracy in visual acuity measurements.16,17 Moreover, these existing mobile applications do not simulate a traditional visual acuity assessment since they have a patient manually select the correct letter on the screen. 18 Our method of using the cornea as a conserved marker enables the dynamic adjustment and provides a novel approach to the design of mobile vision testing applications. Our system fully simulates a traditional visual acuity assessment by using speech recognition to allow the patient to dictate the letters line by line.
Methods
The general framework for corneal detection and distance measurement is shown in Figure 1. An iOS application (both iOS 10 and 12 were used) with the OpenCV 2.4.13 framework was created to test corneal detection and distance determination methods; this application uses these measurements to determine visual acuity.
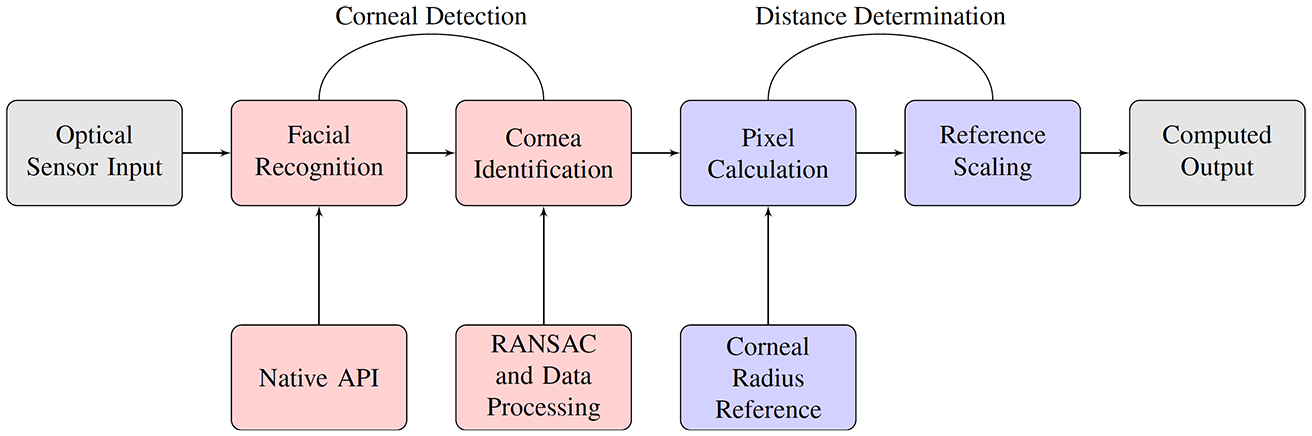
High level schematic of corneal detection and distance determination process.
Corneal detection
To begin, facial detection is used to aid the discovery of the region within which to apply our algorithm to probe for the cornea. Specifically, the CIDetector processor from the CoreImage Framework is used to detect the face and the position of the eyes. Apple’s CoreImage Framework for face and eye detection is based on the Viola-Jones object detection algorithm and an on-device deep neural network.19–21 Then, edge detection is applied on the resulting image. There are two primary reasons why edge detection is necessary. First, edge detection yields a binary image which is computationally easier to work with, as there is only one channel needed for processing rather than three (R/G/B). Second, edge detection delineates the cornea due to the relatively stark contrast between the cornea and the sclera.
The edge detection method employed computes differences in pixel intensities to highlight the edges of a given boundary. Specifically, edge detection uses a thresholding strategy. In order to determine the threshold (on a per image basis), the image,

This grayscale image is then normalized so that the maximum pixel intensity is mapped to 255, and the minimum pixel intensity is mapped to 0, with intermediate intensities scaled linearly. The standard deviation,
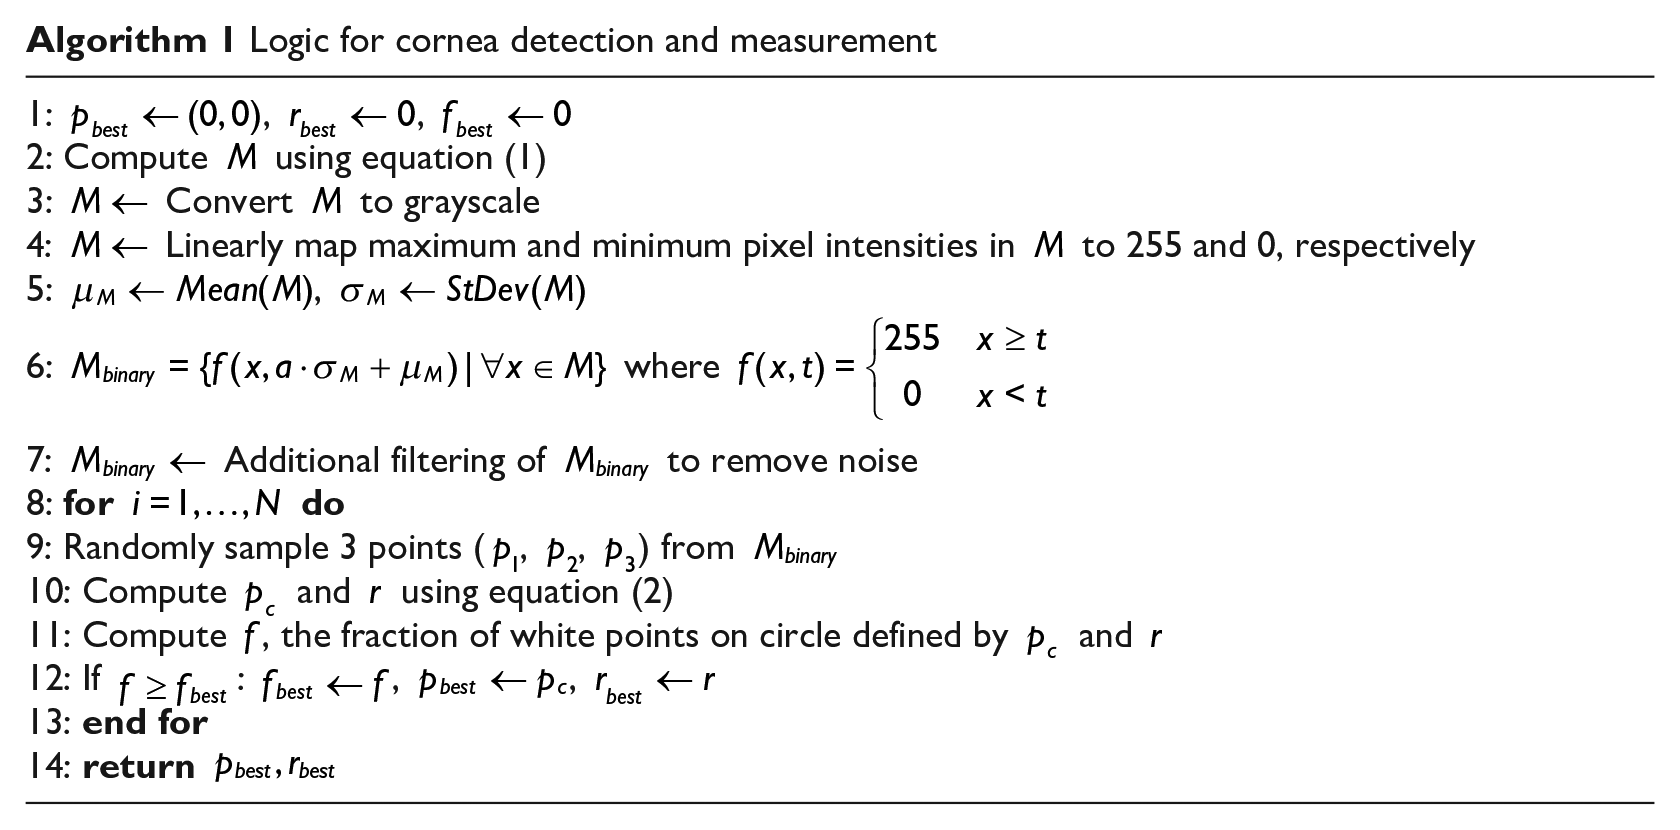
Logic for cornea detection and measurement
Additional filtering is then conducted on the resulting binary image,
The fraction of white points that lie on the circle can then be computed using
As per the Random Sample Consensus (RANSAC) method, this procedure is repeated hundreds of times per image, with the highest ratio being selected as the circle candidate. 22 Furthermore, results are aggregated at each location, allowing for better detection as time progresses as outliers are filtered out; this is done by updating the mean and standard deviation, and removing those that are beyond 1.5 standard deviations from the mean.
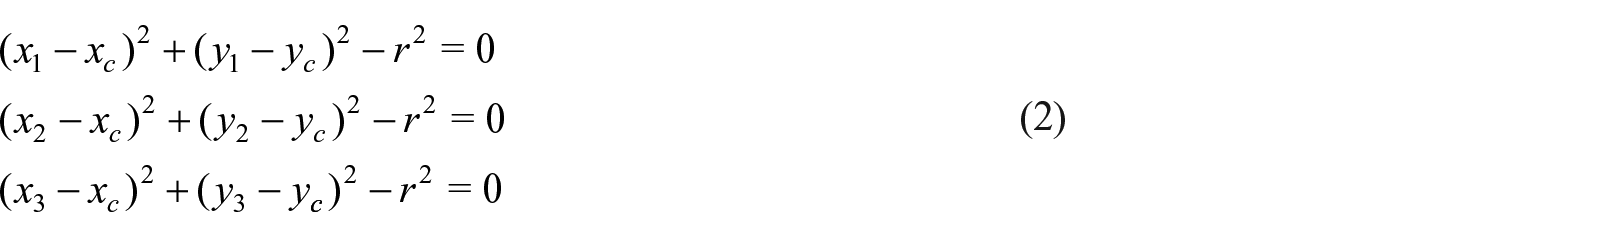
Corneal measurement
The diameter of the cornea in the image is determined by counting the number of pixels between two diametrically opposing points on the mathematically determined corneal circle. This determines the corneal diameter in pixels, from which the corneal radius is calculated. This method is continually refreshed to accommodate changes in distance. However, each refreshment yields a discrete measurement, rather than using several images to have one value returned. For each position the optical sensor is in, the measurements are aggregated and filtered over time. This allows the algorithm to measure the eye with lower variance and higher accuracy. The specific details regarding corneal detection and corneal measurement can be seen in Algorithm 1. For this implementation,
Assessing algorithmic accuracy
To measure the accuracy and generalizability of the algorithm with regard to the determination of corneal radius, a study was conducted using images from the Chicago Face Database (CFD). The CFD is a collection of standardized facial photographs of males and females of four ethnicities between the ages of 17 to 65. 23 This database was specifically selected for such demographics as it provides a representative sample of the world adult population, the target user base for mobile vision testing. Furthermore, the CFD was chosen for particular technical qualities as well, including the high-resolution, colored images which are comparable to the image quality generated from a smartphone camera. In addition, it was important that these images were standardized, as all images have people wearing the same gray t-shirt in the same white background with the same angle, orientation, and neutral facial expression. 23 This standardization ensures that differences in algorithm-measured corneal radii between different ethnicities or genders are not due to background noise. In other words, we control for all factors other than ethnicity and gender in determining corneal radius. As the distance between subjects and the camera in the CFD is approximately 2 feet, beyond the 12 to 16 inch standard user-device range, the CFD provides a more rigorous assessment of the algorithm’s ability to accurately measure the cornea.
In conducting this study, the gender and ethnic categorizations indicated in the CFD were recorded, as consistency in results across various subgroups can serve as an indication of the generalizability of the results. In particular, since the corneal diameter is a metric consistent across humans, it is important to show that similar results would be attained across both males and females as well as across different ethnicities. 24 The eight demographic categories as indicated in the CFD are Asian Female (AF), Asian Male (AM), White Female (WF), White Male (WM), Latino Female (LF), Latino Male (LM), Black Female (BF), and Black Male (BM). 23 From the CFD, 25 images from each of these groups were selected, and therefore the study included an overall 200 analyzed images. Twenty-five images were selected per category, because one ethnic group—Asian Females—had a maximum of 25 neutral facial expression images in the CFD.
The method for this study involved running the algorithm on these images from the CFD, with 10 trials for each of the 200 selected images, and comparing the determined corneal radius (pixels) to the actual corneal radius (pixels) of the face images. Ten trials were conducted to account for the stochastic nature of RANSAC; in live image testing though, these variations are already accounted for through outlier filtering—also known as temporal filtering. To determine the actual corneal radius of each of the CFD images, macOS Preview was used to manually and precisely circle the anatomical right cornea of each face image exactly at its border with the sclera, using color contrast. The number of image pixels across the radius of this generated circle was computed using the Inspector tool in macOS Preview, and these values were recorded as the ground truth for comparison against the corneal radius values obtained from running the algorithm on the images.
Dynamic distance determination
The corneal limbus can be well-approximated as a circle; its diameter (11.71 ± 0.42 mm) has been shown to be an anatomically conserved metric across humans.24,25 Thus, the corneal diameter can be used to implement a scaling calculation in which changes in distance (inches) are related to changes in the cornea’s radius (pixels), as shown on the screen of the mobile device. Specifically, the direct proportionality between a reference corneal diameter (pixels) and a correspondingly measured reference distance is used to calculate a particular, unknown distance (inches) given any measured corneal radius (pixels). For configuration, the reference distance was set to 14 inches, a reference at which the corneal diameter (pixels) on the mobile display was computationally measured to determine the scaling proportionality constant. Fourteen inches was chosen as the central reference distance, since 14 inches is the average distance at which a user holds a mobile device relative to the face. 26 As a result, the most accurate measurement is derived on average, because the patient will, on average, be holding the mobile device at a distance of 14 inches from the cornea.
The video capture resolution was set to 1280 pixels by 720 pixels, commonly known as 720 p. When the subject’s face is 14 inches away, the cornea’s diameter is represented by approximately 38 pixels in the video frame. The number of pixels was determined by having a subject hold the device 14 inches away, taking device screenshots of the subject’s cornea at that distance, and then averaging the corneal diameters (pixels) in the captured images. The corneal diameters (pixels) were determined in macOS Preview. Thus, a reference proportion of

Calculation of visual acuity
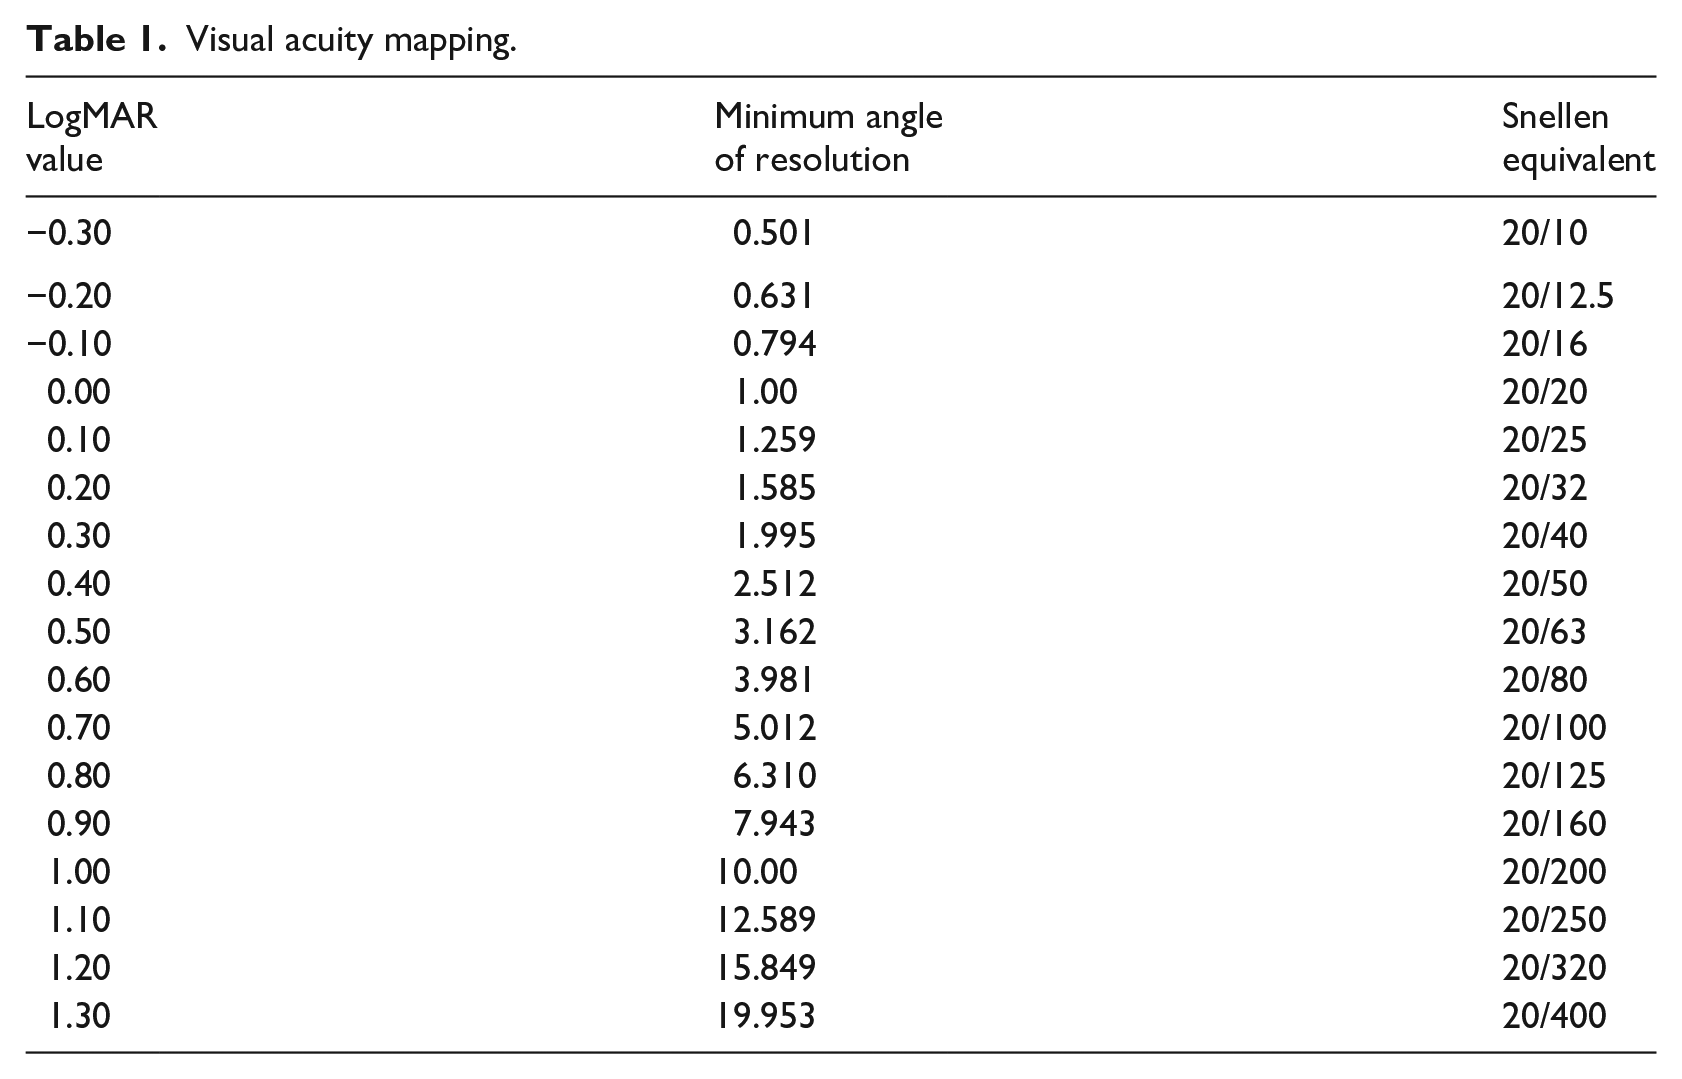
Following real-time distance determination, the visual acuity is computed by incrementing LogMAR (logarithm of the minimum angle of resolution) values starting at a reference LogMAR value of 0 (Snellen equivalent of 20/20) and progressing in increments of 0.1 until the proper visual acuity is determined. LogMAR is a visual acuity scale defined by the base-10 logarithm of the minimum angle of resolution, the angle that subtends the top and bottom of a letter, as shown in Figure 2.
27
It should be noted that this reference LogMAR value of 0 is the LogMAR value used for the reference corneal measurement described in the previous section. For instance, if a test subject’s visual acuity is 20/200, the LogMAR value would successively increase by 0.1 (with each increase corresponding to a separate assessment) until the LogMAR value reached 1.00. Table 1 illustrates the mapping of LogMAR values to Snellen equivalents and the minimum angle of resolution.
27
The size of each letter displayed on the screen can be calculated as shown in equation (4), where
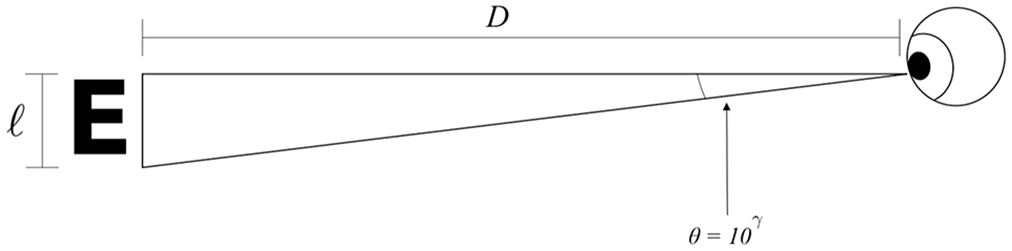
Diagram of letter size in relation to distance and angle between cornea and displayed letter.
Visual acuity mapping.

Five distance determination tests were conducted, at distances ranging from 12 inches to 16 inches; five trials were conducted per measurement. For each measurement, in addition to calculation of error between measured distance and theoretical distance, the letter size of a corresponding Snellen chart letter was determined, to verify the logic of scaling letter sizes according to distance. It should be noted that though both right eye and left eye testing was used in the mobile application, distance measurements and corneal radius measurements were conducted only with the right eye, as the algorithm operates the same regardless of which eye is used in testing.
Results
Corneal detection testing
The key metric used to assess the accuracy of the corneal detection algorithm was percent difference in pixels over ten trials. Specifically, the size of the corneal radius (pixels) determined by the algorithm, for each of 10 independent trials, was compared to the size of a manually drawn corneal radius. The theoretically measured radius was outlined in a red circle while the measured radius was outlined in a white circle. Shown below are pairs of images for two different individuals from the CFD that were used in the study. The first pair of images (Figure 3) show the theoretical and measured detection on the same image of an Asian Female. These pair of images were chosen to show a case of high algorithm accuracy. The next pair of images (Figure 4) display the theoretical and measured detection by the algorithm on the same image of a White Male. This image pair was selected to illustrate a case of reduced algorithm accuracy. It is clear from an observation of the White Male images that the measured detection consists of some error when compared to the theoretical detection. In both cases, the left image is in color, as it is unprocessed, while the processed image on the right is rendered in grayscale, as it is processed.
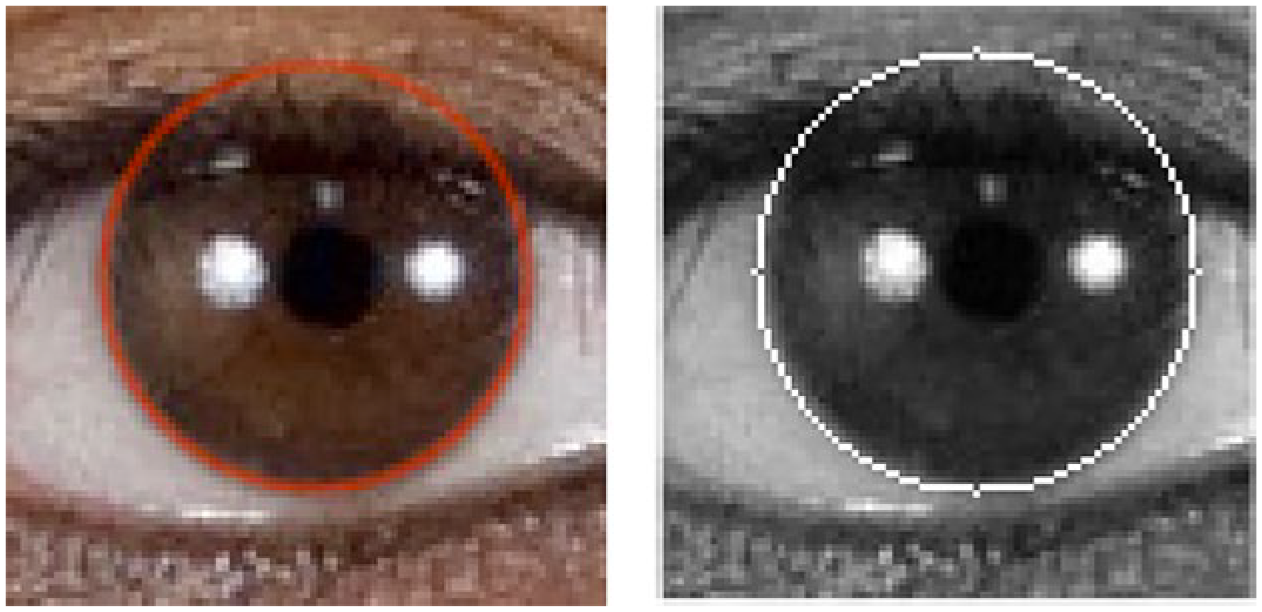
Asian Female: (left) theoretical corneal detection; (right) measured corneal detection. These images show the accuracy of the algorithm where the corneal detection is near perfect on the image when compared against the manually drawn image (ground truth).
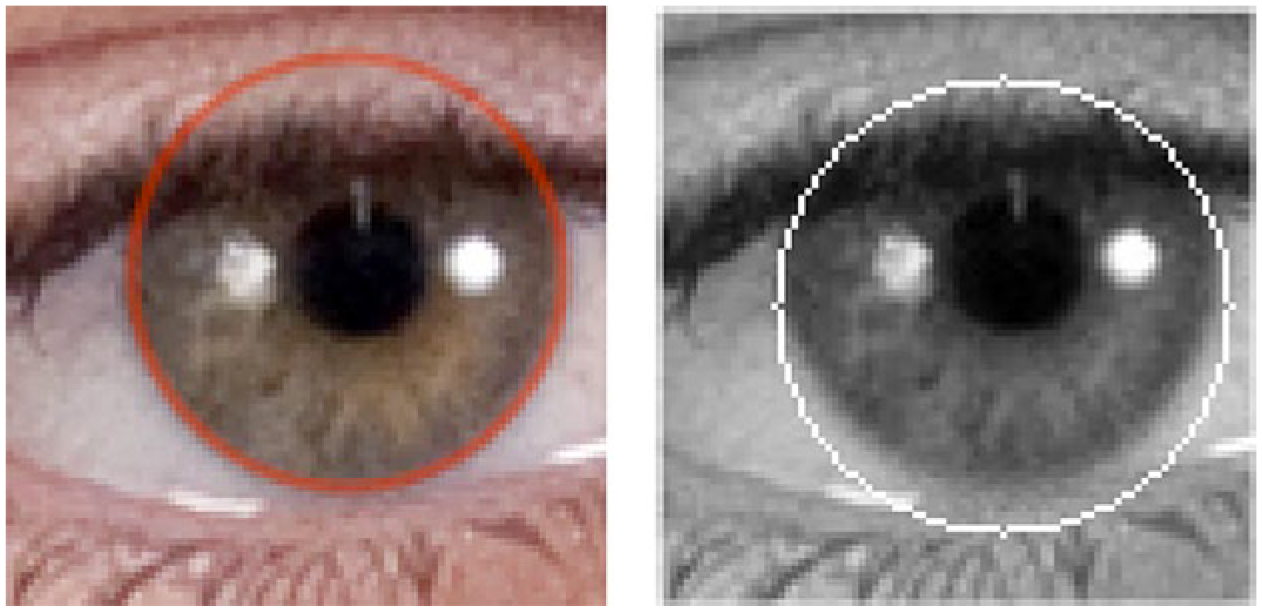
White Male: (left) theoretical corneal detection; (right) measured corneal detection. This image shows some error by the algorithm in detecting the corneal border and therefore in the detected corneal radius. However, the error is not significant over multiple trials.
The proposed corneal detection method focuses on corneal radius rather than area of overlap between the actual corneal circle and the predicted corneal circle. This is because the primary metric of concern in this study is the distance between the cornea and the device. As the initial calibration of distance between the user and the device only uses corneal radius, only corneal radius is required to make a distance estimation. In other words, a small offset between the center of the predicted corneal circle and the actual corneal circle will not influence overall distance determination. While not necessary for this study, an option to verify more precise corneal detection based on area overlap is to compute Intersection over Union (IoU), a commonly used metric for object detection. 28
Corneal detection was successful in each of the 200 CFD images tested. Each tested image had exactly one corneal detection (as only the right eye was probed) and there were no cases where the corneal circle was drawn on an object other than the cornea itself. While there were small offsets between the actual corneal center and the predicted corneal center, these were minor variations that had little impact on the distance determination accuracy, as discussed in the Distance Determination Testing section.
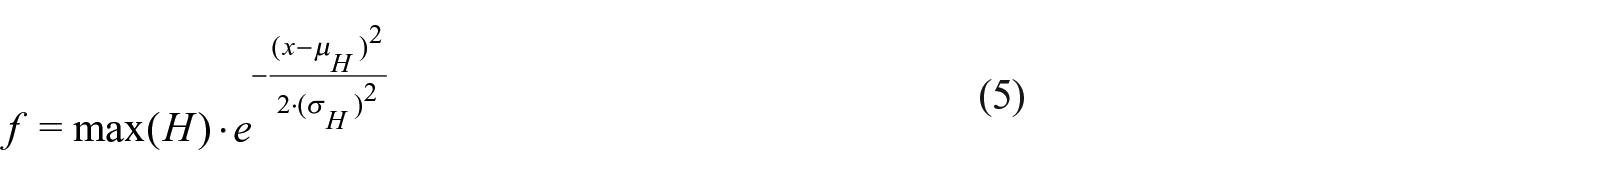
For each ethnic group and gender, a 30-bin histogram of calculated corneal radius percent difference from the theoretically determined value was plotted (Figures 5 and 6). Each of these histograms includes 250 data points (25 images with 10 trials per image). Additionally, the scaled probability density of the normal distribution on the histogram was overlaid to determine how well the percent difference distribution approximated it. The normal distribution curve was computed as shown in equation (5).
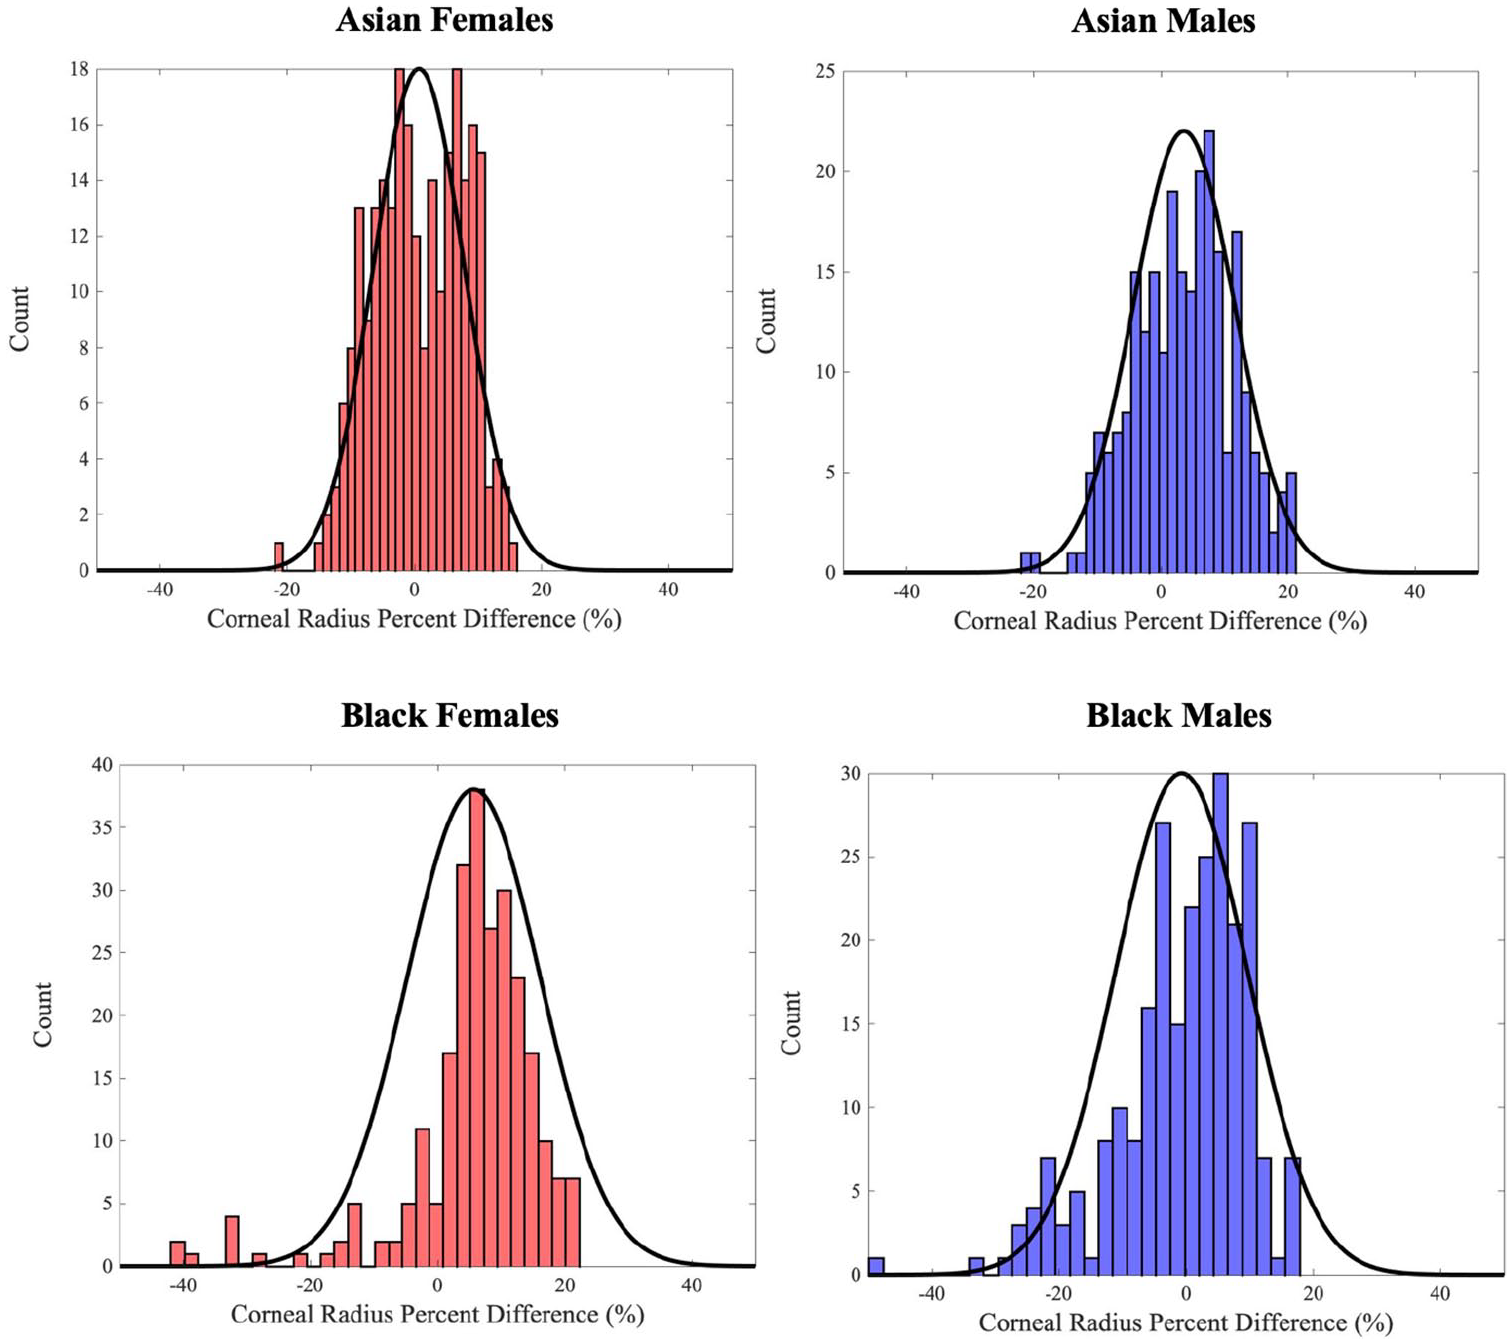
Corneal radius percent difference distributions for Asian and Black ethnicities; theoretical normal distribution overlaid as black line.
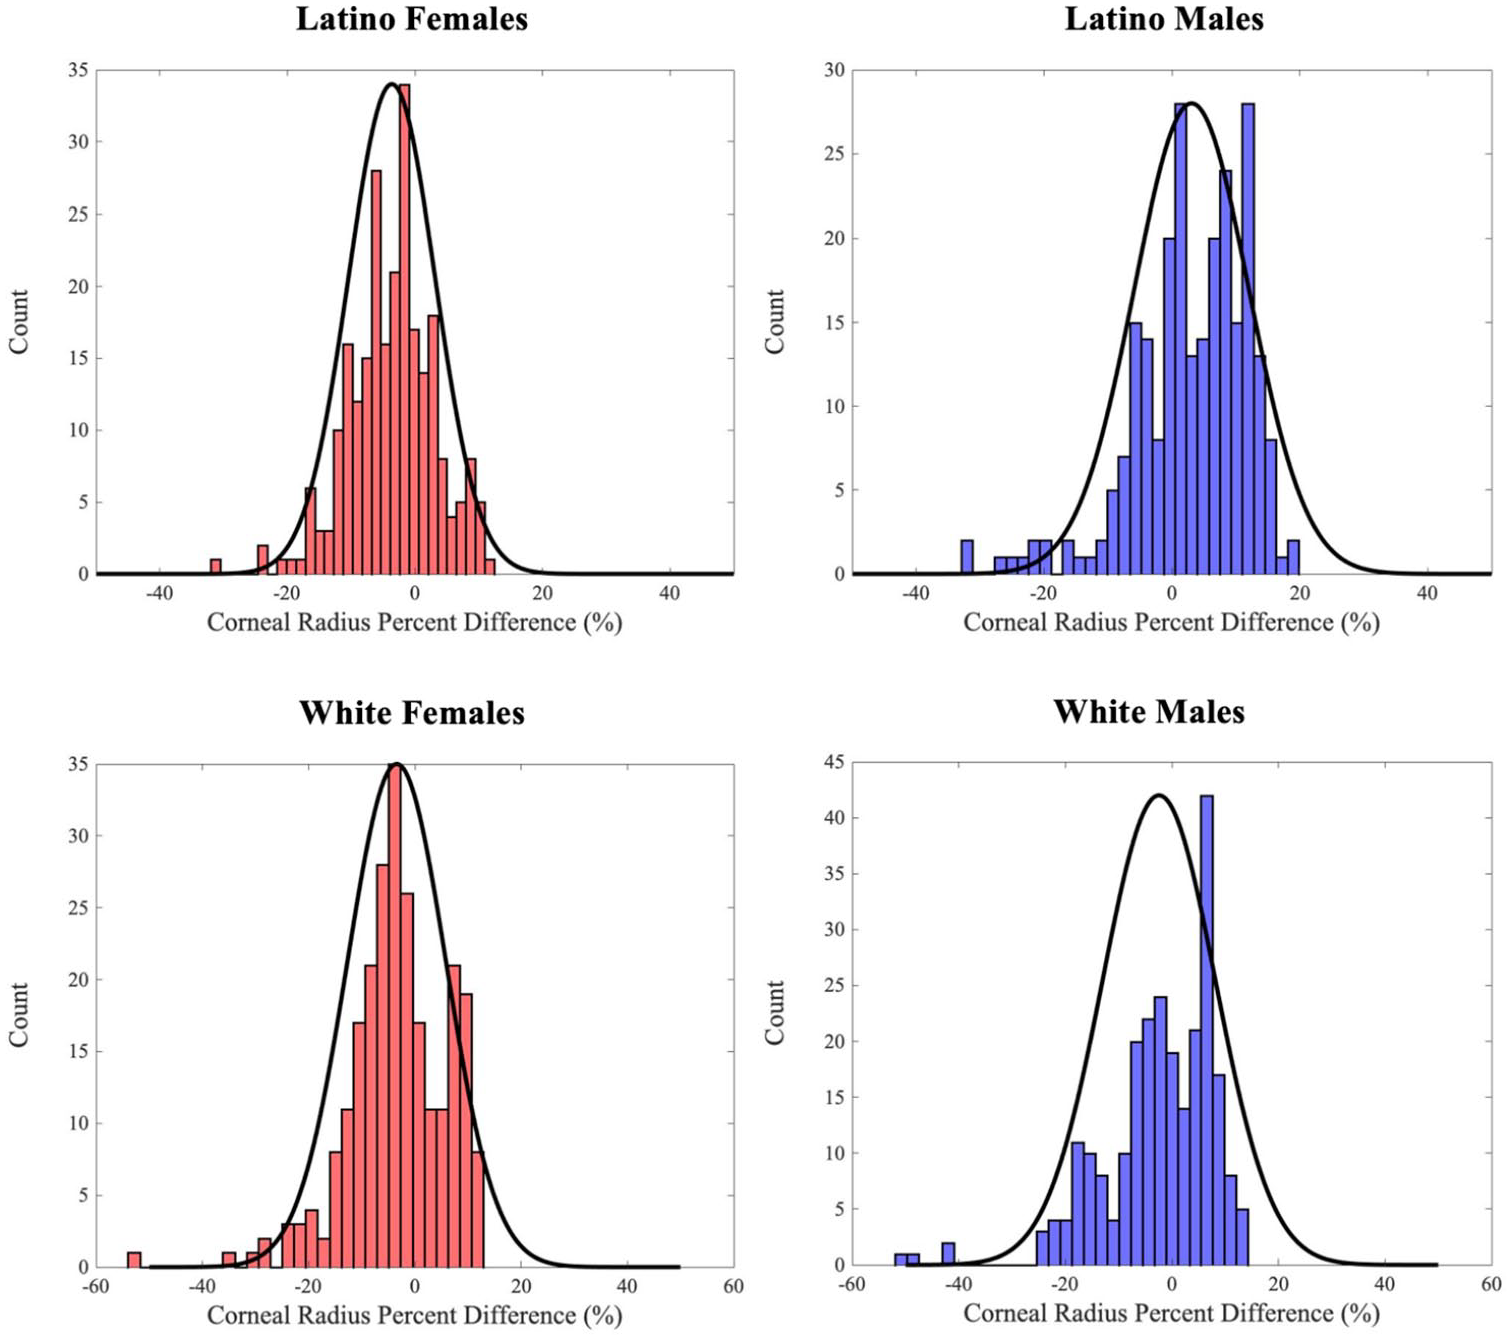
Corneal radius percent difference distributions for Latino and White ethnicities; theoretical normal distribution overlaid as black line.
where
The Lilliefors test was used for normality analysis.
29
As such, the test decision for the null hypothesis was that the relative corneal radius errors for each ethnic group belonged to a distribution in the normal family, against the alternative that they did not come from such a distribution. The result was resolved to a boolean: 1 if the test rejects the null hypothesis at the 0.1% significance level, and 0 otherwise. The test statistic,

where
Lilliefors test variables.
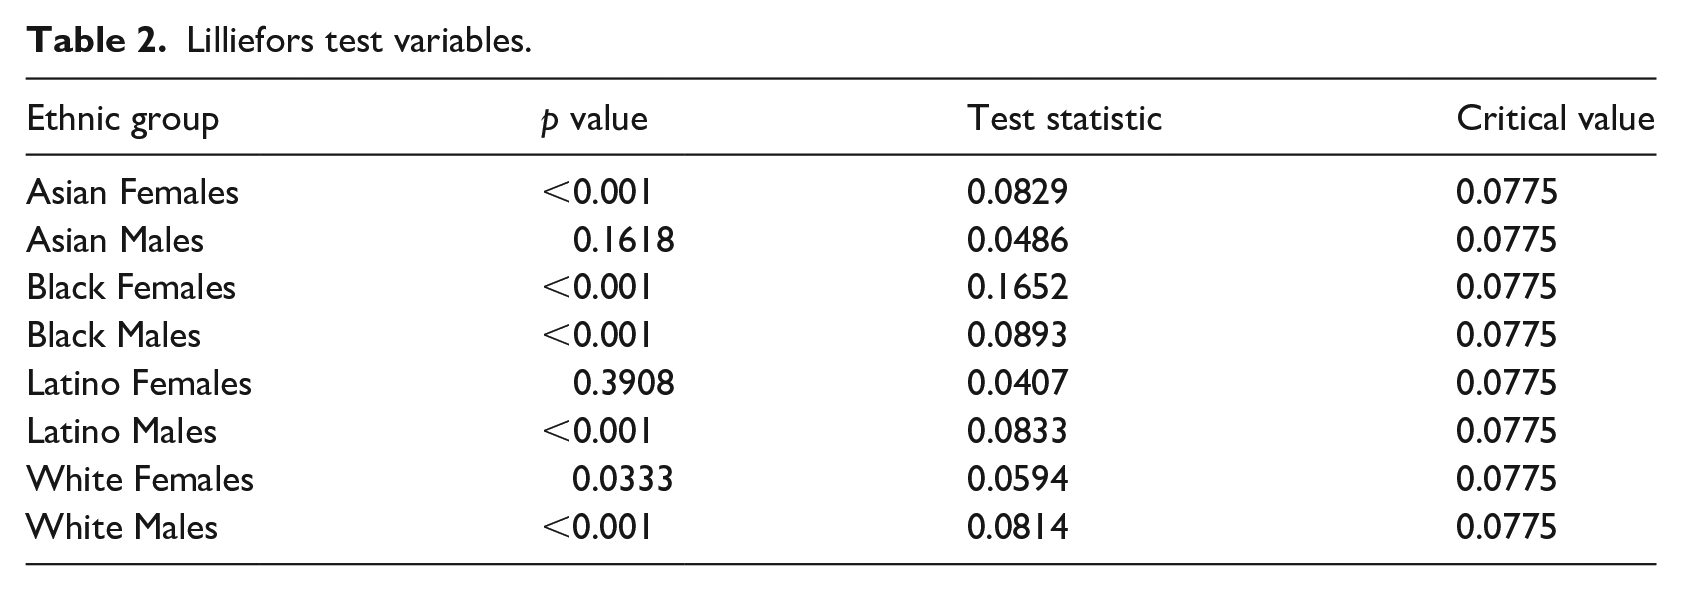
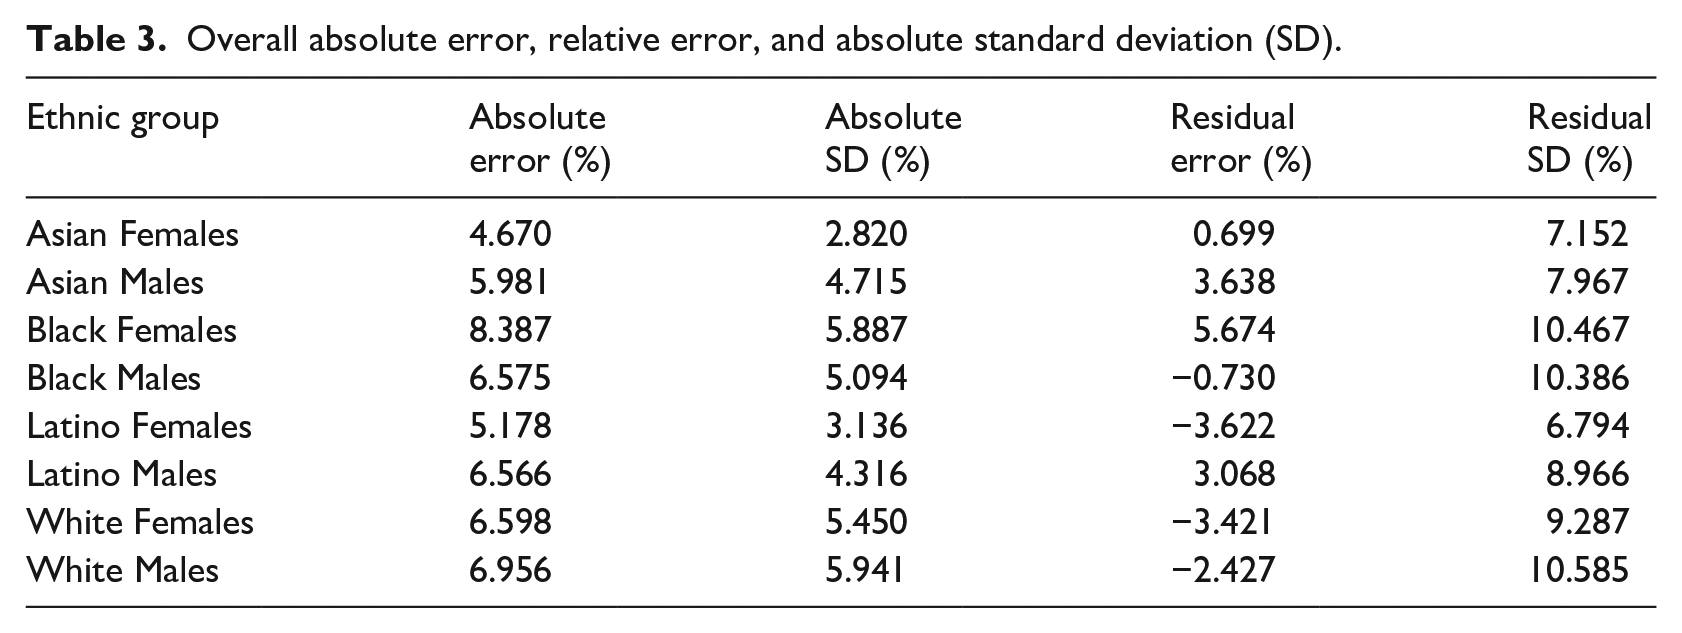
Figure 7 depicts the absolute corneal radius error for each ethnic group with the average absolute corneal radius error across all ethnicities shown as a horizontal red line. Table 3 illustrates a detailed summary of the absolute corneal radius errors, standard deviation of absolute corneal radius errors, average residual corneal radius errors, and standard deviation of residual corneal radius errors for each ethnic group and gender subset.
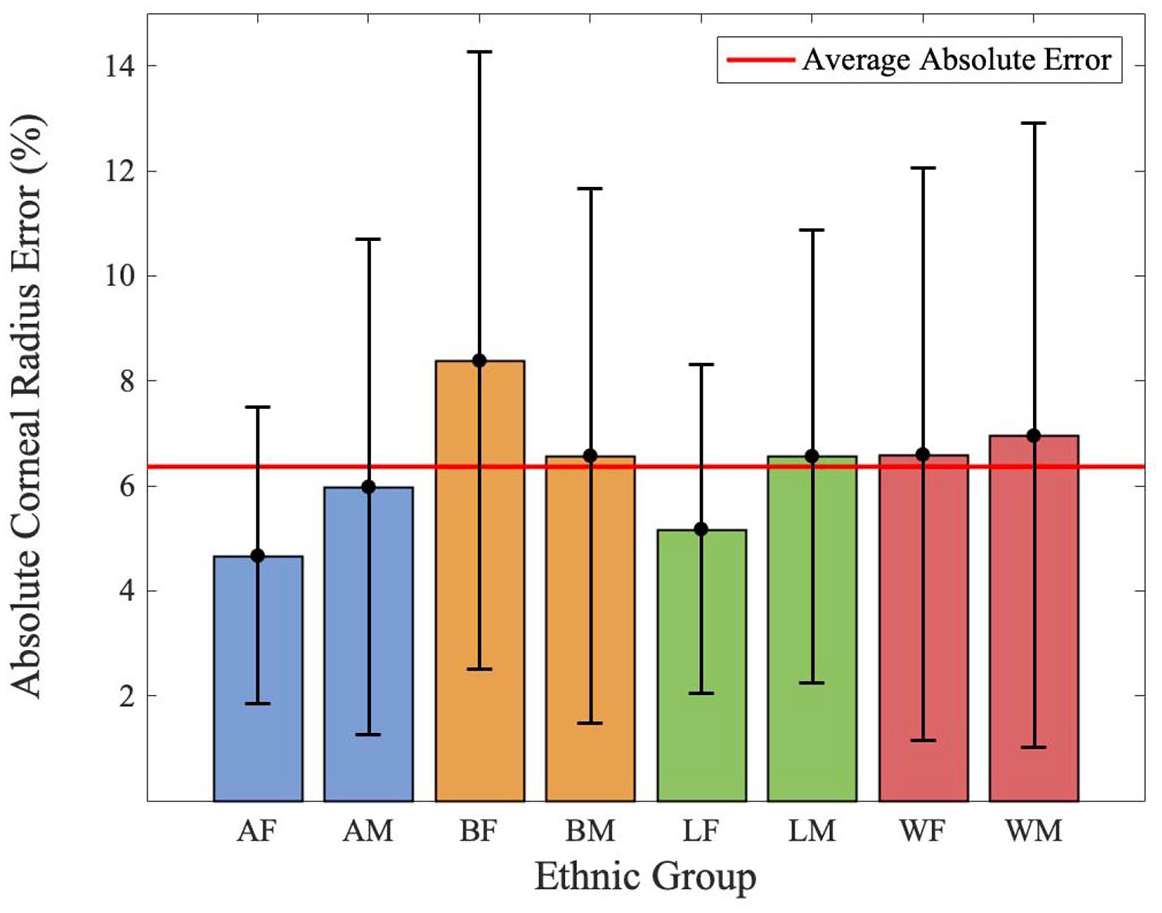
Absolute corneal radius error per ethnic group.
Overall absolute error, relative error, and absolute standard deviation (SD).
Distance determination testing
Following verification of the accuracy of corneal radius measurement across various ethnicities and genders using the CFD images, the quality of the algorithm’s temporal filtering was assessed. Specifically, a single user was used to measure how well distances from the cornea could be approximated after the algorithm had been run for a set interval of time.
Since the average, standard distance at which a patient would hold a mobile device from their face in order to view the device screen is 14 inches, 26 the algorithm was tested at distances ranging from 12 to 16 inches, with increments of 1 inch. This methodology gives a buffer of 2 inches of movement from the standard in either direction.
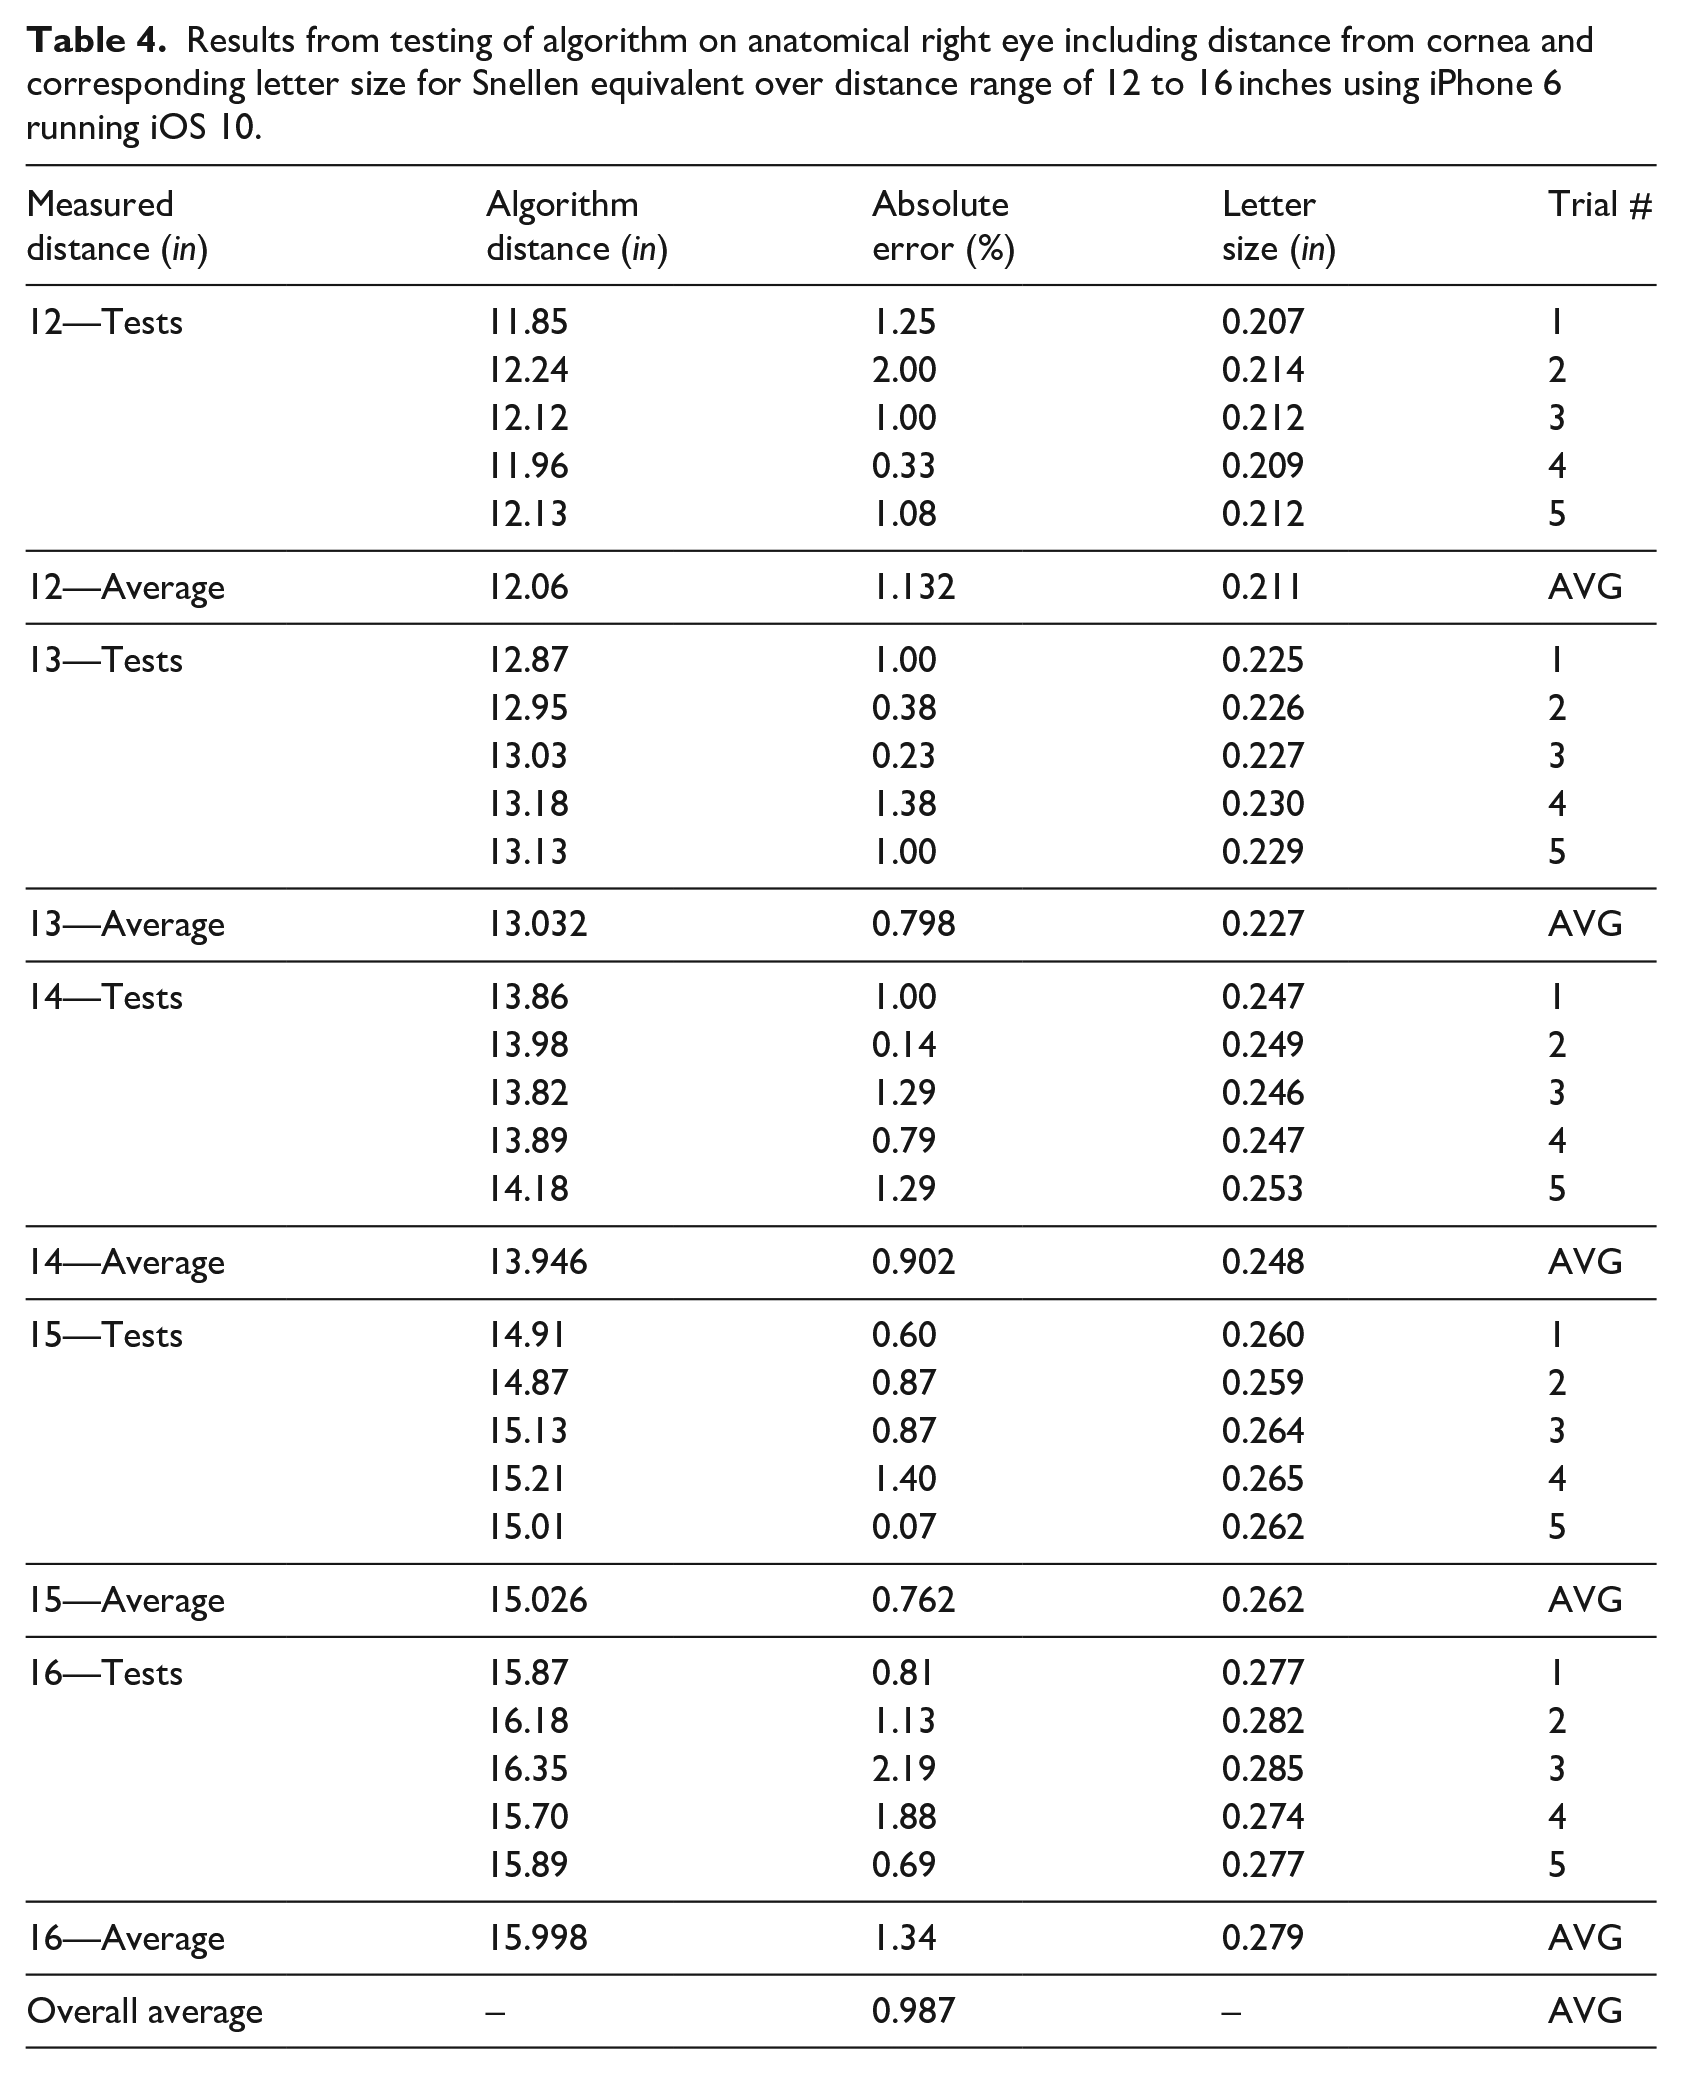
The data is collected over five trials for each particular distance within the range of 12 to 16 inches. The mobile device was held at each of 12, 13, 14, 15, and 16 inches as measured using a standard 18 inch ruler. At each distance, the algorithm was run in real-time on the live image stream generated by the front-facing camera of the iPhone 6 mobile device (1.2 megapixels and 720p video). The distance from the anatomical right cornea to the mobile device was measured by the algorithm and recorded. Each measurement was taken exactly 5 s after the algorithm was run at each distance, allowing for the temporal data filtering to take effect. 30 From Table 4, it can be seen that the average absolute error for each distance measurement over the specified range is less than or equal to 1.34%. Moreover, the overall average absolute error across the range of 12 to 16 inches is 0.987% which attests to the strong accuracy of the algorithm for distance determination in real-time.
Results from testing of algorithm on anatomical right eye including distance from cornea and corresponding letter size for Snellen equivalent over distance range of 12 to 16 inches using iPhone 6 running iOS 10.
Figures 8 and 9 demonstrate the corneal detection interface and the user interface for the mobile Snellen chart, respectively. In Figure 8, the green circle delineates the cornea which the algorithm has located in the image (after edge detection processing). At the top of the image, we can see the distance (inches) between the user and the mobile device; the circle detected is smaller for the image on the right than it is for the image on the left, as it should be. In Figure 9, the Snellen letters appear smaller at a distance of 12.75 inches and larger at distance of 17.25 inches. This is consistent with the fact that the letters should be larger when the user is at farther distances, in order to maintain a constant ratio between distance and letter size. 31
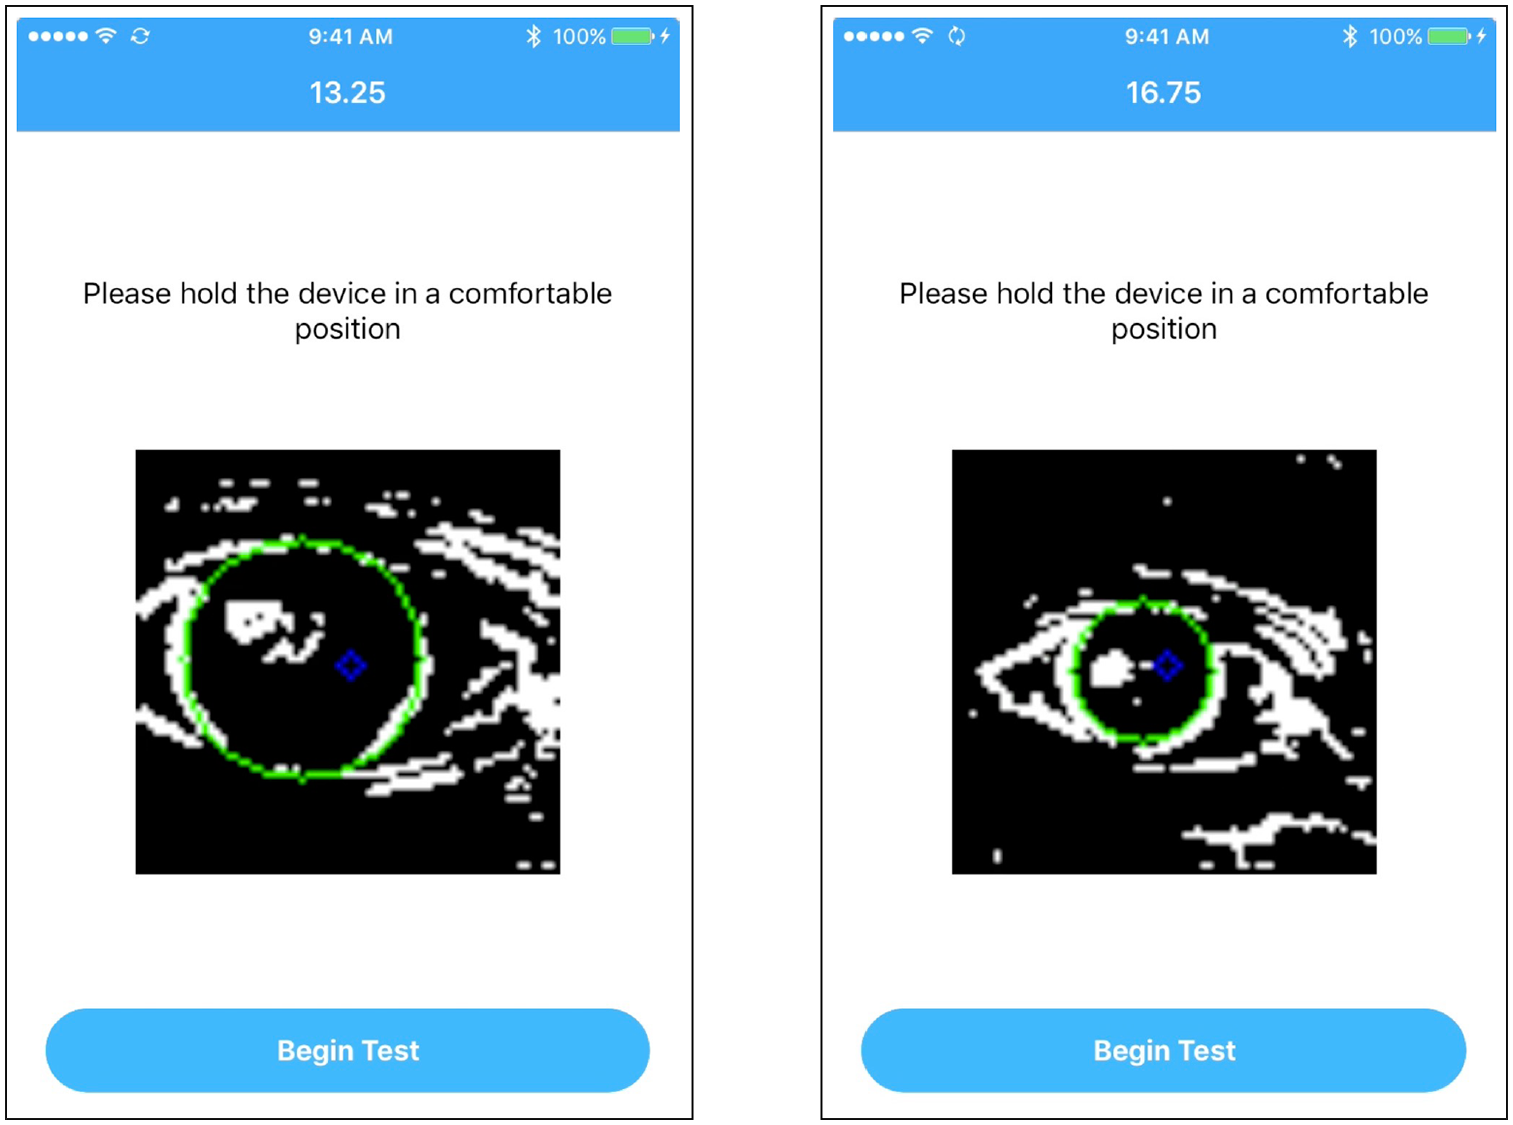
Real-time corneal detection on live image as displayed to user when configuring distance to begin eye exam.
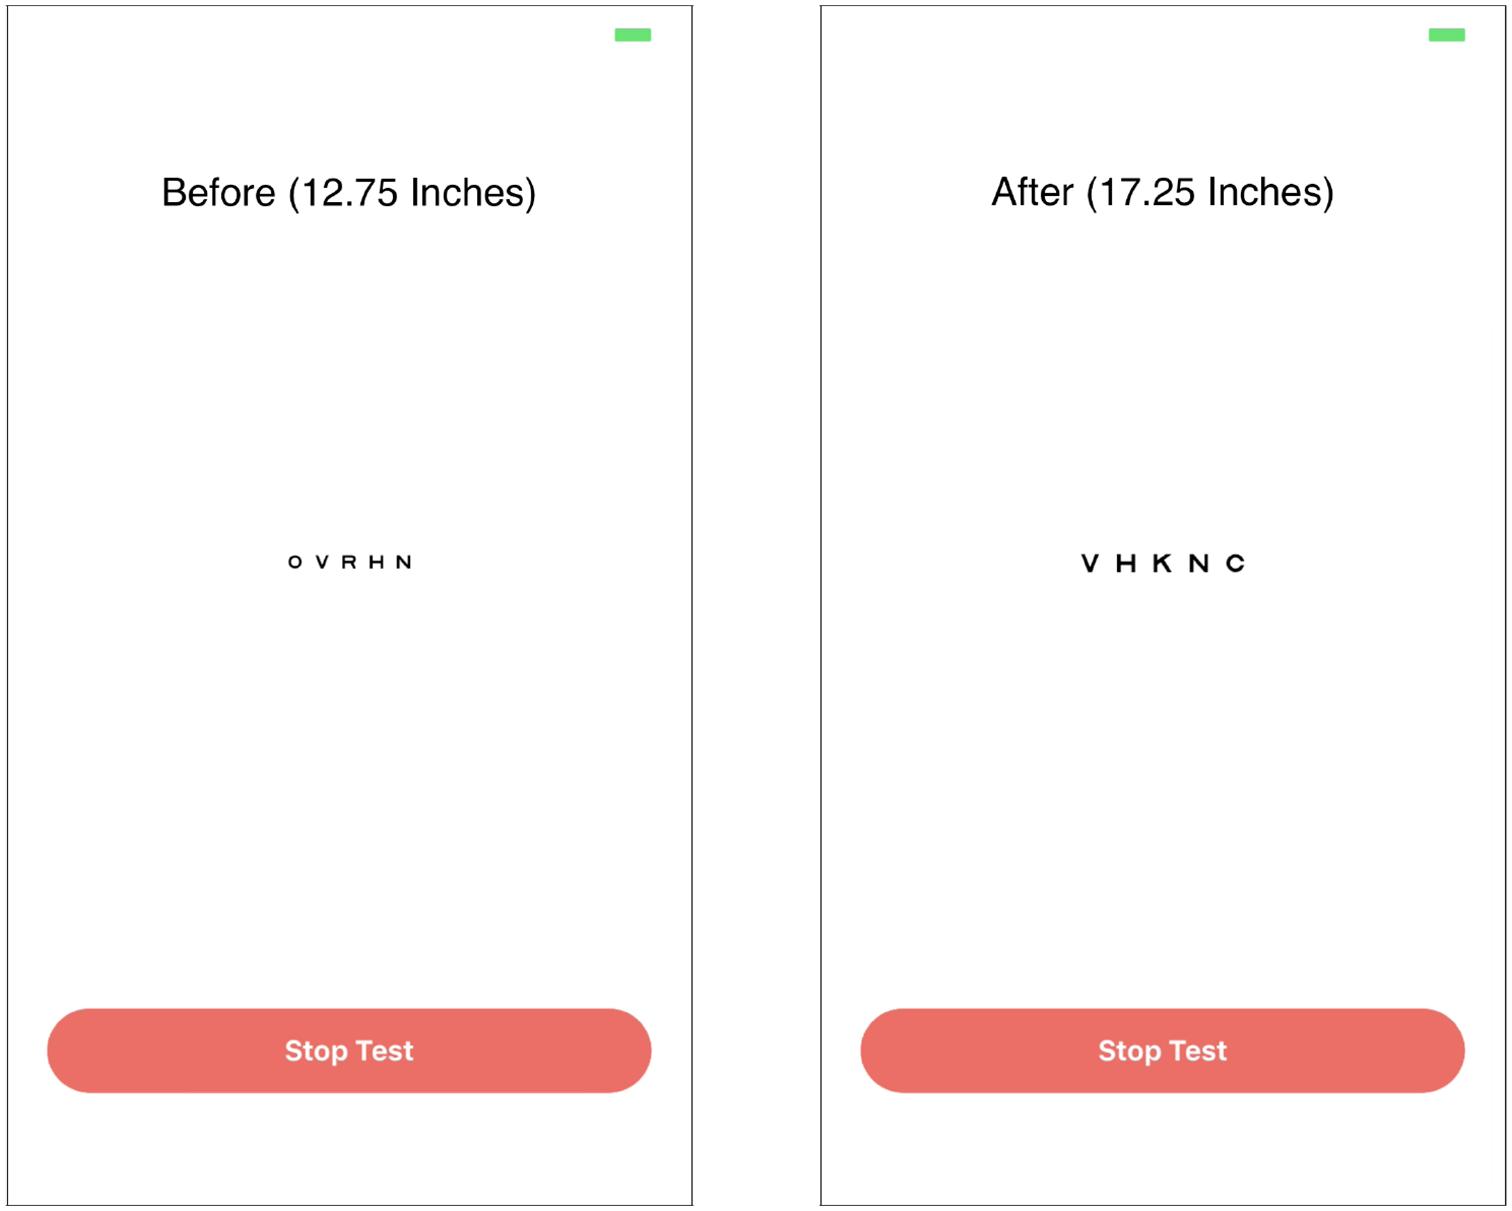
Dynamic scaling of Snellen chart letter size based on the determined distance.
The Supplemental Video included with this paper presents a screen-recorded video clip of the algorithm running in real-time on an iPhone X operating on iOS 12. In particular, the video shows the cornea being detected (green circle) with the distance (inches) dynamically updated at the top of the screen. Once the user is comfortable with the distance at which he or she is holding the mobile device, the vision test is initiated by selecting the “Begin Test” button. The user proceeds to take the mobile eye exam, first testing the right eye (with left eye covered) and then testing the left eye (with right eye covered). Speech recognition is enabled by the iOS Speech SDK for iOS 10. Upon completion of the exam, the visual acuity results are displayed to the user, showing both the Snellen and LogMAR equivalents of the visual acuity in each eye. An iPhone X was used to record this video of the algorithm running on a complete mobile eye exam to illustrate the forward compatibility of the algorithm. Notably, the speed of real-time corneal detection is noticeably quicker on an iPhone X compared to an iPhone 6, which supports the claim that future advancements in the hardware technology of smartphones will improve the performance of the algorithm.
Discussion
The algorithm performed very well on images from the Asian ethnicity (Figure 5), with absolute errors of 4.67% and 5.98% for Asian Females and Asian males, respectively. The average absolute error of the Asian ethnicity is 5.33%, which is well below 6.36%, the average absolute error across all genders and ethnicities. The histogram analysis shows that the distributions for Asian Females and Asian Males are approximately normal. For Asian Females, nearly all values lie within two standard deviations of the mean (−13.61% to 15.00%), though corneal radius percent difference conforms more closely to a bimodal distribution. For Asian Males, nearly all of the values also lie within two standard deviations of the mean (−12.30% to 19.57%), and the mean is contained within the bin of the highest frequency. Though several of the Asian ethnicity images had portions of the cornea obscured by the top and bottom eyelids, which limits the available surface area for corneal detection, the algorithm performed well and maintained low error. This finding illustrates that despite there being less of the cornea visible, and thus less data to pinpoint the circular boundary of the cornea, the accuracy of detection was not compromised. In fact, it can be inferred that having fewer data points leads to less noise or confounding features that might affect the algorithm’s performance.32,33
The Black ethnicity had greater average absolute error in corneal detection (7.48%) than the overall average of 6.36%—this is comprised of the average absolute error for Black Females (8.39%) and Black Males (6.58%). The histogram analysis (Figure 5) shows that for Black Females, the mean of the percent difference is significantly greater than zero (5.67%) and thus the corneal radius values are, on average, over-approximated. Additionally, most values can be encompassed within three standard deviations of the mean (−25.73% to 37.08%); the exceptions occur at a value slightly beyond the third standard deviation below the mean. By contrast, the Black Male images have a far lower sample mean of −0.73%, which indicates high corneal detection accuracy. Indeed, we can see almost all values lie within two standard deviations of the mean (−21.50% to 20.04%). The Black ethnicity images mostly displayed the full cornea; however, error was higher than for the Asian ethnicity images. This counter-intuitive phenomenon is likely due to the fact that there were shadows and wrinkles around the corneal region in these images, which corroborates the earlier conclusion that more data points may result in noise that lowers the algorithm’s accuracy.
The Latino ethnicity had a combined average absolute error of 5.87%, which was the second lowest ethnicity-specific overall error. There was, however, a 1.39% difference in average absolute error measurements between Latino Females (5.18%) and Latino Males (6.57%). When analyzing the histograms (Figure 6), it is immediately apparent that there is a sharp contrast between the mean sample percent differences; for Latino Females it is −3.62%, while for Latino Males it is 3.07%. As such, the values skew negative for Latino Females and positive for Latino Males. Nevertheless, both have almost all values between three standard deviations of the mean (−24.00% to 16.76% for Latino Females and −23.83% to 29.97% for Latino Males). Values for both Latino Females and Latino Males also appear clustered together; indeed, the average absolute standard deviation across both groups (3.73%) is the lowest of all ethnicities. This can be seen from the histograms, which have few empty bins.
The White ethnicity had an average absolute error for corneal detection of 6.78%, which is closest to the overall average of 6.33%—both the average absolute error for White Females (6.60%) and for White Males (6.96%) are close to this global error. The histogram analysis (Figure 6) shows that unlike for the other ethnicities, the sample mean of percent difference between genders was relatively close: −3.42% and −2.43% for White Females and White Males, respectively. However, the highest frequency bin was negative for White Females and positive for White Males—both, though, had a frequency greater than 30. Additionally, both distributions of percent difference had almost all values within three standard deviations of the mean (−31.28% to 24.44% for White Females and −34.18% to 29.33% for White Males), with a few outliers beyond the third standard deviation below the mean. These outliers are responsible for the White ethnicity having the highest average sample standard deviation; if the outliers were removed, the average standard deviation would decrease by 7.48%. A qualitative analysis of the images yields insight into the above findings—there are generally fewer features, such as lighting differences and texture of skin, that surround the cornea in the White Female images compared to the White Male images; this makes the algorithm less susceptible to over-approximation of corneal radius.
The results in Figure 7 show that images of Asian Females on average resulted in the most accurate corneal detection using the algorithm, while images of Black Females on average resulted in the least accurate corneal detection. Images in which the top and bottom of the cornea are mostly covered by the eyelids outperformed images in which the entire cornea is visible, in terms of accuracy of the corneal detection. Though it seems counter-intuitive that a less visible cornea would result in better corneal detection, this phenomenon could be due to extra artifacts in the image when more of the cornea is visible. Therefore, there is more interference when the algorithm is trying to draw a circle of best fit around the three reference points.34,35 Another key point to note is that the error bars in Figure 7 all overlap, indicating that there is no statistically significant difference in absolute corneal radius error between the eight ethnicity/gender categories. This result attests to the algorithm’s generalizability, given that the corneal radius is a conserved metric across humans.
As shown in Table 2 and based on normality analysis of the data presented in Figures 5 and 6, the corneal radius percent difference distributions for Asian Males, Latino Females, and White Females can be resolved as normal at the given significance level of 0.1%. The remaining distributions (those for Asian Females, Black Males, Black Females, Latino Males, and White Males) cannot be strictly classified as normal based on this normality test. These findings are consistent with visual inspection of the distributions. It is not expected that the distributions will be perfectly normal due to the fact that a sample size of 250 data points is quite small when considering an entire population of, say, Asian Males. The overlaid normal distribution curves show how the sample distributions deviate from a theoretical population.
Normality of the corneal radius percent difference distributions provides statistical verification of the consistency of the data measurements (i.e. limited skews or outliers in the data). Since the distributions themselves represent the accuracy of the corneal radius measurements (as they are histograms showing percent difference), the approximate normality of the Asian Male, Latino Female, and White Female distributions show that not only are these datasets accurate, but also precise. Though the distributions for the other groups cannot be classified as normal, it should be noted that normality is not the only measure of a dataset’s reliability. In fact, the relatively low residual error and absolute standard deviation for these groups demonstrate consistent corneal detection. For example, the Asian Female distribution cannot be strictly classified as normal, yet its absolute standard deviation of 2.82% is the lowest among all groups tested.
From the presented results, it is evident that the algorithm exhibits significantly less error when testing at the stage of distance determination (0.987%) rather than corneal detection (6.33%). As distance determination follows corneal detection as outlined in Figure 1, it would seem logical that any error in an earlier stage would compound at a later stage in the algorithm; the results, however, show the contrary. This is a consequence of the fact that the distance determination study was done using the front facing camera on the iPhone 6, and thus the algorithm was constantly being run in real-time on a live image stream rather than one static image as in the case of the corneal detection study. As a result, the real-time data filtering (where outliers are removed) is present in the distance determination study since there is a temporal component. 36 Hence, the filtering allows for an aggregation of more accurate results with the corneal detection and thus translates to lower error when the corneal radius measurement is scaled accordingly to determine the distance. Moreover, the differences between the distances measured by the algorithm between trials are minimized when examining the corresponding letter size differences. For example, the deviation in the algorithm-predicted distance from the measured distance of 12 inches between trials 1 and 2 is 0.39 inches. However, the corresponding difference in letter size is only 0.07 inches. This is because the tangent function used to calculate letter size has a relatively small output for low input values.
Conclusion
This study demonstrates the accuracy and generalizability of optical detection of and real-time distance determination from the cornea for mobile vision testing. Initially, the precision of corneal detection in static images was verified using the CFD. Eight demographic categories, with 25 images from each group were selected and passed through the corneal detection algorithm. The radius (pixels) of a theoretically drawn corneal circle was compared to that of the algorithm’s calculated corneal circle. The average absolute error was relatively low for all groups (6.33%); the individual breakdowns were as follows: Asian Females (4.69%), Asian Males (6.07%), Black Females (8.25%), Black Males (6.39%), Latino Females (4.93%), Latino Males (6.81%), White Females (6.56%), and White Males (6.88%). Distribution of error for the Asian Male, Latino Female, and White Female groups was normal; for the other groups, normality analysis was not conclusive.
Subsequently, distance determination with live image streams was assessed. Due to the additional data available from live image streams as opposed to a single static image, the system was able to more accurately predict the corneal circle; the average absolute error across distances of 12 to 16 inches was significantly lower, at 0.987%. Thus, the proposed mobile application is robust, efficient, and consistent; it showcases the potential of this approach for effective visual acuity assessments.
Future applications of the proposed methodology in areas outside of vision testing include reading and gaming on mobile devices. Since people tend to hold mobile devices closer than they would a book or newspaper, they experience eye strain. 26 The proposed methodology would address this issue by dynamically increasing text size to encourage the viewer to hold the device further away, thereby mitigating symptoms of eye strain. With respect to gaming, distance determination via corneal detection adds a new dimension to the gaming experience, whereby the user can move the mobile device closer or farther from their face; this will result in a controlled effect in the game environment. 37
Since the initiation of this study, iOS mobile technology, smartphone hardware, and computer vision have had significant enhancements. 38 These should be considered in further studies to improve the effectiveness of the proposed algorithm. In particular, training the algorithm with data from theoretical measurements and using hardware acceleration to more quickly pinpoint facial features such as the cornea will further improve the algorithm’s operation.39,40 Furthermore, additional enhancements to the algorithm to mitigate any demographic group-specific errors will ensure even stronger generalizability of accuracy across the global human population.
Footnotes
Acknowledgements
We thank Debbie S Ma, Joshua Correll, and Bernd Wittenbrink at the University of Chicago for access to the Chicago Face Database.
Declaration of conflicting interests
The author(s) declared no potential conflicts of interest with respect to the research, authorship, and/or publication of this article.
Funding
The author(s) received no financial support for the research, authorship, and/or publication of this article.
Supplemental material
Supplemental material for this article is available online.
References
Supplementary Material
Please find the following supplemental material available below.
For Open Access articles published under a Creative Commons License, all supplemental material carries the same license as the article it is associated with.
For non-Open Access articles published, all supplemental material carries a non-exclusive license, and permission requests for re-use of supplemental material or any part of supplemental material shall be sent directly to the copyright owner as specified in the copyright notice associated with the article.