
Abstract
Critical for the early diagnosis of genetic disorders, a Family Health History (FHx) can be collected in several ways including electronic FHx tools, which aid easy editing and sharing by linking with other information management portals. The user acceptance of such systems is critical, especially among older adults experiencing motor and cognitive issues. This study investigated two types of FHx interfaces, standard and Virtual Conversational Agent (VCA), using 30 young (between 18 and 30) and 24 older participants (over 60). Workload, usability and performance data were collected. Even though participants required less time to complete three of five tasks on the standard interface, the VCA interface performed better in terms of subjective workload and usability. Additionally, 67% of the older adults preferred the VCA interface since it provided context-based guidance during the data collection process. The results from this study have implications for the use of virtual assistants in FHx and other areas of data collection.
Keywords
Introduction
The early diagnosis of a disease or its potential means preventive actions can be initiated based on the information a family health history can provide, thereby enhancing the quality of healthcare services. 1 One method for collecting this information is to use Family Health History (FHx) tools, which play an important role in determining an individual’s risk for certain illnesses, especially those with genetic causes.2–4
Different methods for collecting an FHx employed by medical service providers include face-to-face conversations, emails, paperwork, or phone conversations. 5 According to Qureshi et al., 6 self-collection FHx tools have been found to exhibit comparable performance as other methods of collection; ranging from paper-based methods to electronic tools, they offer several potential advantages as they can obtain more accurate information in a short time for a large population.7–10 The benefits of this approach in terms of clinical care is that, first, patients can potentially provide and then have subsequent access to complete and accurate FHx information as they can contact their relatives and consult previous records at their leisure. Second, care providers can focus on utilizing the collected family history rather than obtaining it, thus improving both their effectiveness and efficiency. 11
Of the various FHx collection methods, electronic tools have received much attention recently in light of technological advances. 12 These FHx tools have the advantage of being able to be linked with other patient information management portals like electronic health records (EHR), 11 with some even providing support for clinical decisions by supplying risk assessment and recommendations based on the data.13,14 In addition, electronic FHx tools allow users to easily edit and share information online, meaning incorrect or missing information can be easily corrected or added, something that is much more difficult when using other FHx methods.15,16 Ozok et al. 5 measured the usefulness of these electronic FHx tools, finding the system to be helpful for both patients and medical care providers.
Because of these advantages, the usability of electronic FHx tools is especially critical since they will be used by people of diverse ages, affecting the overall effectiveness of the human-computer interaction.17–20 According to Fisk (1999), 21 there are more older adults than younger in developed nations, with Vincent and Velkoff (2010) 22 projecting the number of adults over 65 (geriatric population) reaching 88.5 million by the year 2050, twice the number in 2010. In the usability study, Mead et al. (1997) 23 found older adults experience unique usability challenges including being less efficient and needing more information on their current status on the pages and links they have previously visited. As a result, the effect of aging on the design of the interface and its usability merits careful investigation. 24
As older adults are often more homebound than other age groups, 25 technology has the potential to be a convenient way to address their health-related needs.26,27 But previous research has shown that older adults are often more resistant and face difficulties in adopting new technologies like mobile phones, information retrieval system in the workplace, automatic teller machines, and computerized healthcare systems.28–32 However, a study conducted by Arning and Ziefle (2009) 33 on acceptance of eHealth technologies found older adults have a more positive attitude toward accepting technology than younger adults, a surprising yet promising result for the future. They believe this result is due to older adults acknowledging the benefits of such eHealth applications. 33 Nevertheless, no research has been conducted on older Adults’ adoption of FHx tools, and to address this need, we used the Technology Acceptance Model (TAM) developed by Davis (1985). 34 TAM is an intention-based model explaining user acceptance of computer-based technology that has been used as the theoretical basis across various empirical studies of user technology acceptance.35–39
The past decade has seen an increase in data collection approaches, with virtual assistants, such as Virtual Conversational Agent (VCA) interfaces, being one of them. 40 For example, Wang et al. (2015) 41 developed a “virtual counselor,” VICKY, that asks users predefined questions about their FHx. Their results found that this animated computer character identified more health conditions than the Surgeon General’s My Family Health Portrait. Their study focused on the poor and underserved population. Preliminary results from a study of a second FHx tool using a virtual assistant as a method of data collection, ItRunsInMyFamily.com, found encouraging results based on user testing of this interface. 42
Since the use of virtual assistants for FHx data collection is a relatively new phenomenon, there has been limited research in this area, especially in regard to the geriatric population, which is important because the issues they face may be different from those of the general population. To investigate this issue, this study explored the effects of aging on different interface designs for FHx data collection using various task performance metrics and subjective measures. Specifically, this study aims to explore the following research questions (RQs):
RQ1. Does aging affect the acceptance of FHx collection technology?
RQ2. What is the effect of aging on the perceived usability of FHx interfaces?
RQ3. Does aging impact the perceived workload while interacting with the FHx interfaces?
RQ4. What is the effect of the design of FHx interfaces on the user acceptance and their perceived usability?
Method
Participants
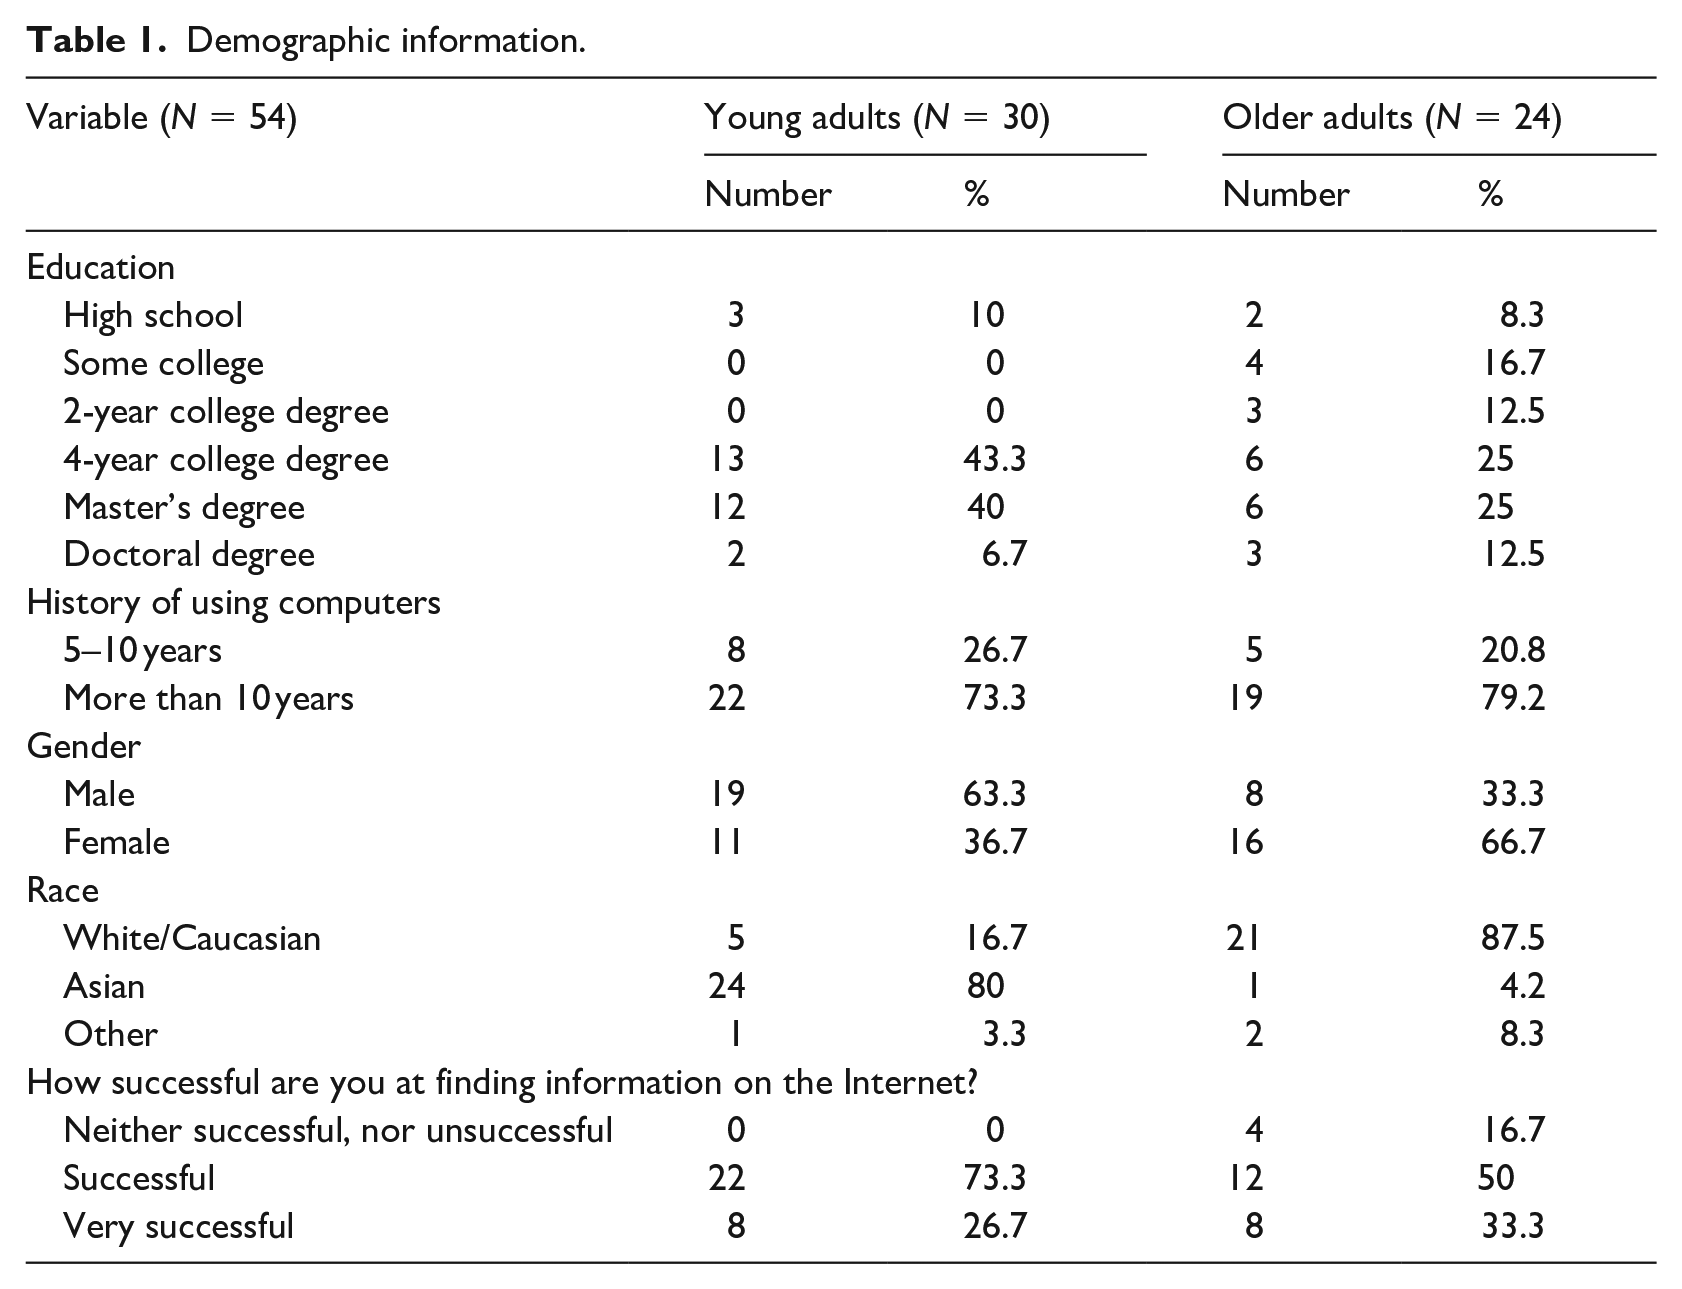
A priori power analysis was conducted to calculate the sample size with a population effect size (Cohen’s f) of 0.3 at a significance level of 0.05 and power of 0.95. This analysis suggested a sample size of 52 participants. Taking into account possible outliers, a total of 54 participants (27 males and 27 females) with a mean age of 44.91 years (SD=22.00) were recruited for the study by word of mouth from the Clemson area and via email sent to a repository of previous participants in research studies conducted at our institution. More specifically, they included 30 younger adults between 18 and 30 years (M = 25.97 years, SD = 3.08) and 24 older adults between 60 and 87 (M = 68.58 years, SD = 7.08). The minimum age required to participate in this study was 18. Participants with no knowledge or experience using a laptop or a desktop were excluded. All were compensated with a $20 Walmart gift card upon completion of the study. Additional demographic details for the participants are provided in Table 1.
Demographic information.
Apparatus
The study used a desktop with a 17.5-inch monitor in a quiet and controlled room. Two FHx interfaces, VCA and standard, were used in this study. The VCA interface consisted of a conversational dialog box, which served as the data collection method, with a family pedigree providing real-time updates in the center of the screen as shown in Figure 1(a). This interface was reconstructed using C#. The standard interface was the current version of the Surgeon General’s My Family Health Portrait, which consists of a table of relatives and pop-ups to enter information about them as shown in Figure 1(b). See Supplemental Appendix A and B for screenshots. Participants were provided with a printed fictional FHx scenario, and they accessed the interface through a Mozilla Firefox browser.
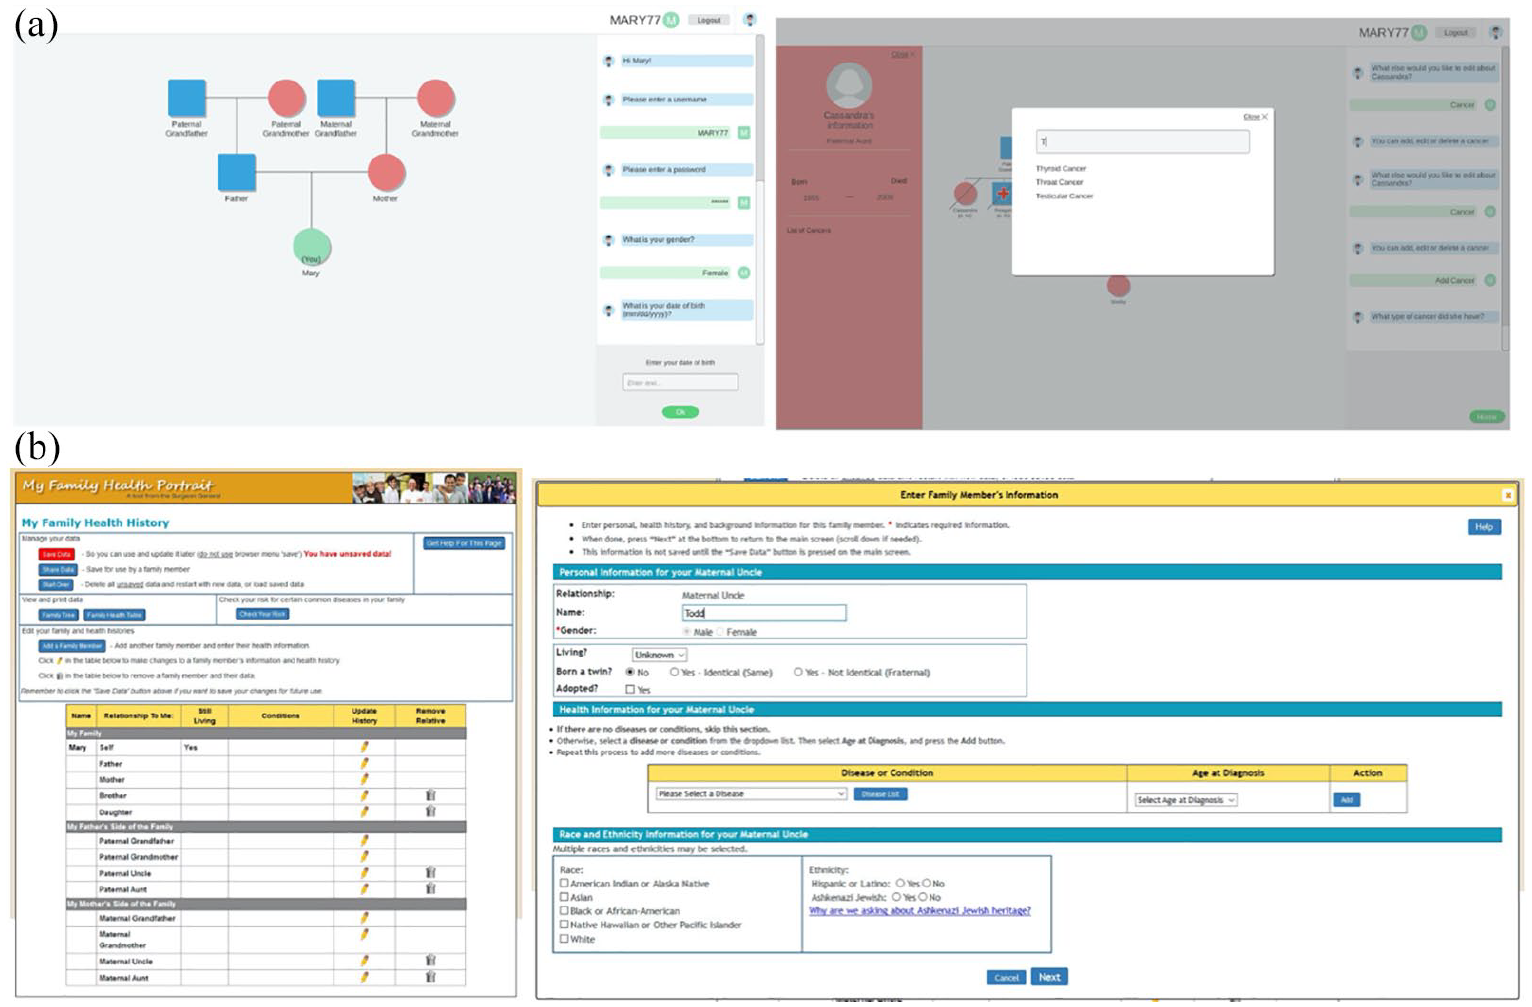
(a) Virtual conversational agent (VCA) interface (top). (b) Standard interface (bottom).
Procedure
A mixed subject experimental design was developed to evaluate the effect of aging on the two interfaces for FHx collection, with the age group being the between subject variable and the interface being the within subject variable. The age group variable had two levels: young adults between 18 and 30 and older adults over 60. 45 The FHx interface variable had two levels: standard and VCA. To avoid order effects, participants were randomly assigned to each of the two FHx interfaces and counterbalanced.
At the beginning of the study, the researchers greeted the participants on their arrival, briefing them on the procedure. After agreeing to participate in the study, the participants completed the pre-test questionnaire found in Supplemental Appendix C and were then provided with a fictional FHx scenario including personal information, the family member’s information and the cancer history of the family. once they read the FHx scenario, the participants were asked to complete the following tasks: (i) create a user profile, (ii) add the family health history, (iii) re-access the platform, (iv) edit the information, and (v) share the information with a family member. After completing these using the first interface, the participants were given a subjective questionnaire asking about their satisfaction, workload and perception of its usability. This survey was followed by a retrospective think-aloud session in which the participants shared their experiences with the interface and provided additional suggestions and comments.
Participants were then encouraged to take a short break before beginning the second part of the study, where they completed the same set of tasks on the second interface, followed again by the same subjective questionnaire and retrospective think-aloud session. At the end of this session, the participants were asked to indicate which interface they preferred. Throughout the task completion on both the interfaces, the researchers observed the challenges faced by the participants, recording the number of errors they made.
Measures
The measures included the pre-test questionnaire completed by the participants including their basic demographic data as well as their experience using the Internet and related applications. The subjective questionnaires assessing the completion of the tasks using each interface included the NASA Task Load Index (NASA-TLX) workload instrument measured on a scale from 0 to 100, 46 the IBM Computer System Usability Questionnaire (CSUQ) administered with 19 items measured on a 7-point Likert scale ranging from strongly disagree to strongly agree, 47 and a brief survey on the perceived usefulness and ease-of-use of the application derived from the Technology Acceptance Model (TAM) administered with twelve items measured on a 7-point Likert scale ranging from extremely unlikely to extremely likely, 38 followed by a questionnaire on the features they liked and disliked about the interface. After completion of the tasks on both interfaces and the corresponding questionnaires, the participants ranked the interface, with “1” indicating the more preferred and “2” the less preferred.
Total time to complete the tasks was calculated using a stopwatch from the time the participant opened the interface at the beginning of the first task until the participant completed the fifth task of sharing the information with a family member. As the tasks were designed to follow one another, the beginning point of one task was considered as the endpoint of the previous one. Task 1 lasted from the moment the participants opened the interface until they submitted the last piece of personal information; Task 2 ended when the participants entered the final piece of information from the last family member, while Task 3 was calculated until they returned to the family history page after logging out of the application. Task 4 ended when the participants completed editing the previously entered information, and Task 5, the last task in the study, ended when they shared the information with a family member.
The researchers also recorded the number of errors made by the participants as they completed the tasks. These errors were categorized into three types: (1) Incorrect Response: providing an incorrect response during the data collection process, for example, indicating a family member to be alive when he/she is dead or choosing the wrong disease from the disease list; (2) Improper attempt: failing to perform all the required set of steps to complete a task, for example moving on to the next step without completing the process of entering a disease; and (3) Other errors: for example, entering/editing data that have already been added or edited. In addition, we included the demographic variables (mentioned in Table 1) as covariates in the analysis to study their effects. However, none of them was statistically significant.
Hypotheses
Hypothesis 1. Age group moderates the relationship between interface design and total task completion time, with an increase in time being seen as the interface design changes from standard to VCA and the age group changes from younger to older adults.
Hypothesis 2. The relationship between the number of errors made and the interface design is moderated by the age group, with the number of errors decreasing as the interface design changes from standard to VCA and the age group changes from older to younger adults.
Hypothesis 3. The users perceive increased ease-of-use when using the VCA interface over the standard interface.
Hypothesis 4. The users are more satisfied using the VCA interface than the standard interface.
Hypothesis 5. The users perceive increased overall workload when using the standard interface over the VCA interface.
Analysis
The usability of the interfaces was determined by analyzing the dependent variables of task completion times, number of errors, the Computer System Usability Questionnaire scale, the NASA-TLX test scores, the Technology Acceptance Model scores and the final preference questionnaire. IBM SPSS Statistics 24 was used to analyze the dependent variables. To determine the significant differences between the FHx interfaces, a two-way mixed ANOVA was conducted at a 95% confidence level. The preference data were analyzed using logistic regression and chi-square tests.
Results
Completion time
The interaction between age group and interface type for overall as well as individual task completion times was not statistically significant except for Task 3, re-accessing the platform. However, we found the main effect of interface type and age group to be statistically significant for all the other tasks and overall task completion times. Participants using the standard interface took 60.79 s fewer (95% CI (10.72, 110.86), p = 0.018; Figure 2(a)) than the VCA interface to complete all assigned tasks, with 67% (36 of 54) of the participants being faster on the standard interface. In addition, the older age group took on average 565.99 s longer (95% CI (405.78, 726.20), p < 0.001) to complete all the tasks than the younger age group (Figure 4(a)).
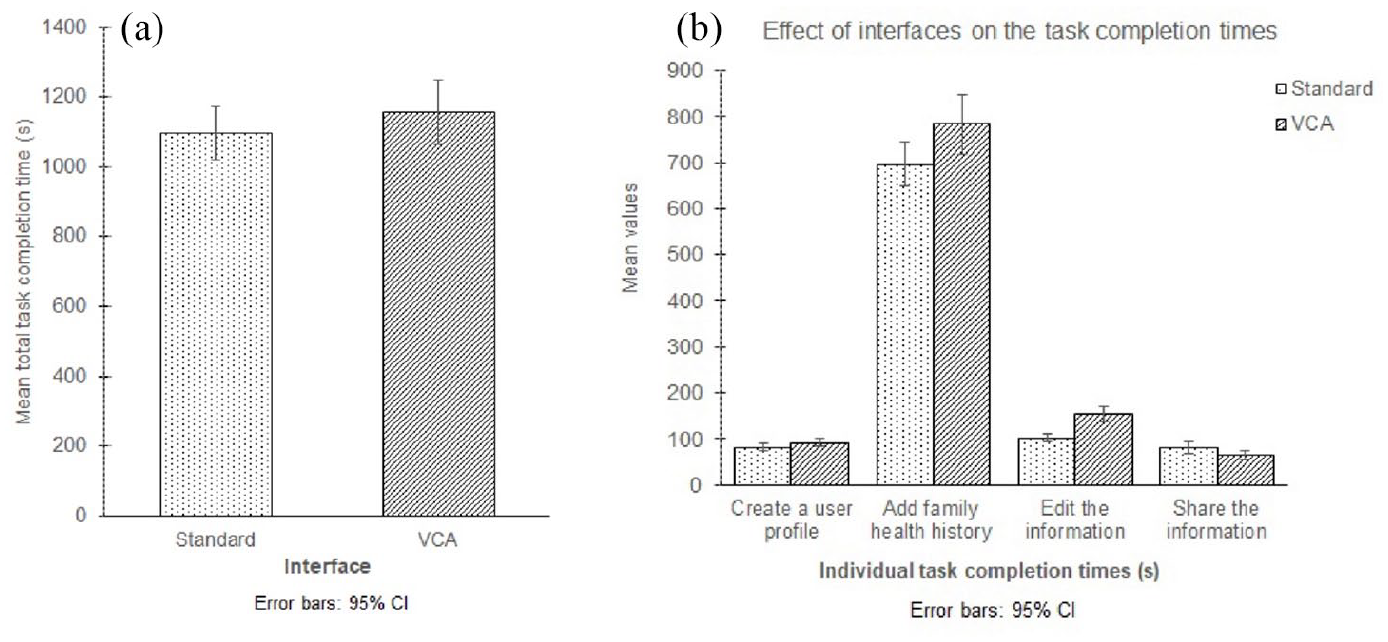
(a) Total task completion time based on the interfaces (left). (b) Effect of the interfaces on individual task completion times (right).
With respect to individual task completion times, participants completed Tasks 1, 2, and 4 faster on the standard interface than on the VCA interface (Figure 2(b)). More specifically, they took 10.58 s fewer (95% CI (3.16, 18.00), p = 0.006) using the standard interface to complete Task 1 (create a user profile), with 70% (38 of 54) completing it faster on this interface. Participants using the standard interface took 88.32 s fewer (95% CI (46.55, 130.08), p < 0.001) to complete Task 2 (add family health history), with 78% (42 of 54) being faster on this interface. Task 4 (edit the information) was completed 51.57 s faster on average (95% CI (38.99, 64.15), p < 0.001) on the standard interface, with 94% (51 of 54) of the participants completing it faster on this interface. However, participants completed Task 5 (share the information) faster on the VCA interface by 17.63 s (95% CI (6.04, 29.22), p = 0.004) compared to the standard interface (Figure 2(b)), with 56% (30 of 54) completing it faster on this interface.
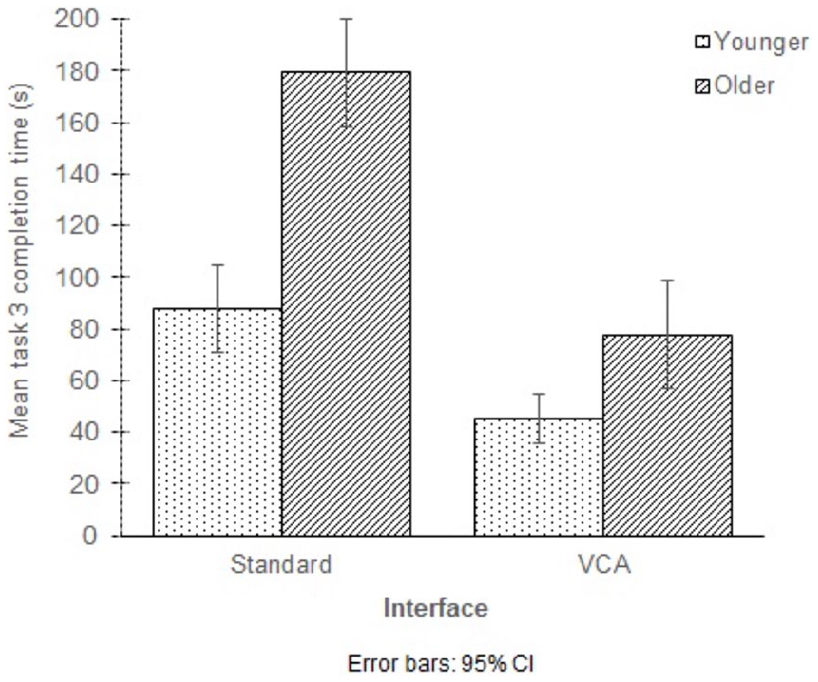
We found a statistically significant interaction between age group and interface type on Task 3 (re-access the platform) completion time, F(1, 52) = 14.67, p < 0.001, partial η2 = 0.22 (Table 3). The younger age group took 42.45 s longer (95% CI (23.03, 61.87), p < 0.001) to complete it on the standard interface than on the VCA interface. Similarly, the older age group also took on average 101.67 s longer (95% CI (75.66, 127.68), p < 0.001) to complete the task on the standard interface (Figure 3).
Task 3 completion time.
With respect to age group, the older participants took more time to complete all the tasks compared to the younger participants. More specifically, the older age group took 37.58 s more (95% CI (24.10, 51.07), p < 0.001) to complete the first task (create a user profile), 374.64 s more (95% CI (268.35, 480.93), p < 0.001) to complete the second task (add family health history), 67.17 s more (95% CI (43.92, 90.42), p < 0.001) to complete the fourth task (edit the information) and 24.44 s more (95% CI (5.26, 43.63), p = 0.014) to complete the fifth task (share the information) (Figure 4b). Additional task completion time results are provided in Tables 2 and 3.
Mean total and individual task completion time.
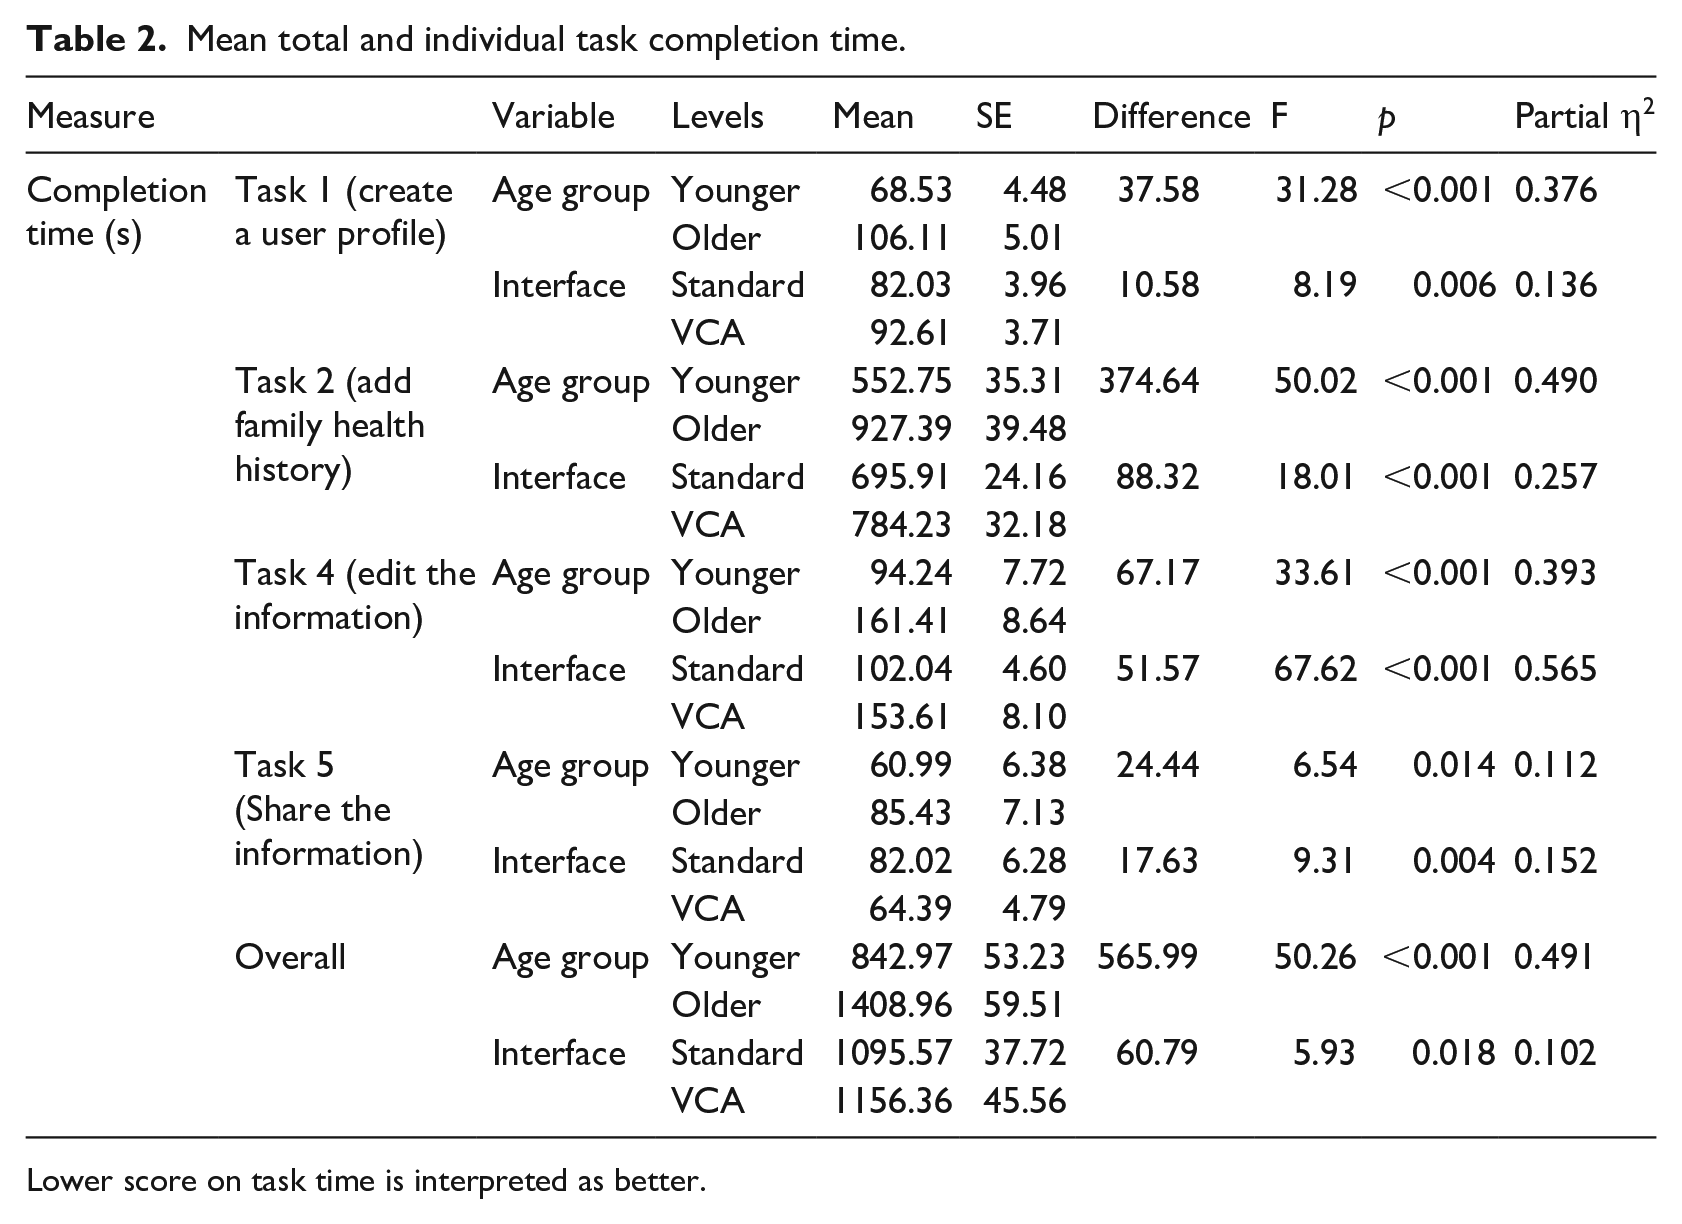
Lower score on task time is interpreted as better.
Mean Task 3 completion time.
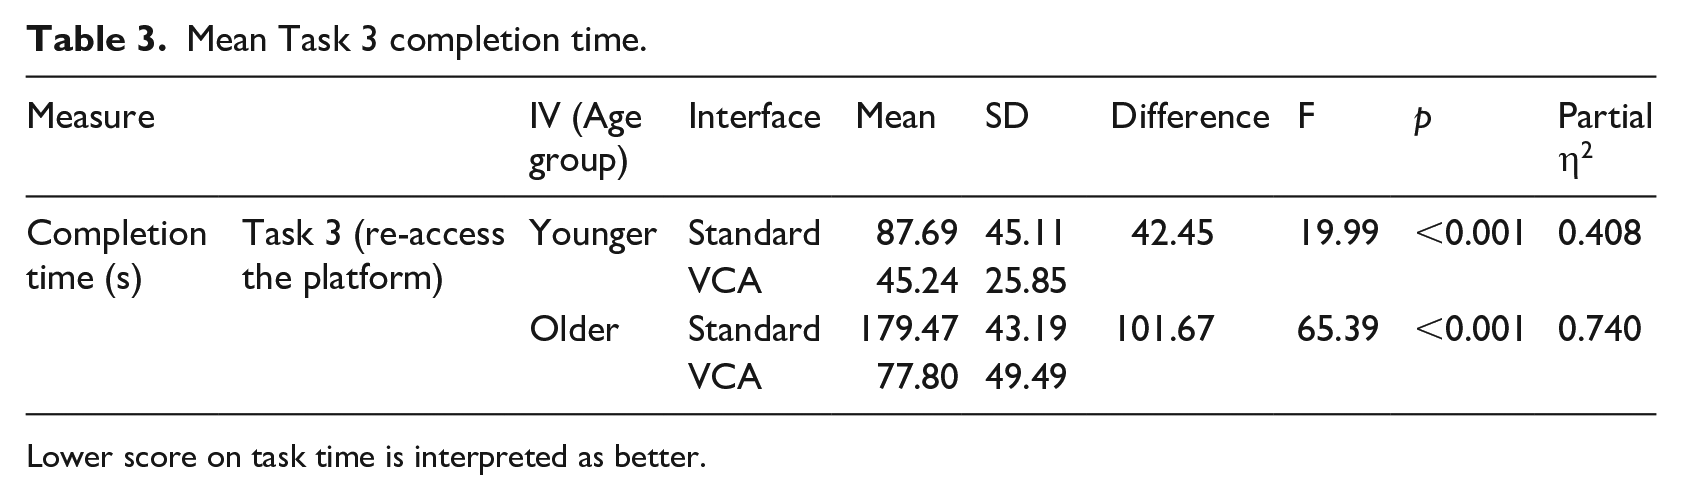
Lower score on task time is interpreted as better.
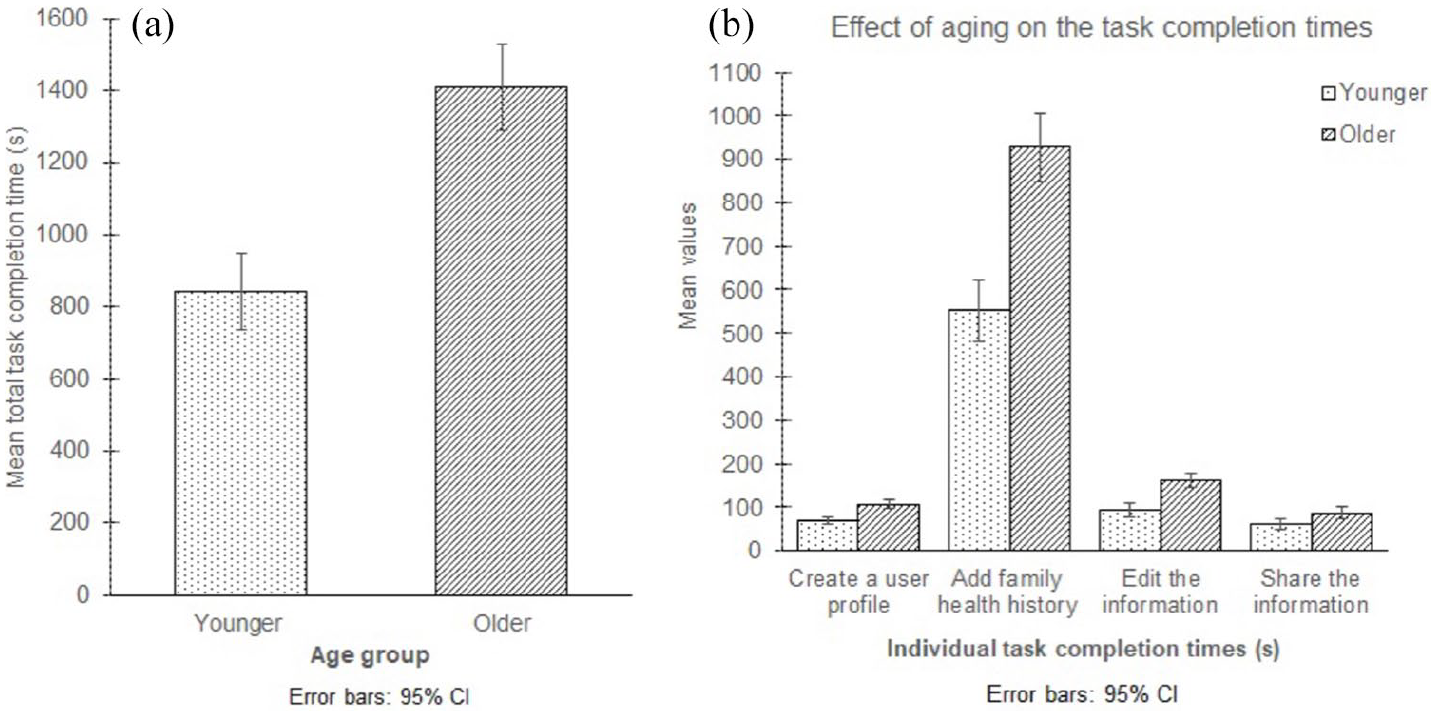
(a) Total task completion time based on age group (left). (b) Effect of aging on individual task completion times (right).
Errors
The interaction between age group and interface type for overall as well as individual task errors was not statistically significant. However, we found the main effect of age group to be statistically significant for the second task, the fourth task and overall number of errors. In addition, we found the main effect of interface type to be statistically significant for the number of errors made during the third and the fourth task. Considering the individual tasks, the older age group made on average 2.33 more errors (95% CI (1.01, 3.66), p = 0.001) while completing the second task and 0.93 more errors (95% CI (0.41, 1.45), p = 0.001) while completing the fourth. Considering the total number of errors, the older age group made on average 3.56 more errors (95% CI (1.52, 5.60), p = 0.001) than the younger age group.
With respect to the interfaces, the participants made on average 0.71 more errors (95% CI (0.27, 1.15), p = 0.002) using the standard interface while completing Task 3 compared to the VCA interface, while the participants committed on average 0.60 more errors (95% CI (0.24, 0.98), p = 0.002) using the VCA interface while completing Task 4. Additional results on the number of errors is provided in Table 4.
Mean number of errors.
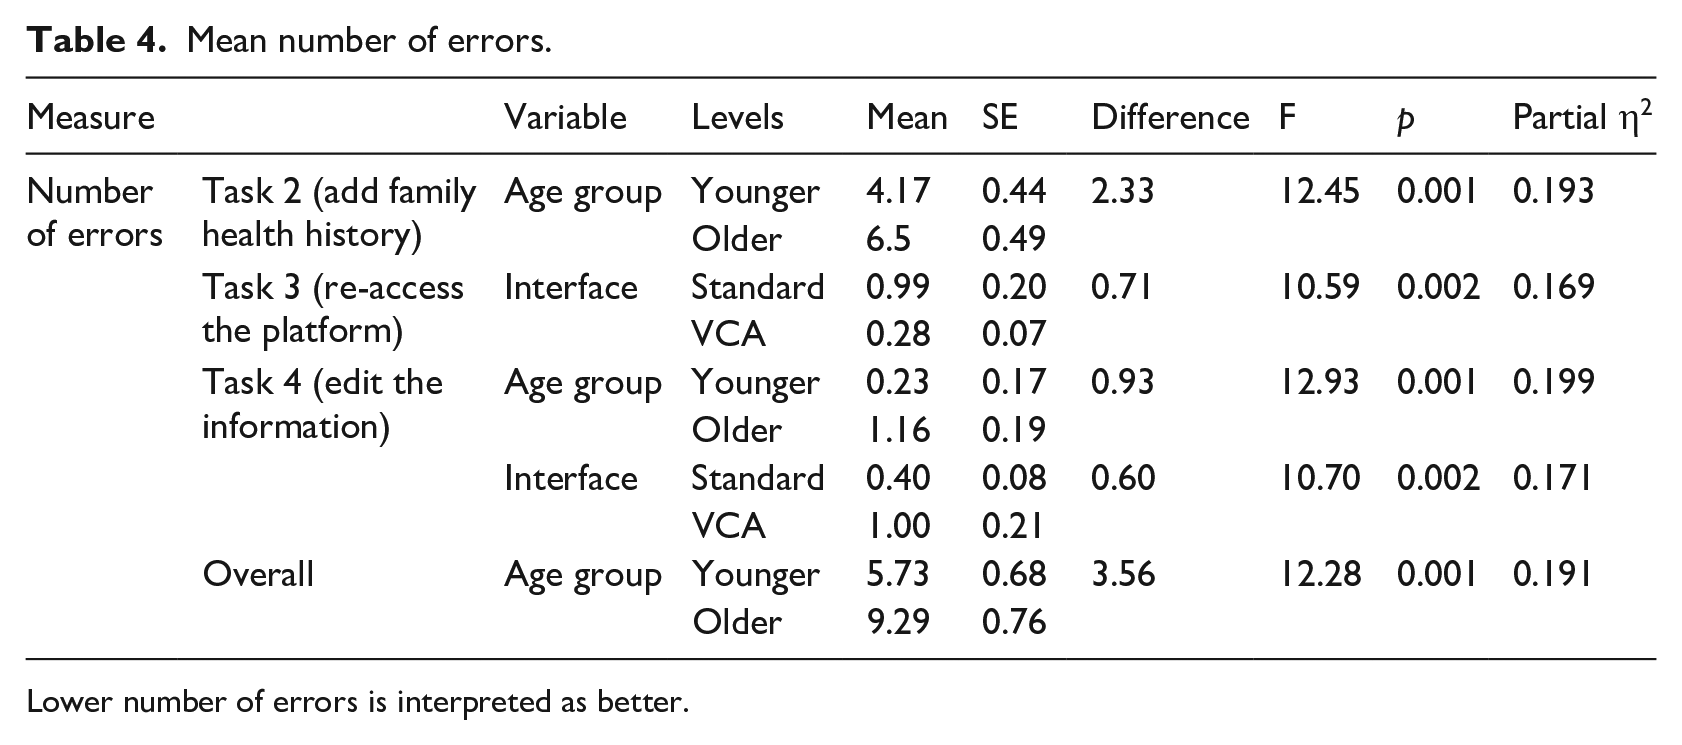
Lower number of errors is interpreted as better.
There were no statistically significant results for age group or interface type on the number of errors for Task 1 (create a user profile) and Task 5 (share the information).
NASA-TLX results
The interaction between the age group and interface type for the NASA-TLX subscales was not statistically significant. However, we found the main effect of interface type to be statistically significant. The participants in general reported higher workload scores across most of the NASA-TLX subscales for the standard interface compared to the VCA interface (Figure 5(a)). The participants reported the mental demand to be 8.73 units higher (95% CI (2.73, 14.73), p = 0.005) using the standard interface, with 59% (32 of 54) rating mental demand higher with this interface and 7% (4 of 54) reporting an equal amount of mental demand. The participants reported the temporal demand to be 8.15 units higher (95% CI (0.79, 45.5), p = 0.031) for the standard interface, with 50% (27 of 54) of the participants rating the temporal demand higher with this interface and 22% (12 of 54) reporting an equal amount of temporal demand with the VCA. The participants reported the effort required to be 8.87 units higher (95% CI (1.82, 15.93), p = 0.015) for the standard interface, with 57% (31 of 54) of the participants reporting this interface required more effort and 7% (4 of 54) reporting an equal amount of effort for both. The participants reported the overall workload to be 7.00 units higher (95% CI (1.98, 12.01), p = 0.007) for the standard interface, with 62% (34 of 54) rating the overall workload higher with this interface. Additional NASA-TLX results are provided in Table 5.
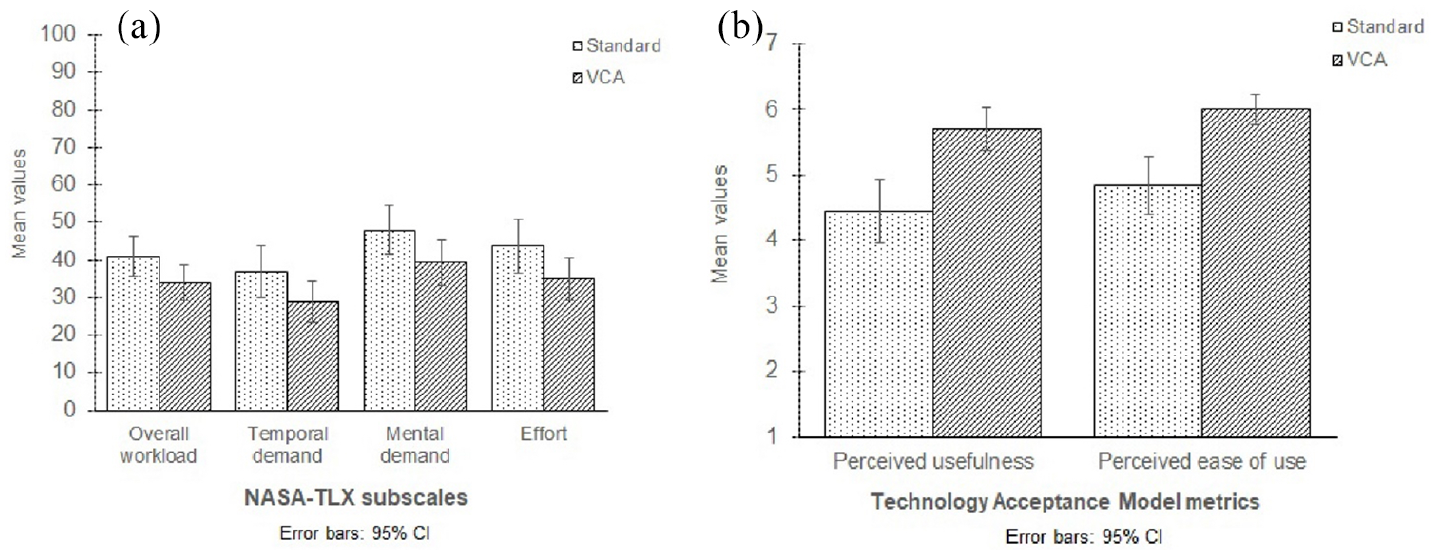
(a) NASA-TLX subscales (left). (b) Technology acceptance questionnaire scores (right).
Mean NASA-TLX scores.
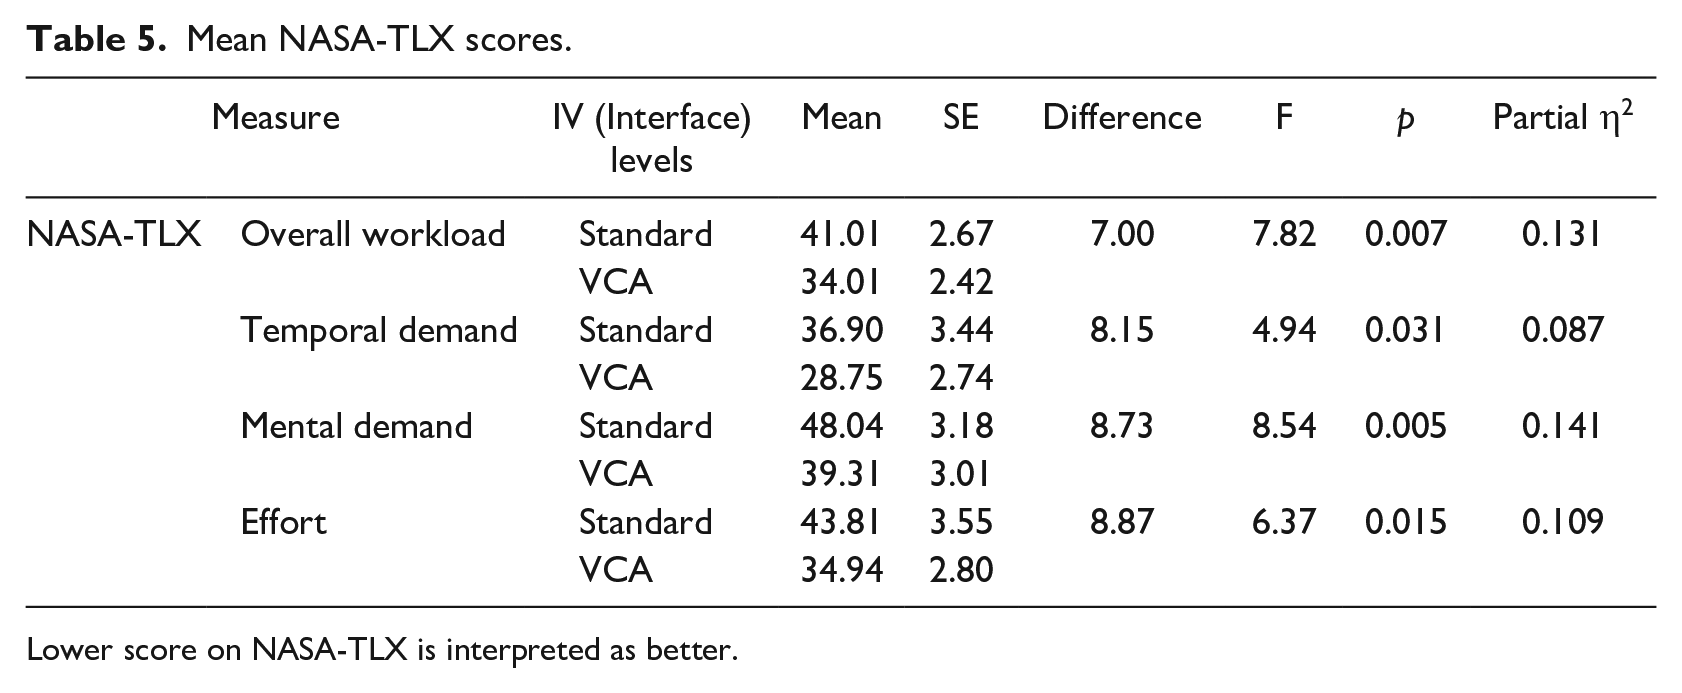
Lower score on NASA-TLX is interpreted as better.
There were no statistically significant results for age group and interface type on the performance, physical demand and frustration levels.
Perceived usefulness and ease-of-use
The reliability of perceived usefulness and perceived ease-of-use was high (Cronbach’s α = 0.98 and 0.96, respectively). We found the interaction between the age group and interface type on the perceived usefulness and ease-of-use scores not statistically significant. However, the main effect of interface type was significant. The participants’ perceived usefulness score was 1.26 units higher (95% CI (0.63, 1.89), p < 0.001) for the VCA interface than the standard interface (Figure 5(b)), with 65% (35 of 54) of the participants rating this interface more useful and 13% (7 of 54) reporting an equal usefulness score between the interfaces. The participants’ perceived ease-of-use score was 1.16 units higher (95% CI (0.64, 1.69), p < 0.001) for the VCA interface than the standard interface, with 67% (36 of 54) rating the VCA interface easier-to-use and 9% (5 of 54) reporting comparable scores for the two interfaces. Additional TAM results are provided in Table 6.
Mean TAM scores.
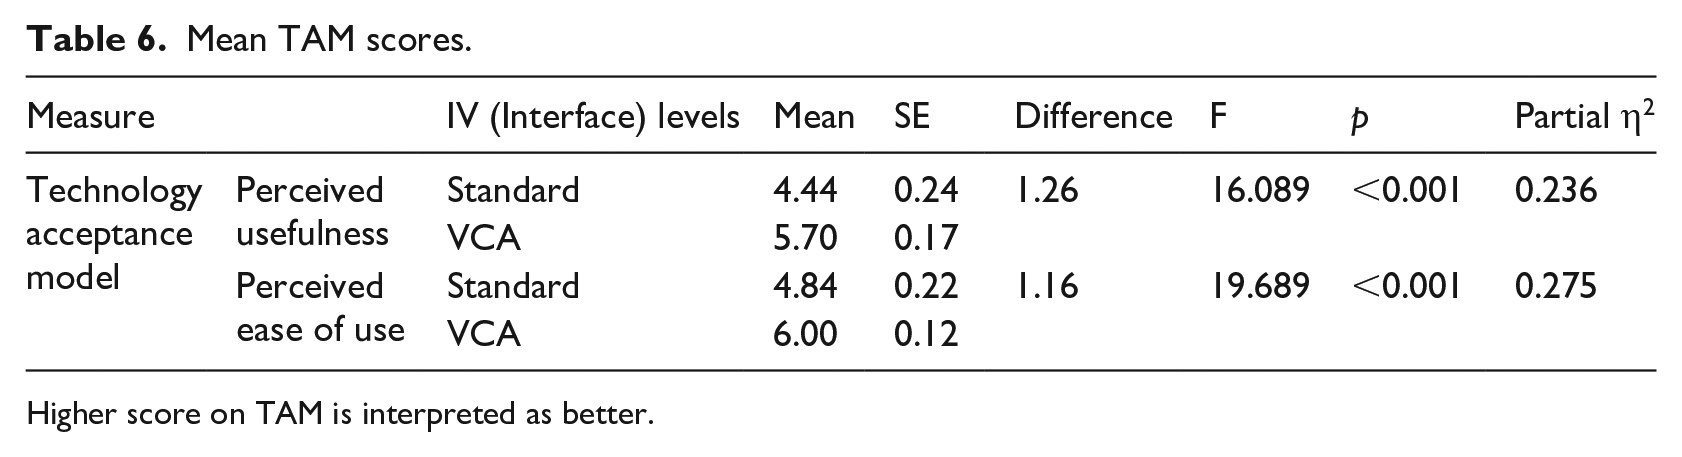
Higher score on TAM is interpreted as better.
Usability evaluation
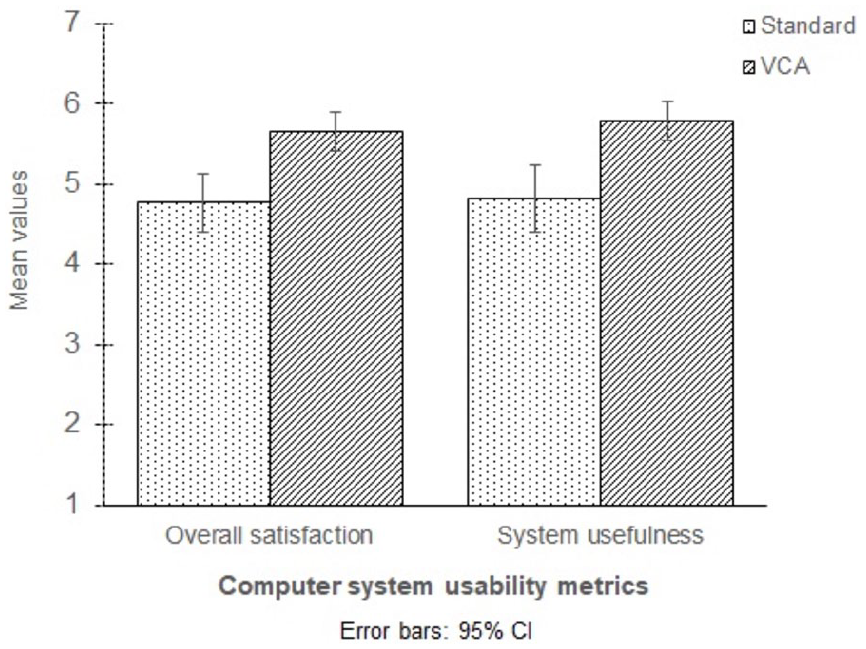
The reliability scores for overall satisfaction, system usefulness, information quality, and interface quality were high (Cronbach’s α = 0.97, 0.97, 0.92, and 0.90, respectively). We found the interaction between age group and interface type on the overall satisfaction and the system usefulness scores not statistically significant; however, there was a statistically significant interaction between the variables on the information quality and the interface quality scores. We also found the main effect of interface type on the overall satisfaction and the system usefulness statistically significant. The participants’ overall satisfaction score for the VCA interface was 0.88 units higher (95% CI (0.48, 1.27), p < 0.001) than that for the standard interface (Figure 6), with 69% (37 of 54) of the participants rating overall satisfaction higher with this interface. The participants’ reported system usefulness score for the VCA interface was 0.97 units higher (95% CI (0.49, 1.47), p < 0.001) compared to the standard interface, with 67% (36 of 54) of the participants rating system usefulness higher with this interface and 4% (2 of 54) reporting a comparable system usefulness score between the interfaces. Additional IBM-CSUQ results are provided in Table 7.
Computer system usability questionnaire scores.
Mean IBM-CSUQ scores.
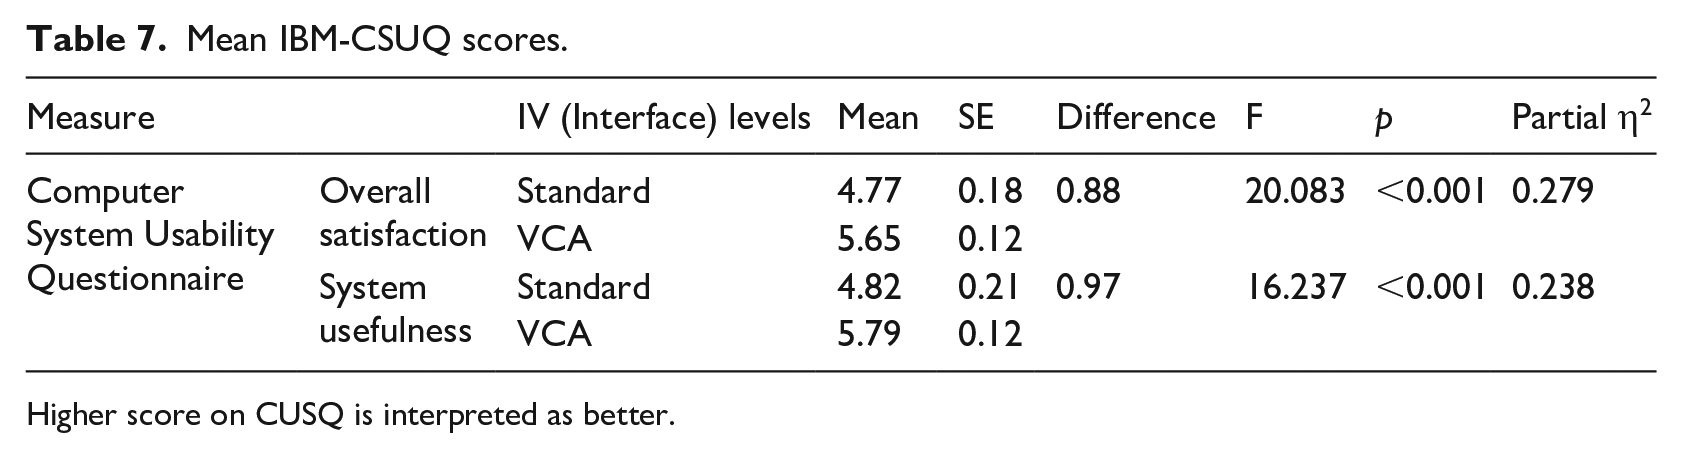
Higher score on CUSQ is interpreted as better.
We found a statistically significant interaction between age group and interface type for information quality, F(1, 52) = 5.574, p = 0.022, partial η2 = 0.097 (Figure 7(a)). The simple main effect for the younger age group showed a statistically significant difference between the interface types, F(1, 29) = 19.647, p < 0.001, partial η2 = 0.404, with the VCA interface having a higher score (M = 5.65, SD = 0.85) than the standard interface (M = 4.51, SD = 1.30), with a statistically significant mean difference of 1.14, 95% CI (0.62, 1.67), p < 0.001.
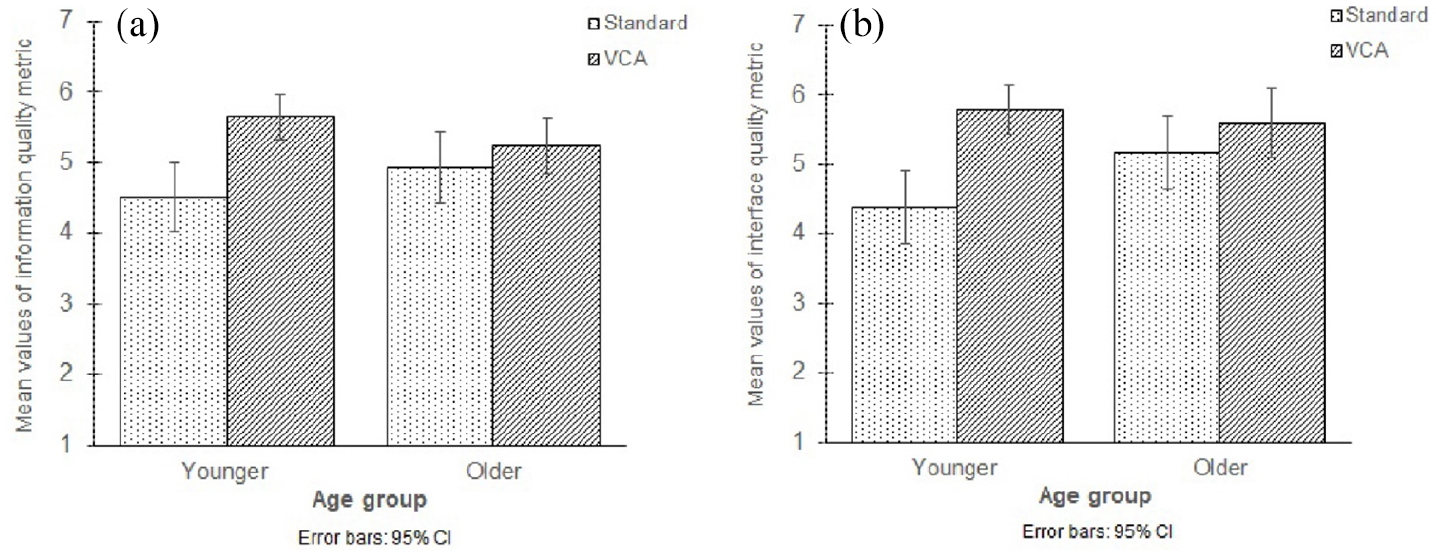
(a) IBM-CSUQ subscale: Information quality metric (left). (b) IBM-CSUQ subscale: Interface quality metric (right).
We also found a statistically significant interaction between age group and interface type for interface quality, F(1, 52) = 5.126, p = 0.028, partial η2 = 0.09 (Figure 7b). The simple main effect for the younger age group showed a statistically significant difference between the interface types, F(1, 29) = 21.318, p < 0.001, partial η2 = 0.424, with the VCA interface scoring higher (M = 5.79, SD = 0.96) than the standard interface (M = 4.38, SD = 1.41), with a statistically significant mean difference of 1.41, 95% CI (0.79, 1.04), p < 0.001. With respect to interface type, the simple main effect for the standard interface showed a statistically significant difference for age group, F(1, 52) = 4.734, p = 0.034, partial η2 = 0.083, with a higher score being reported by older adults (M = 5.18, SD = 1.26) than by the younger (M = 4.38, SD = 1.41), with a statistically significant mean difference of 0.80, 95% CI (0.06, 1.54), p = 0.034.
Preference
Of all participants, 78% (23 of 30) of the younger adults and 67% of the older adults (16 of 24) preferred the VCA interface. The binary logistic regression model for age group was not statistically significant, indicating that the younger and the older adults equally preferred the VCA interface. However, the results of the chi-square test, indicated that the participants significantly preferred the VCA interface over the standard interface, χ2(1) = 10.67, p = 0.01.
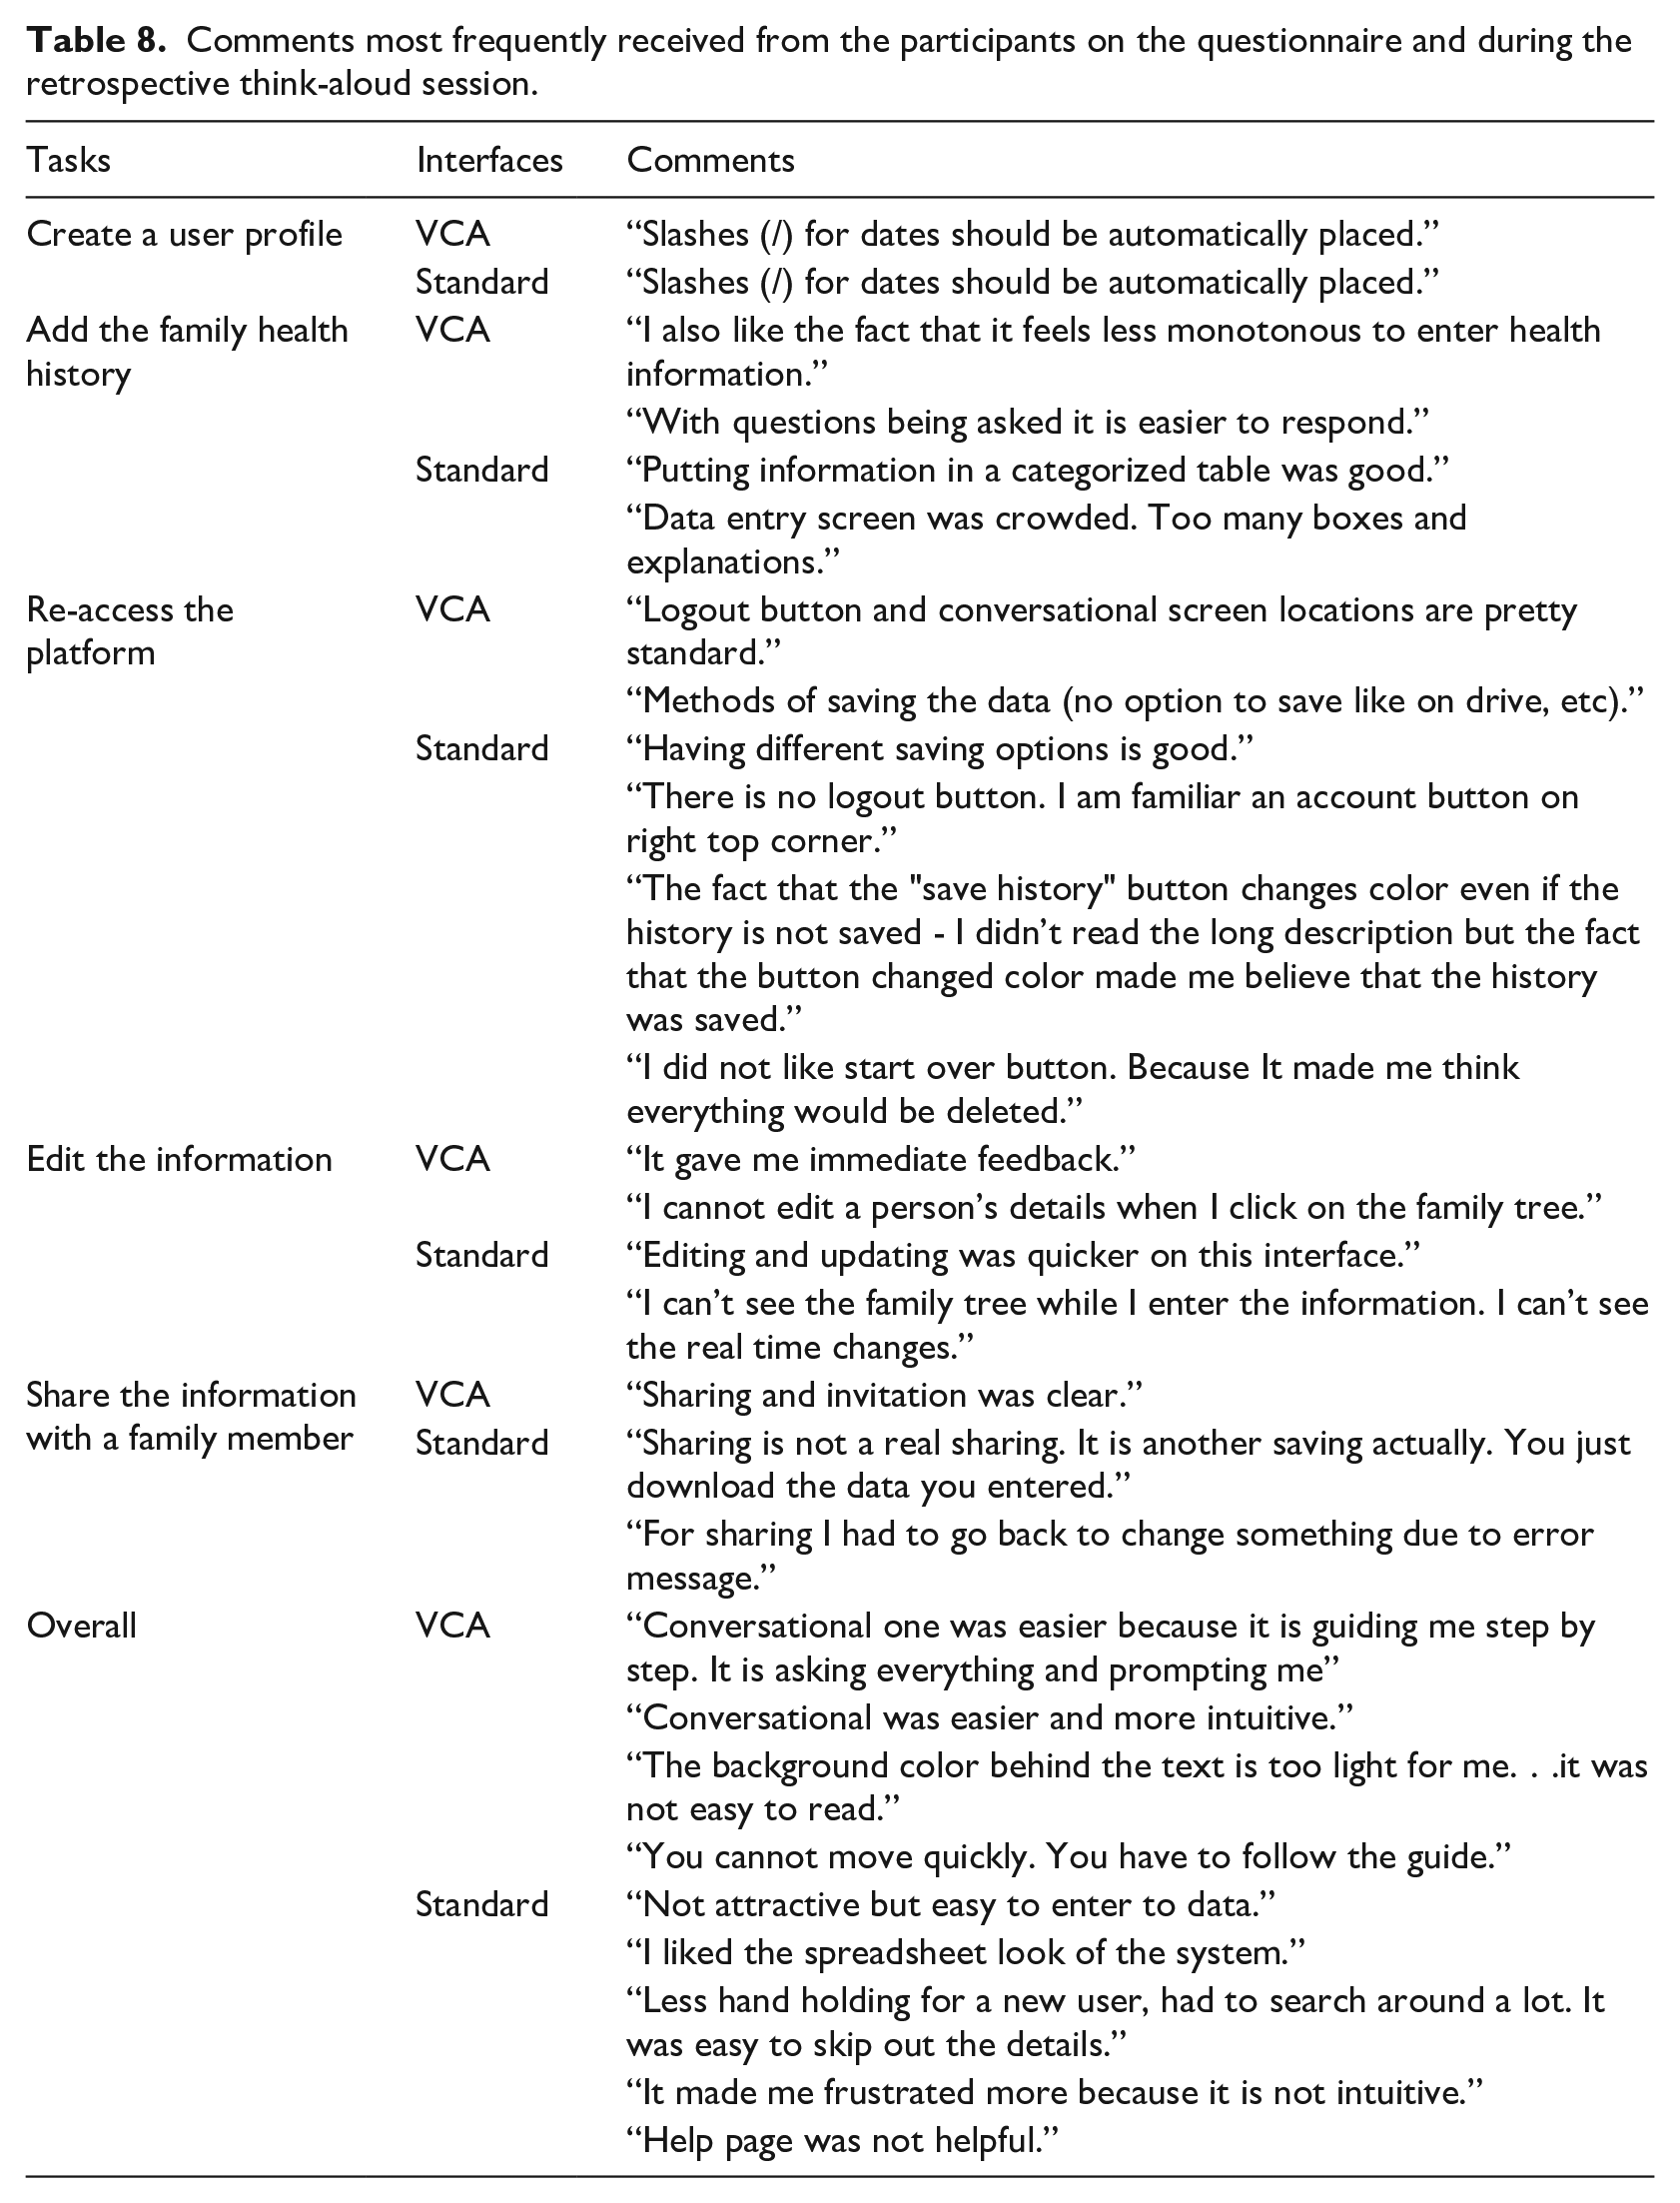
The comments most frequently received from the participants on the questionnaire and during the retrospective think-aloud session are shown in Table 8.
Comments most frequently received from the participants on the questionnaire and during the retrospective think-aloud session.
Discussion
As healthcare delivery transitions from institutional to home based settings, the roles of patients are changing.48,49 Patients are increasingly using health IT based systems in home-based settings50–52. These activities include patients using such systems to provide health history, identify care providers and maintain and improve their health such as managing their diet, tracking blood glucose levels, and communicating with fellow patients.53,54 This study evaluated two FHx platforms, the standard and VCA, using both young and older adults to investigate how aging affects users’ performance as well as their preferences. This study used a mixed experimental design, with the FHx interfaces (standard web-forms and conversational chat-based) being the within subject variable and the age group (young adults and older adults) being the between subject variable. The interfaces were evaluated based on the participants completing five tasks. At the end of the study, the participants were asked to indicate the interface that they preferred.
The results found older adults performed relatively slower than the younger adults for both the individual and total task completion times. This result agrees with previous research showing that as a person ages, the speed of cognition slows and the working memory span reduces,55–59, both of which subsequently lead to an increase in the task completion duration. Research has also shown that there is a decrease in the older population’s finger coordination when completing a task, thus increasing the task completion time. 60
In addition to longer task completion times, older adults made more errors than younger adults in two of the five tasks as well as more total errors on both the interfaces, again perhaps as a result of the decline in working memory span with aging.61–63 According to Sweller (1994), 64 based on cognitive load theory as the amount of information presented increases, the working memory capacity tends to become overwhelmed and some information is lost. Similarly, Birdi et al. (1997) 65 found that as tasks become cognitively demanding, older adults tend to make more errors than younger adults. In this study, participants had to enter several pieces of family health information and then edit them in Tasks 2 (add multiple family members’ health history) and 4 (edit the entered information). These two tasks were relatively more cognitively demanding than the other three, perhaps explaining the higher number of errors made by the older adults. Also, as a person ages, acquiring, linking and memorizing information becomes more difficult, resulting in increased task completion time and number of errors.
However, both age groups made the same number of errors using both interfaces except when re-accessing the platform and editing the information. Both the younger and older participants made more errors and took more time on the standard interface while re-accessing the platform. The VCA system had a logout/login option whereas the standard interface did not provide a direct logout/exit option; rather participants had to save the file and then click on start over or click on the banner on the top left of the page to return to the initial page to load the saved file. The instructions on how to save and exit and to load the file were provided on their respective pages. However, according to Novick and Ward (2006), 66 people generally abandon a task rather than read instructions. Not reading the instructions caused users to make more errors and take more time to complete the tasks. In addition, irrespective of age, this lengthy process could cause an increase in the required cognitive ability involving the mental processes of understanding, remembering and thinking while interacting with the system. This increased mental demand impacted performance and efficiency as seen from the increased task completion time and number of errors.67,68
Similarly, participants had to read lengthy instructions to complete the fifth task (sharing the information) in the standard interface since it did not have an intuitive workflow. However, the participants did not make more errors than when using the VCA interface, perhaps because they remembered the difficulty they had completing the third task without reading the instructions. 69 As a result, they took more time to complete the task in the standard interface. For the other three tasks of creating a user profile, adding the family health history and editing the information, participants required more time to complete them using the VCA interface than the standard interface since the former consisted of a question-answer data collection method requiring multiple clicks. However, as mentioned in the retrospective think-aloud session, the participants did not mind spending more time on the VCA interface since it provided them with guidance on how to complete their family health history.
Compared to reading to find the information versus answering the virtual assistant to develop the family health history, most users preferred the latter. As confirmed by the qualitative feedback, participants felt the standard interface to be too wordy, thus impacting their cognitive load and supporting their preference for VCA interface.64,66,70 Guidelines proposed by Stewart and Travis (2002) 68 suggest that effective interfaces are designed by considering the capacity limitation of the users and reducing the short-term memory load. The increase in the cognitive load may affect the user’s satisfaction while completing different tasks. 68 Schmutz et al. (2009) 69 demonstrated the NASA-TLX scale to be an important measure of this cognitive load. In this study, participants reported higher workload scores using the standard interface than the VCA interface, results mirrored by the lower values on the technology acceptance and usability metrics. 70 In part, the high cognitive load related to the higher values on the NASA-TLX scale was due to the increased frustration involved in finding the information needed on the interface coupled with the lengthy explanations and unclear icon labels. The high scores on the technology acceptance and usability metrics for the VCA interface were due to the context-based guidance it provided during the data collection process, the real-time update of the information on the family tree and the more intuitive design of the interface. A similar result was found in the study conducted by Wang et al. (2015) 43 in which, although they did not compare the interfaces, they found the VCA interface to have high usability scores such as easy-to-use and easy-to-follow.
In addition, the majority of Wang et al.’s (2015) 43 participants mentioned they would recommend the VCA interface, a recommendation similar to what we found in our study, with more than 72% of our participants preferring this interface over the standard one. More importantly, we did not find a significant difference of aging in the acceptance of these two FHx data collection technologies because approximately 75% of each age group preferred the VCA interface. This trend was also seen in majority of the other metrics, with both the older and younger adults considering the VCA interface significantly better than the standard interface. While both age groups showed similar preferences, of particular significance to this study is our finding that irrespective of age, users were excited by the VCA interface FHx data collection technology. The primary goal of this research was to ascertain the effectiveness of these FHx data collection methods among the geriatric population as these may be the standard in the future.
Limitations and future studies
This study is not without limitations, one of which is the fictitious family history provided to the participants. This lack of familiarity with the names and information provided may have increased the task completion times, meaning they may not be representative of real-world scenarios and potentially restrict the generalizability of the results. However, it would have been challenging to compare measures like time across participants if their actual information had been used since the size of their families could differ significantly. In addition, significant learning effects could have been introduced as the number of family members increased. Future studies could investigate the interfaces on usability and acceptance with actual patients’ data without comparing the participant performance across time. Additionally, there could potentially be confounding effects of demographics like education, gender and race as it was not controlled in the study. Future studies could control these different demographic variables. Since, this study was conducted on a desktop using a Mozilla Firefox browser, future studies could also focus on developing and testing the interfaces on a mobile device and/or tablets with different browsers and multiple operating systems.
Research implications and design policies
Based on the results from this study, we found the context-based guidance provided by the virtual assistant to be helpful for the users as they navigate the interface. It helps them focus on the process instead of having to go through the entire interface to find the required information. It also appears to be an easier and a more efficient data input method for users. In addition, providing a family tree with real-time updates helps the users understand the hierarchy visually. Real-time updates are beneficial since they give immediate feedback confirming the steps taken.
Additionally, we suggest using a minimum number of words and/or amount of information on the interface to help the users retrieve the information effectively, thus reducing the working memory load required. Words can be replaced by clear, self-explanatory icons which would also make the interface enjoyable to interact with. Also, as seen in the VCA interface in this study, it is strongly recommended to have a clear login and logout option that is intuitive to the users. Having a server-based interface may be useful for sharing the data or for inviting relatives to update their personal medical histories as well as for medical providers to easily access by clicking on a few buttons.
Finally, the most effective design solution could be a hybrid version of the standard and the VCA interfaces. This hybrid interface should contain the most valuable features from both. Features that were considered to be most useful in the VCA interface were the guidance provided by the virtual assistant for effective data entry, the login/logout option and the real-time update of the family tree, and for the standard interface the most useful feature was the ability to edit the information by directly clicking on the data instead of having to go through the question-answer method. Although participants accepted the extra time needed for the VCA interface, this enhanced ability to edit could be more intuitive and reduce overall time.
Conclusion
Although users took more time on the VCA interface, our results suggest they prefer it over the standard interface as an FHx collection tool. This study found that though older adults were slower to complete the tasks on both interfaces, probably because of their reduced motor skills, like their younger counterparts, they preferred the VCA interface. They rated the usability of the VCA interface at the same level as the younger adults but significantly higher than the standard interface. Just as important, the VCA interface decreased the overall workload experienced by the participants for all tasks. The participants mentioned they preferred the guidance provided by the VCA interface in the form of dialogs which aided them in the data collection rather than the pop-up method of the standard interface as they had to figure out the boxes for entering the data. The findings from this study have the potential to impact the future direction of FHx collection systems and their use in the healthcare field.
Supplemental Material
Appendix_HIJ – Supplemental material for An empirical study investigating the user acceptance of a virtual conversational agent interface for family health history collection among the geriatric population
Supplemental material, Appendix_HIJ for An empirical study investigating the user acceptance of a virtual conversational agent interface for family health history collection among the geriatric population by Amal Ponathil, Firat Ozkan, Jeffrey Bertrand, Sruthy Agnisarman, Shraddhaa Narasimha, Brandon Welch and Kapil Chalil Madathil in Health Informatics Journal
Footnotes
Declaration of conflicting interests
The author(s) declared no potential conflicts of interest with respect to the research, authorship, and/or publication of this article.
Funding
The author(s) received no financial support for the research, authorship, and/or publication of this article.
Supplemental material
Supplemental material for this article is available online.
References
Supplementary Material
Please find the following supplemental material available below.
For Open Access articles published under a Creative Commons License, all supplemental material carries the same license as the article it is associated with.
For non-Open Access articles published, all supplemental material carries a non-exclusive license, and permission requests for re-use of supplemental material or any part of supplemental material shall be sent directly to the copyright owner as specified in the copyright notice associated with the article.