
Abstract
Retinopathy of prematurity is a disease that can affect premature or in similar conditions babies. For diagnosing of retinopathy of prematurity, the infant is examined as soon as possible. Due to the nature of the examination, the images obtained are poor in quality. This article presents an automated method for processing fundus images to improve the visibility of the vascular network. The method includes several processing tasks whose parameters are predicted using an artificial neural network. A set of 88 clinical images were used in this work. The performance of our proposal is efficient, and the average processing time was 42 ms. The method was assessed using both the contrast improvement index and expert opinions. The contrast improvement index average was 2; this means the processed image successfully improved its contrast. Three pediatric ophthalmologists validated the proposed method and agreed that the visual enhancement can help observe clearly the retinal vessels.
Keywords
Introduction
Retinopathy of prematurity (ROP) is a disease that may affect premature newborns, infants with low birth weights, or infants with low exposure to oxygen toxicity. 1 It is the consequence of the abnormal development of the vascular network. The latest International Classification of Retinopathy of Prematurity (ICROP) publication 2 presents several definitions and a collection of standard images for the different stages of the ROP. It defines ROP location (in three parts of the retina), ROP extension (in four sectors of the retina), stages of the disease (five stages), the presence of plus disease (based on vascular dilatation and tortuosity), pre-plus disease, aggressive posterior ROP (APROP), and the regression of ROP. According to the research by Beck et al., 3 approximately 12.9 million pre-term births were reported worldwide in 2005 accounting for 9.6 percent of all births. In June 2012, the research by Blencowe et al. 4 reported 14.9 million of premature babies worldwide with a notable tendency to grow. A subtotal greater than 60 percent of premature births occurred in South Asia and sub-Saharan Africa. Looking at the developed countries, the United States was listed among the 10 countries with the highest number of cases. Regarding the trend analysis in 65 countries, during the period 1990–2010, only three of them (Croatia, Ecuador, and Estonia) reduced the number of cases. These rates motivate the study of ROP that affects the premature born. The work by Saenz-Madrazo 5 examines the status of ROP in Spain, including cases, diagnoses, and treatment success. The author studied 94 hospitals in several cities and showed that early diagnosis and laser treatment led to recovery from ROP in 75–100 percent of the cases. In order to computerize the ROP study, digital images are mainly required. Depending on the type of the used camera, the nature of the patient, and conditions under which an image is taken, fundus images are obtained with medium or low quality. Consequently, these images are often dark with irregular distribution of contrast and hence poor in quality. High-technology cameras are a fundamental instrument for the examination and diagnosis process of ROP. However, it is not always possible to acquire this type of cameras. Being perhaps more difficult in hospitals of developing countries. In this regard, this work aims to be a support in the ROP diagnosis using low-quality fundus images taken by previous generations cameras to the present date.
Computer-assisted diagnosis of ROP is a topic of interest. The main contribution of this research work is that it presents a novel method to improve the visibility of the blood vessels of the retina in order to give computerized support for the diagnosis of ROP. The technique has some parameters which are automatically computed using an artificial neural network (ANN). The method is qualitatively and quantitatively validated on a set of real clinical images.
The presented method has been implemented to address a requirement expressed by pediatric ophthalmologists in their clinical practice. In particular, they commented the need to enhance the retinal vessels in the images they obtain with current medical equipment (those images could be relatively low quality). Those enhanced images are used for later analysis and diagnosis. The experts participated in the validation and evaluation of the results.
The article is organized as follows. Section “Related works” presents a review of related works considering the purpose, algorithms, and image data sets of each of them. In section “Method,” the proposed method and details of its implementation are described. Section “Results and discussion” depicts the results of experiments to verify the proposed method. Finally, section “Conclusion and future works” offers the conclusion and discussion of this study.
Related works
The pathologies of the retina have received a wide interest in medical and engineering for developing solutions of computer-aided diagnosis (CAD). Some pathologies of which we have been able to find many CAD works are diabetic retinopathy (DR), glaucoma (G), hypertensive retinopathy (HR), and ROP. To computationally support these pathologies, the main artificial vision task is to distinguish the vascular network of the retina from background and blood spots that are not vessels, but are present in the retina. In order to distinguish the vascular network, the researchers segment the vascular network from the background. This segmentation is shown as a binary image, where the background is black and blood vessels are white. Regarding vessel segmentation, which can help to diagnose some retinopathy, Fraz et al. 6 presented a survey of 69 studies, most of which used databases of high quality and non-pathological images or only treated DR. These proposals were evaluated in terms of visual comparison, sensitivity, specificity, accuracy, and area under the receiver operating characteristics (ROC) curve. We are interested in contributing the ROP computational study. Therefore, we have noticed that not many studies covered three aspects found in ROP images: noise, pathology, and central vessel reflex. In Khan et al., 7 a more recent review of retinal vessels segmentation is presented. They observed DRIVE 8 and STARE 9 databases are the most used. DRIVE is a smaller data set that contains four pathological images and does not detail the pathologies in their images. STARE data set contains an important number of pathological images, and each image has a textual pathological description. Although, none of the images is ROP. Another review work is presented in Besenczi et al., 10 they did an analysis of several retinal processing. The work found like principal pathologies DR, HR, coronary heart, and stroke. They reported methods for localization and segmentation of the optic disk and optic cup, macula and the fovea, vessels and arteries; detection of lesions like microaneurysms, exudates, cotton wool spots, and hemorrhages; and vasculature measurements, where includes ROP indicator as tortuosity. To measure tortuosity and vessel width, first, the vessels are segmented using morphological filters, second derivative, and mean hysteresis thresholding; then, vessel width is computed by means of an intensive process finding the width from each pixel in several angles; finally, a vessel tortuosity is computed as the ratio of consecutive pixel distance to Euclidean distance. Also, a list of public and some non-public data sets is reported. Although none of the public data sets contains ROP images. One such recent segmentation work is the research by Kaur and Mittal 11 that remarks there are fewer proposals researching the images of the pathological retina. In this article, the segmentation of vascular structure is studied and a novel generalized method is proposed to segment vascular network in pathological images. A private clinical data set formed by 785 fundus images is employed. This work considers retinal images with lesion exudates, microaneurysms, hemorrhages, and cotton wool spots (which are not specifically ROP images). The proposed technique uses a matched filter for a preliminary segmentation, and, after that, each pixel is classified as vessel or non-vessel using a three-layer ANN. In Farokhian et al., 12 an automatic vessels segmentation is presented, this method uses the green channel for processing and a version of optimized Gabor filter to segment the retina vascular network. They use DRIVE data set. The work of Dash and Boi 13 presents a segmentation method tested in DRIVE data set too. They use morphological operations like pre-processing, and Kirsch’s Template as vessel extractor.
In relation to HR and among recent works, Akbar et al. 14 present methods to classify artery and vein, and compute arteriovenous ratio (AVR). The vessels are obtained using two-dimensional (2D) Gabor wavelets and a novel modified m-medoids; then, the AVR is computed taking into account the average vessel width; and finally, a grade (normal, moderate, or malignant) of HR is set according to the AVR. The method is tested in three data sets: INSPIRE-AVR, 15 VICAVR, 16 and AVRDB. The last set is an own new non-publicity data set. The work by Akbar et al. 17 proposes a method to diagnosis stage of HR through the calculation of AVR and papilledema. The authors use an adaptive histogram based on contrast and the 2D Gabor Wavelet Transform to segment vessels. Afterward, a classification of artery or vein is performed based on color and statistical features, and then, a support vector machine is used to outline the papilledema severity. The proposal is tested in two data sets: INSPIRE-AVR and VICAVR.
In the case of ROP, on one hand, there are semi-automatic proposals. Computer systems for the diagnosis of ROP are called semi-automatic, where digital images are analyzed with some software that requires the guidance of a user with ophthalmologist knowledge. On the other hand, completely automatic proposals are less common. Retinal Image multiScale Analysis (RISA) is a software package for semi-automated retinal image analysis that is more commonly used in research than in clinical studies. This software has been tested in some studies to measure tortuosity, the presence or absence of plus disease, and to compare experts’ criteria for the existence of plus disease.18–20 RISA implements geometrical techniques to measure the width and the tortuosity of vessels. These measurements are based on pixel intensity similarity. An important consideration is that 3 pixels are equal to 90 µm. They all concluded that these tasks are possible with the aid of a computer. In Wilson et al., 21 the computer-aided image analysis of the retina (CAIAR) was proposed and was verified in Owen et al. 22 CAIAR computes curve models to approximate vessel shapes by combining different frequencies and amplitudes. The width and tortuosity of vessels are computed considering these representations, and finally, CAIAR decides plus disease or pre-plus disease by thresholding values of vessel width and tortuosity. Another one is ROPTool, which was tested in the literature.23–27 ROPTool also uses geometrical procedures for computing width vessel and tortuosity. In these studies, researchers set numerical thresholds in order to determine appropriate measures for tortuosity and dilation around the optic nerve, and the pathologies characterized as plus disease and pre-plus disease. A fourth semi-automated software is ROPnet. 28 It starts by manually selecting the vessel to be analyzed and performs a quantitative assessment of the width of the vessels and their tortuosity, based on the number of pixels with similar intensity. With regard to automatic proposals, the work by Prabakar et al. 29 proposes a computerized method to help diagnose ROP based on digital fundus image. A matched filter, as well as smoothing by median filter, erosion, and dilation, is used to characterize and segment the retinal vasculature. The best performance was observed in images diagnosed stage 3 and plus disease. An automated tortuosity computation method is presented in Oloumi et al. 30 and was tested on 110 images from the TROPIC database, of which 19 images correspond to plus disease diagnosis. In Oloumi et al., 31 several processing tasks are applied to measure the width of the major temporal arcade (MTA) automatically, in particular, a Gabor filter, morphological operations, Canny edge detector, interpolation, and geometrical approximations. The method is tested using TROPIC data set previously mentioned. As we have known, plus disease is considered an indicator of the severity of ROP. This condition is determined, mainly, through dilatation and tortuosity measurements. However, measuring tortuosity automatically presents many challenges and there are no referential standard values. 32 All this unequivocally shows that more research is needed to help ROP diagnosis. Contrast enhancement is a fundamental task in visual assessment to support the medical diagnosis. It also helps subsequently isolate the vascular network or perform calculations on the vessels. We present an automated, fast, and Web-based method that allows to clearly see the vessels of the retina from pathological and low quality fundus images.
Method
As discussed in the “Introduction” section, the presented method has been designed and implemented taking into account the requests of the pediatric ophthalmologist to use the image data obtained with their current clinical equipment in clinical practice.
We could identify that fundus images do not show uniform brightness since areas around the edges are darker than the center area. Therefore, it is necessary to increase brightness in proportion to the presence of dark areas in order to avoid losing information. We propose a method for improving the quality of the image that involves several processing tasks. These processing tasks are executed using parametric values based on image characteristics or descriptors. They vary from one to another image. The parametric values are computed automatically by means of an ANN. The method is shown in Figure 1. The input is a color fundus image, and the output is in color too. The image descriptors are computed and then are passed in the ANN’s input layer. The ANN returns in the output layer four parametric values. They are used for processing image enhancement tasks. An easy and efficient Web interface has been developed to aid end users. The proposed method was coded using open computer vision and neural network libraries, which can support the necessary functionalities with suitable run times. The method is detailed in the following sections.
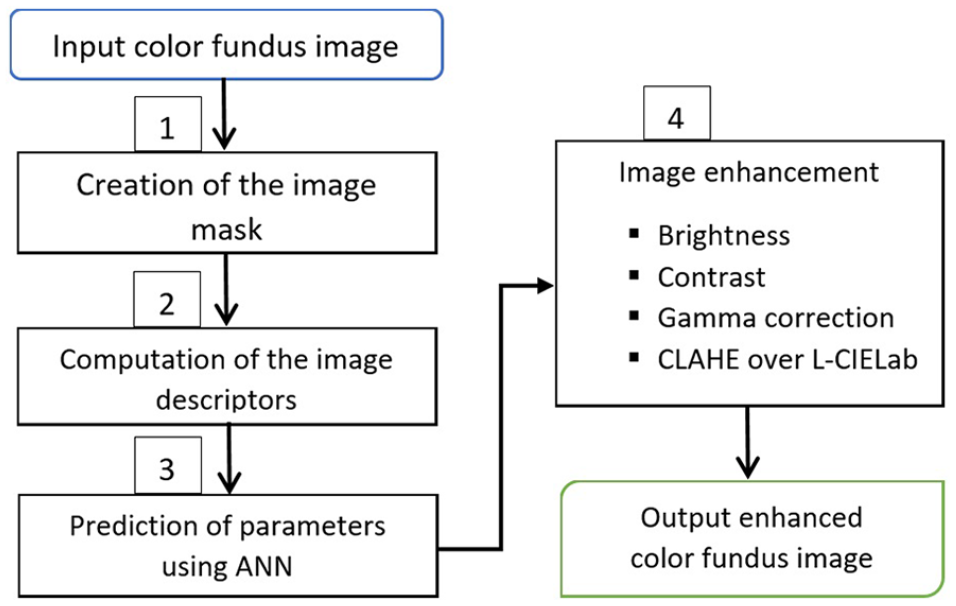
Automated method to enhance pathological color fundus image.
Image mask
The digital fundus image is presented in a rectangle, where dark corners are not part of the retina region. In order to limit the region of interest (ROI) analysis, an automated image mask is created.The creation of the image mask is not a trivial task. The images do not have a regular geometric shape; are not centered; in dark images, the arithmetic intensity variation between retina; and background is not clear and does not allow to compute easily the border. For obtaining the mask, we perform the next processing tasks: extraction of the green channel, negative image, 33 Otsu binarization, 34 convolutional filter, 33 another Otsu binarization, and selection of maximum contour. 35 The convolutional filter uses an identity diagonal matrix of size 15 × 15. Figure 2 shows an example of mask generation.
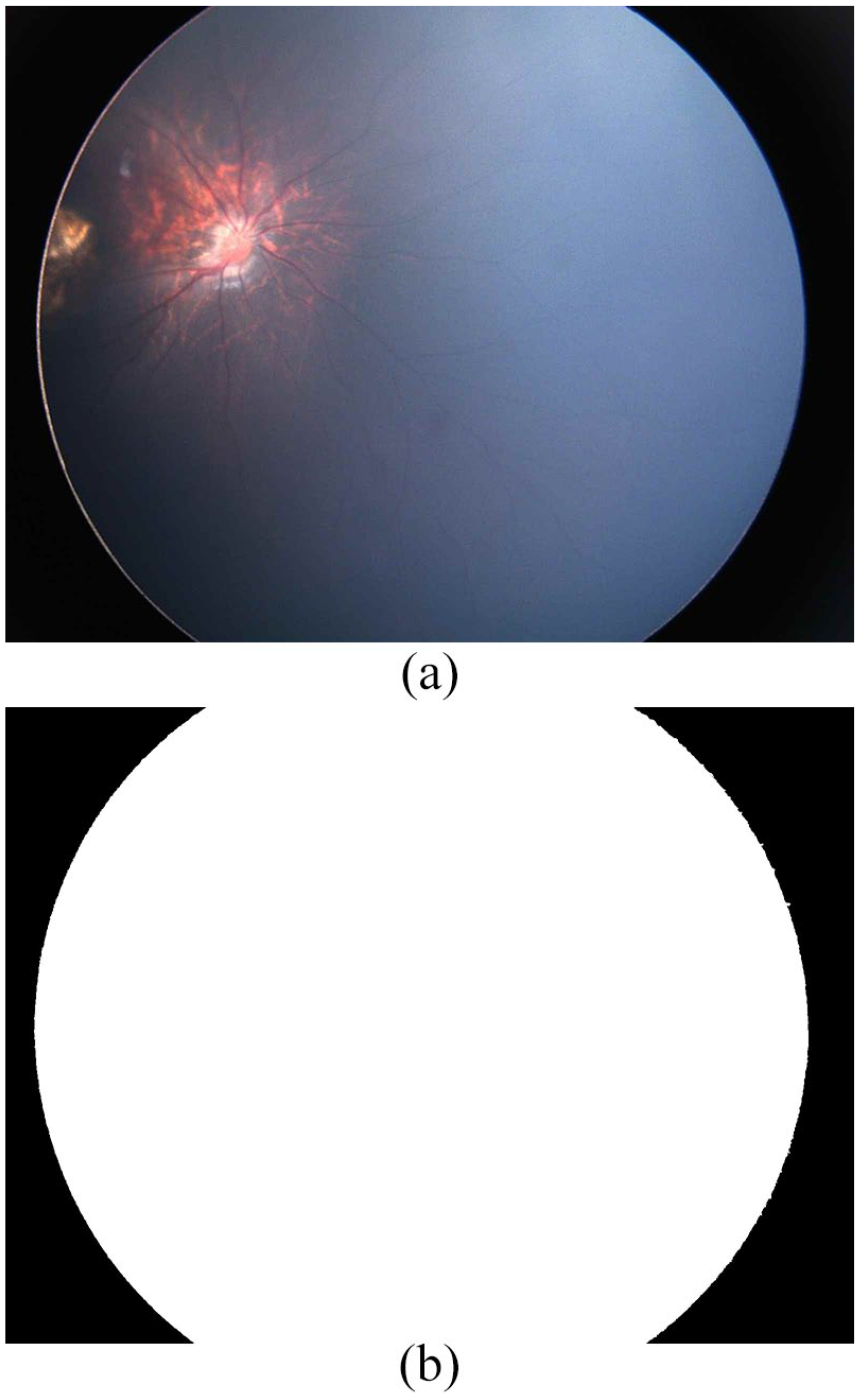
Example of an automated mask image from dark fundus image: (a) original ROP fundus image and (b) its corresponding mask.
Image descriptors
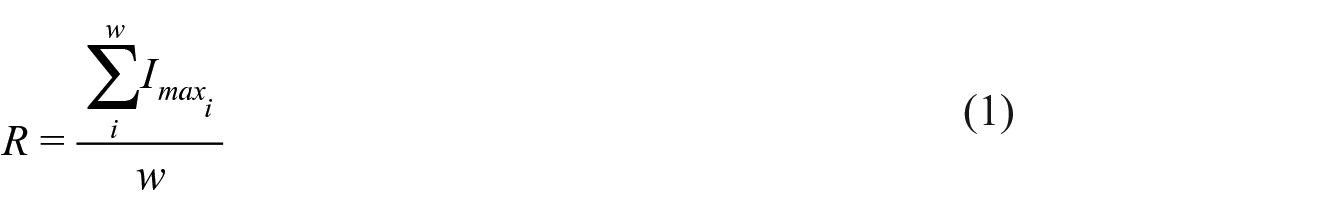
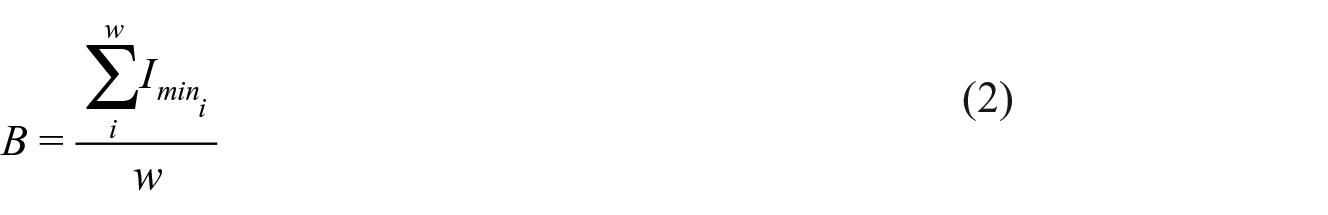
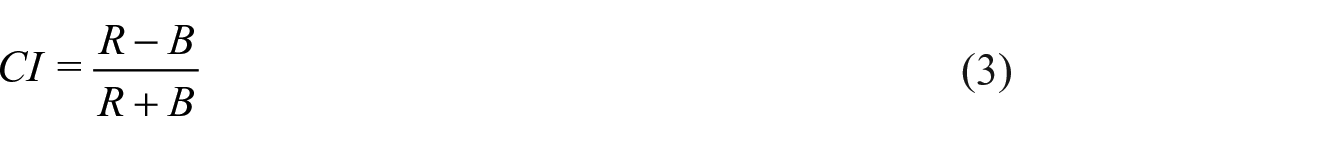
The image descriptors show the pixel intensity distribution and the contrast index.36–39 They depict the aspects seen by the specialist ophthalmologist to decide if it is necessary to alter the brightness or contrast. These image descriptors are obtained from the green channel, which is generally better for obtaining contrast information in comparison to the red and blue channels.40,41 They are the input to the ANN. The descriptors are mode pixel intensity (mode), the frequency of the mode intensity (Fmode), the frequency average (F), the standard deviation of frequency (σF), and the contrast index (CI). To compute them, first, the image histogram (H) is generated. It relates each intensity value (Ii) to the number of times or frequency (F) found in the image f (x, y). Intensity of a pixel can take a value from 0 to 255. The histogram can be expressed like the set H = {h0, h1, . . ., hn}, where hi is the number of times the ith intensity is presented in the image, and n is equal to 255. Graphically, the intensity (I) value along the x-axis and the frequency (F) is shown along the y axis. Hence, the frequency of mode intensity (Fmode) is the maximum value along the y axis, and the mode intensity is its corresponding value along the x-axis. The frequency average (F) and standard deviation (σF) are typical statistical measures that provide information of the intensity dispersion. The contrast index (CI) measures the relation between the foreground (R) and the background (B). It is computed dividing the image into w numbers of windows. The window is 3 × 3 pixels. For each window, the maximum intensity (Imax) and the minimum intensity (Imin) are found. Then, R and B are, respectively, the average of Imax and the average of Imin (see expressions (1) and (2)). Finally, the contrast index for whole image is computed as in expression (3)
Prediction of parameters
The prediction of parameters is performed by means of an ANN that has been previously trained. The ANN design is shown in Figure 3. It is a supervised neural network, which has three layers: input hidden and output. The input layer is composed of a vector of five elements, which are the image descriptors discussed previously. The hidden layer has twenty neurons. The output layer corresponds to the four parameters for processing: contrast, brightness, gamma factor, and cliplimit.
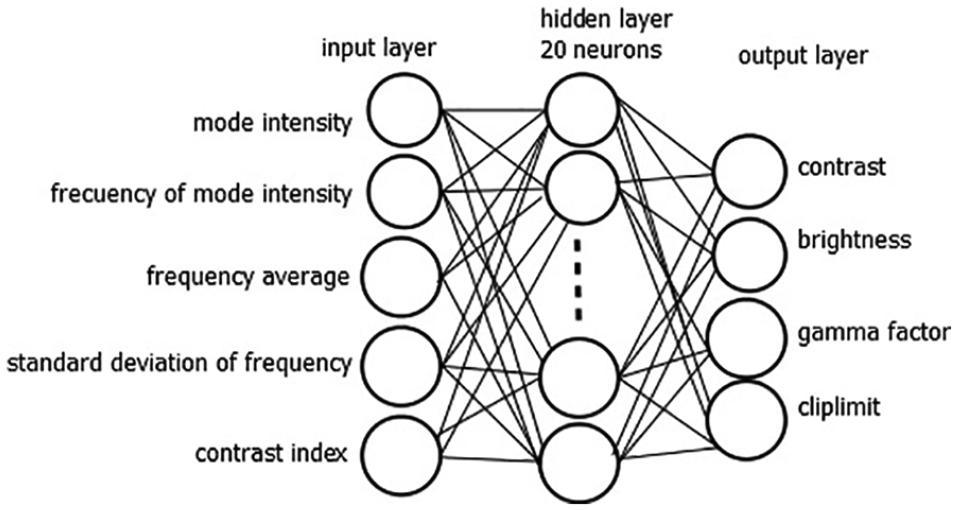
Design of the artificial neural network. Image descriptors compose the input layer, and the output layer produces the parameter values for processing the images.
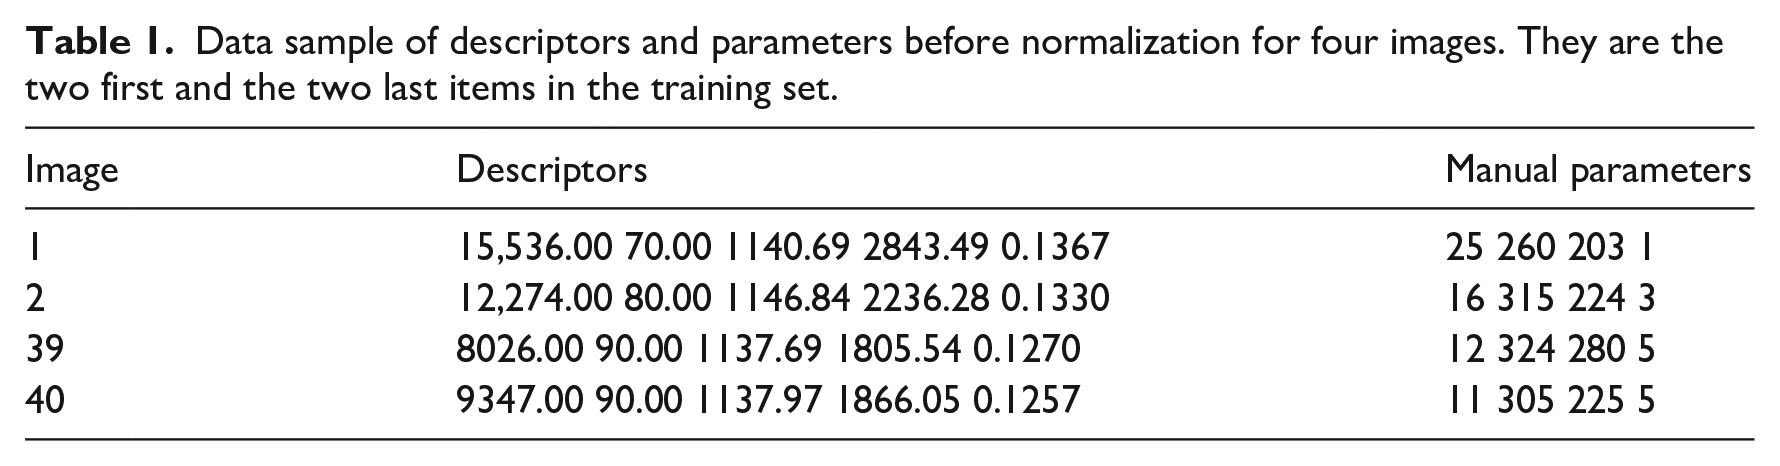
The ANN is a multilayer feed-forward network based on learning through backpropagation. The sigmoid activation function was set in the output layer. The desired error was set in 0.0001. The ANN was trained using 40 images. The outputs or parameters were obtained by expert ophthalmologists (see Table 1).
Data sample of descriptors and parameters before normalization for four images. They are the two first and the two last items in the training set.
For supervised training, inputs and outputs data were normalized to values between 0 and 1, using the expression
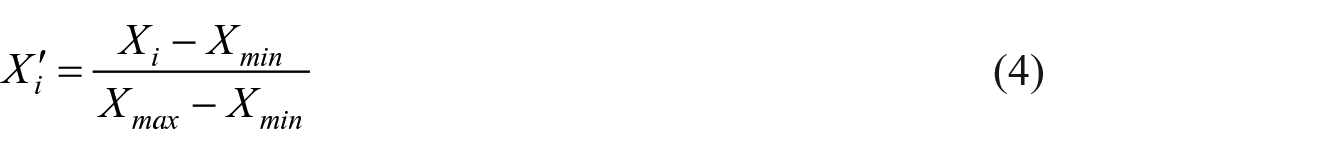
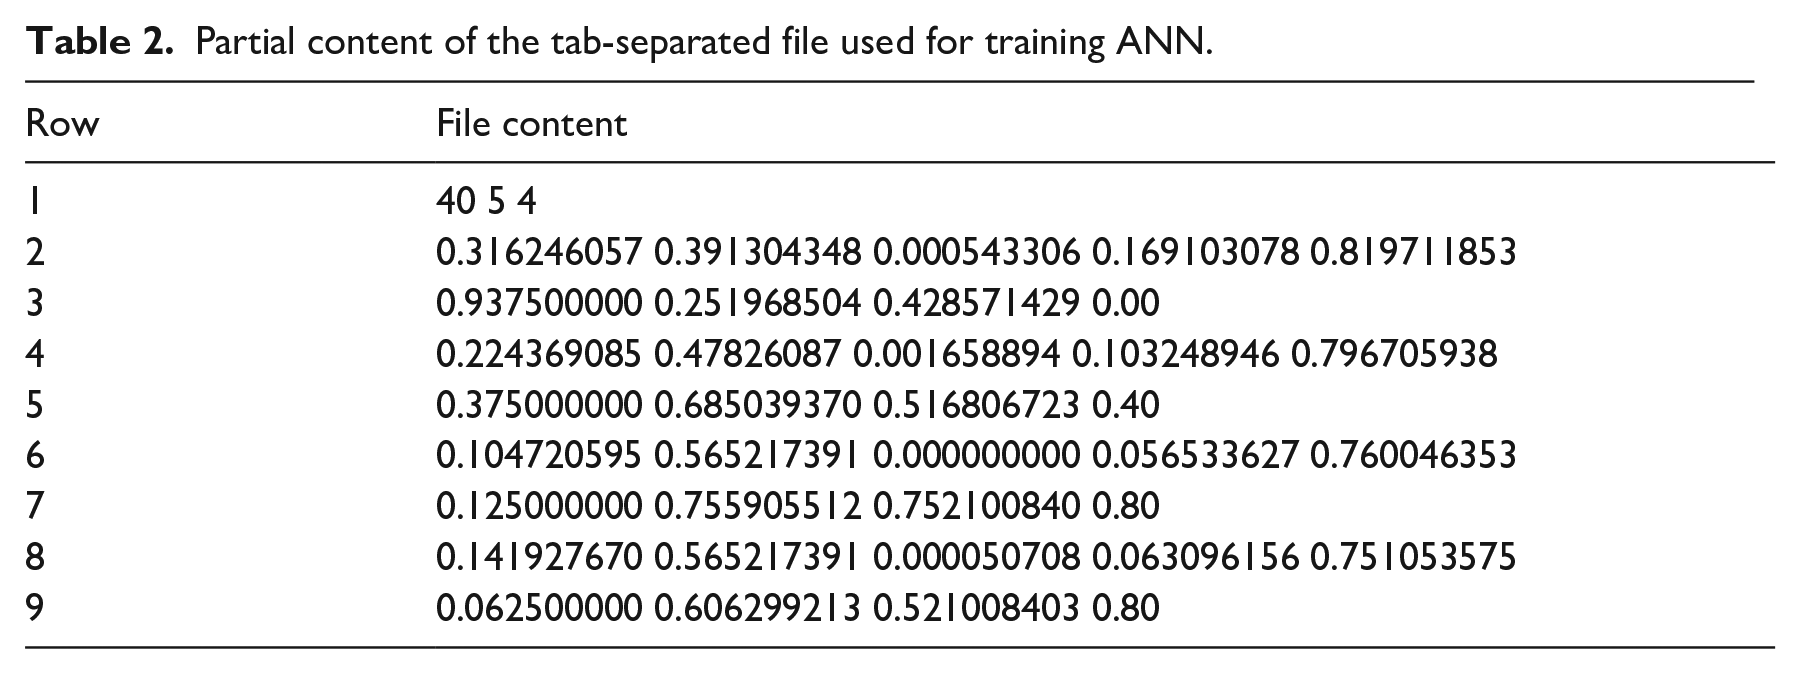
where Xi is a descriptor or a parameter, and Xmax and Xmin are, respectively, the maximum and minimum values of descriptor i in the data set. The partial content of the file used to train the ANN is shown in Table 2, which presents the information of four images. They are the two first and the two last items in the set. The row 1 has the information concerning the file, 40 means the input data number, 5 means number of neurons in the input layer, and 4 means the number of neurons in the output layer. For each image, the input (descriptors) and output (parameters) are in consecutive rows. Accordingly, rows 2 and 3 have the information associated with the first image. The ANN was implemented using the fast artificial neural network (FANN) library. 42 The descriptors computation and processing tasks were implemented with OpenCV library using C++ language. 43
Partial content of the tab-separated file used for training ANN.
Enhancement of color fundus image
The input image is in the RGB color space. The process of image enhancement involves the sequential application of four processing tasks. After that, an enhanced color image is returned. The processing tasks involve modifications of the contrast and brightness, gamma correction, and contrast-limited adaptive histogram equalization (CLAHE) using the predicted parameters. Therefore, the contrast and brightness parameters are the values for adjusting the contrast and brightness, respectively; gamma factor is the value for gamma correction filter, and cliplimit is the value for processing CLAHE over luminance (L) channel in the Commission Internationale d’Eclairage Luminance-chromaticity (CIELab or L * a * b) color space. 44
First, brightness and contrast filters are performed. The brightness and contrast filters are represented as an additive offset and a multiplicative gain, respectively. 45 Each channel (RGB) of the color image is modified separately and then the three channels are merged into one to create the pre-processed color image. The contrast and brightness are applied using the expression (5)

where k can be 0, 1, or 2 for the red, green, and blue channels, respectively. The c and b variables refer to the brightness and contrast parameters obtained by the ANN, respectively. They are integer values.
The second processing task is inverse gamma correction. A gamma correction filter is applied to remove the non-linear schema between the input radiance and the quantized pixel values. 23 When gamma is greater than 0 the output image is lighter than the input. The gamma correction filter is represented using the expression (6)

where γ is the gamma parameter that controls the pixel value correction. It is given by the neural network like an integer value.
To achieve the last processing task, the processed image thus far is converted to the L * a * b format. 44 CLAHE function is applied over the L channel. CLAHE proposes a gain limit that prevents noise increment and excessive brightness and its application to medical imaging has yielded productive results. 46 CLAHE is represented using the expression (7)

where kernelsize parameter defines the regional histogram, and the cliplimit parameter is the value to limit the contrast modification. The kernel size was set to 8 × 8, and cliplimit is found by the neural network. The cliplimit parameter is an integer value.
Results and discussion
A set of 88 images was used in this study. Seventy images were provided by pediatric ophthalmologists from a local hospital. They were obtained during the period years 2013 and 2016 using the RetCam Shuttle camera (Clarity Medical Systems, Inc.). The dimensions of the images are 640 × 480 pixels, and their sizes are around 1 MB. The remaining 18 images belong to the public poor-quality fundus data set assessed in Köhler et al. 47 It is a subset in poor quality from high-resolution fundus (HRF) image database. They were taken with a Canon CR-1 fundus camera. Images in both data sets are difficult cases for analysis since they showed highly variable brightness. Forty images were used for training and 48 images for testing. Unlike most methods that require images of the same dimension, our method is capable of processing images of different dimensions (height × width)..A sample of processed images are displayed in Figure 4.
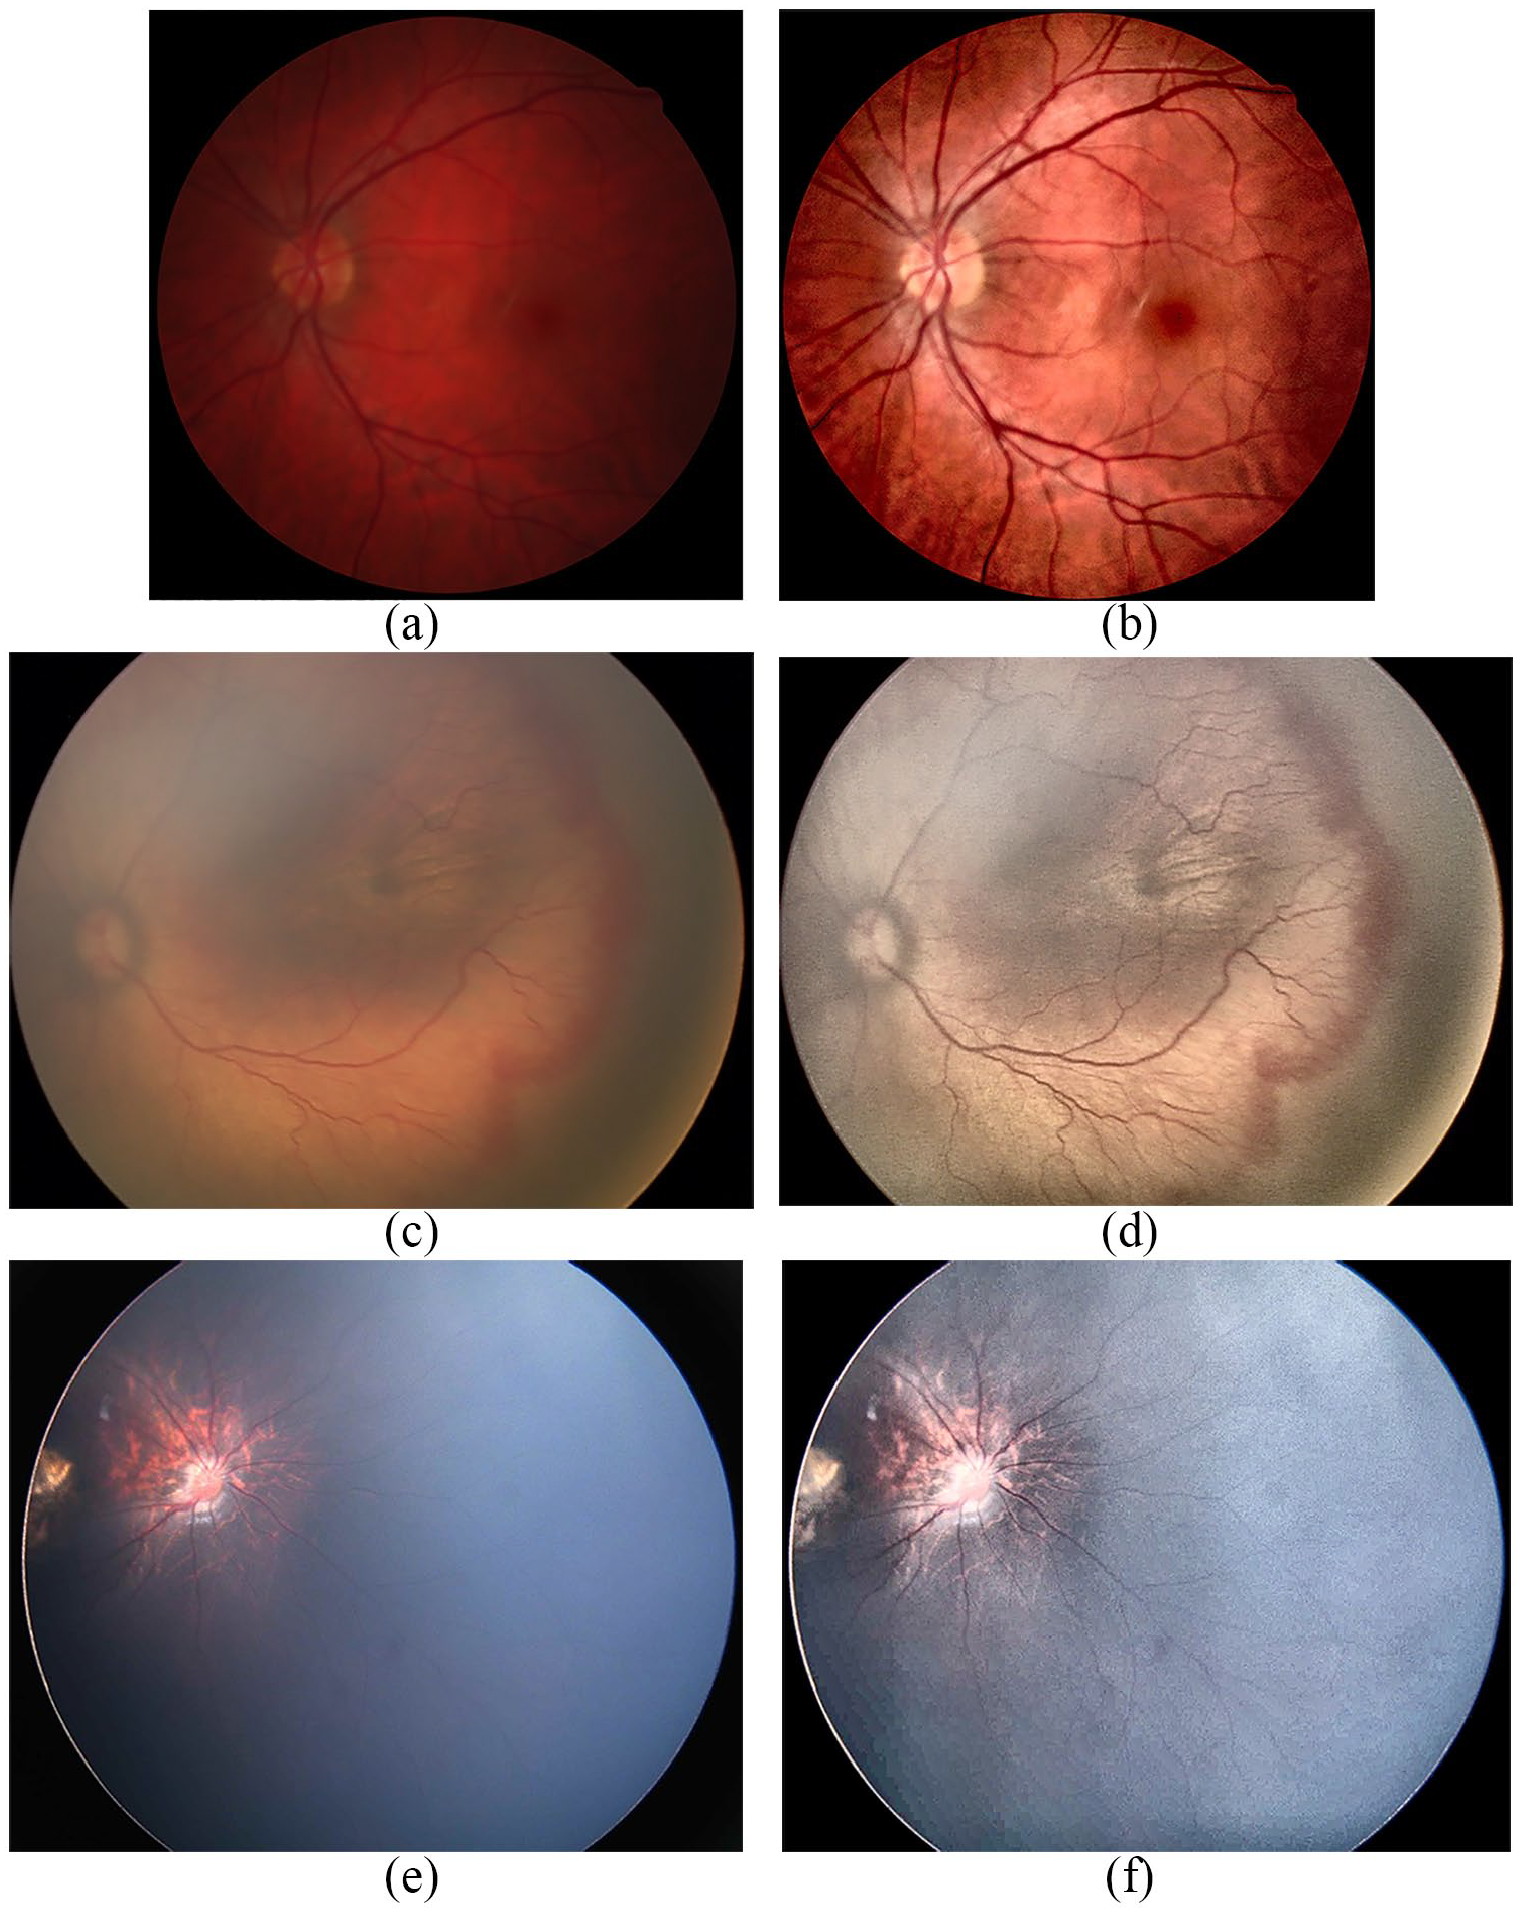
Sample of three ROP fundus images. The original images are (a), (c), (e). Their corresponding enhanced images are (b), (d), (f), respectively.
Table 3 lists the values of the image descriptors, the predicted parameters, and the assessment using the contrast improvement index (CII) for a sample of 10 images. After obtaining the parameter values, the processing tasks are executed on the original or input image, and then, the enhanced or output image is obtained. The enhanced image is compared to the original image using the CII and expert opinions. Efficiency is an important point. We also recorded the time needed to predict the parameters, as well as the time to process the image.
A randomly selected sample of 10 images, CIinput is the contrast index of the original image. The measure CIoutput is the contrast index of the processed image, and CII is the contrast improvement index.
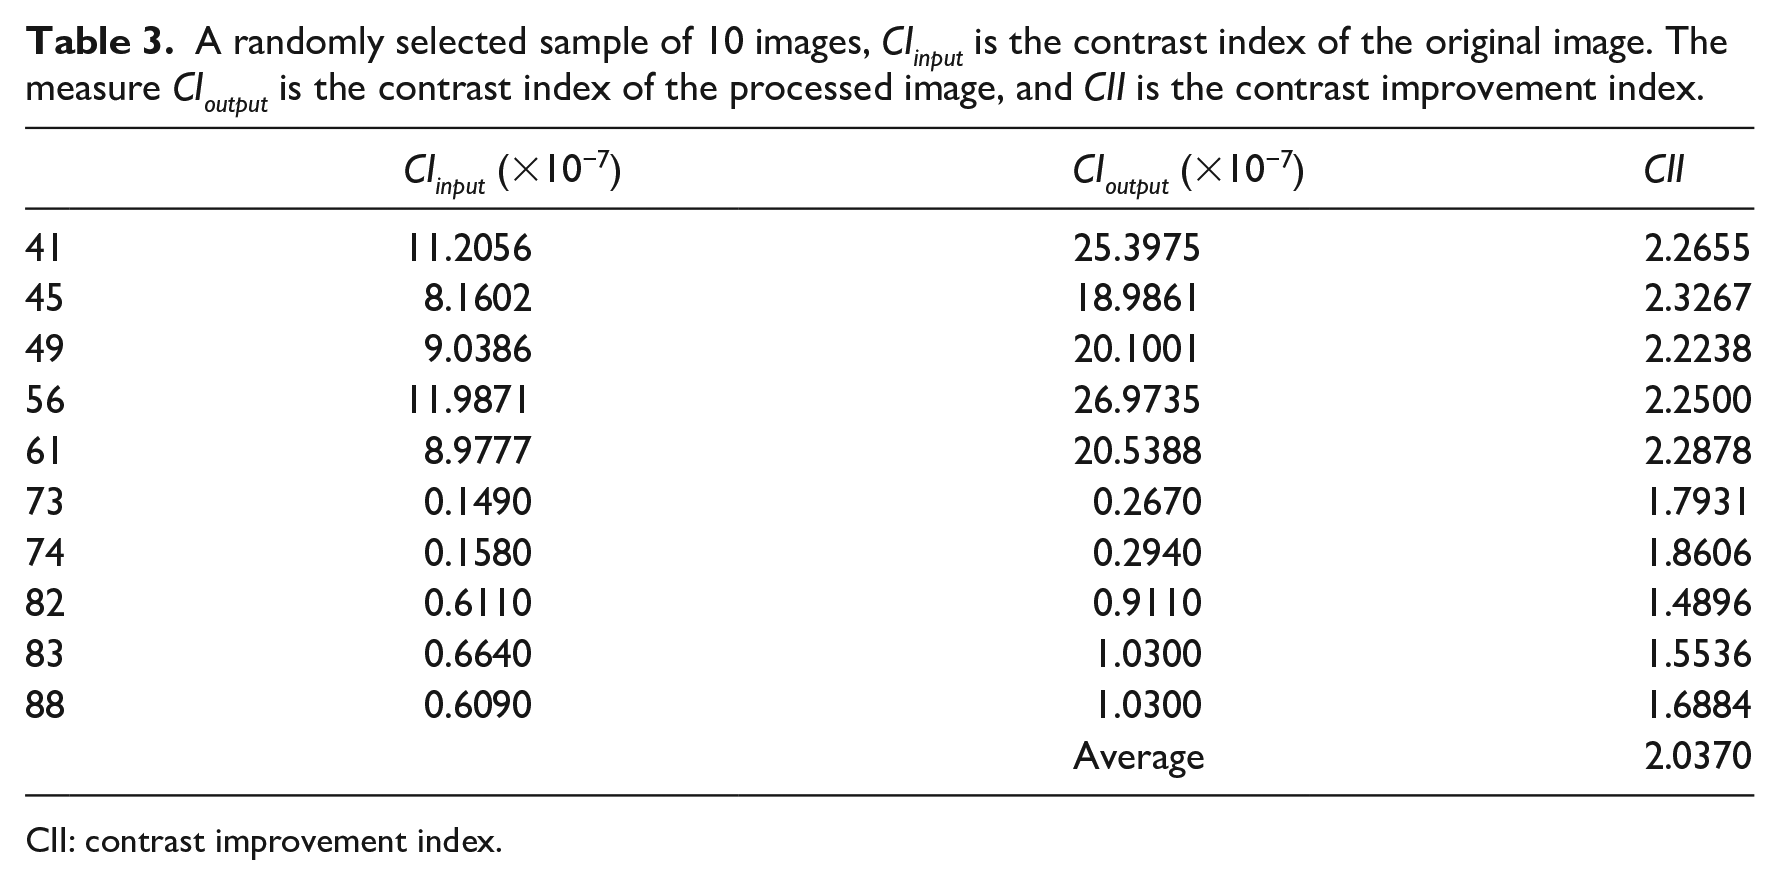
CII: contrast improvement index.
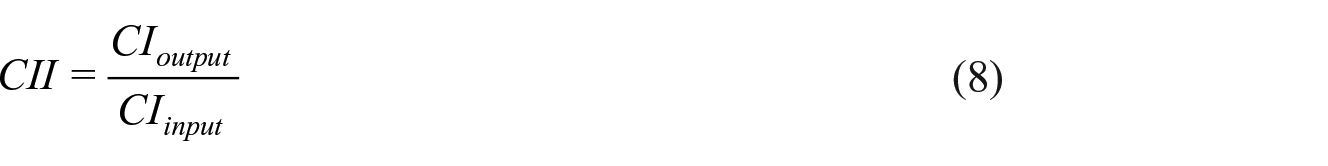
CII
The CII has been widely used to measure contrast enhancement.36–39 CII computes the increase in contrast in the output image respect to the input image. It is given by the ratio of the contrast index of the output image and the input image (see expression (8)). The contrast index was discussed previously in the “Method” section. For all images, the CII reported values greater than 1, and the CII average was 2.037. This means that the output image had better contrast than the original image (see Table 3), and that the output image facilitates to distinguish the vessels
Evaluation of the experts
To provide physicians with worldwide access to the solution, a Web environment was implemented. The graphical user interface (GUI) has two options for processing: manual and smart. The manual processing option requires the user to introduce the five parameters. It was used by expert ophthalmologists to collect data for training the neural network. The smart processing option retrieves the parameters using our proposed neural network (see Figure 5). Therefore, the following results of the evaluation of the experts were obtained using the smart processing option. Three pediatric ophthalmologists evaluated independently the output images. Two of them have more than 10 years of experience diagnosing ROP, and the other more than 6 years. They decided to evaluate a sample of 26 cases randomly chosen. Two questions were asked to the experts:
Question A. Will the resulting image make easier to diagnose the ROP? The response options are yes or no. In this question experts selected the answer yes in a 96.2 percent of the cases.
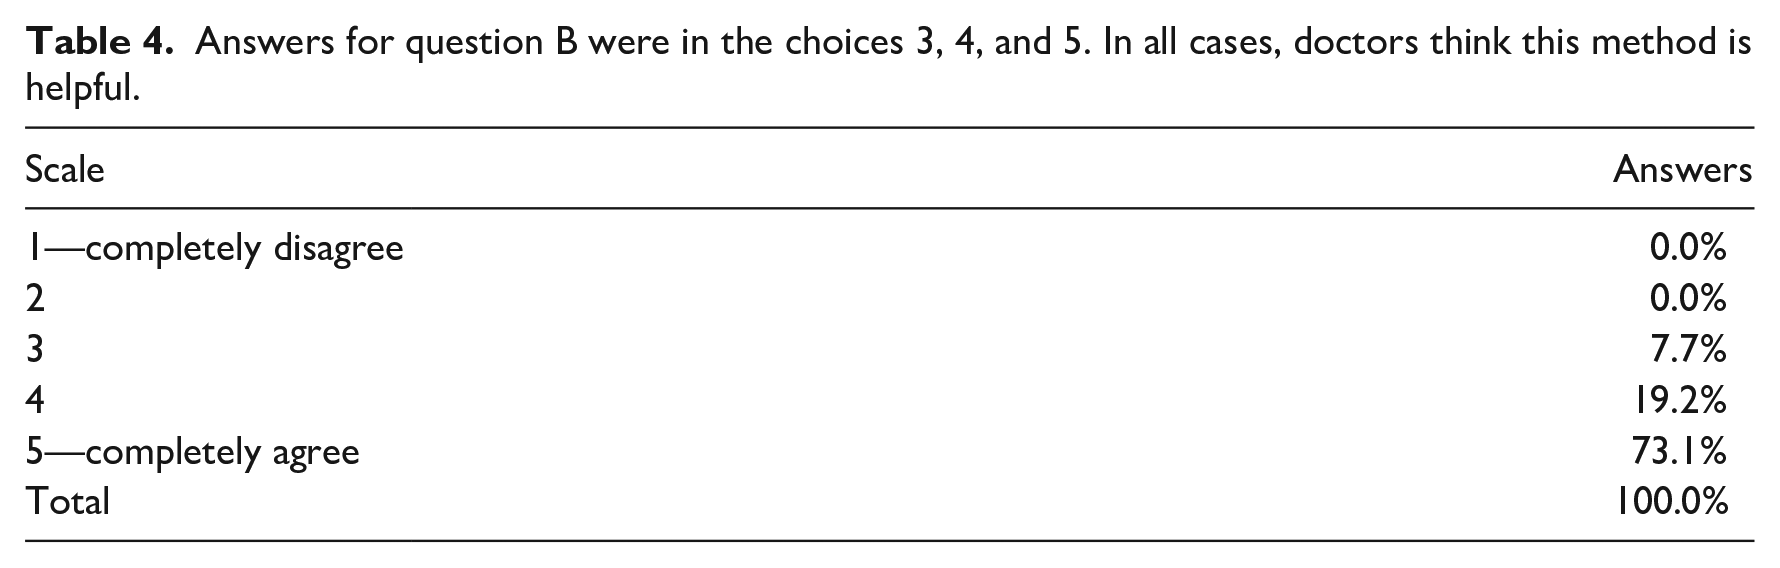
Question B. Will the resulting image allow you to see more clearly the retinal vessel net? For this second question, the answer is on a scale from 1 to 5, being 1 means completely disagree and 5 means completely agree. The percentages for each option are shown in Table 4. The answers for options 4 and 5 totaled 92.3 percent.
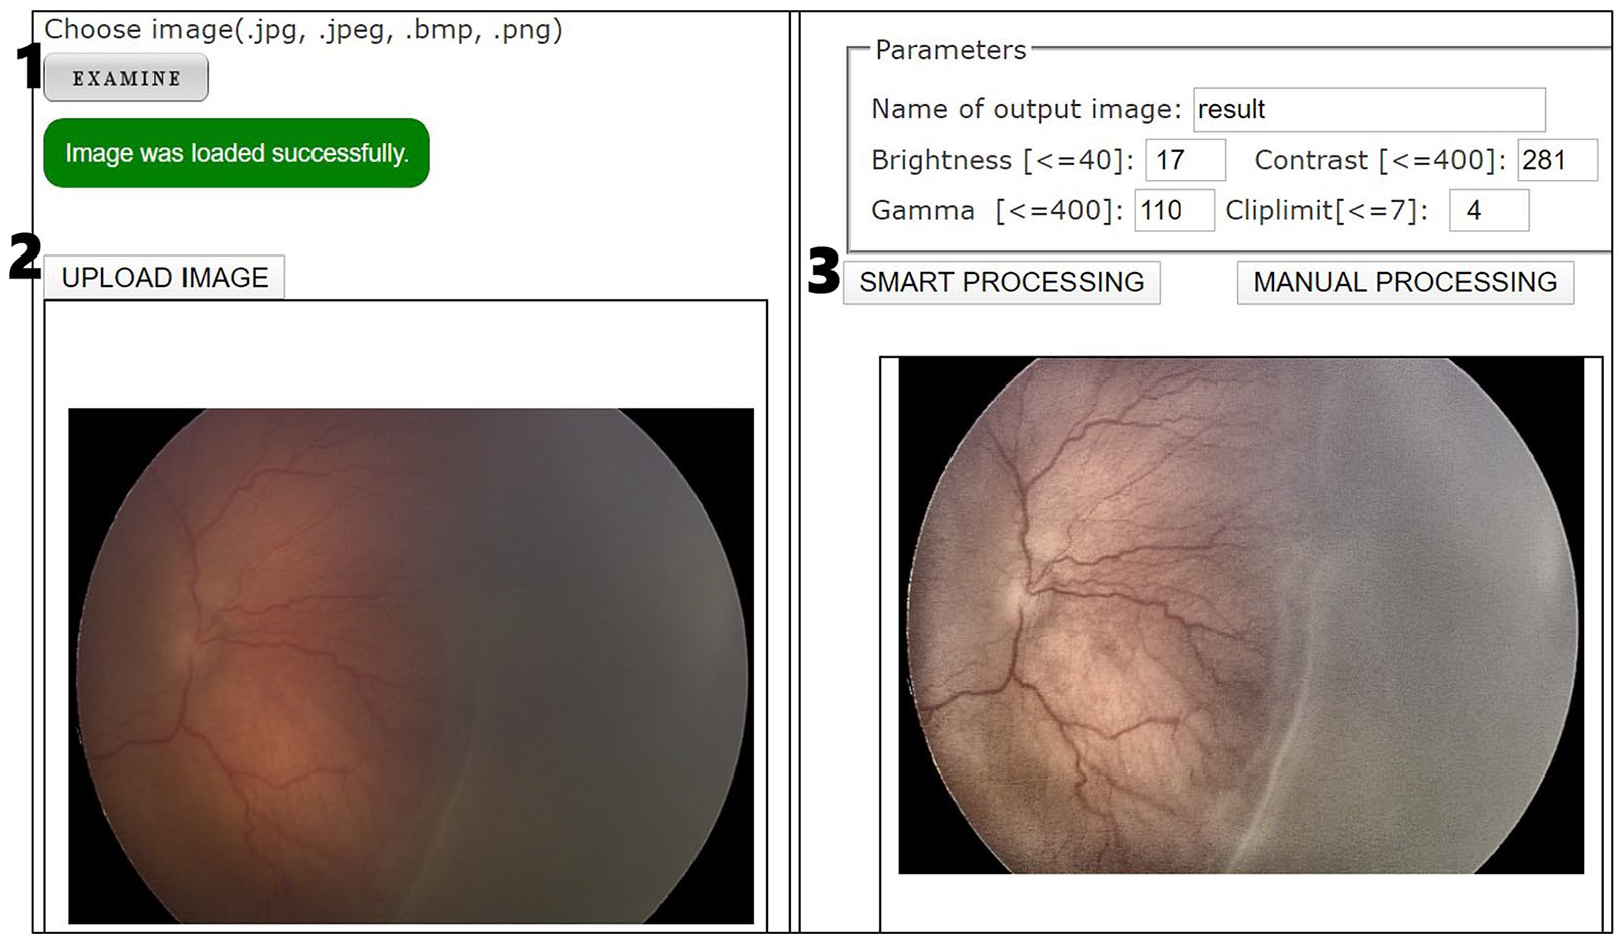
Web interface where user can improve fundus images graphically. To process an image the user should make click on the buttons in the order indicated by numbers.
Answers for question B were in the choices 3, 4, and 5. In all cases, doctors think this method is helpful.
Efficiency
Regarding the efficiency of our method in terms of execution time, the average time per image was 42.04 ms. This time is measured in the server after an image is received until the image is enhanced, and, in particular, it accumulates the execution time of all scripts associated with steps 1 to 4 in Figure 1. Therefore, this value does not consider the time spent on data transfer through the Web interface. An Ubuntu Server v.16.04 with 1 GB of RAM and Intel® Xeon® CPU E5-2676 v3 2.4 GHz processor has been employed for the Web application testing.
Conclusion and future works
This proposal focuses on a real-world problem, aiming to facilitate the analysis of retinal fundus images, particularly those of premature infants. The proposed work adaptively improves the contrast and brightness. Our proposal is aimed to be used in real environments where images could be obtained with current equipment and cameras. In this article, a novel and efficient method to improve the quality of pathological fundus images has been proposed. The method automatically obtains four parametric values (contrast, brightness, gamma, and cliplimit) that are needed for processing and enhancing the input images. An ANN is used to calculate these parameters.
The proposed method was tested on 48 images, which is a poor-quality image set. For all cases, the CII indicated higher contrast in the processed image than the original image. In addition, expert evaluation also reported a qualitative enhancement of the images, and that retinal vessels were more easily recognized.
The proposed method is fast, particularly the average execution time obtained for test images was merely 42 ms.
In future research, we would like to continue dealing with clinical images (including relatively low quality images) of ROP. Considering the work by International Committee for the Classification of Retinopathy of Prematurity, 2 we would like to assess the extent of poorly formed vessels and predict the degree of severity, stage, and level of plus disease, for example, to calculate the extent of poorly formed vessels by the automatic identification of the retina’s quadrants where there are vessels of acceptable width, very thin, or there are none.
Supplemental Material
HIJ-19-0314.R1_maindoc_IntriagoEtAl – Supplemental material for Enhancing vessel visibility in fundus images to aid the diagnosis of retinopathy of prematurity
Supplemental material, HIJ-19-0314.R1_maindoc_IntriagoEtAl for Enhancing vessel visibility in fundus images to aid the diagnosis of retinopathy of prematurity by Monserrate Intriago-Pazmino, Julio Ibarra-Fiallo, José Crespo and Raúl Alonso-Calvo in Health Informatics Journal
Footnotes
Acknowledgements
The authors thank pediatric ophthalmologists—Dr Andrea Molinari and Dr Monica Vargas—from Hospital Metropilitano, Dr Jorge Luis Diaz and Dr Fernando Diaz from Hospital Baca Ortiz, both hospitals from Quito, Ecuador, for sharing their knowledge and experience in dealing with retinopathy of prematurity (ROP).
Declaration of conflicting interests
The author(s) declared no potential conflicts of interest with respect to the research, authorship, and/or publication of this article.
Funding
The author(s) received no financial support for the research, authorship, and/or publication of this article.
References
Supplementary Material
Please find the following supplemental material available below.
For Open Access articles published under a Creative Commons License, all supplemental material carries the same license as the article it is associated with.
For non-Open Access articles published, all supplemental material carries a non-exclusive license, and permission requests for re-use of supplemental material or any part of supplemental material shall be sent directly to the copyright owner as specified in the copyright notice associated with the article.