
Abstract
The accurate forecast of radiology emergency patient flow is of great importance to optimize appointment scheduling decisions. This study used a multi-model approach to forecast daily radiology emergency patient flow with consideration of different patient sources. We constructed six linear and nonlinear models by considering the lag effects and corresponding time factors. The autoregressive integrated moving average and least absolute shrinkage and selection operator (Lasso) were selected from the category of linear models, whereas linear-and-radial support vector regression models, random forests and adaptive boosting were chosen from the category of nonlinear models. The models were applied to 4-year daily emergency visits data in the radiology department of West China Hospital in Chengdu, China. The mean absolute percentage error of six models ranged from 8.56 to 9.36 percent for emergency department patients, whereas it varied from 10.90 to 14.39 percent for ward patients. The best-performing model for total radiology visits was Lasso, which yielded a mean absolute percentage error of 7.06 percent. The arrival patterns of emergency department and total radiology emergency patient flows could be modeled by linear processes. By contrast, the nonlinear model performed best for ward patient flow. These findings will benefit hospital managers in managing efficient patient flow, thus improving service quality and increasing patient satisfaction.
Introduction
With the rapid development of technological innovations in the radiology department, the demand for imaging services such as computed tomography (CT) and magnetic resonance imaging (MRI) has increased significantly over the past decades.1,2 However, hospitals do not extend their capacity at the same rate due to the high fixed and operation costs. 3 These lead to a great imbalance between supply and demand, which is associated with hospital overcrowding, general patient dissatisfaction, and longer delays.4,5 To deal with this complex challenge, hospital managers have made great efforts to manage patient flows and schedule health services so as to improve resource utilization and achieve better patient outcomes. 6
Generally, there are three kinds of patient flows in the radiology department. Both outpatients and inpatients have to make appointments in advance, while emergency patients walk in randomly with a higher priority.7,8 The large volumes of emergency patients often lead to lengthy wait times of outpatients and inpatients, intensive stress among technicians, which can directly reduce the operational efficiency and healthcare quality. 9 Hence, it is urgently needed to accurately estimate radiology emergency patient flows. Specifically, the radiology emergency patients are mainly from two sources: emergency department (ED) and ward. They come to the radiology department with distinct modes. Most patients from ED are walk-in patients, whereas most patients from ward are transported through sickbeds. Since ward patients take up more space, their arrivals are more easily to cause overcrowding. Therefore, forecasting categorized radiology emergency patient flows is valuable to alleviate congestions and mitigate delays. Furthermore, previous studies have stated that the prediction accuracy of total visits improves significantly compared with those of categorized forecasts.10–12 As a result, forecasting total radiology emergency visits is of great importance to achieve accurate forecast, aiding scientific daily appointment scheduling decisions and efficient operations management.
In the field of health care system, increasing attention has been paid to patient flow forecast in different departments, such as outpatient department (OD) arrivals,13,14 discharges, 15 and ED visits,16–19 which was quite different from the forecast of radiology emergency visits. In the aspects of management modes, many large hospitals implement a planned policy to control outpatient visits and inpatient discharges.13,15 By contrast, the radiology emergency patient flow is stochastic and unplanned, 20 beyond the control of hospital, which shares some similarities with ED visits. However, most papers focused on forecasting total ED visits only, without revealing if patients in different sources could be modeled by the same set of factors. 21 This study will further consider the issue of categorized forecasting, and offer empirical evidence on identifying the influencing factors associated with different sources of patient flows, which is far more complicated than that of ED forecasting.
The analysis of daily radiology emergency patient flow belongs to time series forecast problem, in which features of cycle and randomness have the biggest influence on prediction accuracy. 22 The autoregressive integrated moving average (ARIMA) has shown great potential in extracting linear pattern and proved to be an effective method in forecasting patient flows.10,13,15,17,23 In the process of constructing an ARIMA model, the number of patient arrivals depends solely on its past values. 21 To capture the seasonal effects, seasonal ARIMA (SARIMA) model and multiplicative seasonal ARIMA (MSARIMA) have been widely studied.13,15 As a result, most studies used day of the week as a predictor of patient visits.12,24 However, few studies have attempted to fully extract the corresponding time factors, such as the seasonal components of weekly, monthly, quarterly, and yearly periodicities as well as public holiday effect. Furthermore, although previous studies have reported that lagged visits and corresponding time factors have impacts on patient visits,17,21 the consideration of combining above two contributing variables to forecast radiology emergency patient flow has received limited attention.
Generally speaking, it is difficult to determine whether patient arrival pattern is generated by a linear or nonlinear process, as it generally involves both trend and seasonal variations. 25 Due to the rapid development of machine learning, many techniques such as least absolute shrinkage and selection operator (Lasso),26–29 support vector regression (SVR),29–32 random forests (RF),29,33–35 and adaptive boosting (AdaBoost)36–39 take advantage of feature selection and have achieved great success in many fields, such as energy market,28,32,33,37,38 business sales, 29 tourism, 30 traffic, 39 and environment index. 31 Although their abilities to capture linear and nonlinear trends have been validated, few studies are found in forecasting radiology emergency patient flow, which has similar features of above time series forecast problems. In addition, cross-validation is a commonly adopted method to select the hyperparameters in the area of machine learning. The joint use of cross-validation 29 and multi-model approach23,40–42 can guarantee the robustness of the models.
The aim of this research was to improve healthcare service quality by forecasting daily radiology emergency patient flow on the basis of a multi-model approach with consideration of different patient sources. By introducing lag effects and corresponding time factors to construct forecast models, our analysis offers empirical evidence on forecast model selection and sheds light on whether radiology emergency patient flow can be modeled by a linear or nonlinear process. These findings will benefit hospital managers in managing efficient patient flow and optimizing scheduling decisions, thus improving resource utilization and increasing patient satisfaction.
Methods
Data and feature extraction
The data in this study were sourced from the Radiology Information System (RIS) of West China Hospital (WCH). We obtained emergency patient records for CT examinations from 1 January 2013 to 31 December 2016 (4 years). Each record included patient ID, patient sources, type of examination, arrival time, appointment time, examination time, and report time. We computed the number of arrivals on each day, to facilitate the application of forecast models. Overall, there were 297,335 radiology emergency patients requesting for CT examinations during this period. The number of ED and ward patients were 178,053 and 119,282, respectively. The ED patients accounted for 59.88 percent of the total visits.
Regarding previous research and data availability, we selected two kinds of contributing variables associated with daily radiology emergency patient flow. They were lagged patient visits and corresponding time factors, as shown in Table 1. The former was defined as lag effects, whereas the latter consisted of variables representing year, season, month, weekday, and public holiday (yes/no).
All daily features of this study.
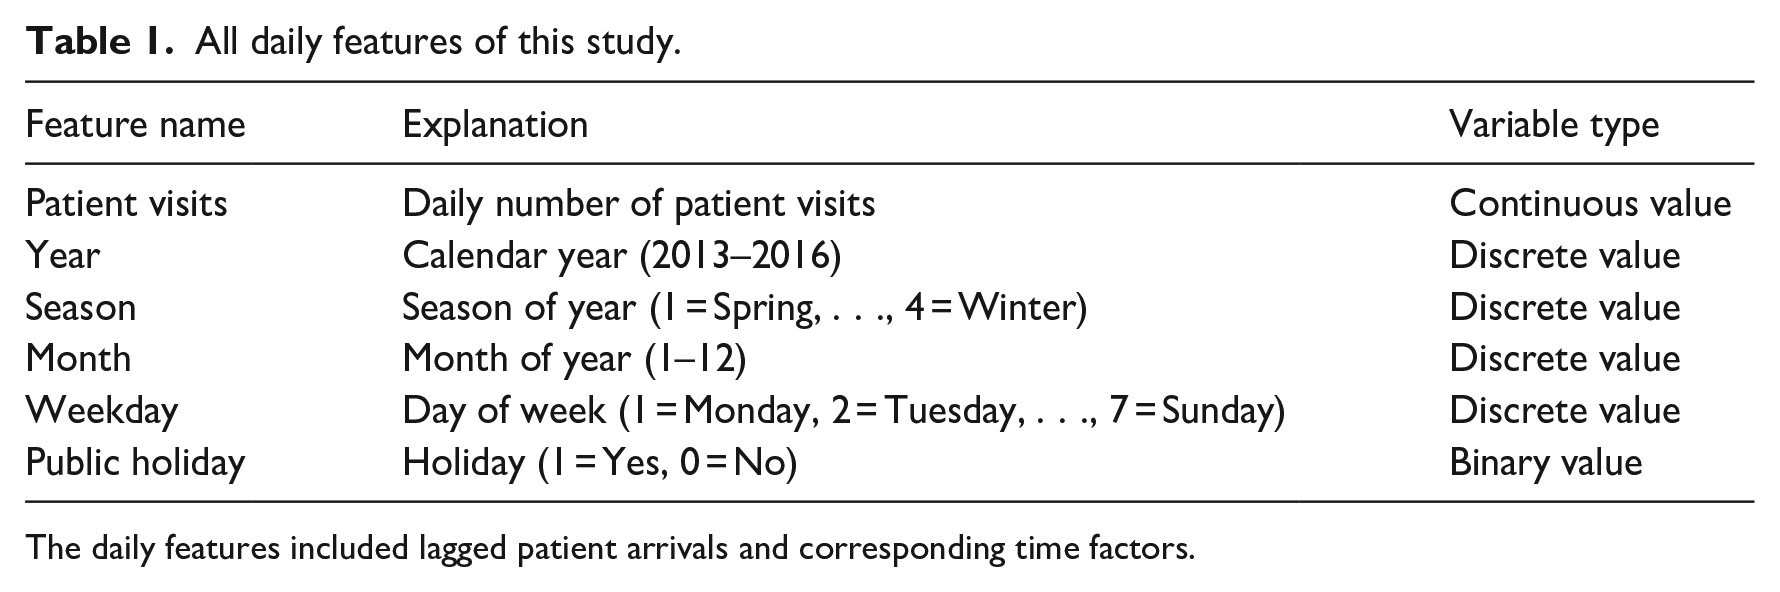
The daily features included lagged patient arrivals and corresponding time factors.
Forecast model
The ARIMA model assumed that the number of daily radiology emergency visits rely solely on the lagged visits and error terms. 13
When building machine learning models, we assumed that the number of emergency visits

where
The number of daily emergency patient visits,

The corresponding time factors including year, season, month, day of the week, and holiday information were transformed using one-hot encoding
Proposed methods
In this study, we adopted both linear and nonlinear models to forecast daily radiology emergency patient flow. We selected ARIMA and Lasso from the category of linear models, and Linear-SVR (linear kernel), Radial-SVR (Gaussian radial basis kernel), RF, and AdaBoost model from the category of nonlinear models. Forecast models were developed for each category and the total visits. Categorized forecast was defined as forecasting radiology emergency patient visits according to their sources (ED and ward), whereas total forecast was defined as forecasting total visits. The ARIMA model was realized using SAS (version 9.3), whereas Python (version 2.7) was employed for the implementation of machine learning algorithms.
Figure 1 shows the experiment procedures of this article. There were four steps involved: (1) splitting data into training and testing sample, (2) establishing forecast models on training sample and selecting parameters, (3) testing models on test sample and calculating performance measures, and (4) comparing models.
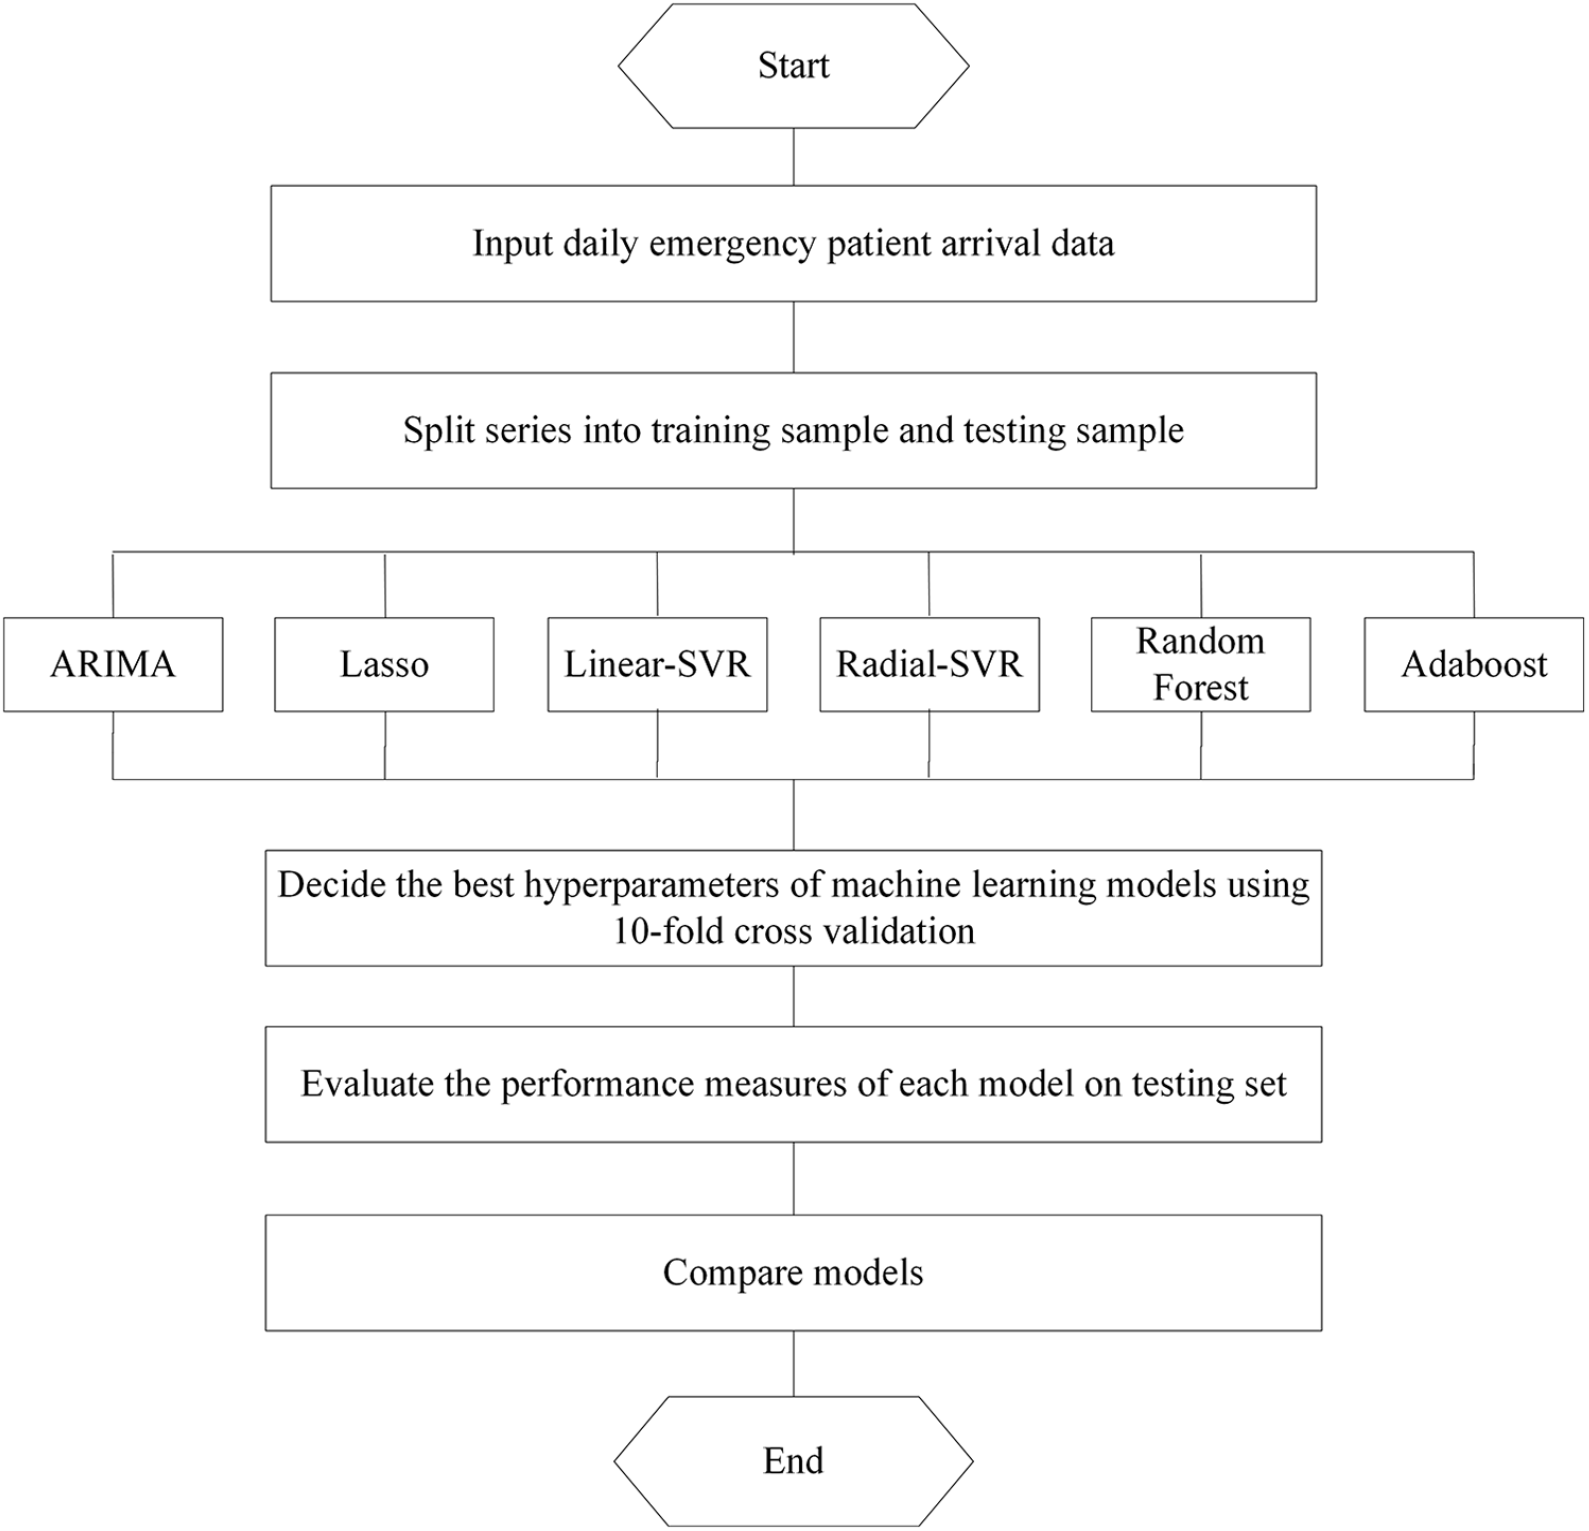
The experiment procedure for daily emergency visits forecasting.
First, we divided the data into training set and testing set. The training set was used to train the model, and the testing set was used to evaluate it. In our study, the first 1169 observations from 1 January 2013 to 14 March 2016 (80% of all data) were used as training set, whereas the last 292 observations from 15 March 2016 to 31 December 2016 (20% of all data) were utilized as testing set. Second, we determined the best hyperparameters of our machine learning models using a cross-validation approach on training set. For each potential value of the hyperparameter, we assessed its performance using 10-fold cross-validation with 10 repeats. Then, grid search was used to choose the values of hyperparameters that outputted the best performance. Third, we evaluated the performance on testing set, once the model and its best value for the hyperparameters were set. Accordingly, we outputted 10 MAPEs (mean absolute percentage errors) on the testing sample to validate the stability of machine learning algorithms. Finally, the models were compared according to their performance measures using one-tailed t-test.
As there was only one output of ARIMA, we used the same value 10 times to be comparable with above machine learning methods. Paired sample t-test was used to verify the difference among forecast models, whereas the linear and nonlinear models were compared through independent sample t-test.
Performance measures
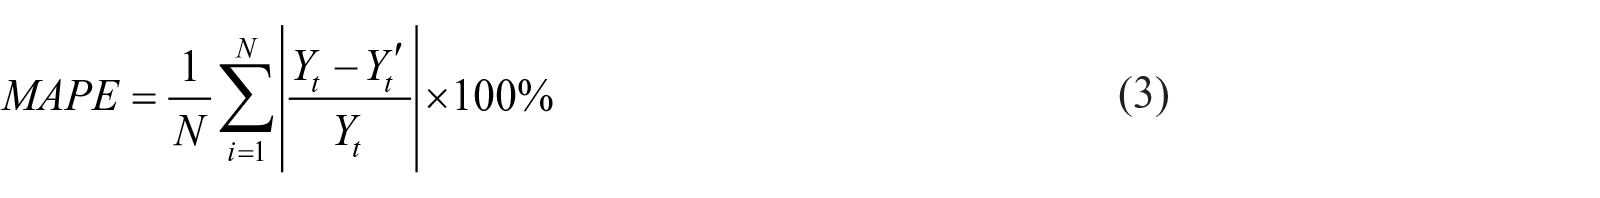
MAPE represents the percentage of average absolute error, which is a well-known accuracy measure in forecasting community.6,15 Owing to its wide use in previous studies and its effectiveness in describing prediction accuracy,10,12,13,16,24 we chose it to evaluate the performance of the model, as defined by equation (3), where
Results
Table 2 summarizes the statistical descriptions of patients by sources. The average number of total emergency patients was about 203 patients per day, and the standard deviation (SD) was 26.13. The ED patients accounted for a large proportion (Mean = 121.87), whereas ward patients had high volatility (SD = 22.83). Figure 2 provides an overview of the daily radiology emergency patient flow. For ED, ward, and total patient arrivals, we can intuitively find the significant nonstationary patterns, and the differences between ED patients and ward patients.
Summary statistics of daily emergency volumes from 1 January 2013 to 31 December 2016.
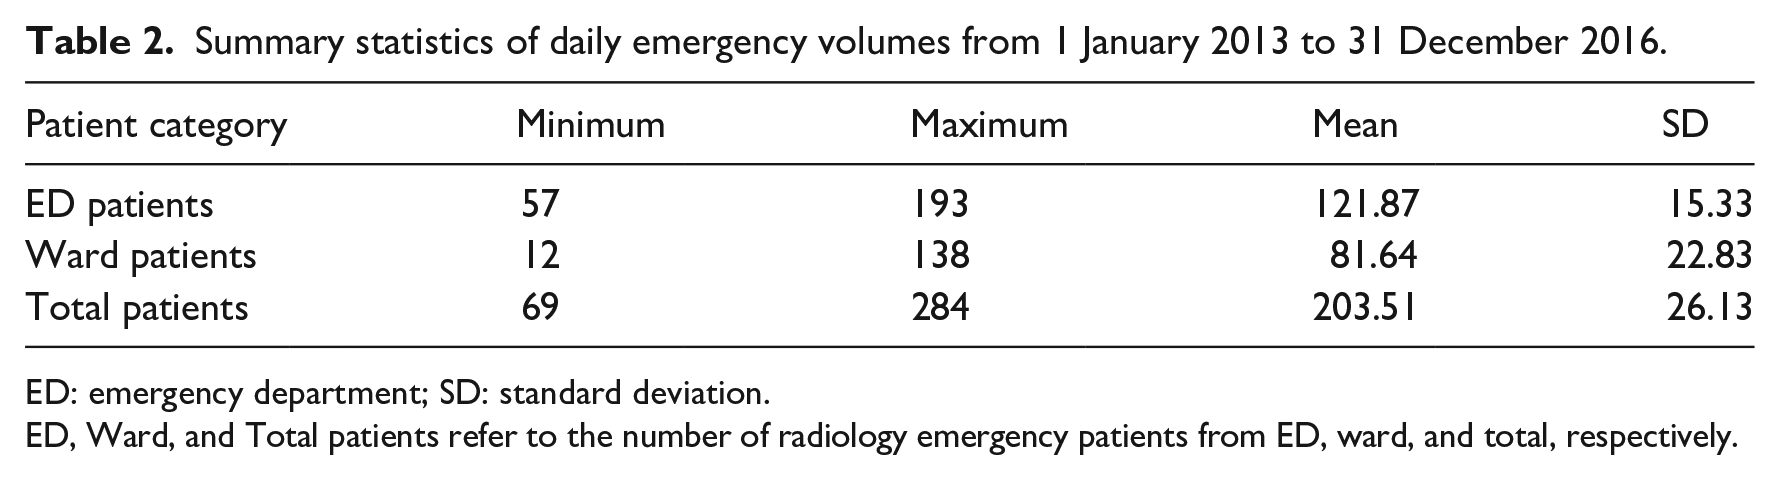
ED: emergency department; SD: standard deviation.
ED, Ward, and Total patients refer to the number of radiology emergency patients from ED, ward, and total, respectively.
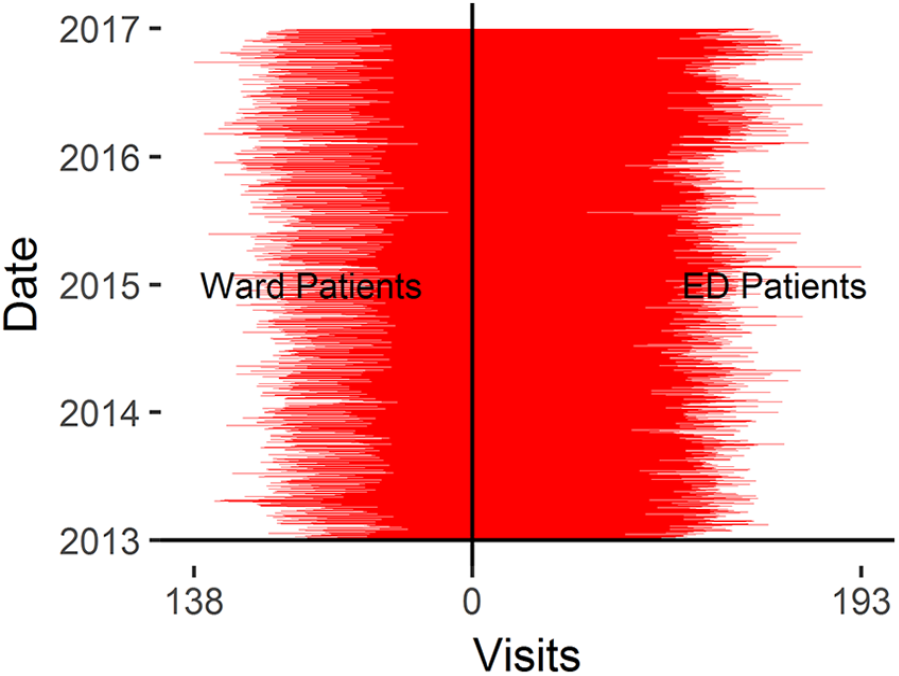
The daily emergency visits from 1 January 2013 to 31 December 2016.
For ED patients, the machine learning models were quite consistent in predicting patient visits, with the gap between maximal and minimal MAPEs ranging from 0.21 to 1.02 percent. In addition, all six models achieved accurate prediction with average MAPE varying from 8.56 to 9.36 percent, as illustrated in Figure 3. Table 3 summarizes the p-value of paired sample t-test. ARIMA performed statistically better than all other competitors (p < 0.001), followed by Linear and AdaBoost. By contrast, Lasso, Radial SVR, and RF outputted the largest MAPEs. Furthermore, there were no differences between any two of above three models (p > 0.05). Table A1 and Table A2 in Supplemental Appendix provides the comparison of performance measure for proposed models and the full results of paired sample t-tests.
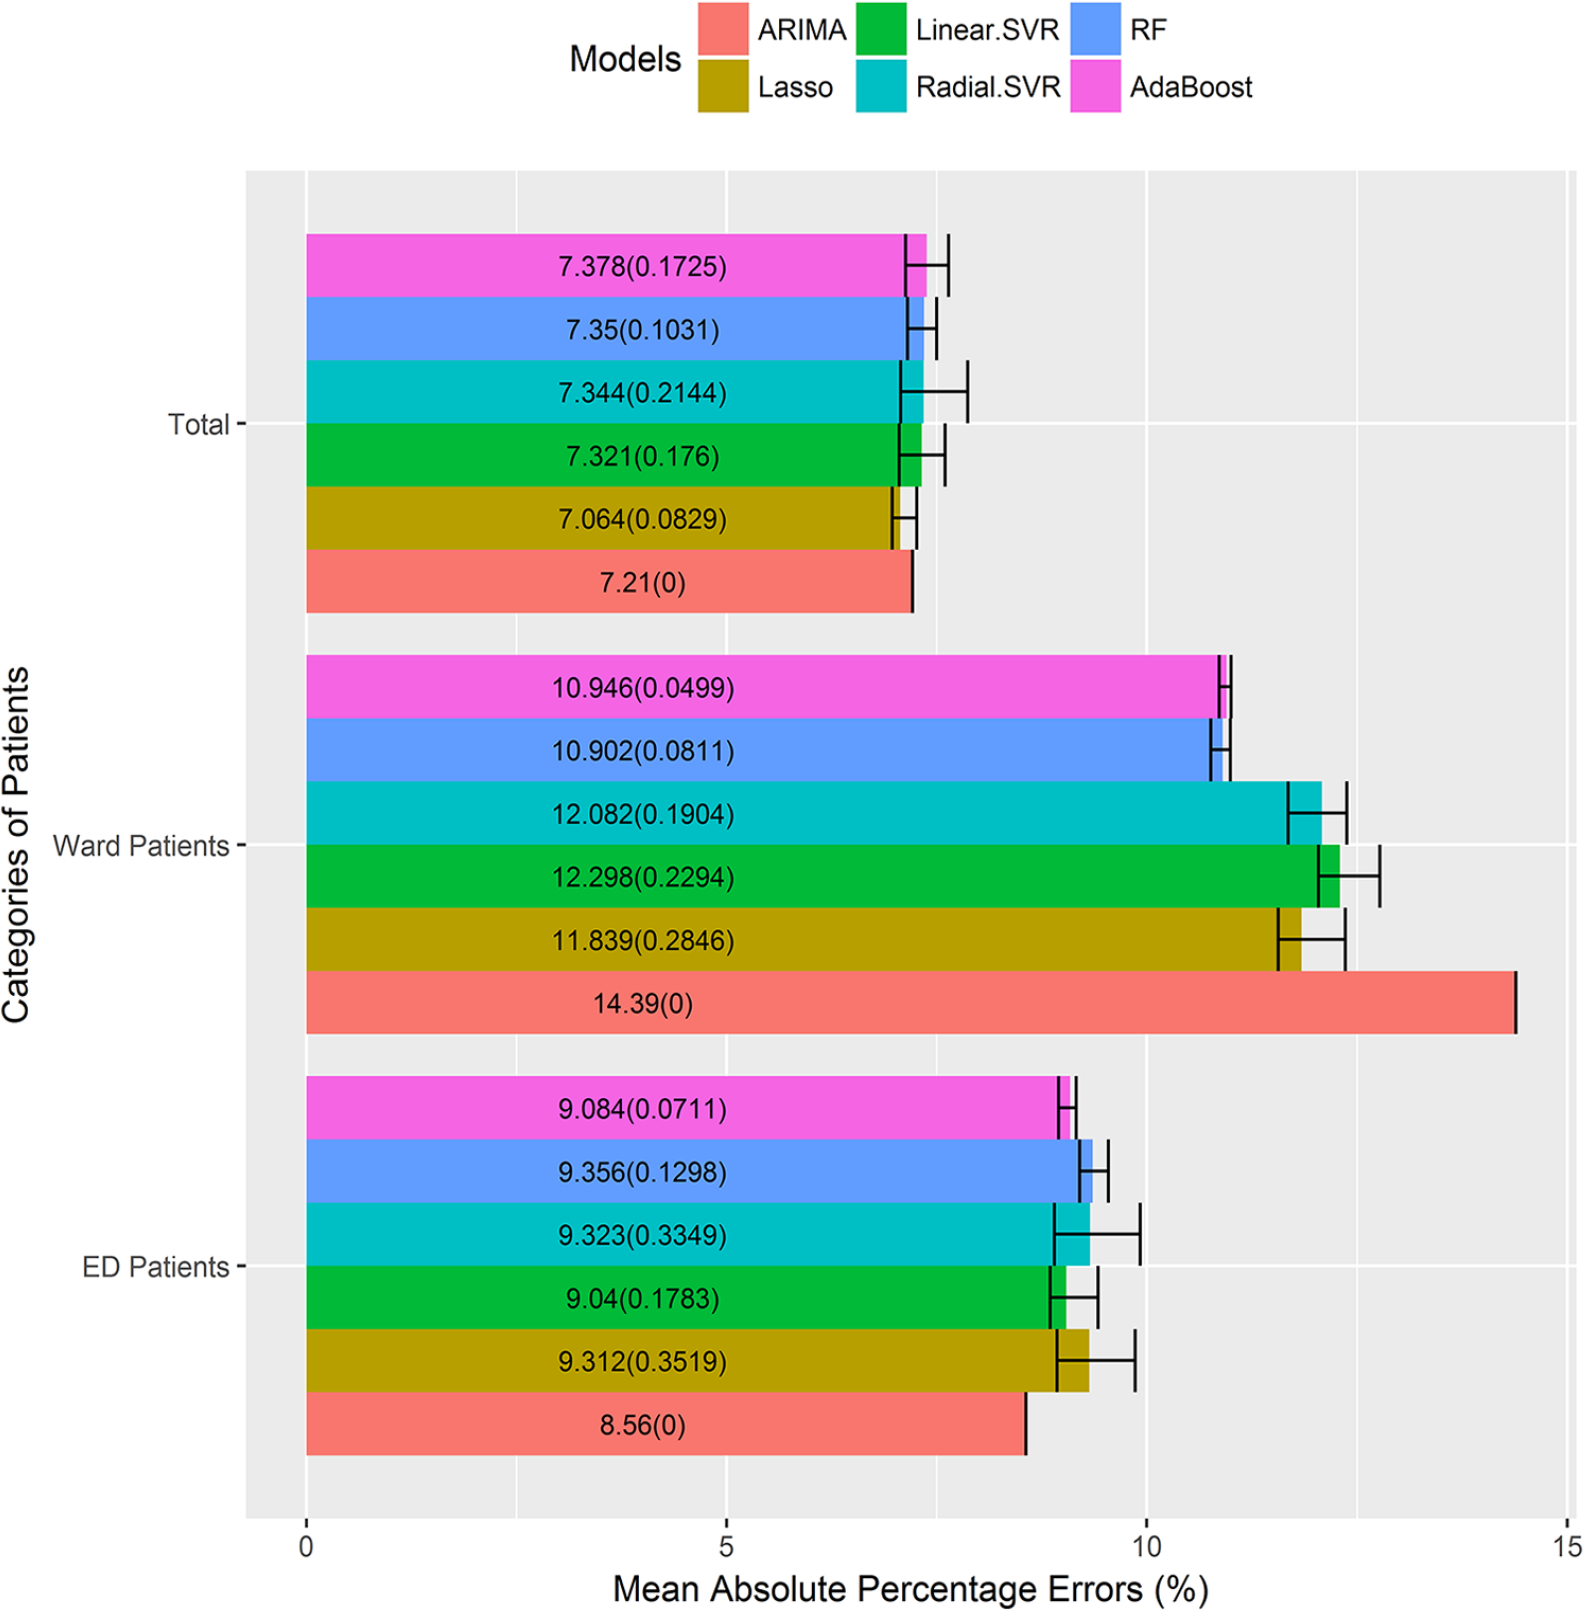
MAPEs of proposed models across patient categories.
p-value of paired sample t-tests of proposed models for ED patients.
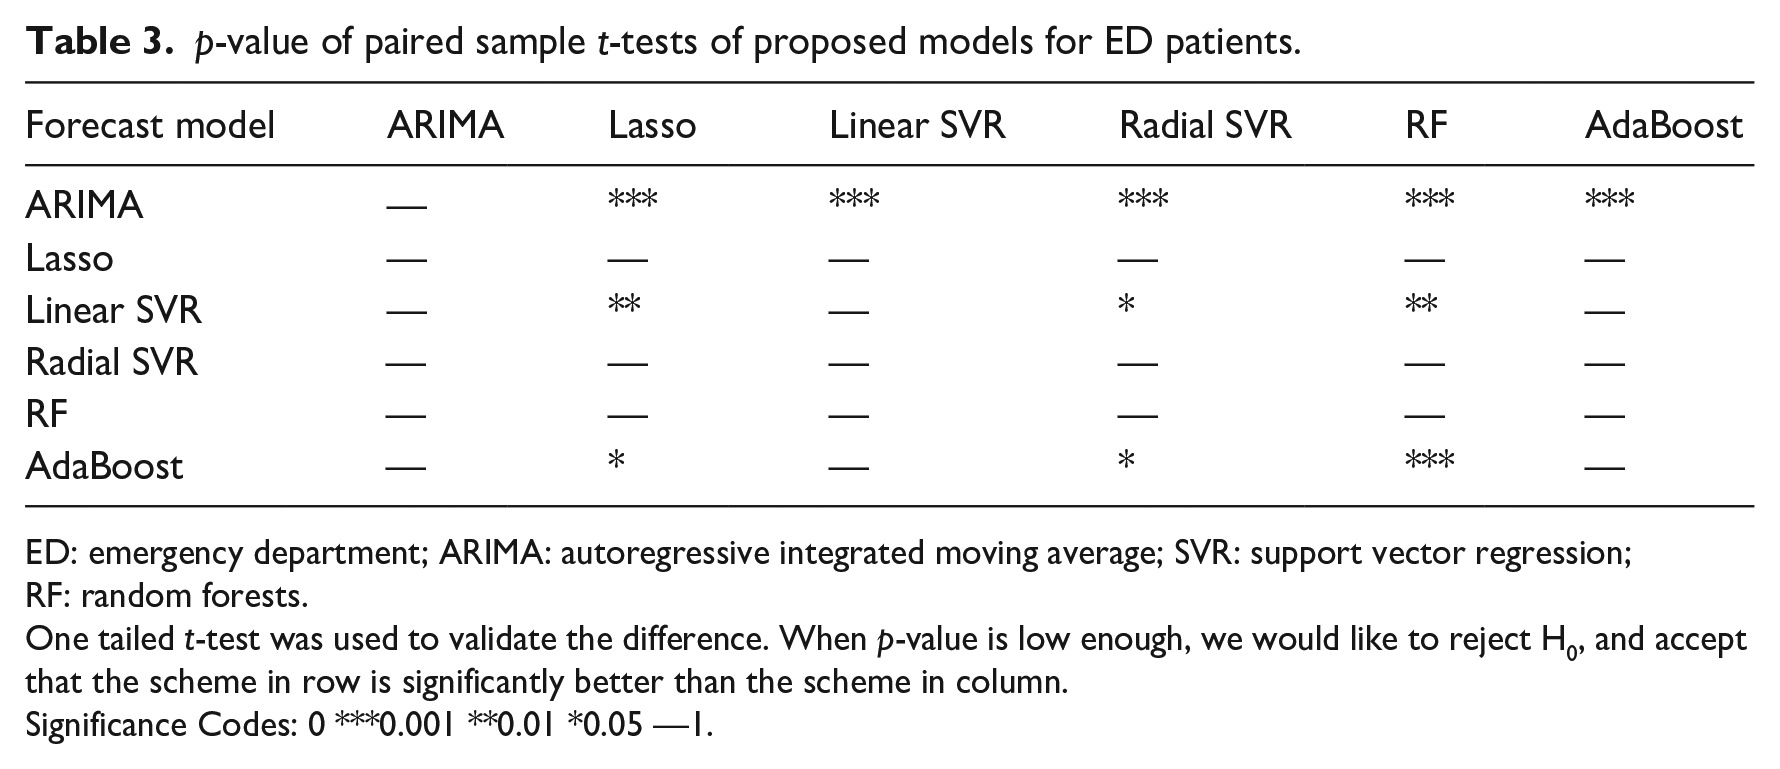
ED: emergency department; ARIMA: autoregressive integrated moving average; SVR: support vector regression; RF: random forests.
One tailed t-test was used to validate the difference. When p-value is low enough, we would like to reject H0, and accept that the scheme in row is significantly better than the scheme in column.
Significance Codes: 0 ***0.001 **0.01 *0.05 —1.
The ED patient visits displayed a strong cyclicity feature over the period of 7 days, as shown in Figure 2. We conducted a 7-step differencing before fitting the ARIMA model. The differenced ED patient visits were fitted as

where
For ward patients, all machine learning models were more stable, for the gap between maximal and minimal MAPEs ranged from 0.14 to 0.80 percent, as summarized in Figure 3. The models generated higher prediction errors, with average MAPE varying from 10.90 to 14.39 percent. The best forecast models were RF and AdaBoost, and they outperformed other models significantly (p < 0.001). On the contrary, ARIMA model produced the worst MAPE (p < 0.001), as shown in Table 4. Table A3 and Table A4 in Supplemental Appendix presented detailed information about the MAPEs of different models and t-test results.
p-value of paired sample t-tests of proposed models for ward patients.
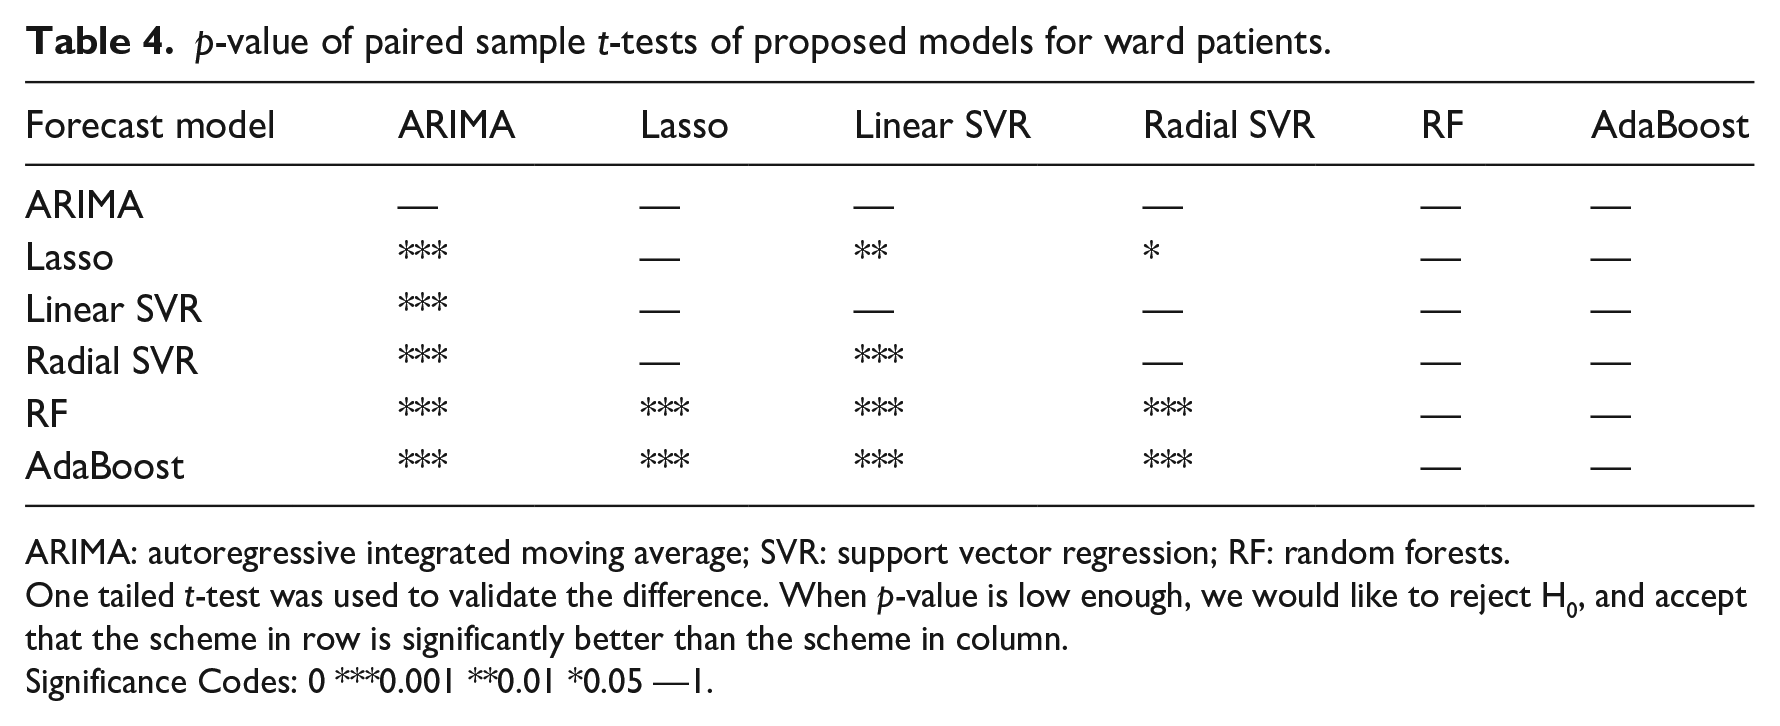
ARIMA: autoregressive integrated moving average; SVR: support vector regression; RF: random forests.
One tailed t-test was used to validate the difference. When p-value is low enough, we would like to reject H0, and accept that the scheme in row is significantly better than the scheme in column.
Significance Codes: 0 ***0.001 **0.01 *0.05 —1.
We explored all variable’s rank of importance in the RF model. The RF model selected important features from unimportant ones by placing the former higher in the regression tree. And Gini importance, which refers to the weighted average Gini index of that feature across all regression trees, is a common way to measure a feature’s importance in RF. We outputted top 10 features in random forest, they were public holiday (no),
For total patient arrivals, the machine learning algorithms realized reliable outputs, with the MAPE gaps ranging from 0.29 to 0.80 percent, as illustrated in Figure 3. In addition, all six models achieved higher accuracy with MAPE varying from 7.06 to 7.38 percent. Concerning the six models, Lasso model was superior to other methods (p < 0.01), followed by ARIMA. The nonlinear models performed the worst. In addition, there were no significant differences between any two of the four models (p > 0.05), as shown in Table 5. The corresponding information about the MAPEs of different models and t-tests results can be found in Table A5 and Table A6 in Supplemental Appendix.
p-value of paired sample t-tests of proposed models for total patients.
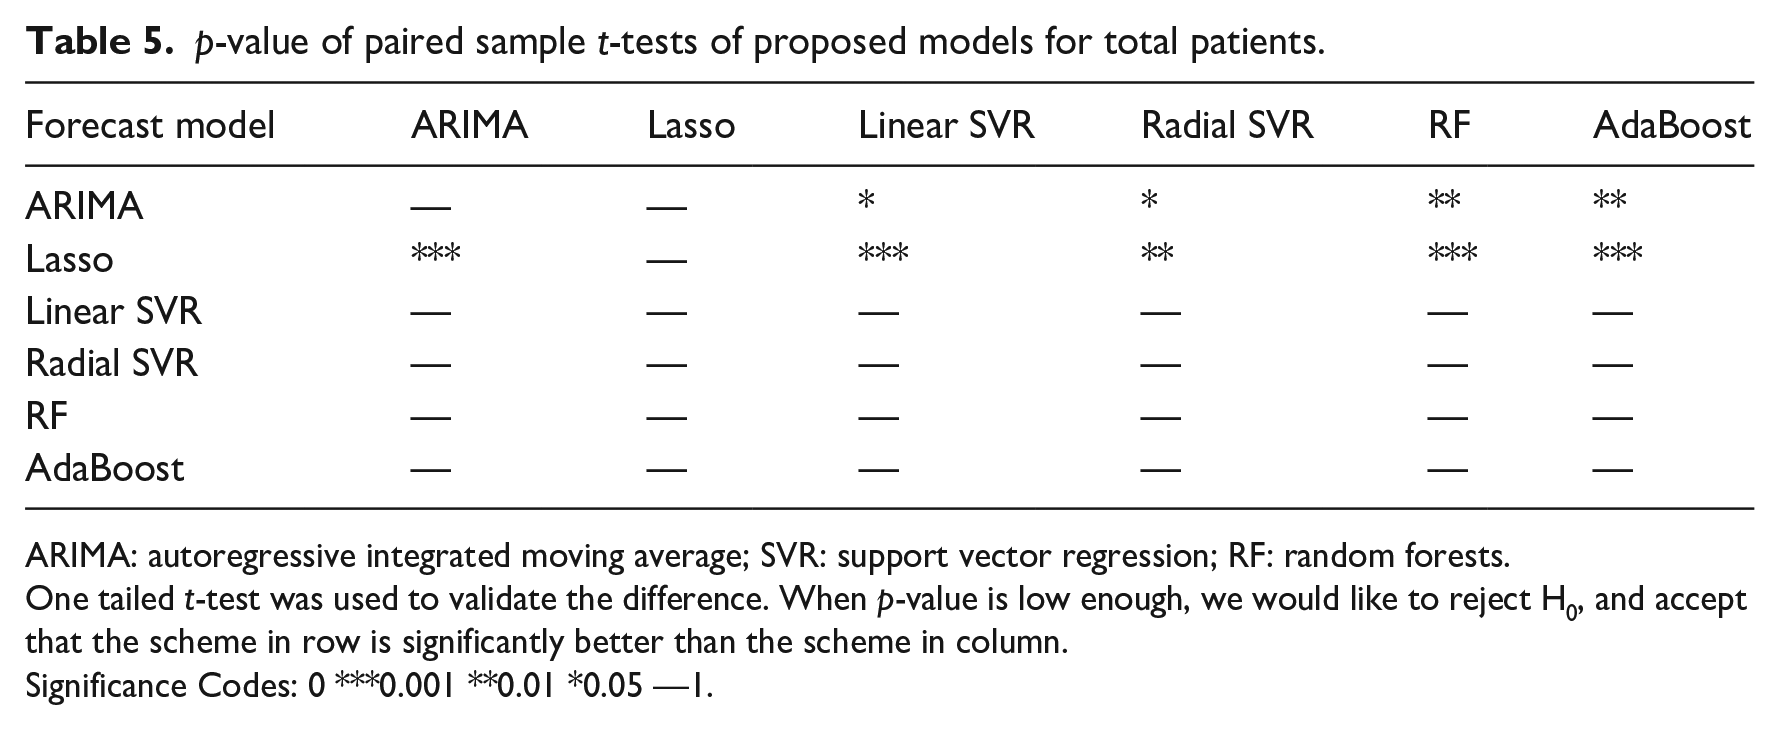
ARIMA: autoregressive integrated moving average; SVR: support vector regression; RF: random forests.
One tailed t-test was used to validate the difference. When p-value is low enough, we would like to reject H0, and accept that the scheme in row is significantly better than the scheme in column.
Significance Codes: 0 ***0.001 **0.01 *0.05 —1.
For total radiology emergency visits, the top 10 important contributing variables in Lasso model were holiday(yes),
Finally, the independent sample t-test was employed to identify statistical differences between the linear and nonlinear models. From Table 6, we can see that the linear model was more effective than the nonlinear model for forecasting ED and total patient visits. On the contrary, the nonlinear model yielded better results than the linear model (p < 0.001) for ward patient arrivals. For details, see Table A7, Table A8, and Table A9 in Supplemental Appendix.
Results of independent sample t-tests of linear and nonlinear models.
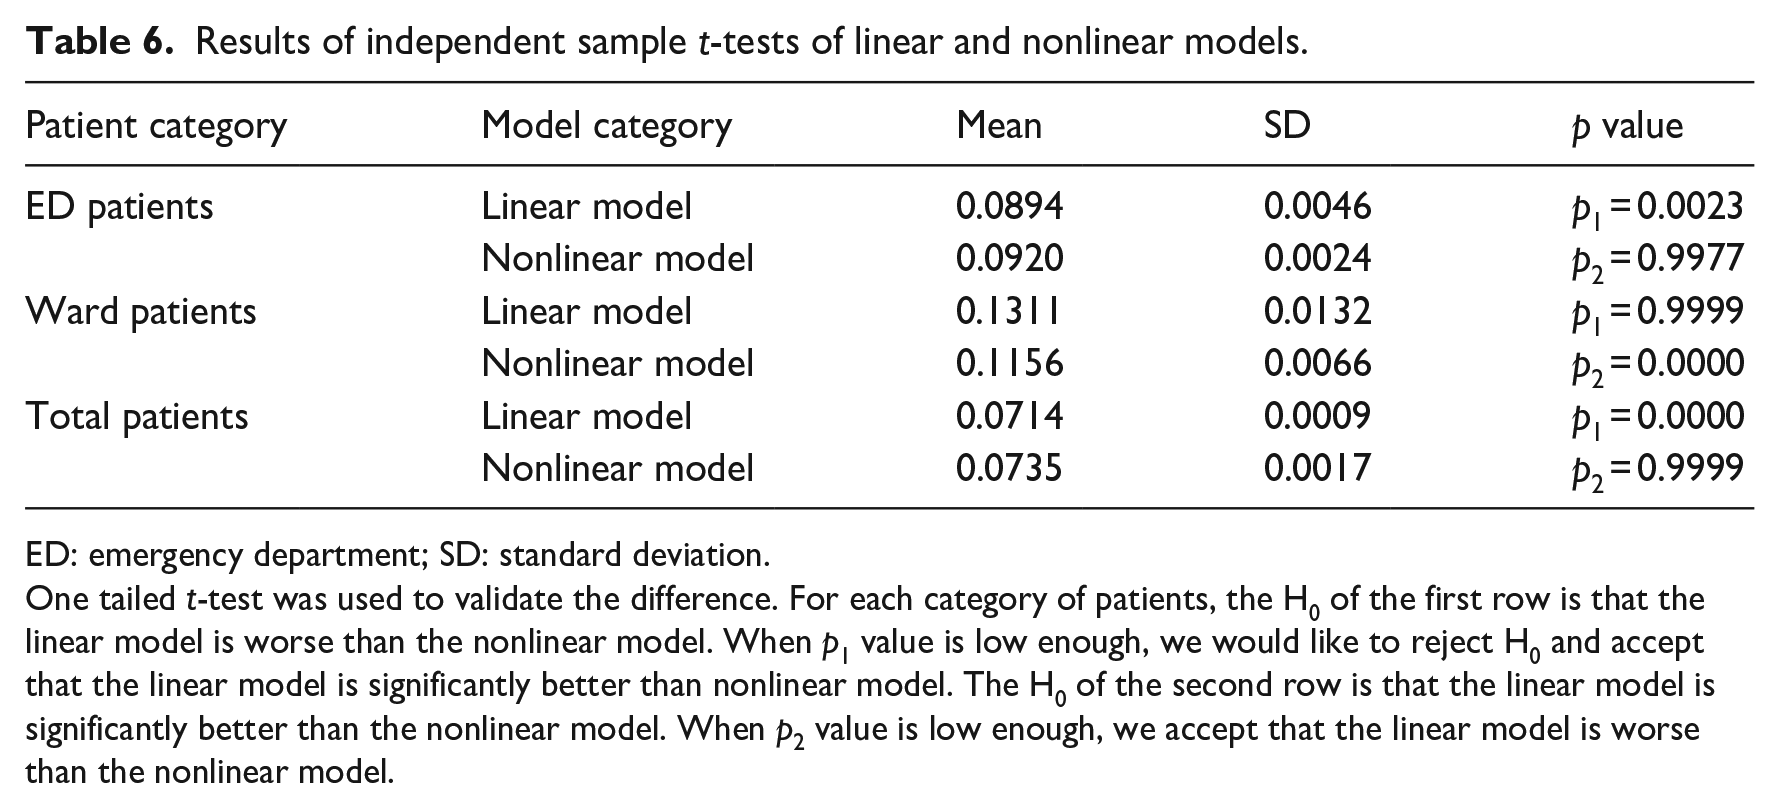
ED: emergency department; SD: standard deviation.
One tailed t-test was used to validate the difference. For each category of patients, the H0 of the first row is that the linear model is worse than the nonlinear model. When p1 value is low enough, we would like to reject H0 and accept that the linear model is significantly better than nonlinear model. The H0 of the second row is that the linear model is significantly better than the nonlinear model. When p2 value is low enough, we accept that the linear model is worse than the nonlinear model.
Discussion
In this study, the best forecast models for ED patients was ARIMA, which belonged to the category of linear model, indicating that the arrival process of ED patients had strong linear pattern. By contrast, RF, a nonlinear model, was superior to other methods when forecasting ward patients, implying that ward patient visits had significant nonlinear trend. In addition, Lasso outperformed other competitors when predicting total visits. Although the arrival process of total visits was a combination of linear and nonlinear processes, it exhibited linear pattern due to the ED patients’ large proportion. Furthermore, above findings may lie in the fact that Lasso was able to extract the linear trend with variable selection,26–29 thus achieving higher forecast accuracy.
Moreover, results implied that the contributing variables were different with respect to patient categories, as stated in section “Introduction.” The lag effects were more influential when forecasting ED patient flow, whereas the inherent trend of ward patient visits was fully exploited by introducing the lag effects and corresponding time factors, especially the holiday information. The total radiology emergency patient flow, as a total of ED and ward patient flows, was far more complicated, and influenced by both the lag effects and corresponding time factors. Above findings highlighted that the influencing factors may vary for different time series, which was in line with the research of Xu et al. 21 A distinguished feature of our study was that we incorporated a wide range of lagged visits, whereas they did not model the autocorrelation of patient arrivals.
In general, total forecast yielded higher prediction accuracy compared with those of categorized forecasts, as demonstrated in section “Introduction.” When combining different time series, the total forecast errors may decrease due to the mix effects. Similar results were obtained by previous studies.10,12 Sun et al. 10 classified patients into three acuity categories, and the patient visits of each category and total numbers were predicted by the ARIMA model. The MAPEs were 16.8, 6.7, 8.6, and 4.8 percent for P1, P2, P3, and total visits, respectively. Ekström et al. 12 conducted a regression analysis to forecast the daily ED visits in Stockholm County. The MAPEs ranged from 5.2 to 13.1 percent for seven individual hospitals and 4.8 percent for total county.
We also made comparisons with related studies of daily patient visits forecasting, as shown in Table A10 in Supplemental Appendix:
When compared with studies of outpatient visits 13 and discharged inpatients 15 forecasting, our research achieved better forecast accuracy, as the evaluation period in our study was much longer and included a range of dates (summer and winter) rather than 2-month or 6-month evaluation at the same time of year.
When compared with studies of daily ED visits, our study realized lower forecast errors than results of those studies,11,16 for the corresponding time factors were fully extracted. Other studies outperformed ours because they introduced more independent variables, such as Internet data 12 or climatic variables. 10
This research only focuses on forecasting daily radiology emergency patient visits, and we do not consider hourly forecasting problem, which is a limitation of this study. Although daily forecasting is essential to aid scientific planning of staff rosters and resource allocation for the hospital, the issue of hourly forecasting is more valuable to provide guidance on real-time scheduling decisions, which would consequently reduce patient waiting times. In addition, this study does not select artificial neural network (ANN) from the category of nonlinear models, which is another limitation of this research. Thus, two promising research directions for further studies include (1) predicting hourly radiology emergency patient flow and (2) establishing an ANN model to forecast the daily radiology emergency visits.
Conclusion
In summary, this study validated the effectiveness of proposed multi-model approach in forecasting daily radiology emergency patient flow. For ED, ward, and total patient visits, the best-performing methods were ARIMA, RF, and Lasso, respectively. Furthermore, different patient arrival patterns have different linear and nonlinear trends, as well as contributing variables. Above findings will benefit hospital managers in supporting efficient patient flow management and optimizing scheduling decisions, thus increasing patient satisfaction and enhancing service quality.
Supplemental Material
Appendix – Supplemental material for Emergency patient flow forecasting in the radiology department
Supplemental material, Appendix for Emergency patient flow forecasting in the radiology department by Yumeng Zhang, Li Luo, Fengyi Zhang, Ruixiao Kong, Jianchao Yang, Yabing Feng and Huili Guo in Health Informatics Journal
Footnotes
Declaration of conflicting interests
The author(s) declared no potential conflicts of interest with respect to the research, authorship, and/or publication of this article.
Ethical approval
This study does not involve human subjects and adheres to all current laws of China.
Funding
The author(s) disclosed receipt of the following financial support for the research, authorship, and/or publication of this article: This work was supported by the National Natural Science Foundation of China (Grant Nos 71532007, 71131006, 71874116, and 71904138).
Supplemental material
Supplemental material for this article is available online.
References
Supplementary Material
Please find the following supplemental material available below.
For Open Access articles published under a Creative Commons License, all supplemental material carries the same license as the article it is associated with.
For non-Open Access articles published, all supplemental material carries a non-exclusive license, and permission requests for re-use of supplemental material or any part of supplemental material shall be sent directly to the copyright owner as specified in the copyright notice associated with the article.