
Abstract
Postoperative complications place a major burden on the healthcare systems. The type of hospital’s ownership could be one factor associated with this adverse outcome. Using CMS’s publicly available “Complications and Deaths—Hospitals” and “Hospital General Information” datasets, we analyzed the association between four postoperative complications (venous thromboembolism, joint replacement complications, wound dehiscence, postoperative sepsis) and hospital ownership. These data were collected by Medicare between April 2013 and March 2016. We found a significant association (p = 0.029) between ownership types and the postoperative complication score. A 6-percent drop in the share of not-for-profit ownership, accompanied by a 3-percent increase in each of the government and for-profit ownership, resulted in a 20-percent drop in postoperative complication scores (from 5.75 to 4.6). There is an association between hospital ownership type and postoperative complications. Creating this awareness in leadership should prompt for redesigning of hospitals’ operations and workflows to become more compatible with safe and effective care delivery.
Keywords
Introduction
Multiple studies have assessed the non-clinical factors of hospitals such as ownership and its impact on the process of care delivery and outcome.1–3 There are three major categories of US hospital ownership: for-profit (FP), not-for-profit (NFP), and government-owned hospitals (GH). According to the American Hospital Association’s 2018 survey, there were 1035 FP, 2849 NFP, and 1165 GH (209 federal and 956 state and local government). 4 FP hospitals mainly differ from NFP hospitals in their fiscal obligations; they have to achieve profits to pay taxes and meet their shareholders expectations, whereas NFP hospitals are usually exempt from paying federal and state income taxes, provided they care for a higher proportion of unfunded patients. For instance, given the inherent difference in their financial structure, tax code, and profit motives, the odds of a woman having a cesarean were two times higher in FP hospitals than in NFP hospitals. 5
One facet of care delivery and outcomes that could be associated with hospital ownership is postoperative complications (POC). POCs place a major burden on the healthcare system from the pain, suffering, and delayed recovery to the additional financial costs borne by patients, third-party payers, and healthcare facilities.
The University of Michigan Health System did an observational study on the POC rate and cost between 2008 and 2015. The POC rate was 14.5 percent, and the mean hospital cost for patients with complications was US$19,626.00 higher (average cost of US$36,060.00 per case with POCs compared to US$16,434.00 per case without POCs). 6
A Veterans Affair (VA) study in 2010, which included surgeries performed in 129 VA hospitals, showed that if the highest 10th percentile (the hospitals with the highest rates of POCs) reduced their surgical site infection (SSI) rates to the rates of the hospitals in the 50th percentile, the VA would save US$6.7 million per year. 7
Two notable interventions aimed at reducing POC are the following:
The Veterans Affairs Surgical Quality Improvement Program (VASQIP) was started in the 1990s as a registry for data on surgeries performed within the VA. The primary purpose of the registry is to improve the quality of care for veterans undergoing surgery by providing information to care provider teams for self-assessment and quality improvement purposes. 8
The World Health Organization (WHO) surgical safety checklist (SSC) was introduced in 2008; it divided the surgical workflow into three phases: pre-anesthesia (“sign-in”), before skin incision (“time-out”), and before the patient leaves the operating room (“sign-out”). The surgical team completes the checklist in each phase before proceeding to the next step. 9
Analysis of the South Carolina’s inpatient surgery discharge claims between 2008 and 2013 showed a 22-percent drop in risk-adjusted 30-day postoperative mortality in favor of hospitals that used SSC compared to hospitals that did not. 10 However, another study from an academic teaching center in Vermont showed that the SSC did not result in a significant decrease in perioperative morbidity or mortality but did improve the perception of safety culture by the operating room staff. 11
With the recent implementation of strict healthcare policies that financially penalize adverse postoperative outcomes such as the value-based program to reduce hospital-acquired conditions, 12 a plethora of studies have evaluated whether hospitals’ organizational factors have an impact on POC metrics such as medical complications, cost of care, readmission rate, and even patients’ satisfaction.
Several research articles demonstrated a relationship between physician-owned hospitals and practice patterns where profitable and higher rates of procedures are performed when compared to non-physician-owned hospitals.13–15 However, the evidence is less apparent when researchers attempt to find an association between outcome of care and ownership.
Searching literature for studies on the potential association between hospital ownership and quality of care in general and POC in particular returned mixed results with no solid evidence favoring one ownership over the other. Publications ranged from the ones showing lower costs, higher patient satisfaction, and fewer POCs in physician-owned hospitals 16 to ones showing higher readmission rates for post knee and hip replacements in NFP hospitals.17,18 While others showed higher cost of care with no difference in POCs in FP hospitals when compared to NFP hospitals, 19 several studies remained overall inconclusive.2,20,21
In this observational study, we identified a statistically significant association between hospital ownership and POCs. Such an association would add to the growing body of evidence that non-clinical factors such as hospital ownership could affect the quality of care delivery.
Methods
Data preparation
Using the Medicare public dataset “Complications and Deaths—Hospital,” 22 we analyzed the association between POCs and the three categories of hospital ownership. We used the POC score metric to conduct our analysis. It is a risk-adjusted metric established by Medicare derived from a denominator that represents the population at risk and a numerator that represents the rate of patients who had the complication. The data were collected for the period of April 2013 to March 2016.
The dataset contained 17 types complications with their numerical scores for 4812 hospitals. We were interested in the 7 categories of POCs since the remaining 10 were non-surgical complications:
“A wound that splits open after surgery on the abdomen or pelvis,” classified as wound dehiscence.
“Blood stream infection after surgery,” classified as postoperative sepsis.
“Deaths among patients with serious treatable complications after surgery.”
“Rate of complications for hip/knee replacement patients,” classified as joint replacement complications.
“Broken hip from a fall after surgery.”
“Serious blood clots after surgery” classified as postoperative venous thromboembolism (VTE).
“Death rate for coronary artery bypass grafting (CABG),” classified as CABG mortality.
We excluded POC types of “CABG mortality” because 3778 hospitals did not have a score for this surgery and “deaths among patients with serious treatable complications after surgery” because the definition was ambiguous and it was not clear what defined a serious complication and what made it reversible.
All the POCs had slightly right-skewed distributions, except for “broken hip from a fall after surgery” which was a uniform distribution; therefore, we did not include it in the analysis as well. For the remaining four categories of 2043 complete records of “wound dehiscence,” “postoperative sepsis,” “joint replacement complications,” and “postoperative VTE,” we removed the top one percentile, given the distribution’s slight right-skewness, which accounted to 21 records (see Table 1).
Breakdown of the complications removed and selected for our study.
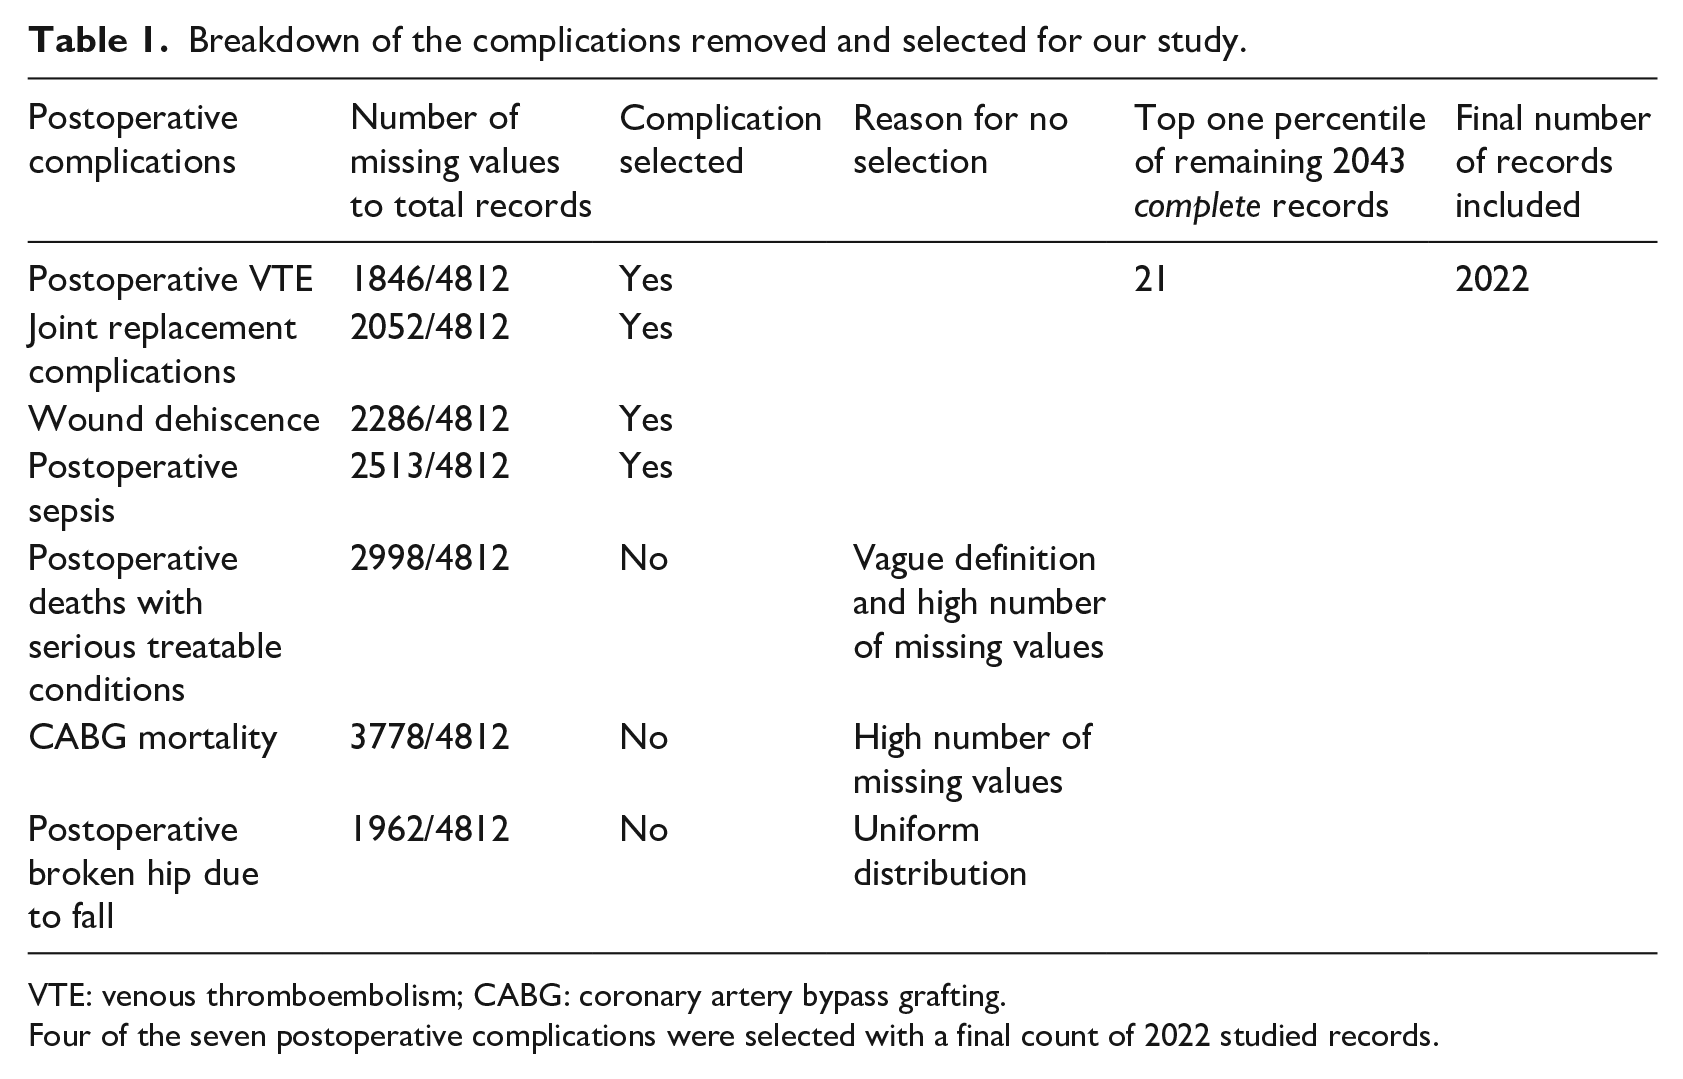
VTE: venous thromboembolism; CABG: coronary artery bypass grafting.
Four of the seven postoperative complications were selected with a final count of 2022 studied records.
The final dataset was 2022 hospitals with the aforementioned four POCs.
Another dataset “Hospital General Information” 23 was used for validation. The purpose was to explore the possibility of an association between mortality and type of ownership to validate the findings in “Complications and Deaths—Hospital.”
Those were the different types of ownership:
“Government—Federal,” “Government—Hospital District or Authority,” “Government—Local,” “Government—State,” and “Tribal” were all grouped as GH.
“Physician” and “Proprietary” were grouped as FP.
“Voluntary non-profit—Church,” “Voluntary non-profit—Other,” and “Voluntary non-profit—Private” were all grouped as NFP.
The “mortality” field contained the following values:
“Above the national average.”
“Below the national average.”
“Same as the national average.”
“Not available.”
The original dataset also contained 4812 records, each corresponding to one unique hospital. The total number of hospitals was also 4812, and after excluding records where the “mortality” field was “not available,” we were left with 3444 hospitals to use for our analysis.
Algorithm
We used K-means clustering algorithm (a method of unsupervised machine learning) from the scikit-learn library in the Python programming language on Windows 10 operating system. Unsupervised machine learning separates a set of observations based on a number of features into several groups where the members of each group are as similar as possible when it comes to those particular features. In our study, we separated the hospitals in “Complications and Deaths—Hospital,” based on their four POC scores only, into three different clusters. One cluster would be expected to stand out from the rest by having an overall low POC score. Afterwards, the goal would be to identify what other characteristics (other than the four POC scores) made that cluster stand out from the rest.
We implemented K-means clustering algorithm on the four selected features from Table 1, to group the hospitals into three clusters with the findings illustrated in this bar chart (see Figure 1). It generated blue, red, and green clusters of 1132, 388, and 502 hospitals, respectively.
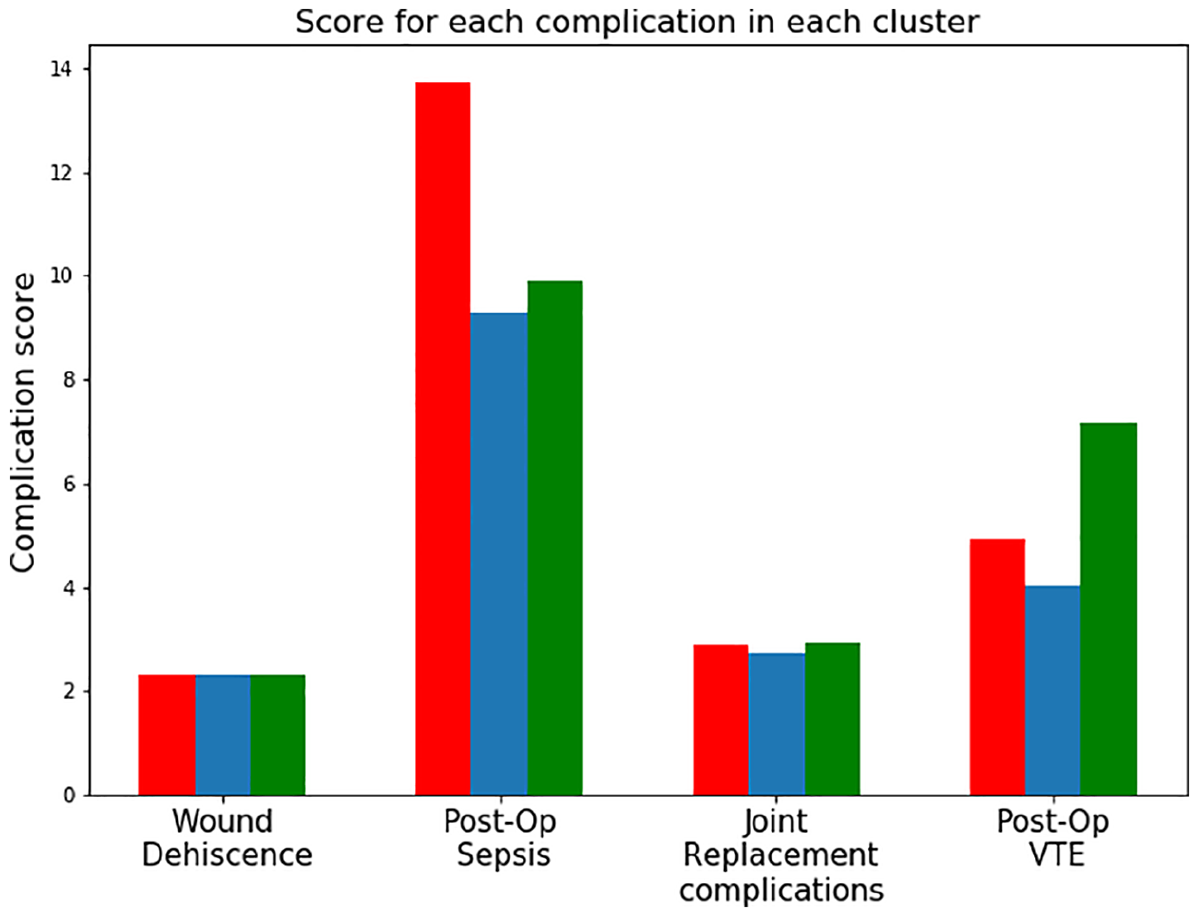
The group of hospitals in blue formed the good cluster because they overall scored the lowest. The two clusters of hospitals in green and red scored worse than the blue one and were referred to as the bad cluster.
The type of ownership for each of the hospitals in the clusters above was identified from the “Hospital General Information” dataset using the “Provider ID” in both datasets as a primary key for record matching.
Results and validation
The good blue cluster (with the lowest POC score) visually performed better than the bad red and green clusters (see Figure 1). The mean POC score for the good cluster (blue) was 5.75, whereas the mean POC score for the other two bad clusters (red and green) was 4.6. The resulting contingency table (see Table 2) demonstrated two variables (“cluster performance” on POC and “type of ownership”) with their respective observed and expected values. The chi-squared test for independency of variables returned a chi statistic of 7.01 and a p value of 0.029. That meant those two variables were dependent with a confidence of 97 percent. We could, therefore, conclude that NFP hospitals were more prevalent in the two clusters with higher complications score, whereas FP and GH were more prevalent in the good cluster with the lowest complication score.
This contingency table showed the relationship between two variables: the cluster quality and the ownership.
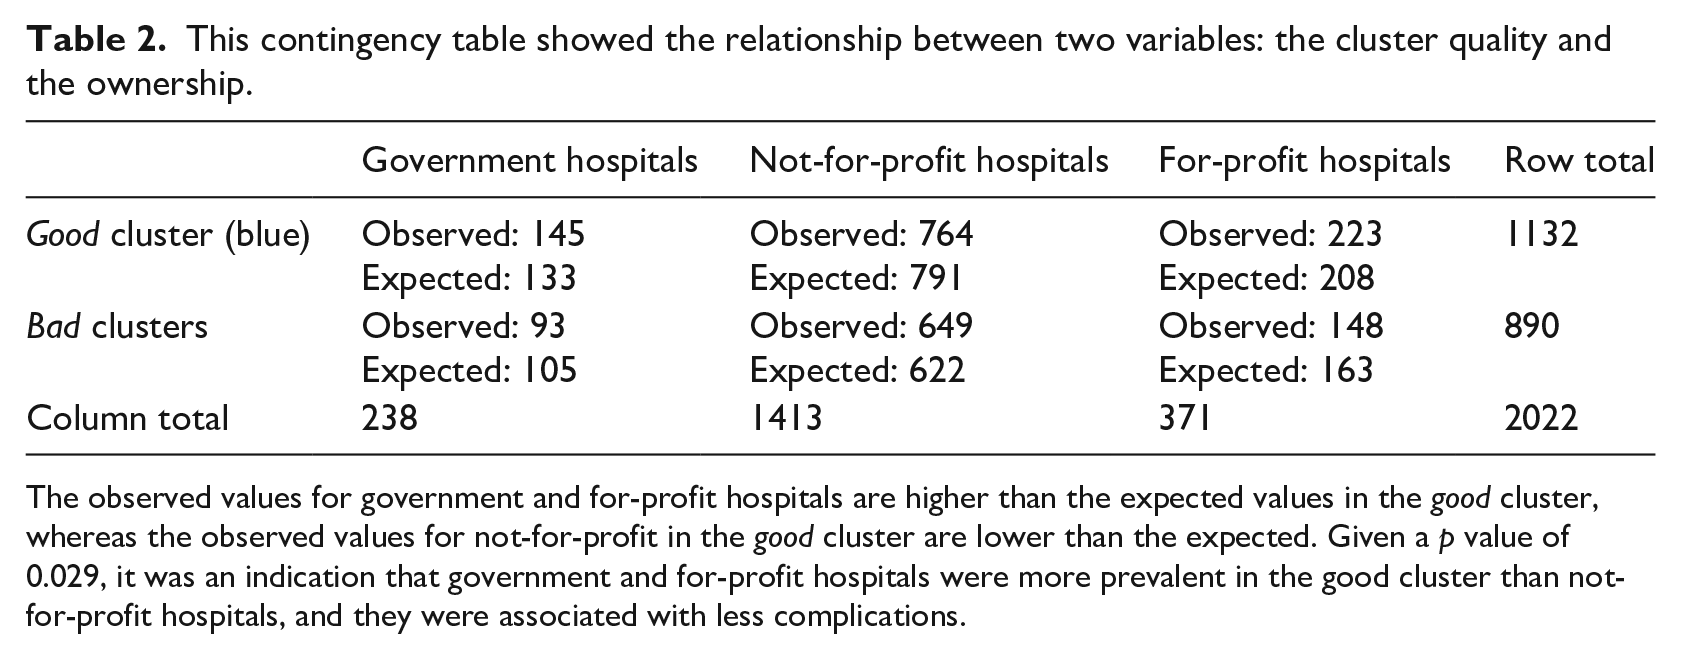
The observed values for government and for-profit hospitals are higher than the expected values in the good cluster, whereas the observed values for not-for-profit in the good cluster are lower than the expected. Given a p value of 0.029, it was an indication that government and for-profit hospitals were more prevalent in the good cluster than not-for-profit hospitals, and they were associated with less complications.
This visualization (see Figure 2) summarized the findings reached above, where a small change in the ownership share was matched by a substantial drop in the complication score. A 6-percent drop in the NFP ownership, accompanied by a 3-percent increase in each of the GH and FP ownership, has resulted in a 20-percent drop in POC scores (from 5.75 to 4.6).
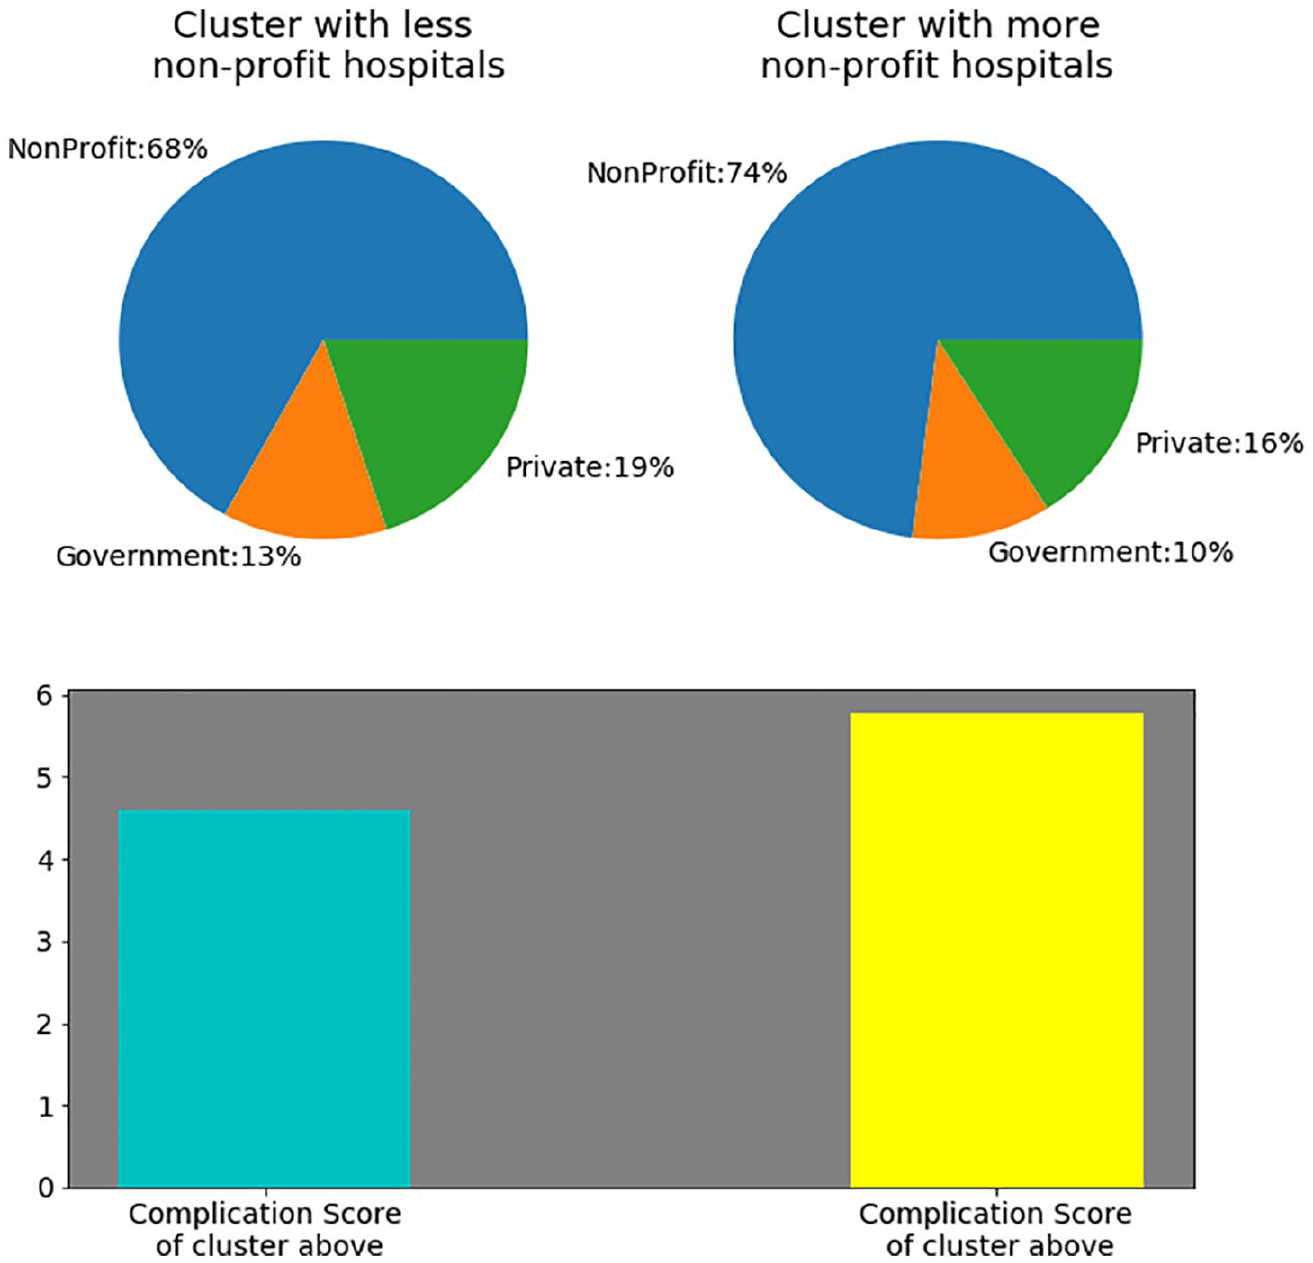
This figure showed that a drop in the share of not-for-profit hospitals by 6 percent, accompanied by a rise of government and for-profit (private) share by 3 percent each, was associated with a reduction in postoperative complication score by 20 percent.
It is noteworthy to say that the path to find an association between POCs and “hospital ownership” was not premeditated and straightforward. We attempted to explore potential associations between cluster performance and several other variables such as “meets criteria for meaningful use of EHRs” from the “Hospital General Information” and variables such as the presence or absence of a “general surgery registry” and the use or non-use of a “safe surgery checklist use (inpatient),” both from the Medicare public dataset “Structural Measures Hospital.” However, the only statistically significant association was with “hospital ownership.”
To validate the results, we constructed the contingency table of the second dataset (“Hospital General Information” downloaded at the same time as “Complications and Deaths—Hospital” in September 2017), using the two variables hospital ownership and mortality (see Table 3). The analysis returned a chi statistic of 46.42 and a p value of 2.006868*10−9 (significantly less than 1 percent), indicating a high likelihood of association between the two variables mortality and hospital ownership. Therefore, we concluded that NFP ownership was associated with a higher mortality when compared to FP and GH, in line with our earlier findings of lower POCs in FP and GH compared to NFP.
This table showed the relationship between two variables: ownership and mortality.
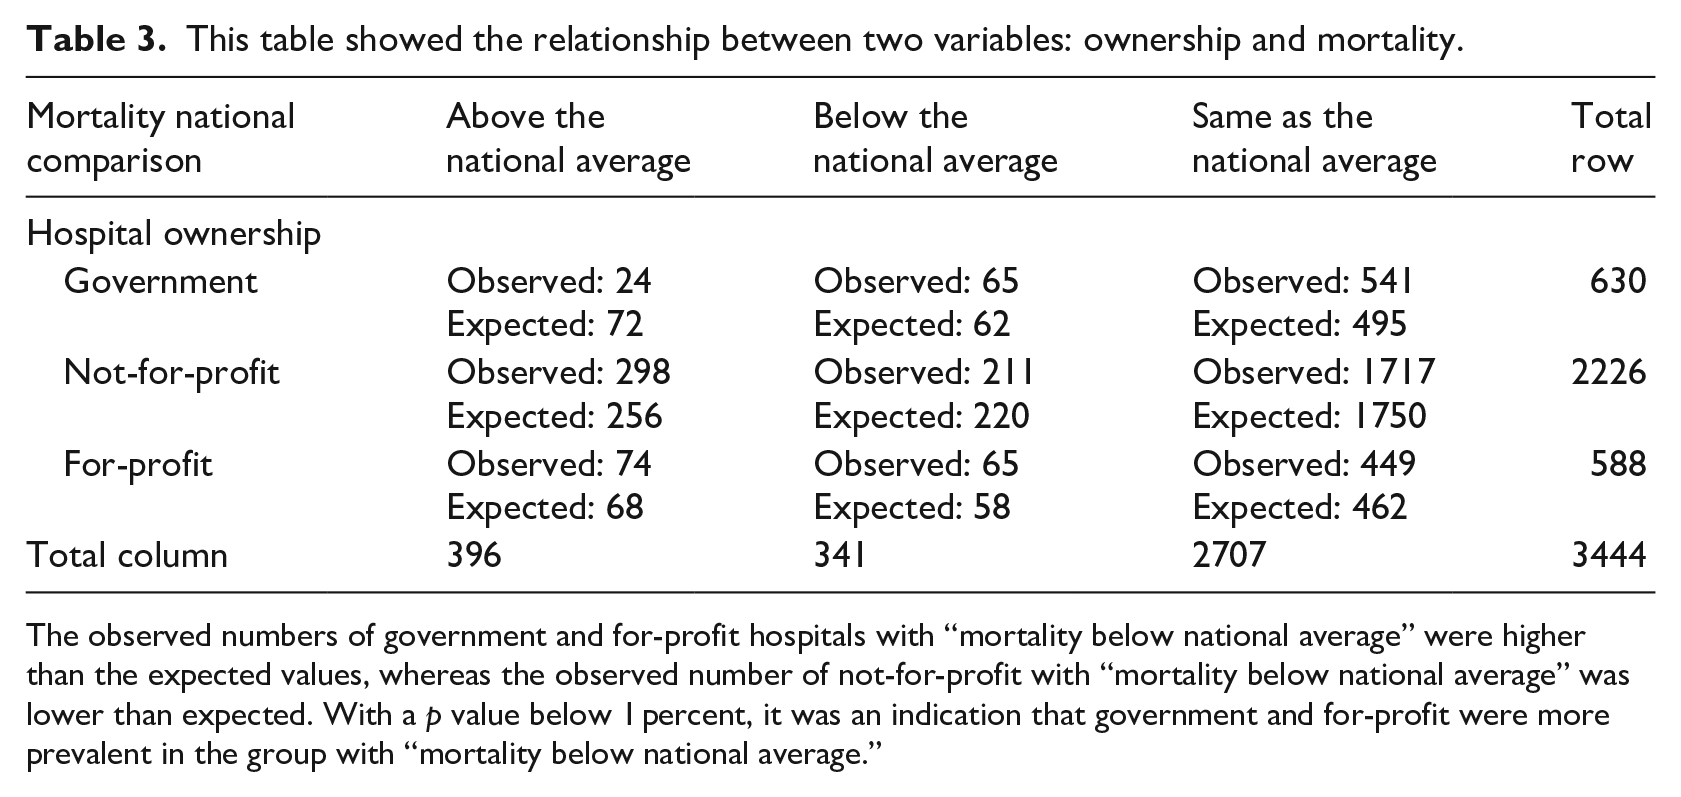
The observed numbers of government and for-profit hospitals with “mortality below national average” were higher than the expected values, whereas the observed number of not-for-profit with “mortality below national average” was lower than expected. With a p value below 1 percent, it was an indication that government and for-profit were more prevalent in the group with “mortality below national average.”
Discussion
The purpose of this study was to leverage a special method of unsupervised machine learning, K-means, to break down the hospitals into several groups, irrespective and without any prior knowledge of their ownership status such as GH, FP, or NFP (and irrespective of any other characteristic/feature other than the four POC scores). Then, we explored, within the limitations of the available data, what characterized the group of hospitals that performed well. We demonstrated a statistically significant association between the group with a slightly larger share of FP and GH on one side and decreased POC on the other side. On the other hand, the group with a larger share of NFP had a 20-percent higher POC score. One might speculate that a majority of NFP hospitals are located in unprivileged locations and are serving demographics of low-income patients who lack adequate insurance coverage. Therefore, patients tend to be sicker and hospitals may not have on board all the right specialists needed to perform certain procedures. However, a study found no difference in the amount of uncompensated care delivered at NFP compared to FP for the three conditions of heart attacks, coronary bypass, and childbirth. 24 Also, conversion from an NFP to an FP status led to improvement in financial margins without affecting quality of care or the proportion of poor or minority patients receiving care. 25 Government hospitals like the VA are usually staffed with all the specialists needed, and their patients have VA benefits and access to outpatient medical care. The VA, after the implementation of the VASQIP, has seen a decrease in mortality of 47 percent and a decrease in morbidity of 43 percent of their patients in the first 30 days after an operation. 26
Our study was observational with the inherent limitations associated with this approach; the validation dataset used mortality as a proxy for hospitals’ performance in POC. One better validation method of our findings would be to compare POC scores in hospitals of similar characteristics (by adjusting for bed-size, location such as urban or rural, teaching, non-teaching, and so on) but that differ on the basis of ownership. Such method provides an apple-to-apple comparison with more conclusive and generalizable results. Also, further in-depth analysis of certain categories of complications could uncover more pronounced differences between hospitals, as the reader could infer from Figure 1 where the intergroup difference in POC was wider when it came to postoperative sepsis and VTE. In addition, studies are needed to go beyond just ownership and evaluate factors that range from demographics, size, location and academic affiliations to discrepancy in the availability of surgical subspecialties since evaluating care based on ownership alone has yielded mixed results.
POCs remain a major determinant of quality and safety in healthcare. Accounting for all factors that affect POCs is a complicated task, and in this article, we demonstrated that hospital ownership was one of those factors to be considered.
Footnotes
Declaration of conflicting interests
The author(s) declared no potential conflicts of interest with respect to the research, authorship, and/or publication of this article.
Funding
The author(s) received no financial support for the research, authorship, and/or publication of this article.