
Abstract
The purpose of this qualitative study was to identify differences in the utilisation of an electronic medical record test–result management system between two acute care departments. Field observations (130 min) and semi-structured interviews (n = 24) were conducted in the Intensive Care Unit and Emergency Department of an Australian hospital. Work processes identified from audio transcripts were modelled using business process modelling. Comparison of the Emergency Department and Intensive Care Unit identified the following: (1) test ordering variations according to clinical roles, (2) differences in the use of electronic medical record functionality according to specific demands of the clinical environment and (3) the non-linear components of the test–result management process. Variations were identified in the number of process decisions, external collaborations and temporal process workflows. Modelling the business processes, collaboration and communication needs of individual clinical environments can aid in enhancing the quality and appositeness of health information technology interventions and thus contribute to improving patient safety. Future health information technology interventions/evaluations aimed at improving the safety of test–result management processes need to address both the nuances of the clinical environment and accommodate the individual work practices of clinicians within that environment.
Keywords
Introduction
Clinicians require efficient systems for the management and follow-up of test results (laboratory and medical imaging) to make timely and informed decisions. A plethora of Health Information Technology (HIT) systems have been introduced worldwide to assist both clinicians and patients in managing health-related data and information. Predominant HIT systems include electronic medical records (EMRs) which store health information from a patient’s encounter within a specific organisation, electronic health records (EHRs) which include selected health information from care episodes across organisations1,2 and Health Information Exchange (HIE) which broadly includes electronic information exchange across organisations and between systems. 3 A review of EHR and HIE implementations across a number of countries has reported various level of success (or otherwise) in their adoption. 4 Furthermore, personal health records (PHRs) are emerging to provide patients with access to their personal health information including test results. 2
HIT offers opportunities for the development and application of algorithms and electronic triggers to improve patient and diagnostic safety.5,6 HIT applications including EMRs, EHRs, HIEs, electronic results acknowledgement (eRA) and computerised provider order entry (CPOE) systems, have the potential to improve test–result management by supporting standardised ordering, improved test–result access and monitoring functionality. While the impact of HIT on test–result management practices in Emergency Department (ED) settings has been studied,7–9 the effect of HIT specifically on Intensive Care Unit (ICU) test–result management has not yet been examined, with ICU studies predominantly assessing the impact of CPOE on clinicians or medication management.10,11 Despite the availability of sophisticated computerised systems, missed test–results and inadequate test–result follow-up continue to impact patient safety and quality of care.6,12–16 In 2017, the US ECRI Institute identified ‘Test–result Reporting and Follow-Up’ as a top 10 patient safety concern. 17 The extent of the problem varies across clinical settings and according to the nature of the test–result.12,18
While the underlying reasons for inadequate test–result management may be many and varied,19,20 the intricate specificities of a clinical work environment have the potential to impact directly on test–result management activities. The importance of understanding contextual aspects in HIT interventions 21 has been the focus of studies investigating socio-technical factors that impact on test–result follow-up.14,20 Leu et al. 22 used process diagrams to document the clinical context for HIT and highlighted the need for ‘understanding the full clinical context . . . to the level of tasks, resources, and workflows’ as imperative to the efficacious implementation of HIT (p. 372). The ‘One Size Fits All’ Fallacy viewpoint of Karsh et al. 23 has highlighted the ‘tremendous differences in the HIT needs of different clinical roles (nurse vs physician), clinical situations (acute vs chronic care), clinical environments . . . and institutions’ (pp. 619–620) and recognises the need for HIT to support both the needs of individual users as well as the collaborative needs of the healthcare team within and across clinical environments. Similarly, after studying ED workflows during transition from paper medical records to an EMR, Park et al. 24 identified the need for EMR systems to support both the collaborative needs, and roles and responsibilities of different medical staff, in charting patient notes. There is an increasing need to support collaboration within healthcare teams as test–result management responsibilities extend beyond the role of physicians alone. In many countries advanced practice providers, for example, nurse practitioners and physician assistants, have the ability to order and interpret diagnostic test results autonomously or under supervision as per their scope of practice.25–29
HIT supported test–results management interventions (including test results pending at patient discharge) have been widely studied7,13,19,30–36 both across19,35,36 and within facilities/institutions,7,13,30 however, literature examining the end-to-end workflow processes of HIT users involved in test–results management is scarce. Murphy et al. 37 used process mapping to document the total testing process in EHR-enabled health care services. Barriers and facilitating factors impacting testing reliability were identified and aligned with the associated process map activity. Workflow modelling using Business Process Model and Notation (BPMN) has been used by Cutting et al. 38 to represent genetic testing processes from the identification and ordering of the designated test to the notification of results to clinicians. Cutting et al. 38 selected this methodology specifically to address the need to model and understand the inter-relationships between multiple entities (e.g. laboratories, clinicians, and the EHR) involved in the genetic testing process. Through focus groups and modelling the genetic testing processes, these authors were able to visualise and identify multiple areas for improving testing processes. Similarly, Zerbato et al. 39 have successfully utilised BPMN as a comparative tool for documenting and comparing clinical pathways for catheter-related bloodstream infections across two geographically separated institutions. The authors demonstrated that BPMN elements can be used to model the temporal constraints in complex healthcare processes. The comparative analysis of the process models enabled the identification of clinical differences between the two sites, highlighting areas for possible improvement.
Through understanding the business processes, workflows and interactions between participants involved in healthcare processes, valuable insight and understanding can be gained into the multifarious characteristics of test–result management. Furthermore, comparing business processes across clinical settings within the same HIT environment affords the capacity to identify department specific factors which potentially impact on how HIT interventions are, and can be, used for effective test–result management. The aim of this study was to compare the utilisation of a single test–result management application across two acute care departments, within a single hospital facility comprising the same organisational, management and information technology (IT) environment. In addition, both departments also utilise the same laboratory and radiology services. While there are obvious differences between the provision of highly specialised critical care in the Intensive Care Unit versus the unpredictable presentations of a fast-paced Emergency Department, an identical test–result management application had been implemented in both departments. We used qualitative interviews and comparative business process modelling, to identify and compare factors that influence the work processes within each clinical setting and to determine their impact on the utilisation of a test–result management application. Understanding the similarities and differences in departmental work flows associated with the use of a hospital wide test–result management application can aid in informing the design of HIT interventions and improve the safety of test–results management and follow-up.
Materials and methods
Setting
This study was undertaken at a 500+ bed Australian metropolitan tertiary teaching hospital. Two departments, an ED and an ICU were chosen for comparison of test–result management processes. The hospital uses an EMR (Cerner Corporation) including the Cerner FirstNet module in the ED. 40 Clinicians can access the results of medical imaging and laboratory tests within the EMR.
Ethics approval
Ethics approval was granted by the relevant Human Research Ethics Committee. All participants provided written informed consent.
Data collection
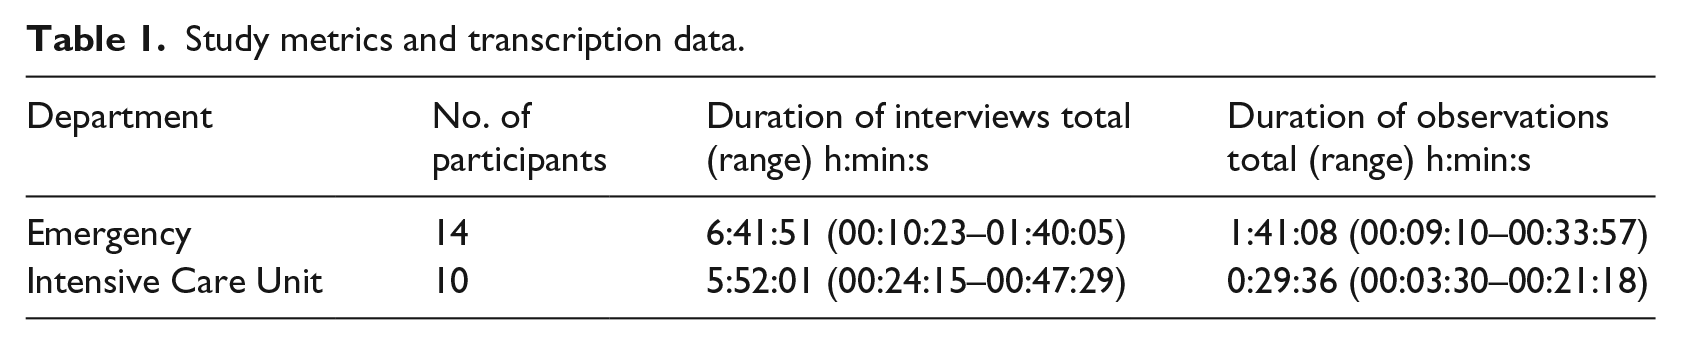
This study is part of a larger investigation into test–results management for which the study protocol has been published. 41 A purposive sample of clinical staff (Table 1) was recruited in each department to provide a cross section of roles with knowledge and experience in the test–result management process. Authors Maria R Dahm and Julie Li conducted semi-structured interviews. Drawing on existing literature, open-ended interview questions were designed to capture subjective experiences of test–result management processes and to cover all aspects from test ordering, to tracking, receiving, reviewing, notifications, acknowledgement of results (critical and normal) and result communication. To triangulate interview data, additional multi-modal data were collected in the form of field notes, artefacts, de-identified photographs and audio-recorded ‘think-aloud’ observations 42 in which participants talked aloud while performing routine tasks related to test–result management.
Study metrics and transcription data.
Data analysis
All audio recordings were transcribed and de-identified for qualitative analysis using NVivo 11 (QSR International Pty Ltd, Melbourne, Australia,). Test–result management process steps were extracted from transcript data for each department to build process diagrams for test–result management workflows.
Process modelling
There are a number of methodologies available for process modelling43,44 including the Object Management Group’s (OMG) 45 BPMN. BPMN was selected as the preferred standard to map work processes for visual comparison. BPMN has been utilised to document, visualise and communicate healthcare processes, including application to ‘as-is’ and ‘to be’ modelling, for process improvement,38,46 for pre–post implementation workflows 7 and in computerised simulation analysis.46–48 BPMN has also been used in many healthcare scenarios to model complex processes, for example; clinical pathways; 49 anatomical pathology; 50 programmed surgery; 51 genetic testing; 38 hip fracture processes 46 and ED settings.7,47,48 Furthermore, BPMN has been used as a comparative tool for clinical pathways between hospitals in different countries 39 and for workflow modelling of genetic test processes. 38
For this study, both BPMN and flowcharts were used to diagrammatically represent the data. Flowcharts were chosen as the initial tool for data representation for their usability and utility,43,52 and they are well suited to in-depth modelling at a micro level. 43 Judith Thomas drafted comprehensive flowcharts which were iteratively reviewed by the authors who conducted the interviews. Key participants within each department subsequently received flowcharts for member checking, 53 validation and correction.
The value of supplementing flow charts with additional modelling techniques has been recommended to address the organisational complexities of the healthcare environment. 52 Hence, BPMN was used to represent the process flows at a higher level to allow comparison between the ED and ICU. BPMN is an international standard graphical notation for modelling business processes, which was purposively developed to be understood by all stakeholders including business analysts, technical developers and business managers. 45 A comprehensive description of the modelling elements may be found within the specification. 45 BPMN models were developed using Bizagi Modeller. 54 Figure 1 summarises the graphical elements used.45,55
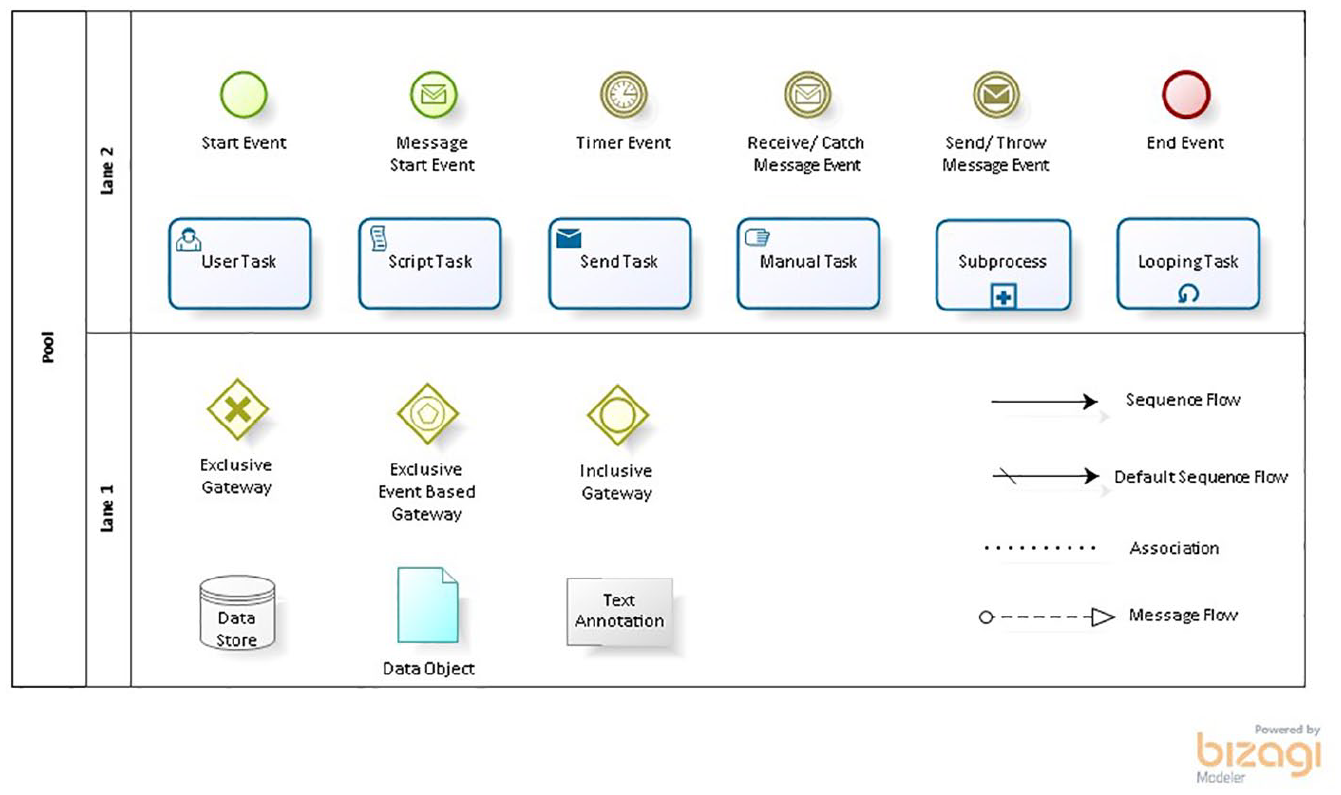
BPMN graphical elements used in this study.
Data quality
Triangulation53,56 was used to maximise the quality and dependability of the research findings and to reduce potential bias by collecting subjective data from multiple participants using one interview schedule and collecting multi-modal data (interviews, observations and field notes). In addition, flow charts were developed by Judith Thomas independent to the data collection process then reviewed by Maria R Dahm and Julie Li who conducted the data collection before review and validation by member checking.
Results
Study metrics and transcripts
A total of 24 medical and nursing staff participated (ED = 14, ICU = 10). Due to the small sample size and to ensure anonymity, each participant was assigned a code (P01, etc.) for illustrative quotes extracted from transcripts. Table 1 presents the duration of interviews and observations. Abbreviations in the transcripts include NUM – Nurse Unit Manager; CNC – Clinical Nurse Consultant.
BPMN process modelling
The high-level process models for the ED and ICU are presented in Figures 2 and 3 as BPMN collaboration diagrams. The external participants (laboratory and medical imaging) are modelled as ‘black box pools’ 45 and thus the diagrams only depict the message flows to/from the external participants.
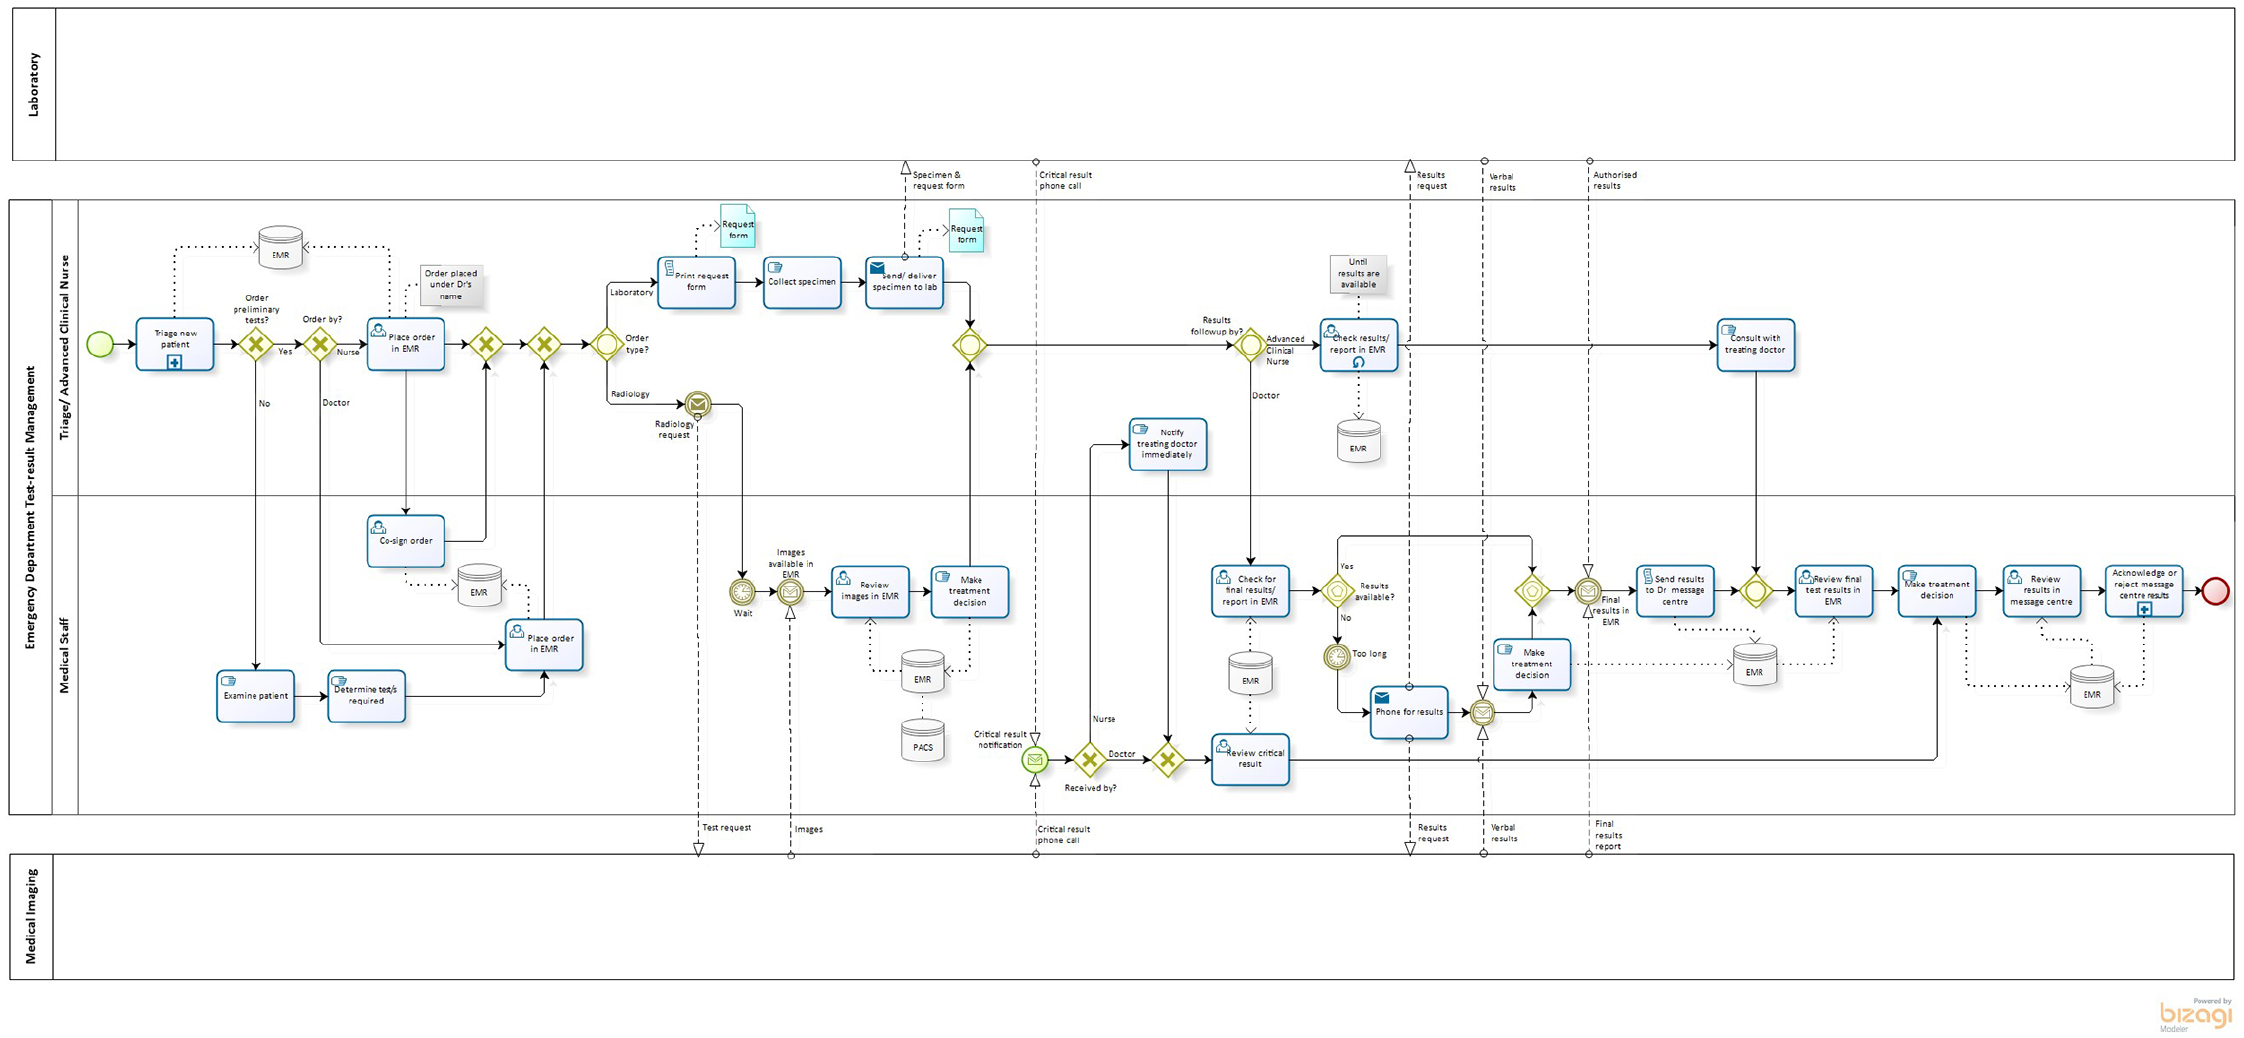
Business process diagram for test–result management in the Emergency Department.
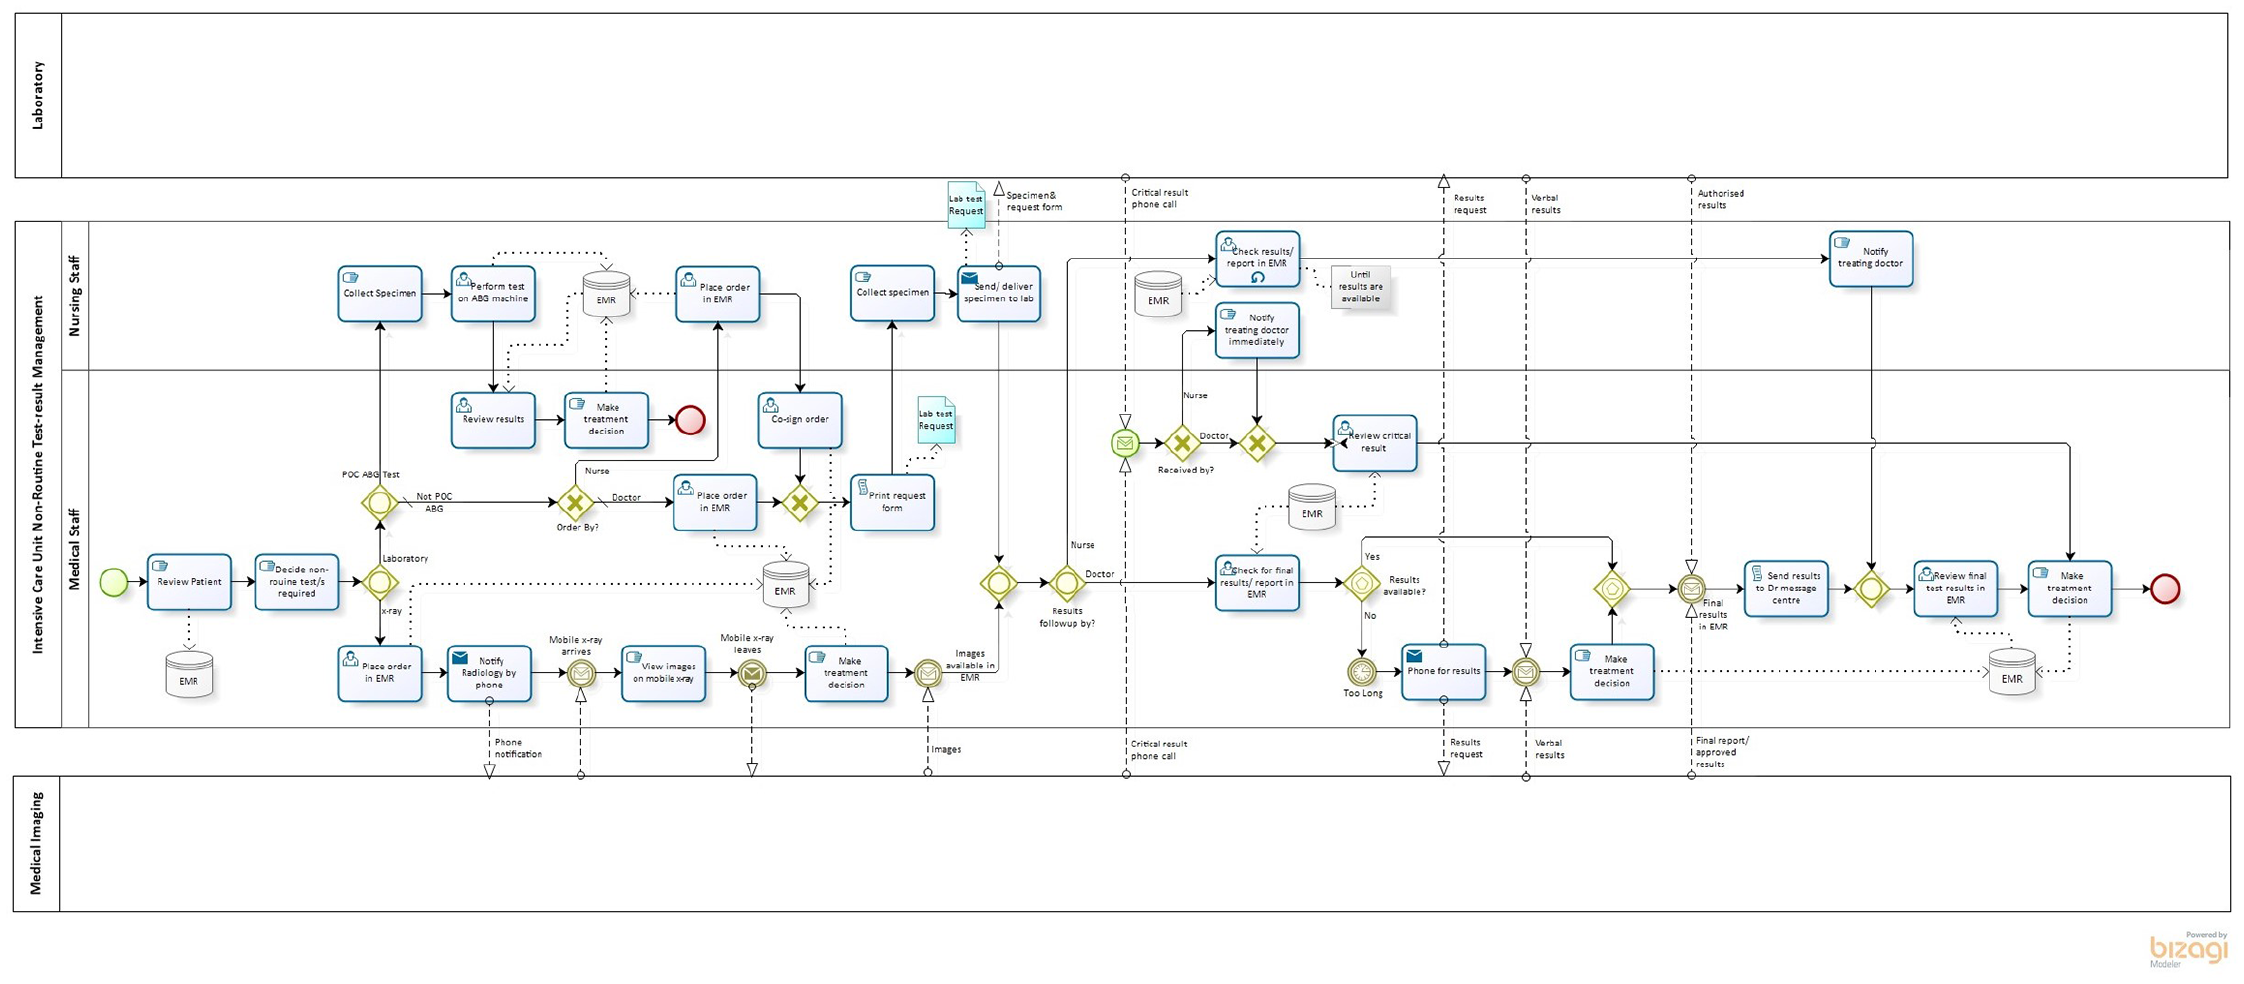
Business process diagram for non-routine test–result management in the Intensive Care Unit.
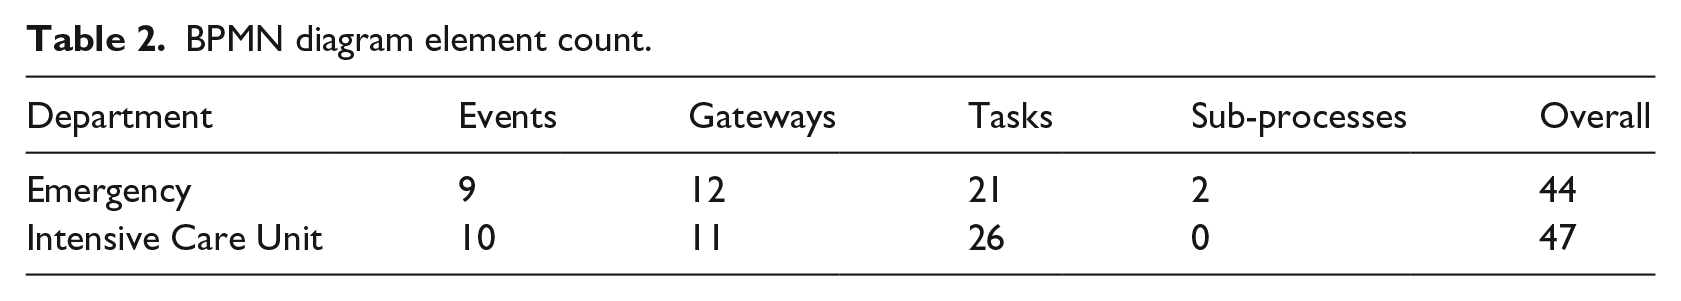
These high-level diagrams provide visual comparisons to identify differences between the business processes of the two departments. The results generated from the ‘element count’ feature of the Bizagi tool are presented in Table 2. The number of exclusive gateways (decision point with one outcome) and inclusive gateways (decision point with one or more outcomes) 45 present in both models (compared to the number of tasks) highlights the non-linearity of the test–result process. The diagrams reveal that the greatest variation occurs in the test ordering and test–result notification processes. Further differences in the ICU diagram include process flows for the optional utilisation of an on-site arterial blood gas (ABG) machine and the requirement for a mobile X-ray machine.
BPMN diagram element count.
Test ordering
Emergency Department
The test ordering process in ED may commence any time from when a patient presents to triage as: nurses can order baseline bloods and specific bloods or specific imaging depending on what’s wrong with the patient. (P01)
Test orders initiated by authorised nursing staff are entered into the EMR and, where required, can be electronically co-signed by the medical staff member under whose name the test was ordered: under the in-charge medical officer because they’re the people that have to sign the orders off’ (P02); ‘they order them under the doctor that’s in charge for the day. (P05)
In the ED BPMN diagram these ordering practices are reflected by the exclusive gateways where it is determined whether preliminary tests are ordered, and who undertakes the ‘place order in EMR’ task.
Intensive Care Unit
Test ordering within the ICU includes routine daily tests (determined during ward rounds) and periodic non-routine test orders placed when medically indicated. Both imaging and laboratory orders are placed in the EMR. The non-routine test ordering processes in ICU reflected a level of urgency similar to ED test ordering and were thus modelled to allow comparison of test ordering processes between the ED and ICU. In contrast to the ED, it was medical staff (predominantly junior medical officers) not nursing staff, are responsible for placing the majority of test orders in ICU: we don’t have nurse practitioners. (P08) The doctors do the majority – well, 98 per cent of the ordering in consultation with the consultants. (P07)
However, nurses may: order under a verbal order. We’ve got to put the doctor’s name in that we have ordered the pathology under. So then they get an alert to say, ‘. . . this has been a verbal order under your name and you need to co-sign it’. (P09)
The ICU has an ABG machine available for point-of-care testing. Orders for tests performed on the ABG machine do not have to be in the EMR, however, the results interface back to the EMR. The clinical context of the ICU requires the Medical Imaging Department to send a mobile X-ray machine to perform imaging studies. The ICU medical staff can view the X-ray results on the mobile machine directly after the image is taken, before waiting for the images/reports to be made available within the EMR. Given the necessity for mobile X-rays, the BPMN model for ICU has a greater number of message flows to and from the Medical Imaging Department compared with ED.
The ICU model illustrates that medical staff initiate and order non-routine laboratory tests while nursing staff can perform ABG testing. For non-routine medical imaging requests, the ICU staff telephone the Medical Imaging Department to ensure the receipt of test orders and request priority processing. Conversely, in ED, medical staff and authorised nursing staff can initiate and place laboratory and medical imaging orders. For test ordering, the similarities between the two models are predominantly associated with EMR functionality. For example, in ED and ICU the EMR automatically prints laboratory request forms which accompany specimens to the labs (reflected in the script task for request forms), and medical imaging orders are electronically submitted to the Medical Imaging Department.
Tracking test requests
Similar processes are used in ED and ICU for tracking test results and the status of orders can be viewed in the EMR. In circumstances where a test–result may be taking longer than expected or results are required urgently, the staff in both units indicated they will telephone to request an update on, or verbal results for, the test/s in question.
Results notifications
The most notable difference in the test–result reporting processes between the ED and ICU is related to the use of the ‘message centre’/‘inbox’ feature in the EMR. All test results ordered under a clinician’s name will be sent to their personal message centre and are available in the patient’s record in the EMR. Only medical staff have a personal message centre. Within the ED, the results in the message centre also populate a ‘message pool’ which can be accessed by authorised senior medical staff. Each result in the doctor’s message centre needs to be acknowledged before it can be removed from the message centre which in turn, removes the result from the message pool. Although ED prescribes the use of the message centre, the business processes for acknowledging results vary between individuals: You check the message centre on your day off . . . (P05) We just do it whenever we can. (P05) It can be something you do at the start of every shift. (P13) I do it on a daily basis. (P12)
For tests ordered by authorised nursing staff, results are returned to the inbox of the supervising doctor who placed the order. Although both medical and nursing staff can review patient results via the patient EMR flowsheet, test–result notifications will only be sent to the doctor’s message centre.
Results notifications are also available to ICU via the EMR message centre. While it is not mandated in the ICU, some medical staff utilise the message centre. The lower usage in the ICU occurs because individual patients are constantly monitored by a large number of dedicated staff within a multidisciplinary team: . . . the message centre only populates if you personally order it, . . . for any one patient in the ICU there’s the consultant, the advanced trainee, the registrar, the resident, so I will only receive it in my message centre if I’m the one who orders it personally, so I don’t usually go to that, I will go [to] the pathology folder . . . . (P16) So the clinical manager should be looking at it, the nurse should be looking at it, the resident should be looking at it and document it in their notes, the registrar will be checking with the resident to see if there’s any abnormal and the consultant when he does his rounds is looking at the results as well and asking for anything to be documented or followed up. (P07)
The BPMN models show that both medical and nursing staff caring for a patient check if test results are available in the patient’s EMR flowsheet and nursing staff liaise with the medical staff when the results are accessible. The script task ‘send results to Dr message centre’ indicates that in both the ED and ICU the EMR automatically executes this process. However, in the ICU a defined process for actioning results returned to the message centre is absent. In contrast, a sub-process has been used in the ED model to indicate the sub-set of tasks required for the acknowledgement of message centre results. The diagram also illustrates that the message centre functionality is restricted to the medical staff ‘lane’ in the model.
Discussion
This study identified three key differences in the utilisation of an electronic test–result management system between two acute care settings: (1) initiation and ordering of clinical tests varies between the ED and ICU principally according to the differing clinical roles and responsibilities of those involved. This, in turn, impacts on the use of EMR functionalities for monitoring and acknowledging the return of test–results, (2) test–result acknowledgement differs between the ED and ICU based on the specific clinical/organisational demands of each setting despite operating within the same IT and hospital/organisational environment and (3) the complete test–result management process is non-linear, reflecting the complexity of healthcare processes. Business processes explored in this study also revealed variations among individual clinicians, reflecting the nuances of clinical practice.
The outcomes of this study have important implications for the design, implementation and sustainability of EMR test–result management interventions. For example, the ‘lanes’ in the process diagrams identify which clinicians are involved in each step of the test results management process, hence any proposed changes to a system can be assessed for impact on both the individuals’ role and the collaborative activities between both clinicians and others. System-wide (facility level) interventions can also be compared between the two departments to determine their impact on the business processes specific to the individual clinical setting. The impact of the clinical milieu on workflow and HIT utilisation and the need to address contextual factors using, for example, sociotechnical and human factors models has been recognised in the literature. 57 Researchers have called for the evaluation of the collaborative activities (e.g. handovers) in team-based care environments57,58 to ensure HIT solutions support clinical collaboration. This study has demonstrated that business process modelling (specifically BPMN collaboration models) can offer such a methodological approach through the modelling of processes, participant roles and message exchanges in clinical care using collaboration diagrams.
The results of our study substantiate the value of using business process modelling as a tool for cross-comparison of healthcare processes, concurring with Zerbato et al. 39 who used BPMN to compare clinical pathways between two hospitals to identify areas for process improvement. The comparative use of BMPN diagrams in our study allowed visualisation of the differences in the temporal sequence of tasks and events in the test–result management process. Multiple factors might impact on the temporality of test–result management including (1) the clinical objectives of the care environment, that is, acute diagnosis and treatment in the ED versus continuous monitoring and treatment in the ICU, (2) different patterns of clinical team work and (3) the multiplicity of non-linear decision pathways, for example, the BPMN gateways modelled in this study. Elements impacting the temporal flow of results management depicted in our process diagrams align with the temporal landscape layers previously described for a hospital-based pathology service by Georgiou et al. 59 These layers include how test–result management processes are synchronised across different parts of the hospital, how clinical work is allocated and coordinated among clinicians and professionals, and how information is communicated and accessed. 59 The alignment of the findings of this study with the layers defined by Georgiou et al. include – the ‘organisational’ (information flow and exchanges modelled between external participants); ‘clinical’ (which participant performs an activity and the event-based gateways for the return of clinical results within acceptable timeframes); ‘procedural’ (availability of mobile X-ray machines and inclusive gateway for ABG testing) and the ‘informational and electronic’ layers (synchronous critical results notifications vs asynchronous message centre notifications). The application of the research findings to models such as Georgiou’s highlights not only the process temporality, but also attests to the appositeness of the BMPN methodology employed in this study.
It is incontrovertible that healthcare processes are inherently complex 60 and non-linearity is a core concept in complex systems.60–62 The relationship between complexity and non-linearity is explained by Cardoso 62 as ‘complex systems involve a number of elements . . . whose dynamics are dominated by nonlinear interactions between their parts’ (p. 1). The visual representation of test results management processes presented in this study clearly demonstrate non-linearity through the multiplicity of decision pathways. The complexity of the modelled process can be gauged not only through the number of tasks and gateways, but also through the interactions between participants both directly and via message exchanges. Furthermore, BMPN ‘intermediate events’ and ‘timer events’ clearly indicate interdependencies within the process. While complexity and non-linearity of processes are well established concepts in healthcare, this study highlights the value of utilising business process modelling to graphically identify the specific nature of complex non-linear process interactions.
The results of our study highlight the need to consider (1) the clinical context of the individual department and the individual needs of clinicians within the department, (2) the entire end-to-end non-linear workflow and (3) the associated collaborative relationships, when implementing HIT test–result management interventions. The results of our study provide a greater understanding of the nature of the specific needs of individual clinical environments and the impact of clinical roles and responsibilities on test–result management. For example, in the ED, nurses ordered diagnostic tests in the EMR under the name of the supervising medical officer, in comparison with the ICU, where although nurses could order this way, junior medical staff predominantly entered the majority of orders into the EMR. As evidenced through process model comparison in this study, the implementation of a test–result management intervention does not ensure its utilisation. This was determined to be an important difference between the needs of ICU and ED staff in this study. The collaborative teamwork environment in the ICU, where patients are constantly being monitored by a multidisciplinary team, reflects lower usage of the results notification message centre functionality, as test–result notifications only return to a single ordering clinician. The challenges associated with test–result notifications in team-based environments have also been reported by Cutting et al. 38 who proposed a ‘subscription system’ to send test–result notifications to all clinician’s involved in a patient’s care. In comparison, the use of the message centre in this study is mandated in the ED where clinician’s use the functionality to support their individual work practices. The comparative differences in utilisation of the results notification functionality in our study reflect the context of collaboration within the clinical environment and concur with the ‘Field of Dreams’ fallacy of Karsh et al. 23 who have highlighted the misconception that the implementation of HIT will result in its unquestionable acceptance and utilisation as designed.
There are limitations to this study including that the research was conducted based on a single test–result management application and may not be generalisable to other HIT solutions. Similarly, the study was undertaken in the ED and ICU of an Australian hospital and may not be generalisable to other hospital settings or departments. Test–result processes were only modelled from ordering to return and acknowledgement of results. It was beyond the study scope to model activities associated with actioning test results after their return if the patient has been discharged. There was notable variability in the work practices between individuals within each clinical setting and it was not possible to model the intricate diversities of individual work practices.
Practice implications
By comparing the use of an electronic test–result management system between an ED and ICU in the same hospital and HIT setting, this study has highlighted key context-specific differences in the clinical needs, roles and responsibilities unique to the management of diagnostic test results. The study findings contribute to improving our current understanding of test–result management practices in an ICU, identifying contextual aspects specific to this setting and can thus serve to inform future research in test–results management in ICU settings.
Conclusion
This qualitative study examined the utilisation of a single electronic test–result management application across two acute care departments within the same hospital and IT setting. Business process modelling, based on semi-structured interview data, was used as a comparative methodology to identify differences in utilisation of the application and the clinical workflows which reflect the differences determined. Process models and interview transcripts provided rich data illuminating the constraints and nuances of the clinical milieu and their impact on the test–result management process. Modelling the business processes, collaboration and communication needs of individual clinical environments can aid in enhancing the quality and appositeness of HIT interventions and thus contribute to improving patient safety.
Supplemental Material
Appendix_1_R2-jhi – Supplemental material for A comparative study of the utilisation of an electronic test–result management system in emergency and intensive care settings
Supplemental material, Appendix_1_R2-jhi for A comparative study of the utilisation of an electronic test–result management system in emergency and intensive care settings by Judith Thomas, Maria R Dahm, Julie Li, Johanna I Westbrook and Andrew Georgiou in Health Informatics Journal
Footnotes
Acknowledgements
The authors thank all participants involved in the study for their contributions to the research.
Declaration of conflicting interests
The author(s) declared no potential conflicts of interest with respect to the research, authorship, and/or publication of this article.
Funding
The author(s) disclosed receipt of the following financial support for the research, authorship, and/or publication of this article: This research was supported by a National Health and Medical Research Council Partnership Project 1111925 in partnership with NSW Health Pathology and the Australian Commission on Safety and Quality in Health Care.
Supplemental material
Supplemental material for this article is available online.
References
Supplementary Material
Please find the following supplemental material available below.
For Open Access articles published under a Creative Commons License, all supplemental material carries the same license as the article it is associated with.
For non-Open Access articles published, all supplemental material carries a non-exclusive license, and permission requests for re-use of supplemental material or any part of supplemental material shall be sent directly to the copyright owner as specified in the copyright notice associated with the article.