
Abstract
This study addressed the problem of scheduling walk-in patients in real time. Outpatient clinics encounter uncertainty in patient demand. In addition, the disparate departments are locally (department-centric) organized, leading to prolonged waiting times for patients. The proposed integral patient scheduling model incorporates the status and information of all departments in the outpatient clinic along with all possible pathways to direct patients, on their arrival, to the optimal path. The developed hybrid ant agent algorithm identifies the optimal path to reduce the patient waiting time and cycle time (time from registration to exit). An outpatient clinic in Aravind Eye Hospital, Madurai, has a huge volume of walk-in patients and was selected for this study. The simulation study was performed for diverse scenarios followed by implementation study. The results indicate that integral patient scheduling reduced waiting time significantly. The path optimization in real time makes scheduling effective and efficient as it captures the changes in the outpatient clinic instantly.
Introduction
An important operational issue in health care delivery involves increasing access by minimizing delays. With the increase in diagnosis and treatment complexities, patients follow complex pathway; as a result, they visit multiple departments for various tests or evaluations. Most of the processes are sequential and depend on the outcomes of the previous process. Time spent by each patient in the hospital may vary significantly.1,2 Patients spend a lot of time in the outpatient clinic (OPC) before seeing a doctor. 3 The delays in care are detrimental to patients, as they may result in adverse outcomes, increase the costs incurred, and reduce patient satisfaction. 4
Patient scheduling in OPCs often deals with appointment scheduling. Often, departments in OPCs schedule patients locally because of which patients wait at different departments. OPCs are open loop systems with uneven demand and lack synchronization between departments as the status of all the departments is unknown at registration. Even later in the process, the status of downstream departments is unknown. Because of lack of path optimization, patients wait in overcrowded departments at times and resources remain idle in other departments.
There is abundant literature present on patient scheduling as it is an important aspect of operations management in the OPCs. Many papers have explored various methods of scheduling appointments.5–8 OPCs schedule patients depending on the availability of resources (doctors) with the goal to match the demand with supply to maximize resource utilization and profit. Appointment scheduling has evolved from manual methods to automated methods.9–12 Different factors that can potentially increase the unpredictability in OPCs, such as no shows and double booking, have been incorporated to optimize hospital performance.10,13 OPC reserves certain time slots for walk-in patients in their scheduling systems.14–19 The patient scheduling literature for walk-in patients is sparse. An important paper is Su and Shih, 17 as it had considered a maximum number (72% of a total number of patients) of walk-in patients in a clinic. The study applied four types of mixed registration strategies, in which one of them minimized waiting time and throughput time (cycle time) for scheduled patients while another minimized the same parameters for walk-in patients. This study provides efficient management of time slots for registration of both types of patients. The walk-ins were pre-planned but not scheduled in real time. To the best of our knowledge, our paper is the first to consider patient scheduling for all walk-in patients in the OPC. However, OPC being open loop systems are affected by their environment and experience variability and uncertainties that are caused by unpredictable clinical pathways, patient arrivals (early, late, or random), and varied service times. Patients, either scheduled or walk-in, wait for care. The current scheduling methods do not incorporate complete patient pathways and actual statuses of all the departments. Therefore, we state the hypothesis of this study: “An OPC system with disparate subsystems (departments) can minimize patient’s waiting time/cycle time by scheduling patients in real-time and by pathway optimization, together.”
This study proposes an integral patient scheduling model that combines pathway optimization (OPC-wide) along with actual departmental status (real time). It schedules patients to all the departments that a patient needs to visit, such that a patient spends minimum time in the OPC. A hybrid ant agent algorithm is developed to find an optimal path. In addition to simulation study, we carried out an implementation study in an OPC with high demand variability. In addition, we employ a self-adaptive evaporation rate (explained in Section “Integral patient scheduling model”) that makes the OPC a self-analyzing and self-correcting network where even the slightest change in the OPC environment could be effectively managed.
The article is organized as follows: section “Material and methods” describes materials and methods that include working conditions of the OPC, data collection, model development, experimental design, simulation study, and implementation of the proposed scheduling model in the OPC. Section “Integral patient scheduling model” presents the proposed integral patient scheduling model and describes a hybrid ant agent algorithm. Section “Results” reports the simulation and implementation results, section “Discussion,” and section “Conclusion.”
Material and methods
Aravind Eye Hospital (AEH) is a renowned eye care hospital in Madurai, South India, which provides patient-centric care.20,21 It has performed 401,529 surgeries and treated 2,396,864 outpatients during 2014–2015. 22 It functions with assembly line efficiency, strict quality norms, process standardization, and cost control.23–28 The OPC in AEH is open from 7 am to 6 pm. Patient arrivals are random and independent because of lack of appointment system. All the patients are provided care on the day of their arrival. It provides care to new patients and review patients. The OPC consists of two units with the identical setup to treat patients. A patient is assigned to one of the units alternatively. Figure 1 shows the functional and operational structure of the OPC in AEH related to patient scheduling. Departments, such as new registration (NR) and review registration (RR), are common to the two units of the OPC. Each unit has five departments, namely, vision (V), refraction (RF), tension (TN), dilatation (DL), and preliminary and final examination (PE and FE). All the queues in the OPC follow first come first serve. The arrows in Figure 1 show the possible pathways for new and review patients. A patient pathway starts with registration and finishes with a final examination. A patient moves through various departments, and the pathways for new and review patients differ. Around 5 percent of the total number of patients exit after the PE. Patients can visit departments RF and PE in any order. The OPC schedules patients alternatively to either of the units (units 1 and 2) during registration. The OPC follows an equal load distribution (an equal number of patients serviced) between the two units. The controllers (C) in Figure 1 are the managers who plan, schedule, and control activities in the departments. Managers manually schedule patients to the preliminary test or refraction test, depending on the queues in the two departments.

Functional and operational structure in the OPC system of AEH.
Data collection and analysis
Ophthalmologists, paramedical staff, managers, and administrative staff were interviewed to understand the workflow process. Data of 6 months were collected from customized software that records process and patient information. Data of 53,802 patients were obtained, which included patient demand, arrival times, in-time and out-time for units, clinical pathways, and resource schedule. Parameters such as waiting times, patient mix, service times, and a total number of patients serviced in both units were extracted from the collected data. Personal information of the patients such as name, age, address, treatment details, or medical reports was not collected. Therefore, an ethical approval for this study was not required. But, permission from the organization (AEH) was taken for this study. The probability distribution of service time and patient arrival time was determined by a data fitting tool: Easy Fit. A Kolmogorov–Smirnov test was used to test the goodness of fit. Service times were selected between the minimum and maximum service times from empirical data and assigned randomly. The patient arrival pattern had two peak loads, at 8 am and at 10 am. Therefore, bimodal Poisson distribution was selected.29–31 The workflow of the model was verified using a structured walk-through by the managers and IT department of the OPC. Emergency care is seldom required in eye care hospital and the hospital provides services for accident patients’ separately in emergency care, so such data were not collected.
Model development
A discrete event simulation model of the OPC was developed using Java and was verified by managers. A patient was an entity, whose progress was tracked throughout the process in the OPC. Furthermore, the model was calibrated by increasing the number of resources (a reactive measure) in some departments during peak hours. The simulation model was run with the empirical data of the previous 6 months. The model was validated by comparing results of the simulation model and empirical data of the OPC as shown in Table 1, and there was no statistical difference between the two.
Validation of the simulation model with the current OPC in AEH.
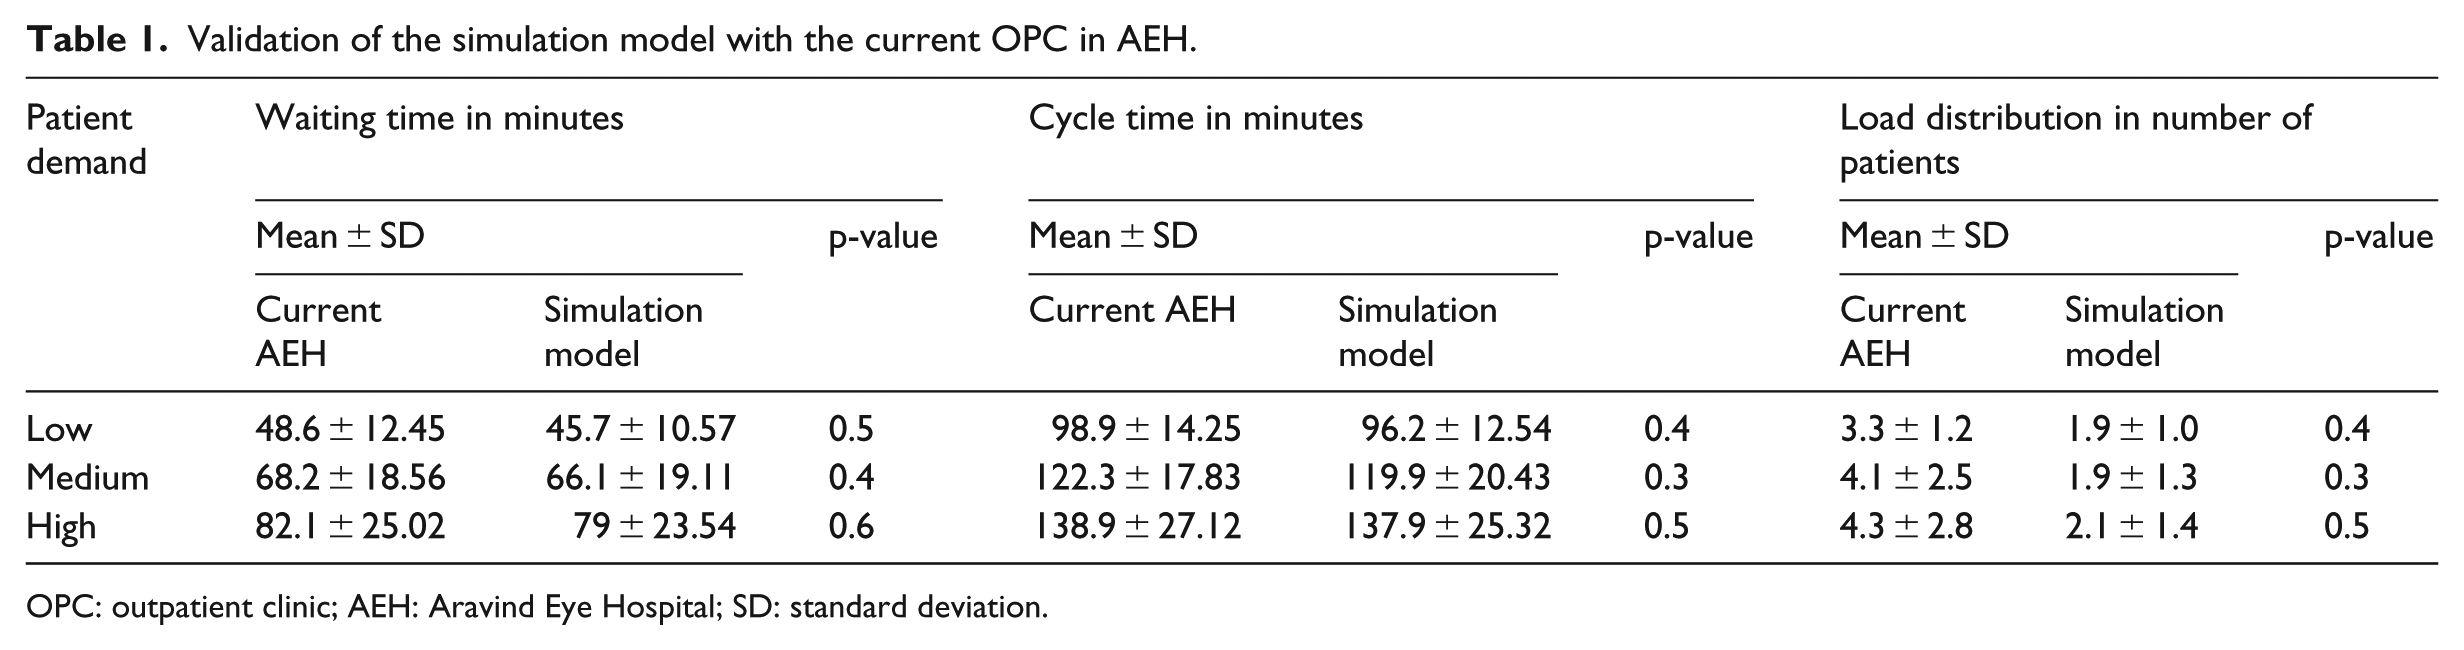
OPC: outpatient clinic; AEH: Aravind Eye Hospital; SD: standard deviation.
Experimental design
Patients’ arrival time and their arrival pattern are important aspects of scheduling. Patient demand in AEH is stochastic. In a month, OPC gets 30.8 percent of demand between 1000 and 1600 patients/day, 49.9 percent between 1600 and 2000 patients/day, and 19.3 percent being greater than 2000 patients/day. Therefore, patient demand was classified into low, medium, and high. Along with fixed evaporation rate between 0 and 1, self-adaptive evaporation rate was also used for the experiment. Therefore, the experimental design had three factors: patient demand (three levels: low, medium, and high), patient scheduling rules (two levels: current and proposed patient scheduling), and evaporation rate (fixed: low and high, and self-adaptive). There were in total 18 experiments. The performance measures (waiting times, cycle times, and load balance) were recorded for all the experiments. A full factorial experiment was carried out to estimate the effect of selected factors on performance parameters.
Simulation runs
The experiment was replicated 10 times with 180 runs to estimate the variability associated with scheduling. Different arrival times for the same mean patient arrivals were generated using random variate (varied seed). The same randomizer input was used for simulation with two scheduling rules and evaporation rates to ensure that the results obtained were not due to randomness. The mean and standard deviation of the waiting time, cycle time, and load distribution were collected and reported in section “Results.”
Implementation of the integral patient scheduler model in AEH
The patient scheduling algorithm was integrated into the customized software (.Net and Visual Basic with a MySQL database). Figure 2 shows the timing and data interaction during patient scheduling in the Integrated Hospital Management System (IHMS). A staff member first enters patient details in the registration form and invokes the scheduler, which requests the actual status from the database. The database extracts data from all departments and sends it to the scheduler, which in turn finds the optimal path and prints it on the patient information card. The model was implemented for 2 months and performance measures were collected. Analysis of variance (ANOVA) tests (significance level of 0.05 p-value) were conducted for simulation and implementation results.
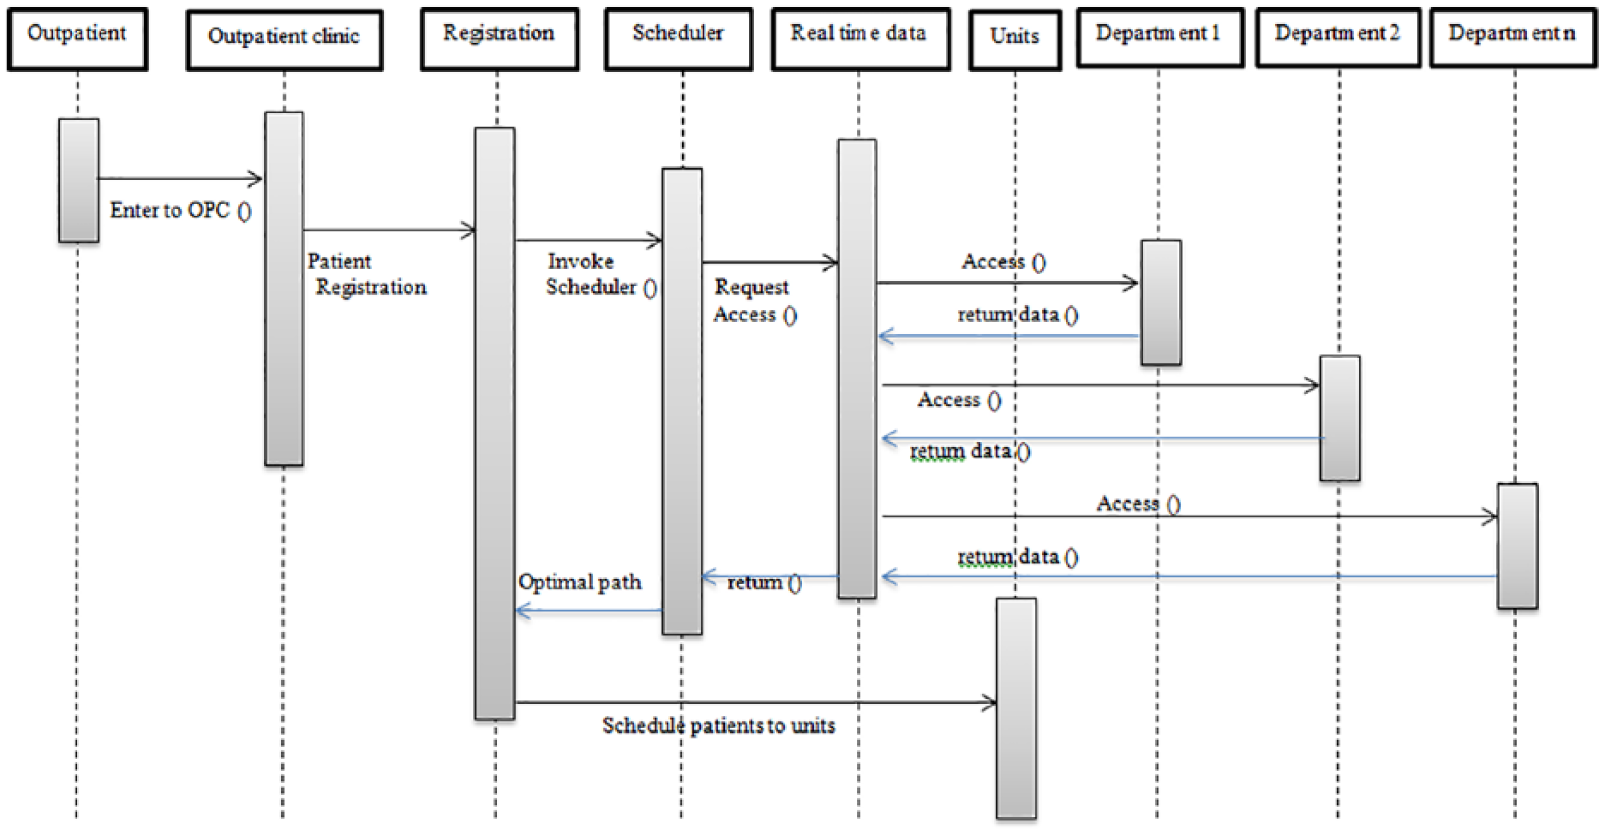
Timing and data interaction during integral patient scheduling in the IHMS of the OPC.
Integral patient scheduling model
The integral patient scheduling model aims to schedule patients to the pathways with minimum waiting time using the actual status of all the departments in an OPC. Patient arrival at registration triggers the scheduling model. This model uses three levels of control (Figure 3):
The patient data and process data from all departments are collected, and the possible patient pathways in the OPC are defined.
The scheduling and controlling tasks of all departments are connected to the scheduler in customized software wherein upstream departments such as NR and RR utilize the actual waiting time of all downstream departments.
The scheduler finds the optimal path for the patient using real-time information.
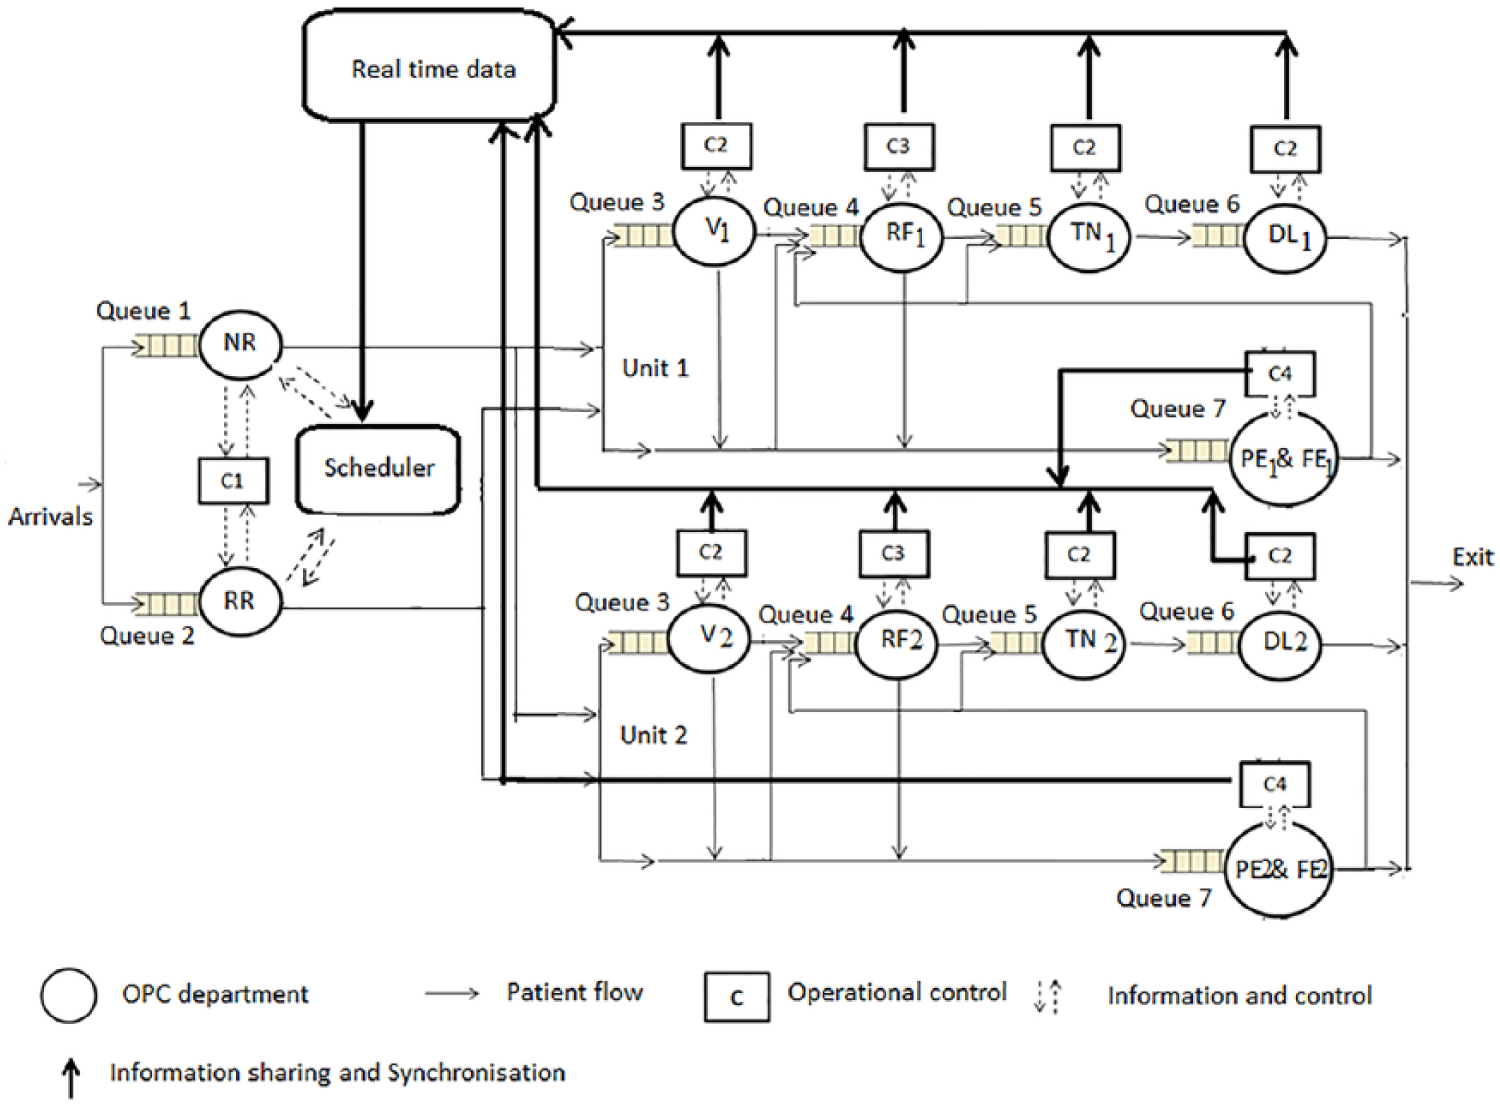
Operational control of the proposed integral patient scheduling.
At registration department, the scheduler schedules patients by considering the complete pathway. Therefore, decisions related to sequencing and scheduling are not taken manually by the managers in the departments but are taken by the scheduler.
It is a prerequisite that all departments regularly update their status, as this information is vital for scheduling. In this context, “response time” is the time taken by the scheduler to obtain an optimal path. As all patients are walk-ins, they may arrive continuously, or there may be a lull. Therefore, how often the status of departments needs to be assessed and processed is a design aspect of the scheduler. Ideally, it should be continuous, but there is a trade-off between response time (cost) and optimal path. It is selected dynamically depending on the number of patients arriving during a particular time frame by the algorithm which is explained later in this section.
Hybrid ant agent patient scheduling algorithm
Ant agent algorithms are used to find the shortest distance between two nodes or points, thereby improving routing, congestion control, cost, and time.32–41 The source node generates the ants, and they randomly walk till they reach the destination node. In this case, the hybrid ant agent patient scheduling algorithm finds the pathway with shortest time rather than shortest distance. The temporal distance (physical distance between departments) plays an important role in path optimization. The OPC in AEH has an optimized layout with assembly line efficiency and patients are escorted to departments by the nurses. Therefore, there is no ambiguity of patients moving around to any other departments unnecessarily. Therefore, temporal distance is not incorporated in this algorithm.
The algorithm runs in real time throughout the day and steps in the algorithm are as follows:
Step 1. Define the departments as nodes and connections between them as links. Here we have defined 12 departments and the connections, rules, and constraints of the OPC.
Step 2. Generate ants at the source. In this case, two types of ants were generated (one for NR and the other for RR). We chose to generate several ants for each patient due to high variability and uncertainty in patient arrivals. There are eight possible pathways for both new and review patients in the OPC. Therefore, four ants per patient were generated for finding an optimal path. The number of ants increased with increasing numbers of nodes and pathways. The ants store with them the information about the nodes visited and the waiting time in each node.
Step 3. The ants travel from source to destination (registration to final examination) with the pheromone table maintained at all nodes. The pheromone table consists of a node number/id, the number of patients in the department (processing and queue), randomly generated service times, waiting time, precedence constraint, next feasible node, and pheromone value.
Step 4. The ants use the pheromone table for selecting the next node after applying the probabilistic transition rule
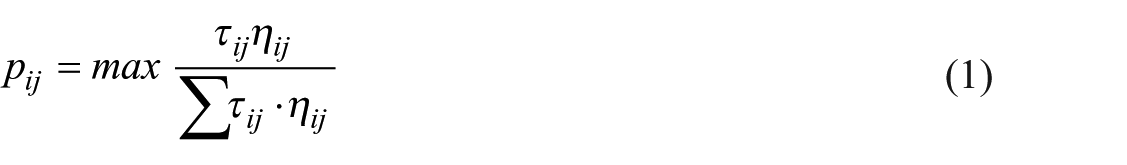
where pij is the probability of an ant in node “i” selecting node “j”
Step 5. Once the next node is selected, the current node = next node, the ants update their visited node list. The ants then update the arc on which they traveled, and this is called the local update of the pheromone table

where τ (i, j) is the pheromone value of the arc connecting node “i” to node “j” and α is the evaporation rate of the pheromone (0 < α < 1). This evaporation rate is selected based on the frequency of ant generation. τ0 is the initial pheromone value at the start of the algorithm. Steps 4 and 5 are repeated till all ants reach the destination node.
Step 6. When all ants reach the destination, the time spent by the ants in the network is obtained with the help of the memory in ants.
Step 7. Once the total time spent is obtained, then a search method is used to select the optimal path with the minimum time spent (Tbest) by an ant in the network. The load distribution between the units is considered before scheduling the patient to the path (Tbest). If the difference “Δ” between load U1 (total number of patients in unit 1) and load U2 (total number of patients in unit 2) is more than the threshold value, the second best path is selected. The pheromone values for nodes in the selected optimal path are updated using the global update rule
where (Tbest) is the minimum time spent by the ant in the system and the optimal path in the workflow. Ants are destroyed after providing the solution space, and new ants are generated as and when needed. Steps from 2 to 7 are repeated till the end of the day or till all patients scheduled.
The evaporation rate (0 < α < 1) is the rate at which pheromones evaporate and plays a significant role in selecting an optimal path and a key point on how to set up and control pheromones. Here, evaporation rate equates to how often the data needs to be accessed and processed and ant agent algorithms use fixed evaporation rate. 42 A high evaporation rate corresponds to a faster adaptation. If the pheromone evaporates too quickly, no prior knowledge collected by ants can be used. Hence, the ants become exploratory and the search time increases. Conversely, a low evaporation rate corresponds to slow adaptation. The ants exploit the information collected by the previous ants and do not explore new paths. The dynamic environment requires an adaptive evaporation rate. Hence, we developed a self-adaptive evaporation rate for an ant agent algorithm to schedule patients in real time. In the OPC, a patient has to visit a sequence of specific departments. 35 Hence, our hybrid ant agent algorithm was based on the precedence and load distribution constraints of the OPC.
In general, Tabu search is used to avoid the cycle formation by the ants. But this model uses a simple search, as precedence constraints are already incorporated; there is no need to handle cycle formation explicitly. The search used in this algorithm satisfies the defined objective of reducing the total travel time spent in OPC (patient cycle time), thus minimizing the waiting time. Two sets of evaporation rates are defined: Elow with lower values that are generated randomly from (0.0, 0.5) and Ehigh with higher values that are generated randomly from (0.5, 1.0). The new ants extract the time of previous ant generation and the last status update used. If either of them is more than a set threshold, then the ant will select randomly from Ehigh, else from Elow.
Results
The mean cycle time for the current patient scheduling and integral patient scheduling (simulation) was 120 ± 19.7 min and 97.9 ± 12.9 min, respectively. The mean waiting time was 66.3 ± 18.7 min and 44.2 ± 11.6 min, respectively. The mean and standard deviation of waiting time, cycle time, and load distribution for the current scheduling and integral patient scheduling are compared in Table 2. ANOVA tests (p = 0.05) show that the performance measures of integral patient scheduling are significantly better than the current patient scheduling.
Comparison of performance indicators for fixed evaporation rate (α) of 0.4, 0.8, and self-adaptive.
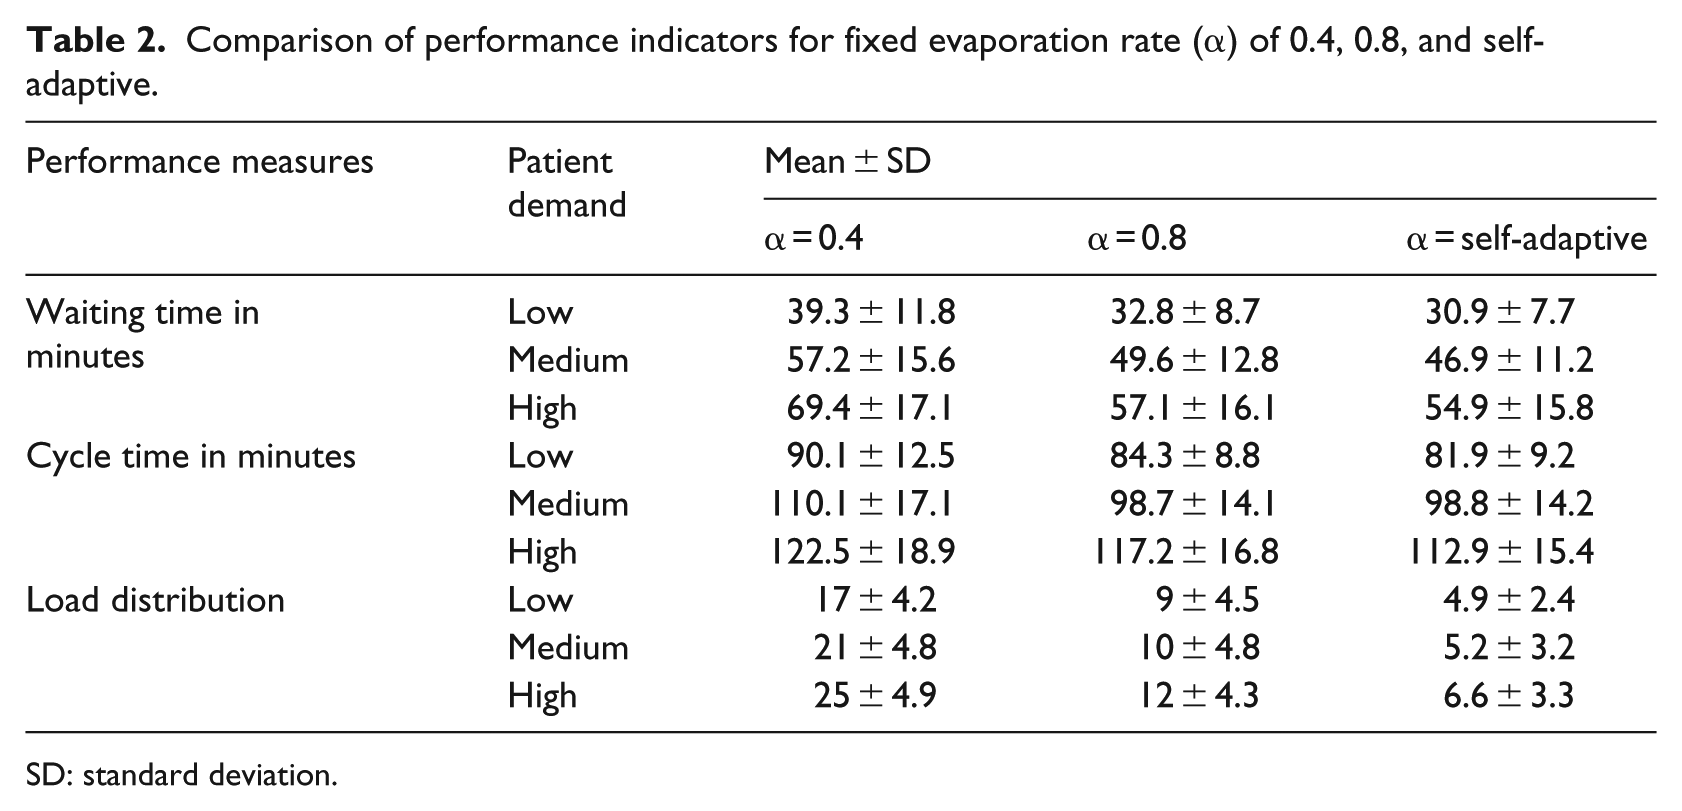
SD: standard deviation.
The average waiting time was reduced in all departments except registration because our model is applied at registration. The waiting times were significantly reduced in preliminary and final examination departments and refraction (Figure 4).
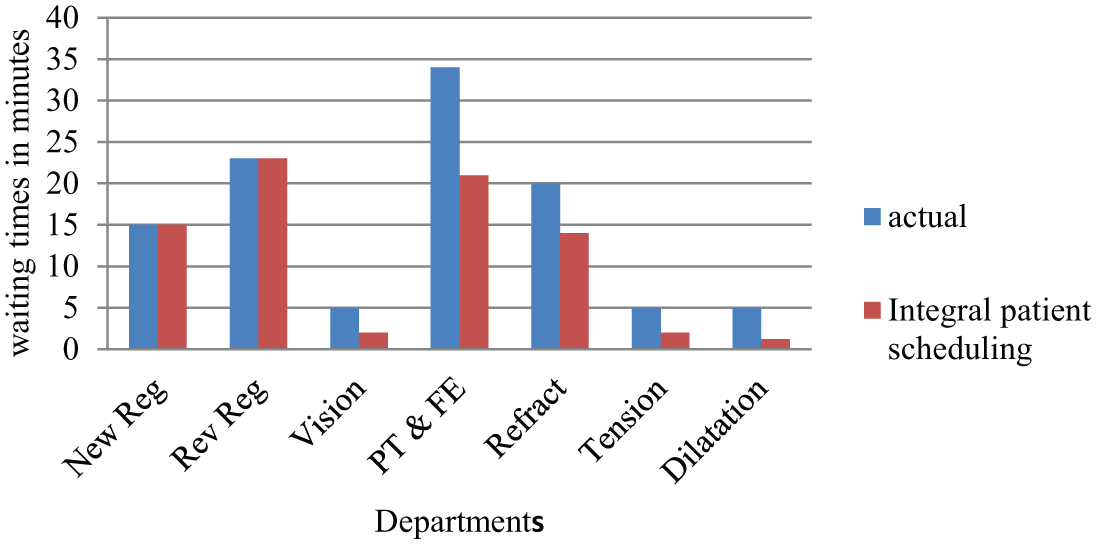
Average waiting times in all the departments in the OPC (units 1 and 2).
Table 3 compares the results of current AEH, integral patient scheduling in the simulation model, and after implementation in OPC of AEH. The results show that 13.5 percent of patients spent more than 2 h in the OPC before implementation of the integral patient scheduling, whereas 8.7 percent of patients after its implementation.
Comparison of performance measures of current AEH, integral patient scheduler (simulation), and (implementation) in the OPC of AEH.
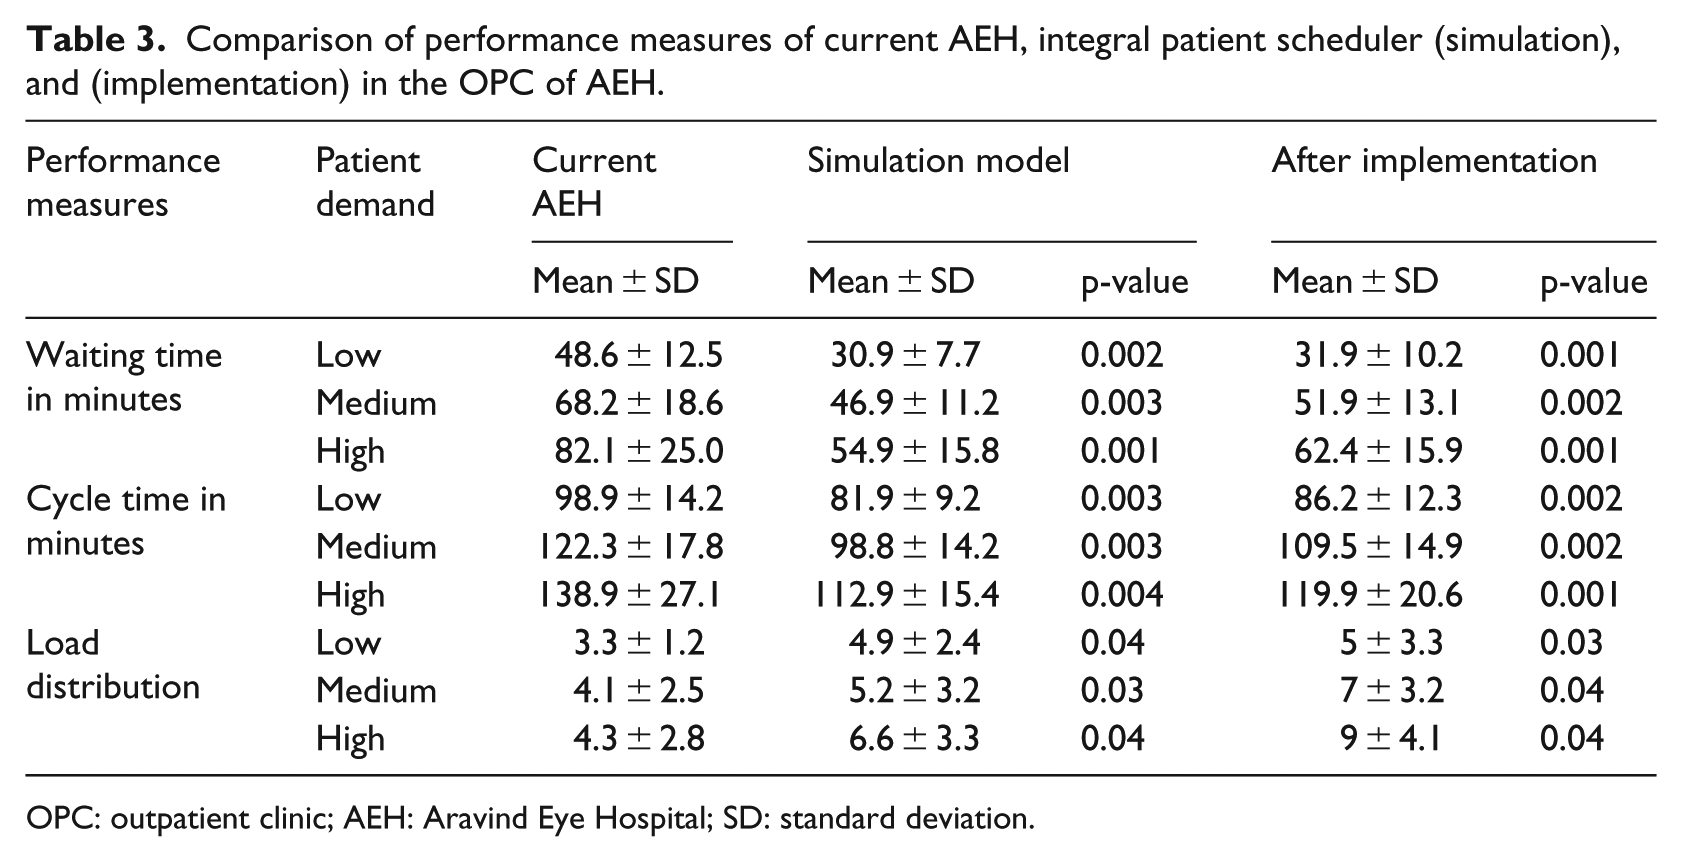
OPC: outpatient clinic; AEH: Aravind Eye Hospital; SD: standard deviation.
Discussion
The OPC system in AEH, unlike other hospitals, gets only walk-in patients. It schedules patients alternatively to the two units, and within the units, scheduling is local. The current method of patient scheduling is department-centric; hence, waiting times of downstream departments are unknown and not utilized by upstream departments (mainly registration). Therefore, patients wait in some departments while resources wait in other departments.
The proposed integral patient scheduling model is based on the actual status of the various departments in the OPC system with a global perspective. Our findings confirm that the proposed scheduling reduced the average patient waiting time by 33 percent in the simulation study and by 26.5 percent when implemented in the OPC of AEH. The average cycle time was reduced by 18.45 percent in the simulation study and by 12.3 percent during the implementation study. The criterion of equal load distribution (equal number of patients serviced in both units) between both units was satisfied. Variability in patient waiting time as well as cycle time was reduced. In addition, the number of patients spending more than 2 h was decreased from 13.5 to 8.4 percent (by 35.5 percent). Since patients were scheduled at registration, there was no reduction in the waiting times in these departments (Figure 4). The waiting times significantly reduced in PT and FE and refraction departments. Excluding patient scheduling, other activities were controlled locally by the departments. Patients are required to visit multiple departments, and at each department, patients are scheduled locally without coordination between upstream and downstream departments, resulting in waiting times and underutilization at the same time. With the pathway approach, the scheduling model implements the global perspective, and with the actual status of departments, it schedules patient in real time. Local optimization might improve waiting times but not the cycle times, whereas pathways approach (global optimization) improves both waiting times and cycle times. 43
The difference between appointment scheduling (planned) and the actual scenario, limited knowledge (local), and lack of coordination among the departments result in waiting time. Patient arrivals are high at times of the day and low at others. Demand either high or low, there exists variability in patient arrivals. The evaporation rate relates to the frequency of data access from the departments. It is advantageous if ants are exploratory, but accessing and processing real-time data costs time and should be performed optimally. Therefore, when the arrivals are faster, the generation of ants is frequent, and later ants can use the information collected (pheromone value). But when there is a delay between the generation of ants, the system status changes with time and needs to be reassessed.
The evaporation rate impacts the exploratory nature of ants. The results of waiting time with evaporation rates of 0.8 (the data were accessed and processed on arrival of each patient) and self-adaptive did not show a significant difference (see Table 3). It indicates that when the system/network has high variability, ants need to be exploratory to find optimal paths. The number of nodes (departments) was less than general hospitals, and because of deterministic pathways, few ants were generated at a time. The life cycle of ants is short; hence, the high value of the evaporation rate does not impact the response time. The selection of evaporation rate depends on patient volume, arrival pattern, pathways, and complexity of the OPC. The self-adaptive evaporation rate optimizes the frequency of real-time data access that would be beneficial in hospitals with more departments.
The response time can increase exponentially with the increase in the number of pathways and departments (e.g. 50 or 100) in a hospital. Therefore, to extend this model to other types of clinics or hospitals, the response time should be studied in detail. The pathways in specialized hospitals or OPCs are more deterministic and less variable than one would expect in general hospitals.
The load distribution between the two units was maintained throughout the day, with very few differences. The evaporation rate also affects the load distribution of the units, where a lower value creates more difference. As α was self-adaptive in this study and load distribution was one of the necessary criterions to be satisfied, we explicitly included this in the algorithm. Based on the results of the ANOVA test (p = 0.05) that was conducted on waiting time and cycle time, we reject the null hypothesis. Overall optimization using integral patient scheduling was found to improve waiting time and cycle time in the OPC.
Current methods of patient scheduling fail to incorporate the variability in the short term (actual system status) and complete pathways. In this study, patients were scheduled such that the total time spent by them in the OPC is minimized. We have also incorporated a self-adaptive evaporation rate that makes it a self-analyzing and self-correcting network where even the slightest change in the OPC environment could be managed effectively. This model also helps OPCs at the operational level; whenever a bottleneck arises, due to uncertainty and variability in patient demand or patient arrival pattern or failure of equipment, it schedules the patients to a congestion-free pathway. The model fits in online operational planning and control. The model analyzes all possible alternatives quickly under time pressure and strengthens the operational decisions in patient scheduling. Another way to reduce the bottlenecks is through demand-based resource scheduling. 31
Scheduling patients in real time not only depends on the algorithm but also on the IT structure and knowledge management system of the OPC. In this study, the hospital staff in each department updated the patient and process data manually. The staff members do their duty properly without negligence. This is monitored also before this project. The staff was told about the scheduling that is performed by the software and the importance to enter the patient data without delay. As per Hawthorne experiments, the staff under research would proactively perform well. But, in this situation, the paramedical staff proactively performed their duties well before and during intervention. There was no bias observed either for or against the scheduling scheme.
Waiting time is also influenced by number of resources in the departments. The study collected the corresponding resource scheduling and incorporated it in the simulation model. During the implementation study of 2 months, the data on those days with additional resources scheduled were excluded for result analysis. The number of resources in the OPC did not affect the patient demand and their arrival patterns.
Conclusion
The proposed integral patient scheduling that incorporates actual status of departments and global optimization (OPC-wide) perspective reduces waiting times and cycle times in OPCs. It overcomes the problem of unregulated waiting times and prolonged cycle times through path optimization approach. This scheduling algorithm minimizes waiting times without additional resources.
Waiting times, a quality care measure in OPC systems, need to be managed effectively as they are open loop systems. Our experiments establish the importance of real-time information, its utilization, and global optimization in the performance of an OPC. The OPC in AEH had deterministic pathways and this model could probably be extended to general hospitals by considering their workflow complexities. As future work, it is suggested to utilize radiofrequency identification tags for patients for updating status and also explore learning mechanism to select an effective evaporation rate. We also intend to explore the integral patient scheduling model in complex hospitals with stochastic pathways.
Footnotes
Declaration of conflicting interests
The author(s) declared no potential conflicts of interest with respect to the research, authorship, and/or publication of this article.
Funding
The author(s) received no financial support for the research, authorship, and/or publication of this article.