
Abstract
We sought to design a touch tablet asthma questionnaire while identifying patient preferences for usability features of such questionnaires.
We created an evidence-based prototype and employed rapid-cycle design (semi-structured focus group testing, analysis, corresponding modifications, re-testing) with asthma patients aged ⩾16 years. We analyzed transcripts using deductive and inductive content analysis. Quantitative measures included Likert-type-scale responses, the System Usability Scale, and questionnaire completion times.
There were 20 participants across five focus groups (15/20 female, age 49.1 ± 15.6 years). Usability-related themes included (1) “Touch Technology” (hygiene, touch technology familiarity, ease of use) and (2) “Questionnaire Design” (visual characteristics, navigation). Completion time was 11.7 ± 5.9 min. Summative Likert-type scale responses suggested high system usability, as did a System Usability Scale score of 84.2 ± 14.7.
In summary, Attention to specific technology- and design-related preferences can result in a highly usable patient-facing touch tablet questionnaire. Our findings can inform touch questionnaire design across other diseases.
Keywords
Background and significance
Consumer technologies are increasingly being adapted for clinical use, with a goal of facilitating and enhancing health care. Specifically, administration of patient questionnaires through tablet devices has been found to be both feasible and efficient.1,2 Tablet-based patient questionnaires have been used for osteoporosis risk assessment and for pain management and quality of life assessment in chronic diseases such as rheumatoid arthritis, lupus, spondyloarthritis, chronic back pain, and various cancers.3–11
Usability is a major determinant of the uptake of technology-based systems, particularly in complex healthcare settings. 12 Yet despite their growing use, few studies have addressed patient usability preferences for touch tablet questionnaires.13–15 We sought to systematically design a highly usable waiting room touch tablet questionnaire for patients with asthma that could be completed within approximately 10 min (about 85% of patients wait 10 min or more in a primary care waiting room) 16 and to describe patient preferences for usability features of such questionnaires.
Materials and methods
To achieve our objectives, we employed rapid-cycle design—a process by which practical problems are identified and addressed using incremental analysis.17,18 We collected qualitative data regarding patient preferences and concerns in semi-structured focus groups. We also included the following quantitative measures: Likert-type scale questions, the System Usability Scale (SUS), and questionnaire completion times. 19
Study setting and population
The study was approved by the St. Michael’s Hospital Research Ethics Board. We recruited patients aged ⩾16 years with a self-reported physician diagnosis of asthma through clinician referrals and clinic posters in the Greater Toronto Area. We employed purposive sampling to achieve sample heterogeneity with respect to age and electronic technology and touch device experience (from novice to expert). 20
Prototype questionnaire design
The purpose of the questionnaire was to collect information about asthma symptoms and medication use. The questionnaire was designed as an electronic tool to be administered in a clinic waiting room. Questionnaire data were later integrated into a point-of-care computerized clinical decision support system (eAMS—the Electronic Asthma Management System) 21 based on adult asthma guidelines (targeting patients aged ⩾16 years). 22 The questionnaire was delivered through a web-based application on a second-generation Apple iPad (Apple Inc., Cupertino, CA, USA). We chose this device over smaller-screened devices based on the prior literature suggesting that patients prefer a device that more closely approximates a standard piece of paper. 23 First, a prototype was developed by asthma and knowledge translation experts (S.G., L.P.B., A.K.). Where possible, we applied evidence-based electronic questionnaire design principles and included touch device usability features shown to be broadly favorable to patients. The principles included (1) suitability across ages and genders, (2) ability to efficiently complete the questionnaire without prior training, (3) all responses entered by user action (as opposed to default answers), and (4) information necessary to answer each question available on the question screen (without requiring scrolling). 24 Specific features included (1) large radio buttons for answer selection, (2) a scrolling system for integral increases or decreases in numerical entry values, and (3) minimal text entry requirements. 25 Movement through the questionnaire was enabled by arrow buttons on either side of the screen or by swiping. The questionnaire was viewable in portrait or landscape mode and screen zooming was enabled.24,26 Italic script was avoided and a uniform color scheme espoused. 26 This prototype (with response-dependent paths yielding anywhere from 7 to 30 question slides) was pilot tested by a convenience sample of 12 users (clinicians and students) who provided unstructured individual feedback on content and usability. The corresponding improvements were made before focus group testing.
Questionnaire testing and outcome assessment
The rapid-cycle design process involved the following (in sequence): (1) questionnaire testing in a focus group, (2) analysis of focus group findings, (3) corresponding modification of the questionnaire, and (4) re-testing of the modified questionnaire in a subsequent focus group.4,27 We performed serial focus group testing until no new categories of usability-related concerns were identified.
Each focus group was facilitated by a moderator and attended by the study coordinator. Sessions lasted 2 h, included 3–5 participants, and were audio-recorded, with tapes transcribed verbatim. Each session was scripted and began with a slide presentation providing background on asthma, the study’s purpose, and session instructions. Participants then used the device to complete a survey collecting background information. Next, they completed the questionnaire on individual devices while being observed by a moderator and a study investigator, who recorded questions/features which appeared to be problematic in field notes. The moderator then debriefed participants as a group, eliciting opinions on each of two pre-set overall themes: usability-related issues and content-related issues (data from the latter theme are presented separately). 28 Finally, participants completed a Likert-type scale–based questionnaire which included the validated SUS, which measures effectiveness (ability to complete tasks), satisfaction (subjective reactions to using the system), and system efficiency.19,29
Analysis
Focus group transcripts and field notes were independently analyzed by two team members with qualitative research expertise. Analysts independently generated lists of usability and content issues (and solutions, where applicable) and compared these to generate a final list of issues. Investigators used this list to devise the corresponding system revisions, which were then made before the next session. After the last focus group, analysts coded all transcripts, applying both deductive and inductive content analysis approaches. Consensus on coding was reached through comparison and discussion between analysts.30,31 Demonstrative quotations were collected for each identified sub-theme. Quantitative summary statistics included means and standard deviations, or proportions, as appropriate. The SUS was calculated in accordance with questionnaire instructions. 19
Results
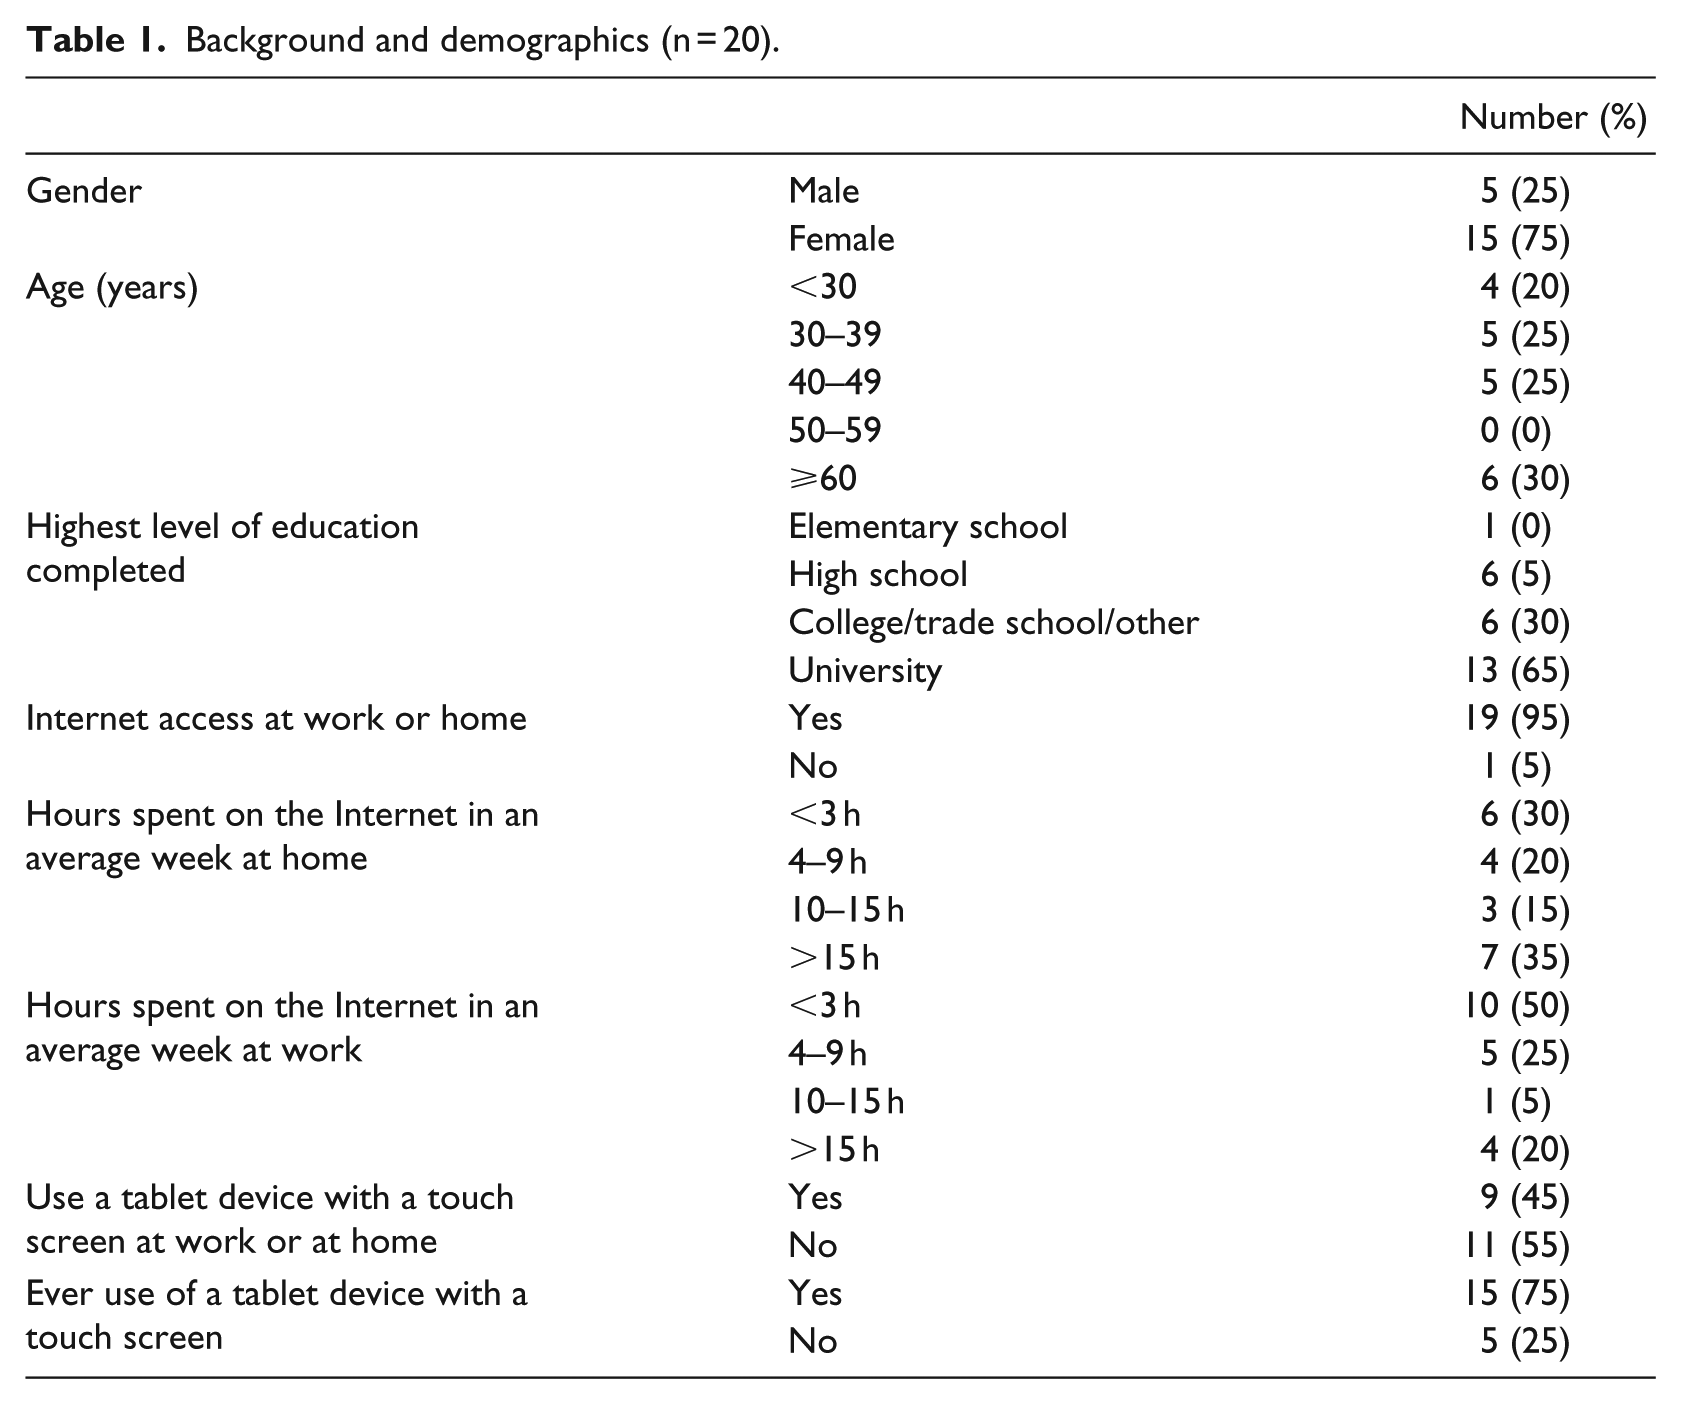
We conducted five focus groups with 20 participants in total (Table 1).
Background and demographics (n = 20).
Quantitative results
Participants took a mean of 11.7 ± 5.9 min to complete the questionnaire (range: 5.4–26.9 min). The mean SUS was 84.2 ± 14.7 (maximum score: 100). Exit questionnaire responses were highly favorable.
Responses were entered on a five-point Likert-type scale labeled 1 (disagree), 3 (neutral), and 5 (agree). For the purposes of this figure, scores of 1 and 2 were considered “disagree” and 4 and 5 were considered “agree.” Each bar demonstrates the proportion of participants with each response, for each statement. This includes 20 participants. (Figure 1)
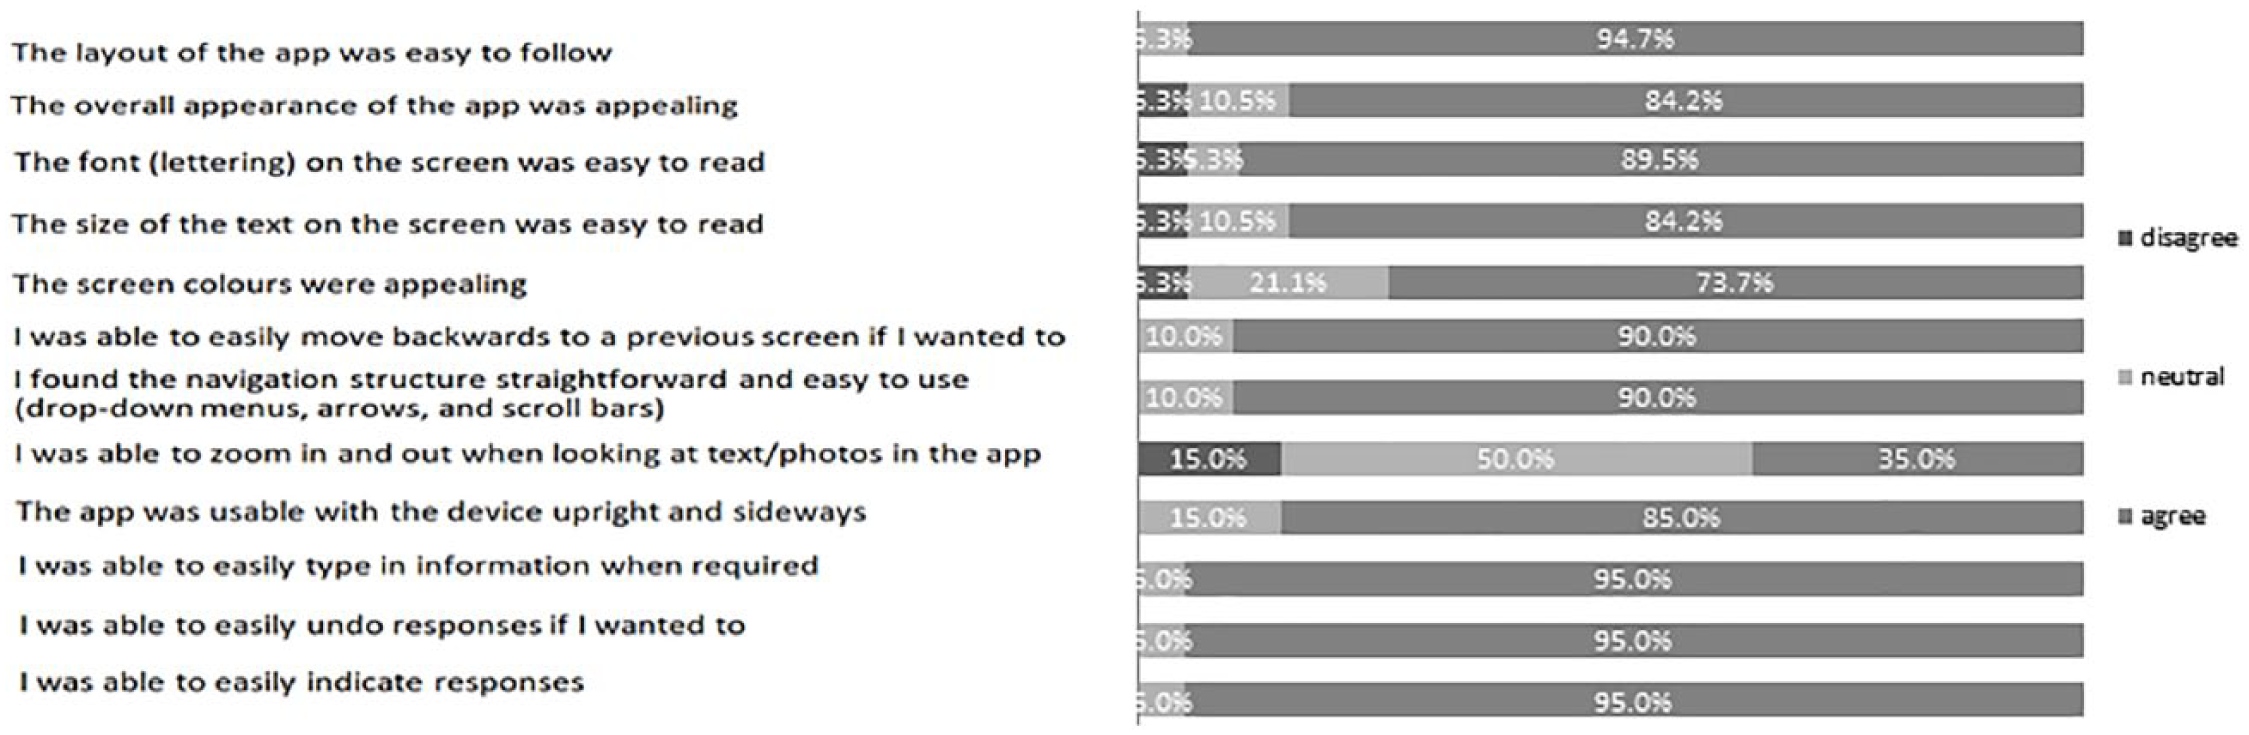
Participant responses to exit questionnaire.
Qualitative results
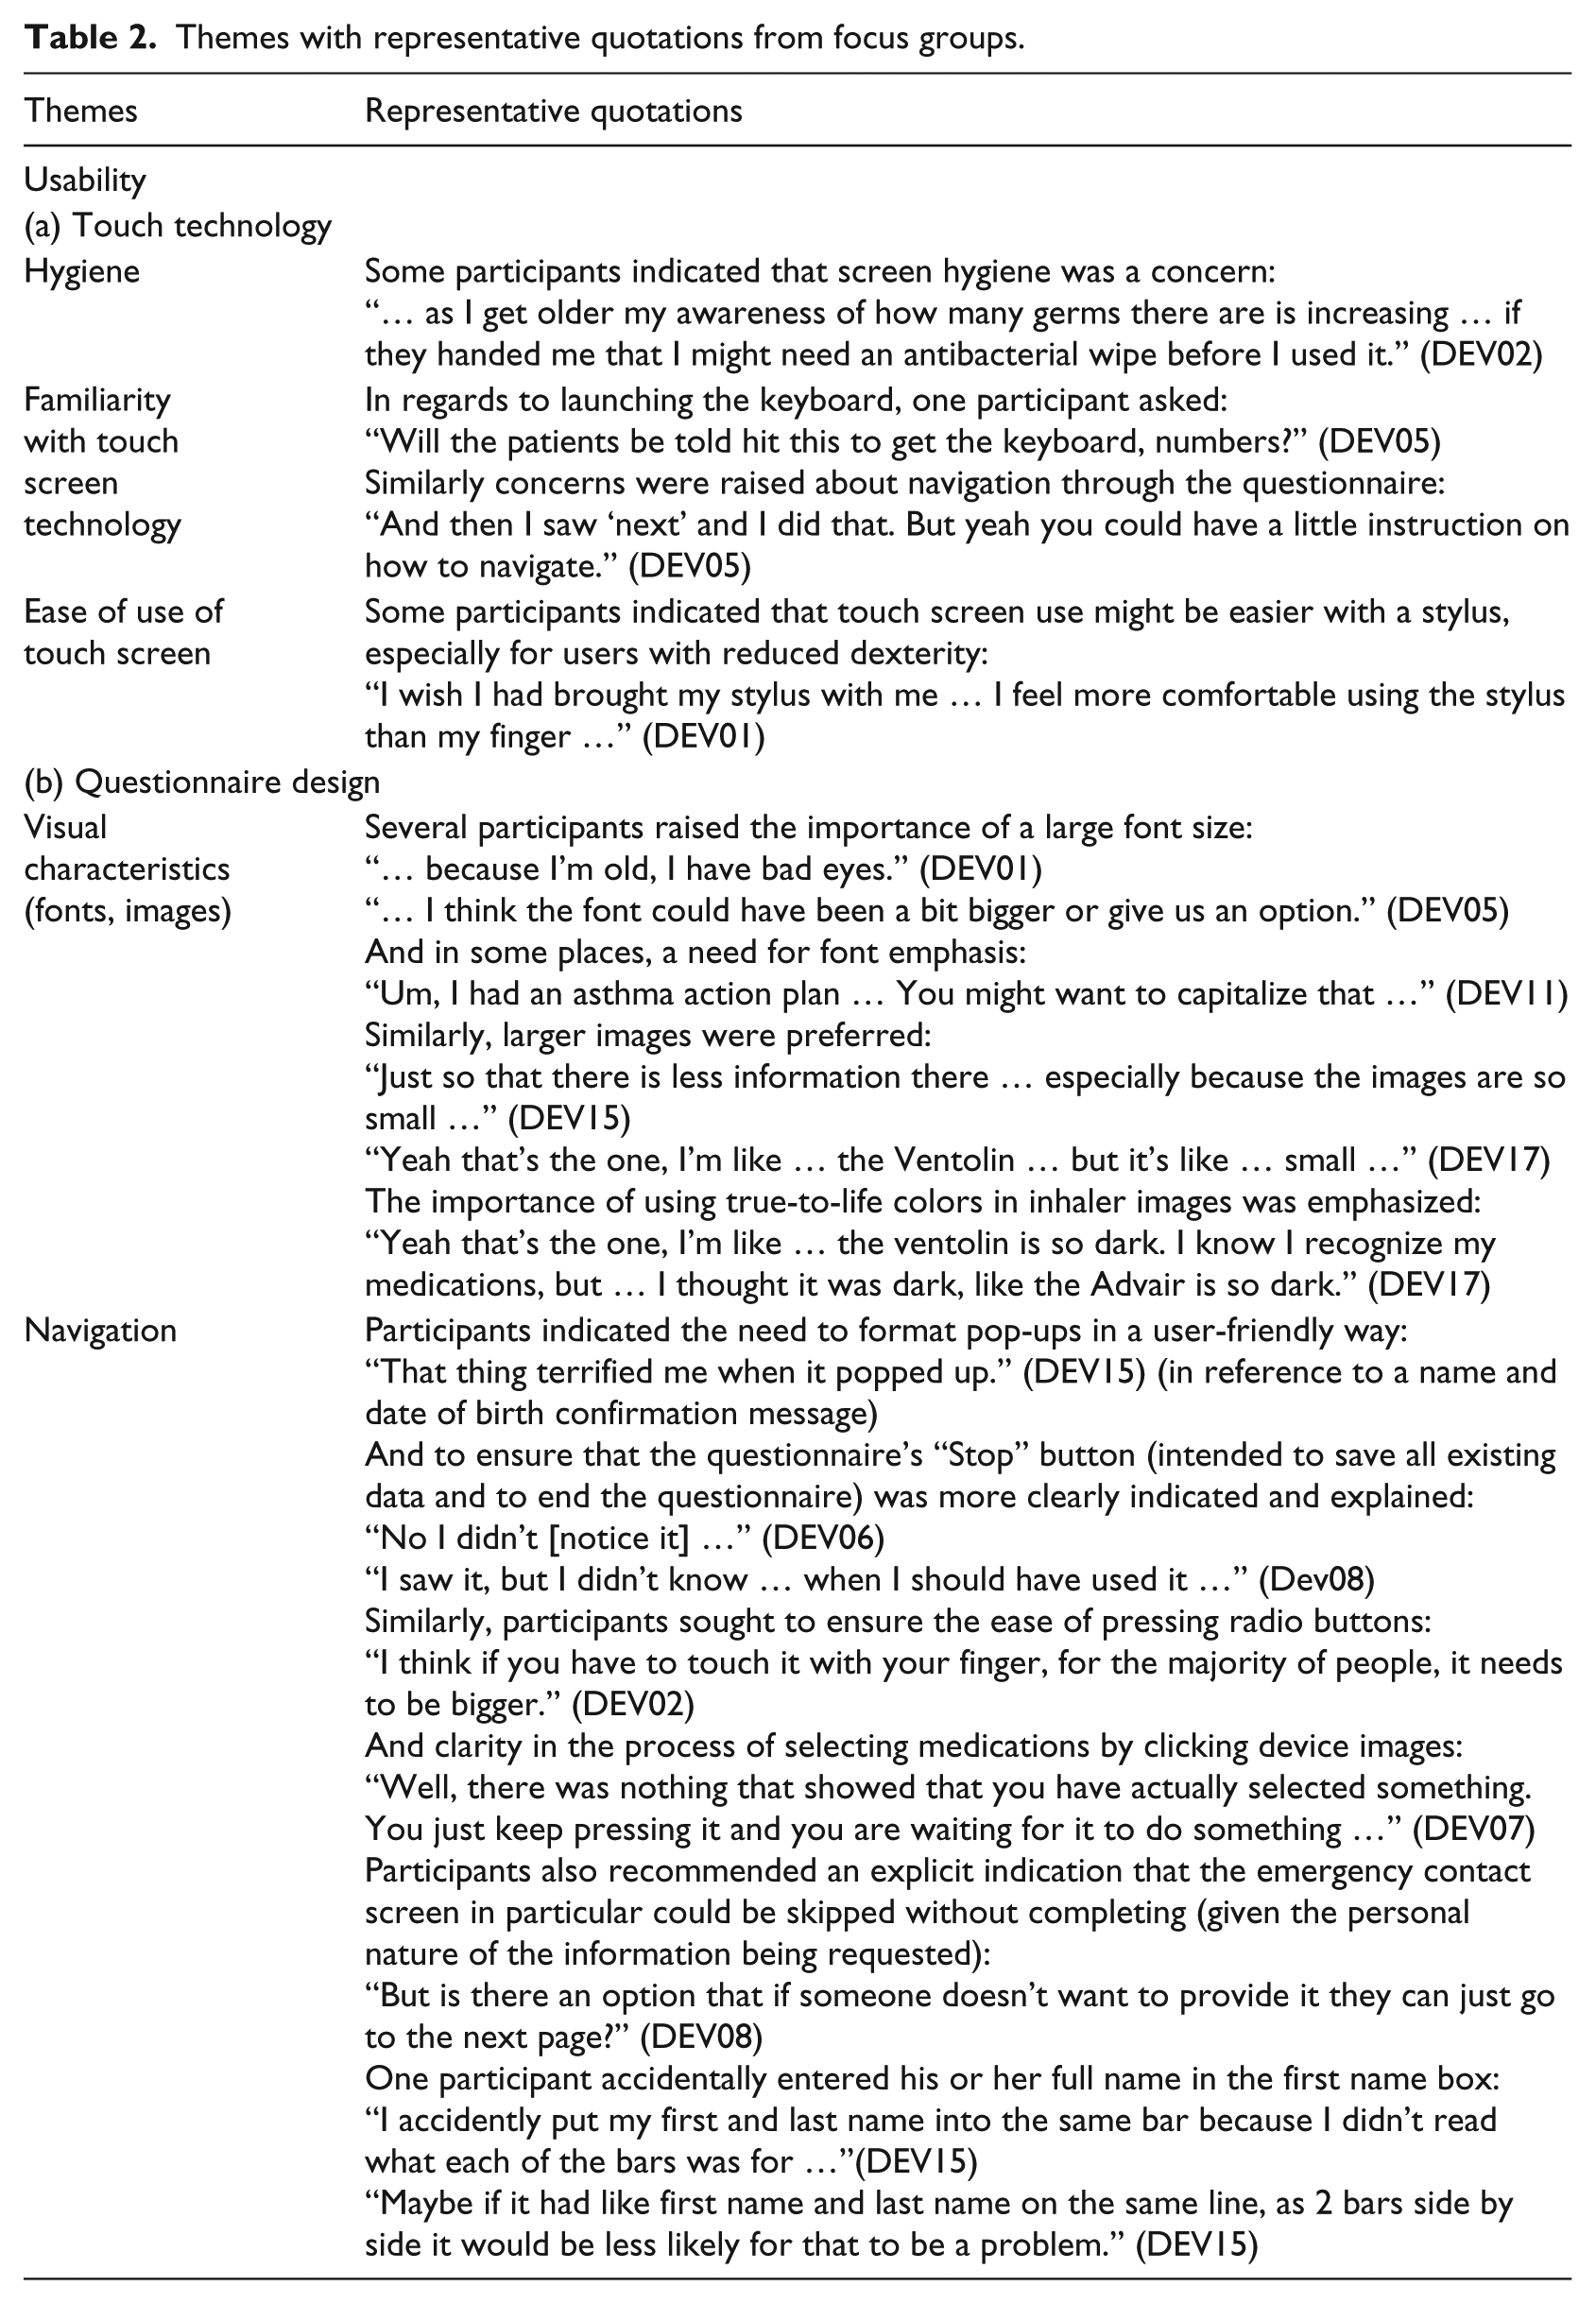
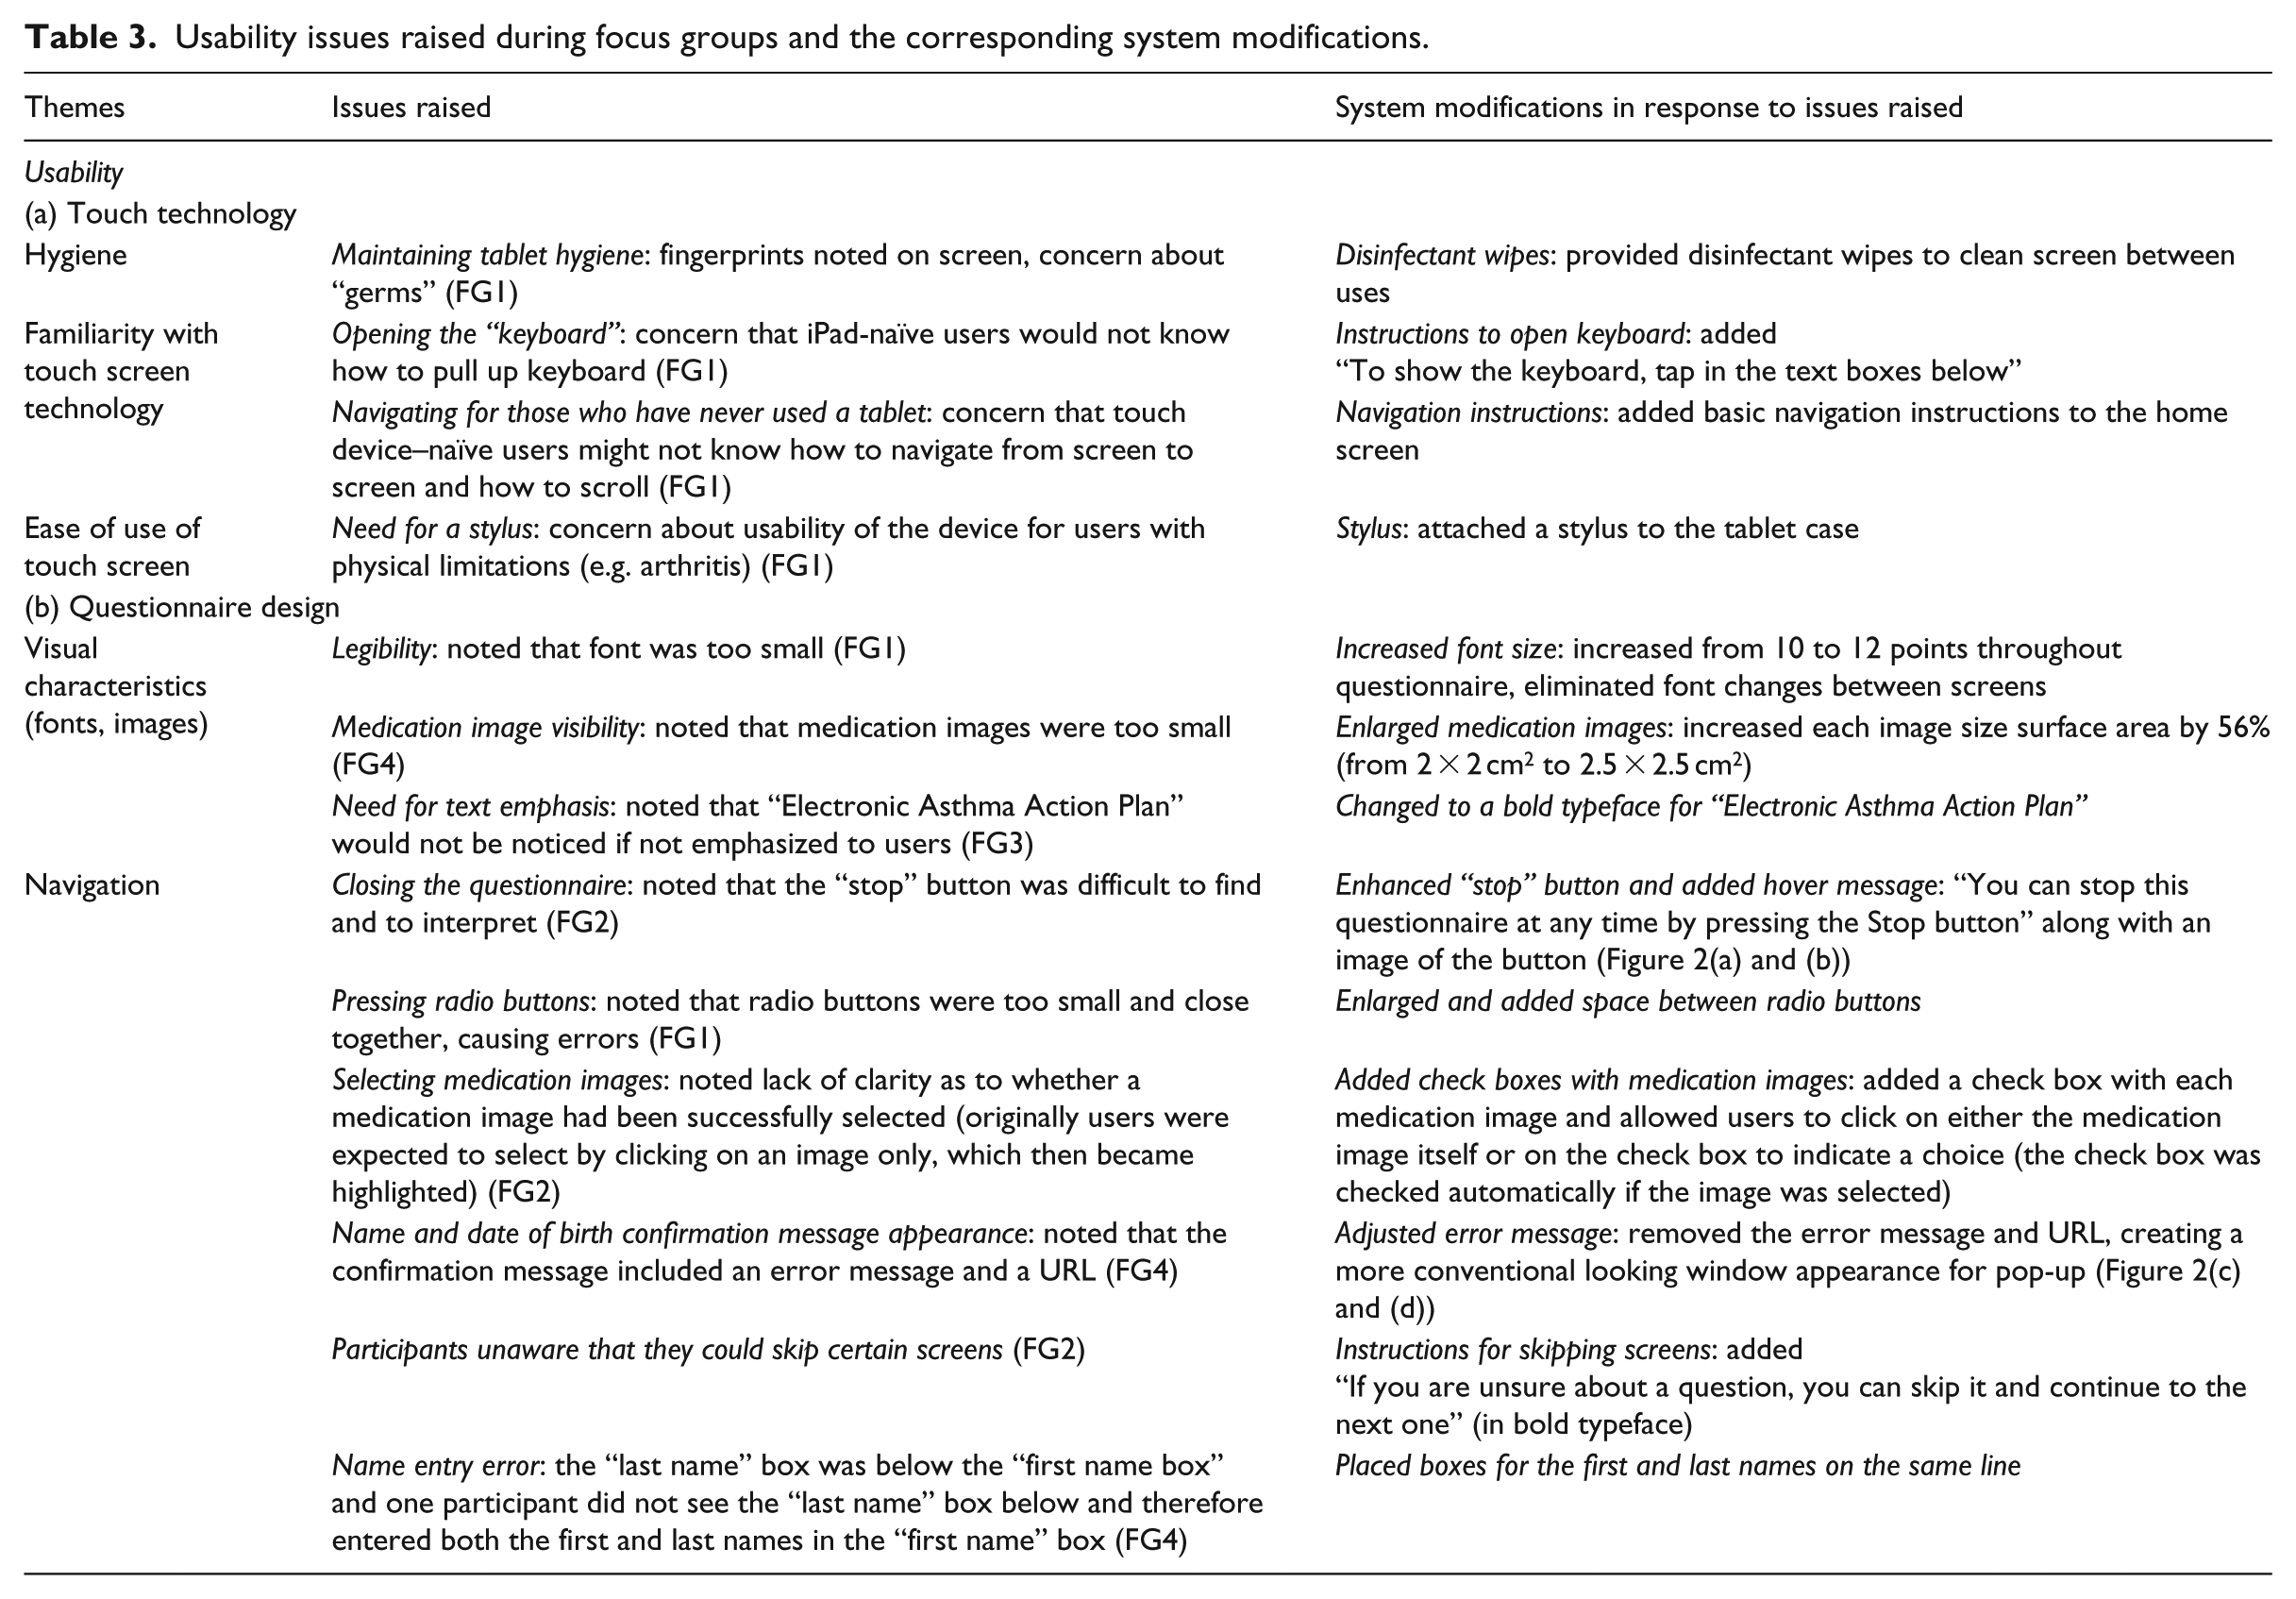
Issues identified in each focus group were grouped into subthemes under the pre-set overall usability theme. Subthemes are described below and further representative quotations are provided in Table 2. Specific issues raised in each subtheme and the corresponding modifications to the questionnaire are shown in Table 3. Figure 2 provides visual representations of some of these changes.
Themes with representative quotations from focus groups.
Usability issues raised during focus groups and the corresponding system modifications.
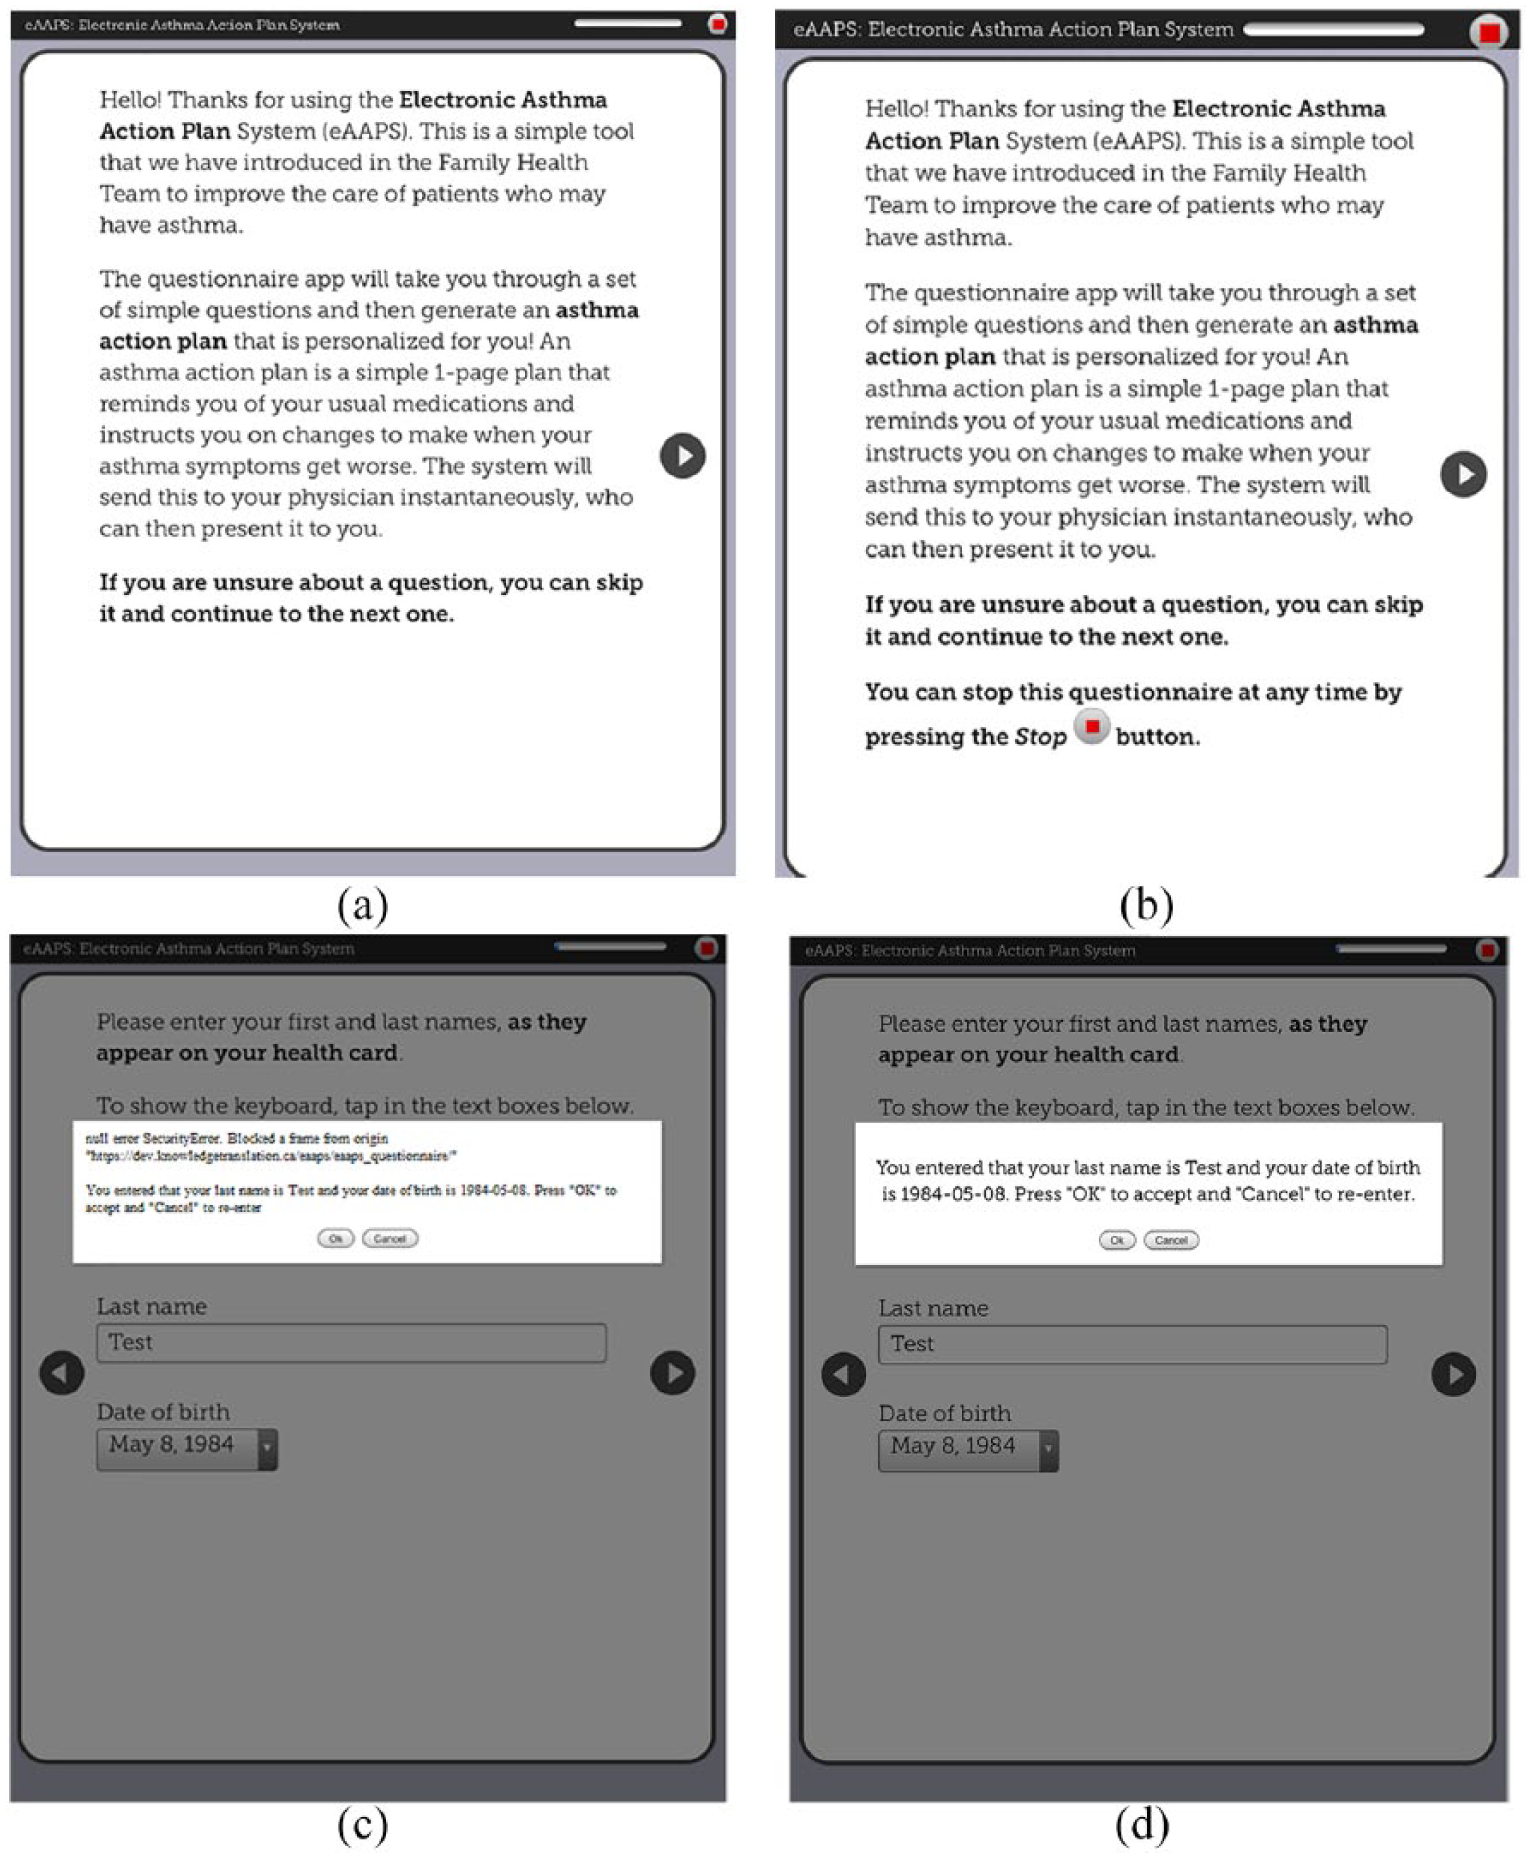
Questionnaire design modifications: (a) original introduction screen with small stop button (top right corner), (b) improved introduction screen (with larger stop button), (c) original name and date of birth confirmation message, and (d) improved image of name and date of birth confirmation message (without error message).
Usability
Touch technology
Hygiene
Participants raised concerns about the hygiene of a device being used by multiple patients, some of whom could be seeking care for an infectious illness (“the little kids with the runny noses” (DEV02)) with cough or sneeze that could directly contaminate device surfaces, or spread from mouth/eyes to hands and then to the device (participants could “… see the fingerprints” (DEV04)). A proposed solution was to use an antimicrobial screen wipe. Even those participants who did not share this particular concern conceded that “it’s something that others would appreciate …” (DEV07).
Familiarity with touch screen technology
Certain users expressed concerns that patients without touch screen technology familiarity could have difficulties with tasks such as launching the keyboard for text entries and advancing between screens. They recommended navigation cues for novice users: “[Add] a memo with how to bring up the keyboard, maybe with a picture for people who don’t understand” (DEV02).
Ease of use of touch screen
Ease of use of the touch screen itself was a concern, and using fingers in particular was believed to be less comfortable and efficient than a stylus: “It looks like a pen but it has a little tip at the bottom that is soft and you just touch everything with that. It’s very efficient.” (DEV01)
Although it was acknowledged that most users would be habituated to using fingers on a touch screen, it was believed that a stylus might enable faster questionnaire completion and reduce inadvertent touches and juxtaposition errors (i.e. when two options are close together and the wrong one is accidentally chosen).
Questionnaire design
Visual characteristics (fonts, images)
Participants expressed a desire for “truer” image colors and larger image and font sizes: “… this [medication image] could be a bit bigger.” (DEV17) “It doesn’t need to be bold, maybe bigger so that you can understand right away.” (DEV05)
However, no further concerns were raised, even by subjects with visual impairment, after we increased the font size to 12 points: “Well, as I said, I am diabetic and I have bad sight … And I have no problem with the fonts …” (DEV08)
Navigation
Design factors influenced the ease of navigating through the questionnaire. For example, participants in the first focus group had difficulties pressing radio buttons (this issue did not recur in the subsequent sessions, following their enlargement). Choosing medication images, which were initially designed as “press-to-select,” was not intuitive to participants: “I didn’t know what to do, because I was looking for the checkmarks boxes … I didn’t know if I had to choose the picture or the word.” (DEV07)
Similarly, a “Stop” button, which enabled users to save existing answers and terminate the questionnaire, was initially missed and required enlargement and emphasis (Figure 2(a) and (b)), while a pop-up to confirm a user’s name and date of birth was misinterpreted as an error message, therefore requiring reformatting (Figure 2(c) and (d)).
Discussion
We used an iterative design process to design a highly usable touch screen tablet questionnaire for use by asthma patients in the clinic waiting room. Although clinical use of patient e-questionnaires is growing rapidly, 32 there are few prior reports of systematic questionnaire development processes and limited data on patient usability preferences for touch screen questionnaires. 15
Our rapid-cycle design approach enabled us to achieve a summative SUS score of 84.2. This score was well above the reported mean of 68 across web-based systems and corresponds to a subjective usability rating of “excellent” and percentile rank of 95 percent (i.e. higher perceived usability than 95% of other systems).33,34 This was supported by favorable user ratings of design features including layout, fonts, colors, and navigation features such as drop-downs, arrows, scroll-bars, and text data entry (Figure 1). In exit questionnaires, half of our users provided a neutral response when asked if they were able to zoom in and out of the screen. Although zooming was enabled, we believe that most users may not have even attempted to zoom, given that font size was optimized after the first focus group and 84.2 percent of all users found the font easy to read (Figure 1).
Our analysis uncovered usability findings that may have broad relevance for design and implementation of touch device questionnaires. The first main theme was “touch technology.” Here, users raised concerns that the device might act as a vector for infectious disease transmission (“hygiene”). Although transmissibility of infections through patient-facing touch devices has not been studied, mobile devices used by healthcare workers have been shown to carry nosocomial bacteria. 35 Given that these organisms are comparable to those isolated from workers’ hands, it is reasonable to assume that a waiting room touch device would similarly become contaminated with pathogens on patients’ hands. 36 Previous studies have shown that even magazine covers in general practice waiting rooms can carry pathogenic bacteria. Irregular surfaces near tablet speakers and connecting ports allow for fluid ingress and debris buildup, increasing the magnitude and persistence of contamination.35,36 We addressed this by providing disinfectant wipes for use before and after device manipulation (as has been recommended for clinician-facing devices). 35 Previous studies have shown that most conventional wipes do effectively disinfect iPad screens without causing screen damage, and some have prolonged efficacy after a single use. 37 Additional strategies would be to set a device alarm to remind staff to periodically disinfect the device (e.g. hourly), to reinforce hand hygiene maneuvers before and after device use, and to set screen saver reminders. 35 It is also of interest that certain users recommended providing a stylus to simplify use (“ease of use of touch screen”). Although a previous study did not demonstrate usability constraints in patients with arthritis, others have also suggested that certain patients prefer a stylus for touch screen questionnaires, and this option should be made available to any user.15,38 Participants also indicated that functions such as accessing the device keyboard and swiping to advance the screen might not be intuitive to all users (“familiarity with touch screen technology”). Accordingly, we added simple instructions regarding these features on the home screen. Previous studies have demonstrated user difficulties with small keyboards on personal digital assistants. However, modern touch screen keyboards have been shown to be well accepted and easy to use across patient types, and we did not identify any usability concerns with the keyboard itself. 39
The next main area was “questionnaire design.” In relation to “visual characteristics,” we originally used a 10-point font size and relatively small medication images in order to eliminate the need for scrolling, which may prolong completion time and lead to missed content. 24 However, feedback indicated a need to increase font and image sizes. Font sizes of 11 or 12 points have previously been recommended to maximize legibility (particularly for older users).40,41 Given that legibility is a primary usability consideration, we compromised by increasing image sizes and the font size (to 12) and either dividing pages into two or occasionally requiring some scrolling.
Participants completed our questionnaire in a mean of 11.7 ± 5.9 min. The large observed standard deviation was attributable not only to the widely ranging tablet device familiarity but also to the diversity of asthma itself among the included users, introducing variability in the length and complexity of the questionnaire. We believe that a vast majority of patients would be able to complete this questionnaire during a typical medical waiting room interval. Primary care waiting room time averages 28.4 ± 18.9 min in the United States, with 62 percent of patients waiting at least 15 min and 85 percent at least 9.5 min.16,42 Given that a typical primary care physician visit lasts around 10–15 min, utilizing this waiting room time effectively doubles the available time for information collection. 43 Furthermore, it has been shown that perception of wait room time is inversely correlated with patient satisfaction, and being occupied during the wait markedly increases satisfaction independent of duration. 43
Integrating waiting room touch screen questionnaires into the process of care can also improve quality of care. First, they enable use of standardized and validated disease-specific questionnaires and minimize missing data. 44 This is particularly important because physicians often forget or lack knowledge regarding appropriate disease-specific questions. Second, repeated use of such validated tools enables objective monitoring of disease progression and/or treatment effectiveness over time. Third, questionnaires may increase data accuracy, particularly in sensitive areas where patients may be reluctant to answer honestly in face-to-face interviews, such as substance abuse or medication adherence.44,45 Fourth, electronic questionnaires reduce clinician time required for data collection, particularly when tablet data are directly integrated into the electronic medical record. 43 Data may also be processed through a clinical decision support system, enabling real-time decision support, 13 as occurs in our tool. 21 Questionnaires also present an opportunity for delivery of education and healthcare advice to patients, and to enable patients to set their goals prior to seeing the doctor, which increases patient satisfaction.43,46,47 Finally, questionnaires can be used to coach patients to deliver physician prompts—a quality improvement strategy called patient-mediated knowledge translation.43,48 It is also of note that, although paper questionnaires can offer some of these advantages, electronic questionnaires have been found to be more efficient, potentially less expensive over the long term, less prone to missing data and erroneous data entry, and perceived more favorably by patients across age groups.1,13,15,38,49–51
The overall implication of our study is that by addressing patient preferences, it is feasible to design a highly usable touch tablet questionnaire for collection of data in the clinical waiting room. Specifically, developers should consider provision of antimicrobial wipes; availability of a stylus; provision of basic written instructions on how to type into and navigate through the questionnaire; use of bolding for emphasis and large image and font sizes (at least 11 or 12 points); and use features such as radio buttons, check boxes, and explanatory information in a hover dialogue for unintuitive terms and icons.
Our study has several limitations. We had a small sample size (20 participants). However, studies have demonstrated that up to 80 percent of usability issues can be identified with 5–8 participants, and we had pre-set stopping criteria which were met after five focus group sessions.27,52 We also recruited participants with varied ages, levels of education, and tablet device familiarity, suggesting that findings may be broadly applicable. Similarly, the Apple iPad is one of the most widely used tablet devices by healthcare professionals and represents about 70 percent of the nearly 100 million tablets in use worldwide.35,53 Furthermore, our usability findings relate to features that are common between tablets and smartphones and may also be applicable to the development of smartphone-based questionnaires. However, the small size of individual focus groups did not allow us to analyze and compare quantitative data (SUS scores, Likert-type scale questions) iteratively, and these data are thus only presented in summative form.
Conclusion
The use of patient-facing electronic questionnaires has many potential advantages and is gaining popularity across diseases and settings, particularly as the importance of patient-reported outcomes has grown. 54 We successfully designed a highly usable touch tablet–based patient questionnaire. Given the importance of interface and application design in determining system uptake across a wide range of user types and in complex settings, we believe that our usability-related findings can be applied to optimize the future design and implementation of touch screen questionnaires across diseases. Our successful rapid-cycle design process can also be adopted by others. Future studies should measure factors that influence the real-world uptake of such tools and use these to develop and test strategies to optimize clinical workflow integration in various settings.
Footnotes
Acknowledgements
We would like to acknowledge Susan Hall and Lucy Frankel for their contributions to this work.
Declaration of conflicting interests
The author(s) declared no potential conflicts of interest with respect to the research, authorship, and/or publication of this article.
Funding
The author(s) disclosed receipt of the following financial support for the research, authorship, and/or publication of this article: Funding was provided by Canadian Institutes of Health Research (CIHR; 234365 and 322013), the Ontario Lung Association, and the Keenan Research Summer Student Program. Dr. S.G. was supported by The Michael Locke Term Chair in Knowledge Translation and Rare Lung Disease Research. Dr. M.K. was funded by a CIHR New Investigator Award. Dr. S.S was supported by a Tier 1 Canada Research Chair in Knowledge Translation and the Mary Trimmer Chair in Geriatric Medicine.