
Abstract
Recently, many neural network models have been successfully applied for histopathological analysis, including for cancer classifications. While some of them reach human–expert level accuracy in classifying cancers, most of them have to be treated as black box, in which they do not offer explanation on how they arrived at their decisions. This lack of transparency may hinder the further applications of neural networks in realistic clinical settings where not only decision but also explainability is important. This study proposes a transparent neural network that complements its classification decisions with visual information about the given problem. The auxiliary visual information allows the user to some extent understand how the neural network arrives at its decision. The transparency potentially increases the usability of neural networks in realistic histopathological analysis. In the experiment, the accuracy of the proposed neural network is compared against some existing classifiers, and the visual information is compared against some dimensional reduction methods.
Introduction
Recent surge in deep learning has naturally found many applications in medical field, mainly in histopathological diagnosis.1–4 The increasing number in applications of deep neural networks for medical science is due to the availability of vast health records of many persons over many years, the availability of fast processors, and the increasing power of neural networks, mainly deep models5–7 to learn from those vast data. A nice review of the applications of deep models into histopathological diagnosis is given in Ravi et al. 8 It can be expected that in the near future, machine learning will play increasingly important roles in medical and clinical sciences. Currently, in medical fields, neural networks are primarily trained with past data of patients and then used to diagnose and predict the future pathological state of new patients. Some studies already report on human–expert level accuracy for cancer predictions.9,10 Unfortunately, for most of the neural networks, the high prediction accuracy is not accompanied by transparency in explaining their decisions. They have to be treated as black box and thus do not offer any insight on how they generate their decision from the given inputs. For many applications like game playing, 11 the intransparency of neural networks is not important, but in the explainability-required medical field, the inability of the neural networks to give explanations on their decision may hinder their further usage in realistic clinical settings.
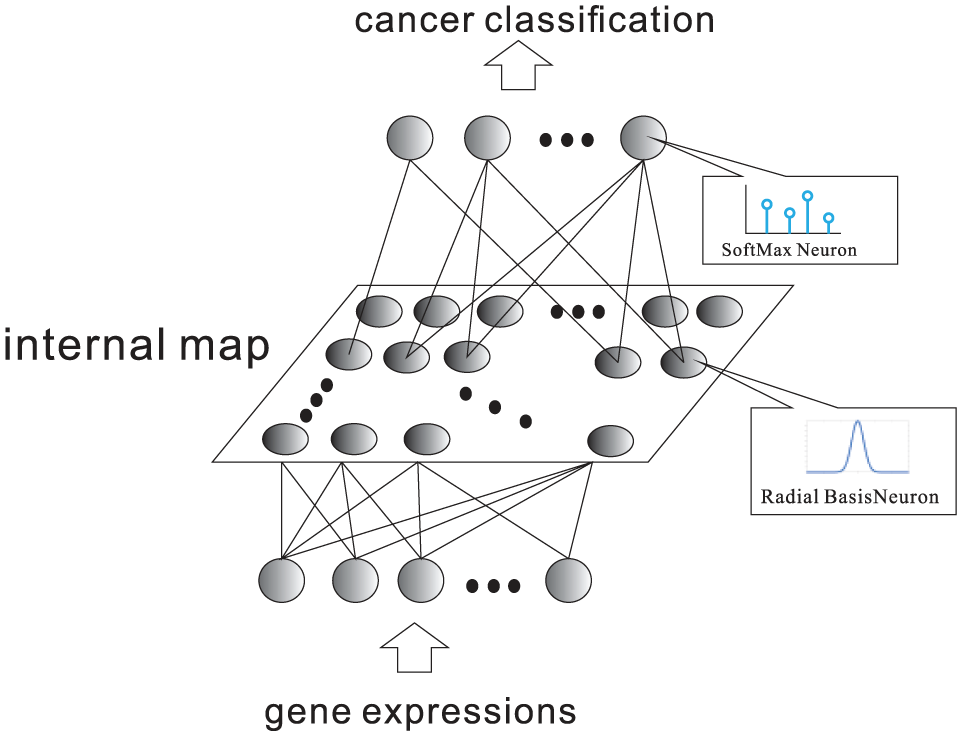
In this research, a model of neural network that offers transparency is applied to cancer microarray data sets. The proposed neural network, Softmax restricted radial basis function networks (S-rRBF) 12 is modified from the previously proposed restricted radial basis function networks (rRBF).13–15 The modification allows the new model to learn better and has clearer mathematical description, although these are not the focus of this article. The objective of this article is to apply the S-rRBF for cancer classifications and to explain its ability to offer auxiliary visual information that supports its classifications. The S-rRBF is a supervised hierarchical neural network, in which in its internal layer, neurons are arranged in two-dimensional (2D) grid, similar to Kohonen’s self-organizing maps (SOMs).16,17 During the learning process, the internal layer is self-organized in a unique way, in which, as opposed to the conventional SOM, the S-rRBF forms an internal representation that preserves the topological structure of the inputs in the context of their class labels. As the internal layer is organized to enable the network to optimize its classification accuracy, the internal layer provides information on how the network arrives at its classification decisions. Furthermore, due to its low dimensionality (2D), the internal layer can be visualized. The visualization of this internal representation, as a kind of map, complements the classification decision of the S-rRBF. As opposed to most supervised neural network models, the S-rRBF is transparent, in which it provides intuitive explanation through visualization on its decision process. It allows the users to understand why a certain problem is easy or difficult. In this research, the S-rRBF is trained with cancer microarray data sets obtained from Gene Expression Model Selector.18–20 These data are multi-class, high-dimensional (ranging from a few thousands to tens of thousands dimensions), small in size and imbalanced, which make them challenging to learn. This article explains about the preliminary results on the ability of the proposed model to generalize from these data and to provide visual explanations about them. The experimental results show that the S-rRBF can potentially improve the usability of neural networks in real-world settings where accuracy should be paired with explainability, mainly in histopathological diagnosis.
The article is organized as follows. The first section is for briefly explaining the dynamics of the S-rRBF. It will be followed by a section explaining the experiment results, while the conclusions and future works will be discussed in the final section.
S-rRBF
The S-rRBF 12 is modified from the previously proposed rRBF. S-rRBF is a hierarchical supervised neural network as illustrated in Figure 1. The internal layer of the S-rRBF is composed from a set of neurons arranged in 2D grid in a similar way as the Kohonen’s SOMs. The low-dimensional internal layer allows the visualization of the internal structure of this hierarchical neural network and offers auxiliary intuitive information on its decision process. Hence, as opposed to many existing classifiers, the S-rRBF is not a black box, in which it provides visual explanation for the given problem.
Outline of S-rRBF.
Here, the S-rRBF is trained to classify a high-dimensional input,
Given input,
In equation (1),

where
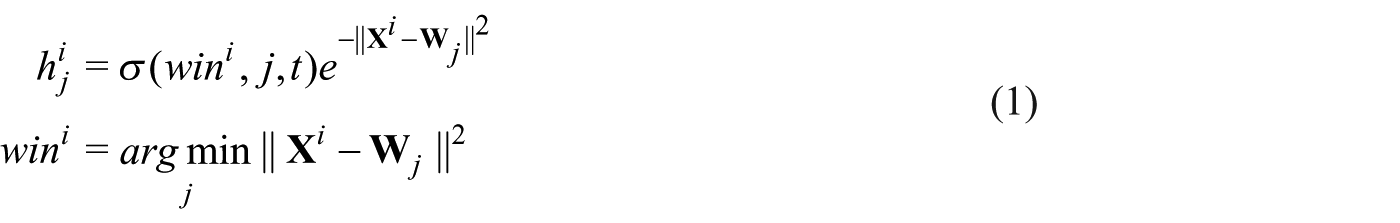
The activation function of a hidden neuron in S-rRBF is similar to that of radial basis function networks (RBF),
21
except that in S-rRBF, it is topologically restricted by the neighborhood function
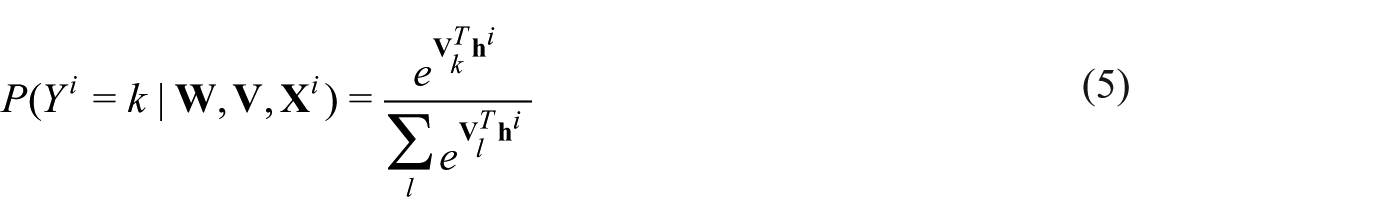
The outputs of the hidden neurons are then propagated to the output layers, where the kth output,

Here,
While the original rRBF adopts sigmoidal neurons, the S-rRBF replaces it with Softmax function that indicates the conditional probability that the S-rRBF classifies input
The S-rRBF is then trained to minimize the cross entropy defined as follows
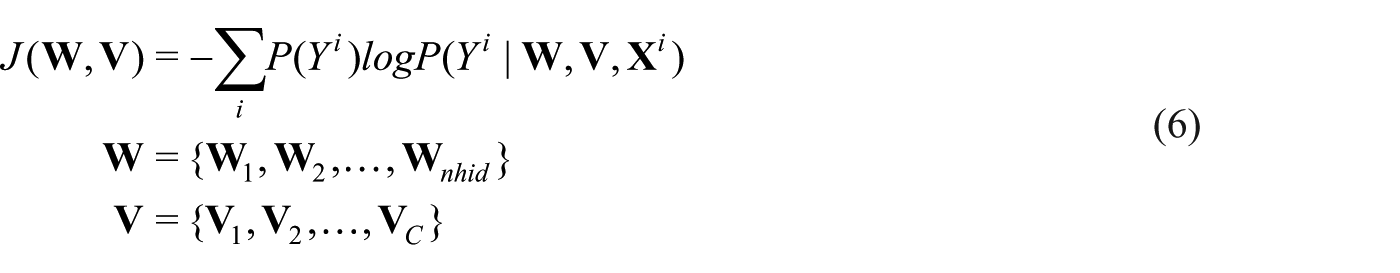
In equation (6),
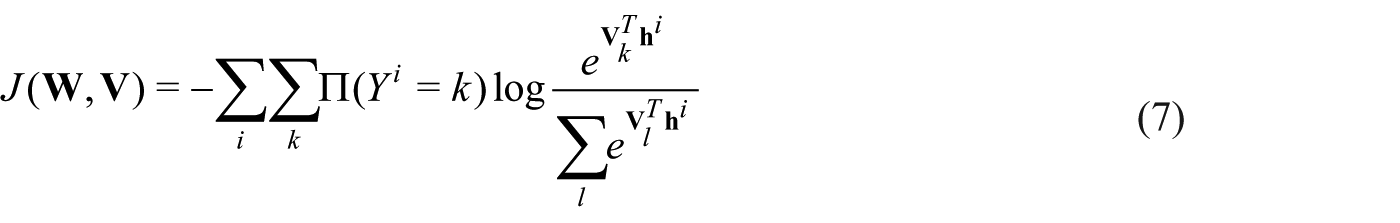
In equation (7),
Here, it is assumed that the true class of the input
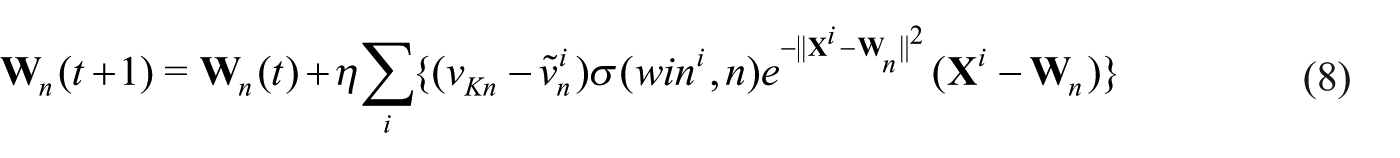
The reference vector modification in equation (8) significantly differs from that of SOM, in which it includes a term
Experiments
The data sets for experiments in this article are cancer microarray data sets obtained from Gene Expression Model Selector.18–20 The data configurations are given in Table 1, showing the number of samples, the dimensions of the inputs, the number of classes, and the class distribution for each data set. It is clear that with respect to class distribution, many data sets are imbalanced. For example, data set Brain Tumor 1 should be classified into five classes, in which the first class accounts for 66.7 .percent of the data, the second class accounts for 11.1 percent, and the fourth class accounts for only 4.6 .percent of the data. The relatively small data sizes and the imbalanced data set in class distributions make the learning task challenging.
Data configuration.
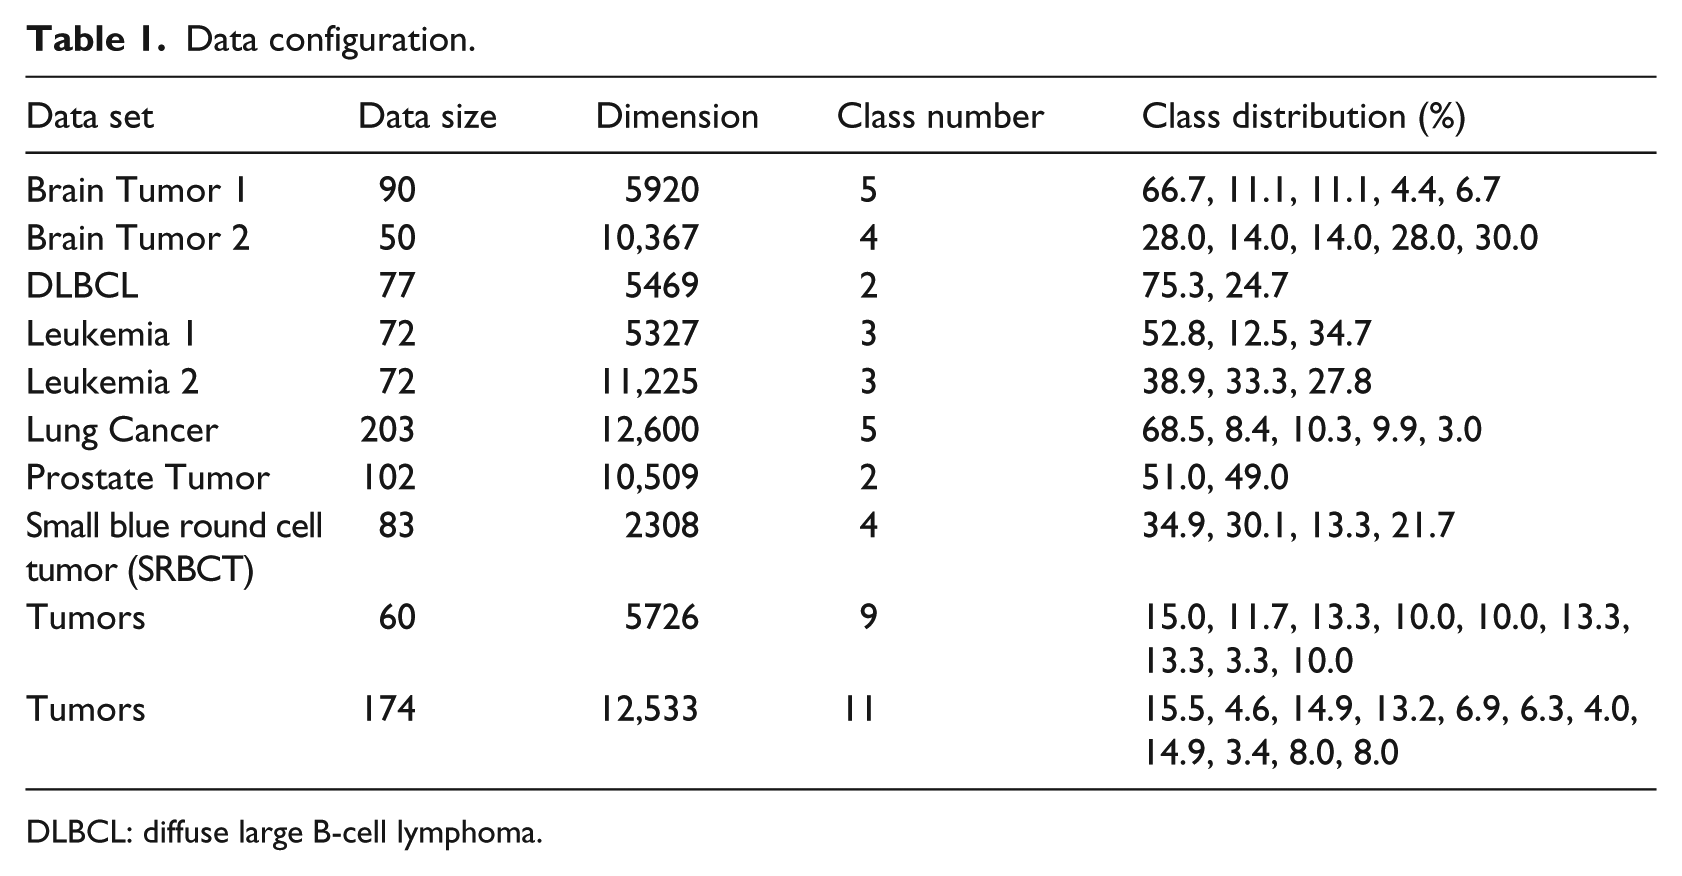
DLBCL: diffuse large B-cell lymphoma.
The classification accuracy of the S-rRBF is compared against two simple deep models, stacked autoencoders (SAEs)22–24 and multilayered perceptrons (MLPs) with rectified linear unit (ReLU) as the activation function,25–27 and the conventional nearest neighbor classifier 28 for a wide range of cancer classification problems based on microarray. Table 2 shows the average error rates together with their standard deviations in the bracket obtained over 15-cross-validation test. The error of the best performing classifier is highlighted with bold and the worst performing one in italic. Table 2 shows that the S-rRBF does not always outperform other classifiers. However, for most of the problems, its performances are never far from the best performing classifiers, showing the reliability and stability of S-rRBF against wide range of problems. From the table, both the S-rRBF and SAEs offer the best classification rates for four of the problems. However, when they are not selected as the best performers, in general the performance of the S-rRBF is better than that of SAE. Furthermore, the internal layer of the S-rRBF offers auxiliary visual information that is not offered by other methods.
Error rate (%) (standard deviation).
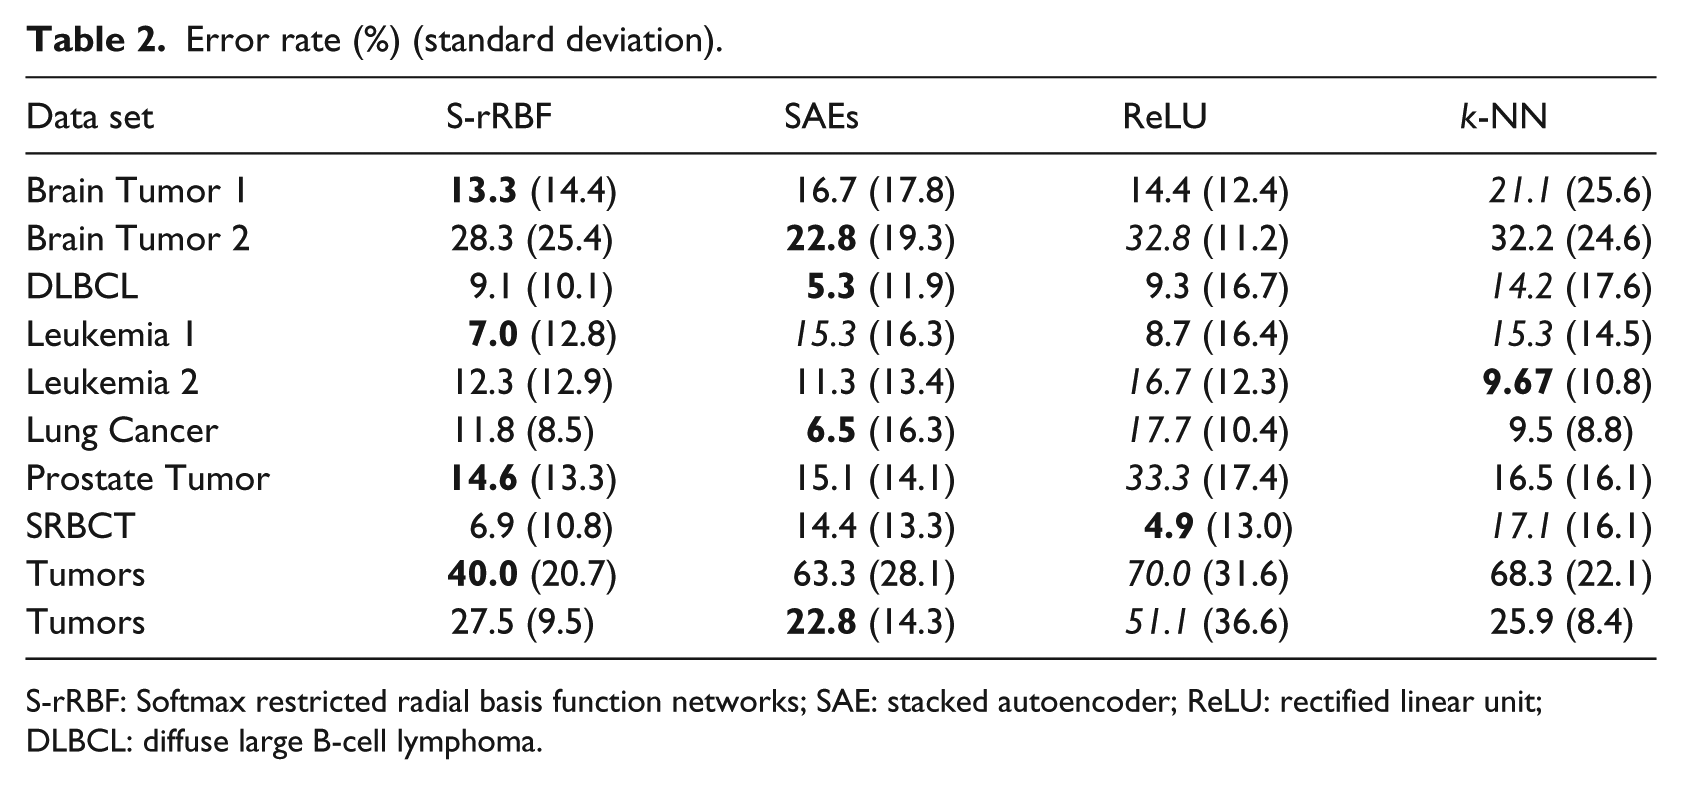
S-rRBF: Softmax restricted radial basis function networks; SAE: stacked autoencoder; ReLU: rectified linear unit; DLBCL: diffuse large B-cell lymphoma.
To show the uniqueness of the visualization of S-rRBF’s internal representation, some of the problems are visualized using other dimensional reduction methods, kernel principal component analysis (K-PCA),29,30 t-distributed stochastic neighborhood embedding (t-SNE),31,32 and the Kohonen’s SOM. 16
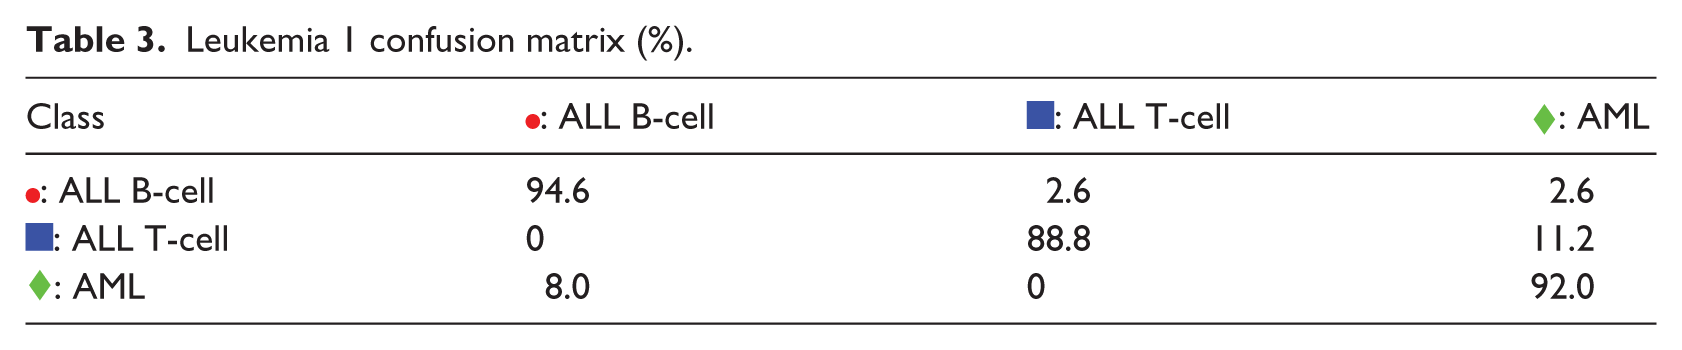
Figure 2 shows the 2D representations of Leukemia 1 problem. It can be observed that the internal map of the S-rRBF in Figure 2(d) shows better separability between the samples belonging to three classes, compared to the other maps. In recent years, t-SNE is considered to be one of the best dimensional reduction methods that very nicely reflect the original structure of the data. The t-SNE map for this problem, shown in Figure 2(b), indicates that the samples for ALL T-cell, marked  , are distributed among the other two classes. This overlapping distribution is likely the cause of classification errors. The overlapping nature of ALL T-cell samples is also reflected in its K-PCA representation shown in Figure 2(a) and (c). Due to its learning process, the S-rRBF generated a 2D internal representation that is at least sub-optimum for the classification task. Figure 2(d) shows that the three classes are better separated, and this map is also consistent with the low error rate of S-rRBF for this problem. In those maps, the size of a marker indicates the number of samples represented by the marker, and a × in the maps indicates a representation of two or more samples from conflicting classes, hence some samples in its vicinity are likely to be misclassified.

Leukemia 1: (a) kernel PCA, (b) t-SNE, (c) SOM, and (d) S-rRBF.
The validity of the visual information offered by the S-rRBF representation is evaluated against a confusion matrix shown in Table 3. The component
Leukemia 1 confusion matrix (%).
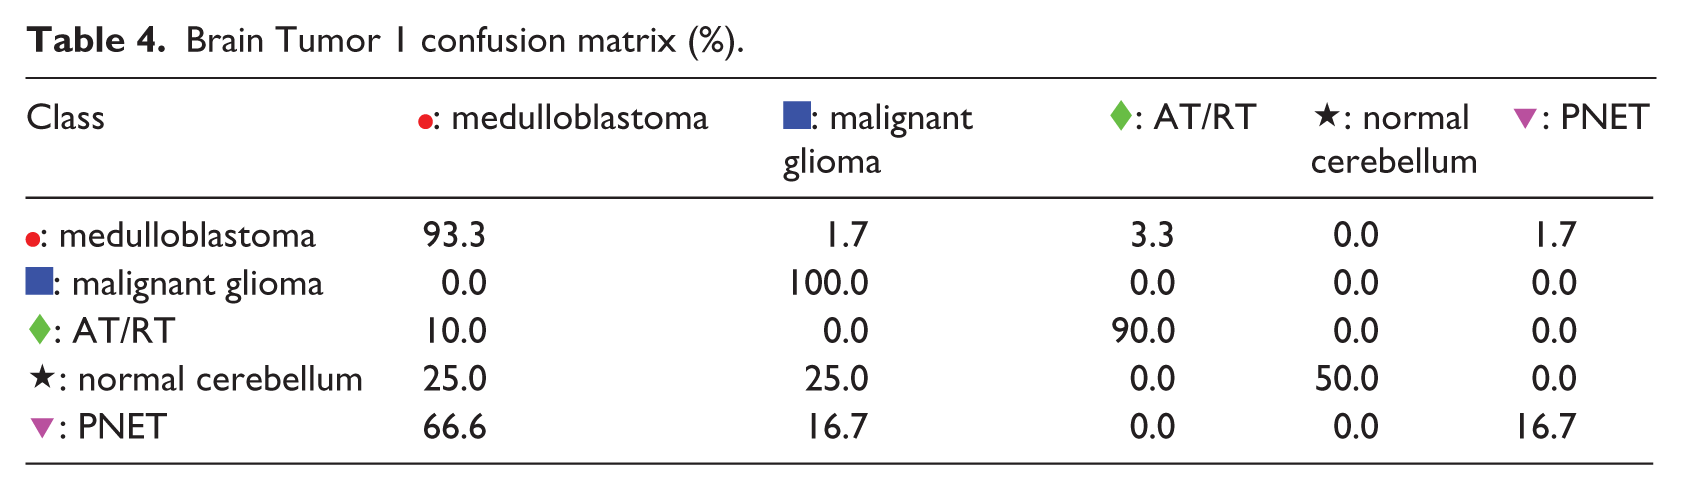
The second example is the Brain Tumor 1 problem. From Figure 3(a), it can be observed that K-PCA does not generate 2D representation with good separability. The representations of t-SNE and SOM in Figure 3(b) and (c) also indicate that there are many overlapping samples with conflicting classes. The internal representation of S-rRBF shows that the lower part of the map is dominated by the : medulloblastoma samples, hence classification of samples in this part is likely to be easy, which is consistent with high classification rate of medulloblastoma as apparent from the confusion matrix in Table 4. Most of the misclassifications occur in the upper half of the S-rRBF representation due to the neighboring samples from the conflicting classes, indicated especially by the large confusions in the fourth and fifth rows of the confusion matrix in Table 4.
Brain Tumor 1: (a) kernel PCA, (b) t-SNE, (c) SOM, and (d) S-rRBF.
Brain Tumor 1 confusion matrix (%).
 : PNET
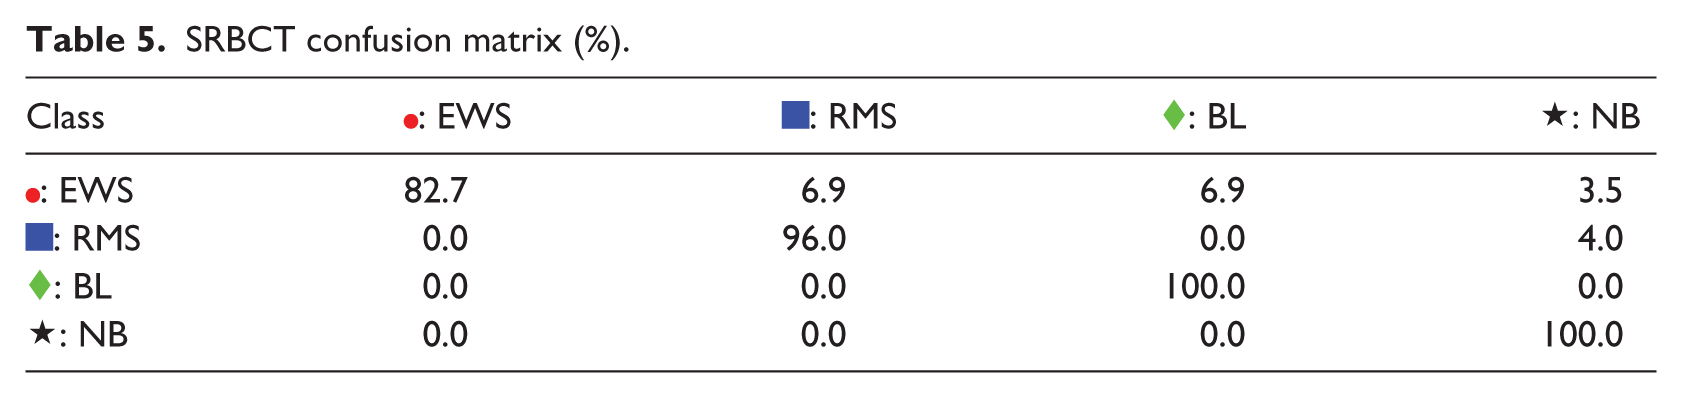
For the third example, SRBCT problem, the S-rRBF is slightly outperformed by ReLU MLP. However, the S-rRBF offers informative visual representation as shown in Figure 4(d). As captured by the K-PCA and t-SNE representations in Figure 4(a) and (b), respectively, the original structure of this problem includes many samples with overlapping classes, which is also consistent with some , , and  are mapped very close to each other, causing Ewing Sarcoma (EWS) to be misclassified as Rhabdomyosarcoma (RMS) or Burkitt Lymphoma (BL) as shown in the first row of the confusion matrix in Table 5. The close
  and in the top right of the map is responsible for misclassification of the first class as indicated by the first row of the confusion matrix.
SRBCT: (a) kernel PCA, (b) t-SNE, (c) SOM, and (d) S-rRBF.
SRBCT confusion matrix (%).
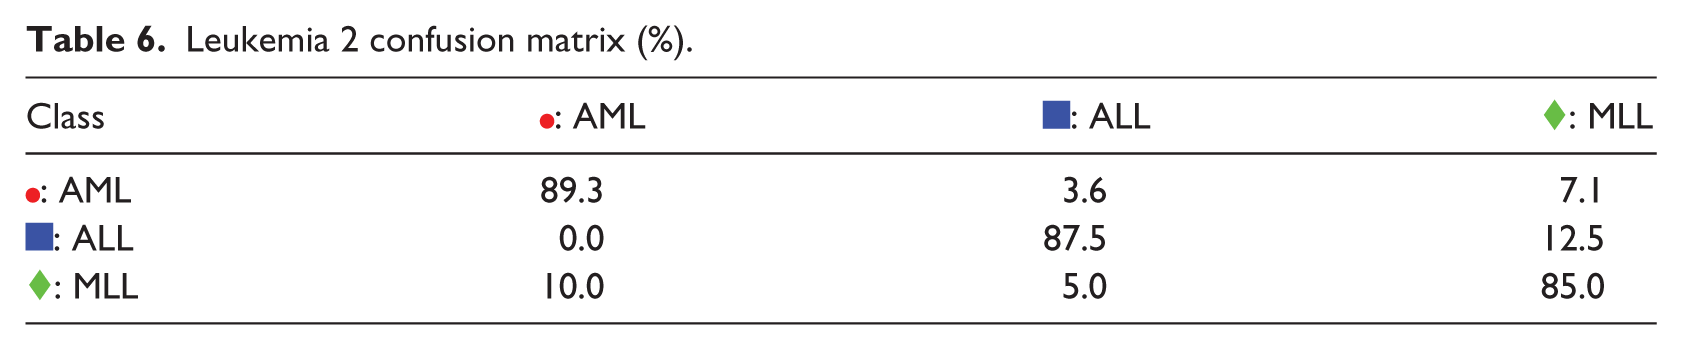
The fourth example is the Leukemia 2 problem. K-PCA, t-SNE, and SOM representations, in Figure 5(a)–(c), show that the three classes are overlapping among each other. It is also clear that the : MLL samples are truncated into two clusters that sandwich : ALL samples between them. These characteristics are also nicely captured by the S-rRBF representation, in Figure 5(d), that also shows that there is an area where : MLL and : ALL samples are overlapping with each other. The visualization of the S-rRBF consistently explains the confusion matrix in Table 6 where confusions are apparent especially in its second row.
Leukemia 2: (a) kernel PCA, (b) t-SNE, (c) SOM, and (d) S-rRBF.
Leukemia 2 confusion matrix (%).
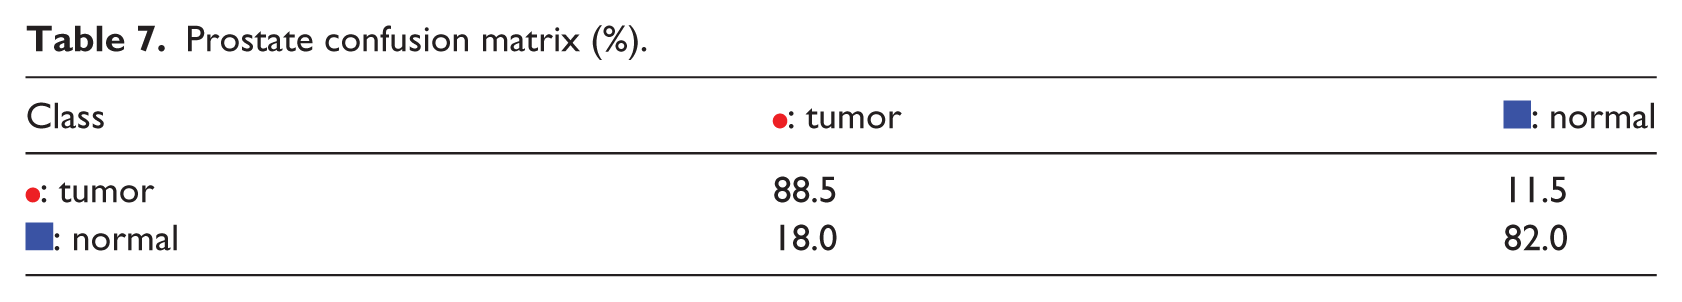
The fifth example is the Prostate problem. The difficulty in this problem is illustrated by the appearances of the K-PCA and t-SNE representations, in Figure 6(a)–(b), where there are many overlapping samples from the two different classes. The problem’s difficulty is also obvious in SOM, in Figure 6(a), where there are many
Prostate: (a) Kernel PCA, (b) t-SNE, (c) SOM, and (d) S-rRBF.
Prostate confusion matrix (%).
The next example is Brain Tumor 2 problem, in which S-rRBF is not the best classifier. Here, the low-dimensional representations for this problem of K-PCA, t-SNE, and SOM are shown in Figure 7(a)–(c), respectively, where it can be observed that there are many overlapping samples belonging to different classes, indicating that this is a hard classification problem. The internal representation of the S-rRBF, shown in Figure 7(d), is consistent with the confusion matrix shown in Table 8, for example, in visualizing the imbalanced representation of : classic anaplastic oligodendrogliomas and hence its low classification rate, as clearly indicated by large confusions in the second row of the matrix.
Brain Tumor 2: (a) Kernel PCA. (b) t-SNE. (c) SOM. (d) S-rRBF.
Brain Tumor 2 confusion matrix (%).
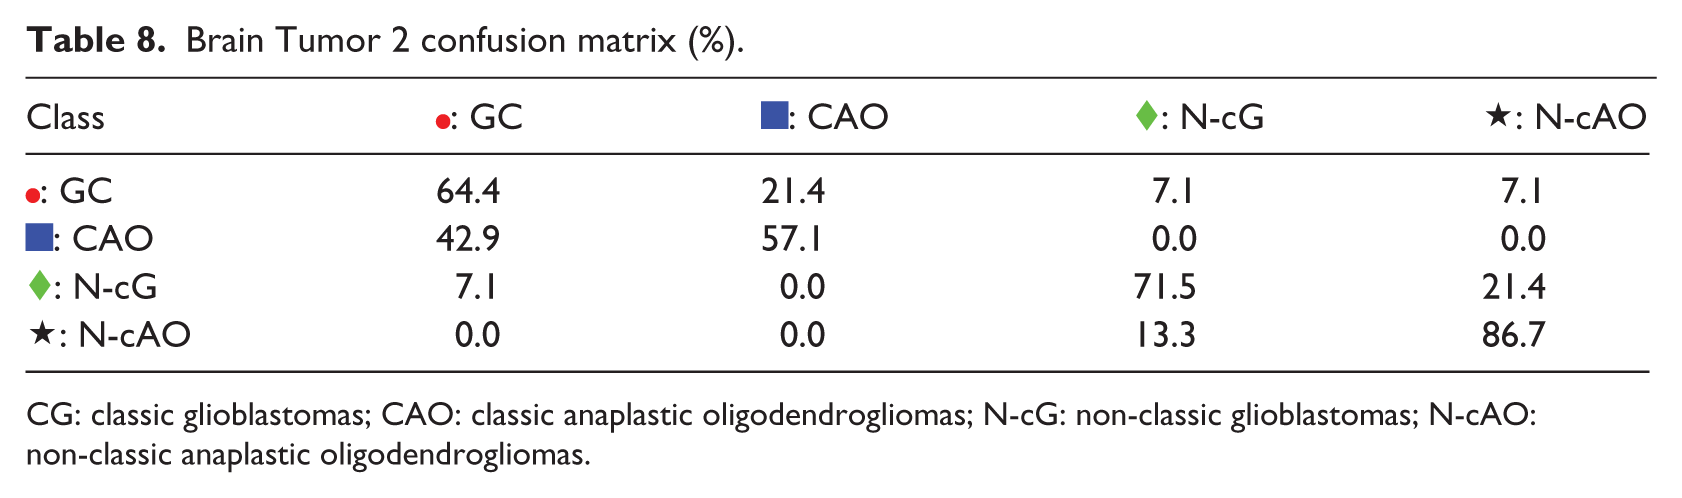
CG: classic glioblastomas; CAO: classic anaplastic oligodendrogliomas; N-cG: non-classic glioblastomas; N-cAO: non-classic anaplastic oligodendrogliomas.
The final example is diffuse large B-cell lymphoma (DLBCL) problem, in which K-PCA, t-SNE, SOM, and S-rRBF are shown in Figure 8(a)–(d), respectively. In this example, the S-rRBF forms a relatively separable two of the two conflicting classes, in which the imbalance of the data is clearly shown. For this problem, SAE outperforms other methods. The confusion matrix in Table 9 shows that the samples for follicular lymphoma are harder to classify, likely because of the imbalance in the training data.
DLBCL: (a) Kernel PCA, (b) t-SNE, (c) SOM, and (d) S-rRBF.
DLBCL confusion matrix (%).
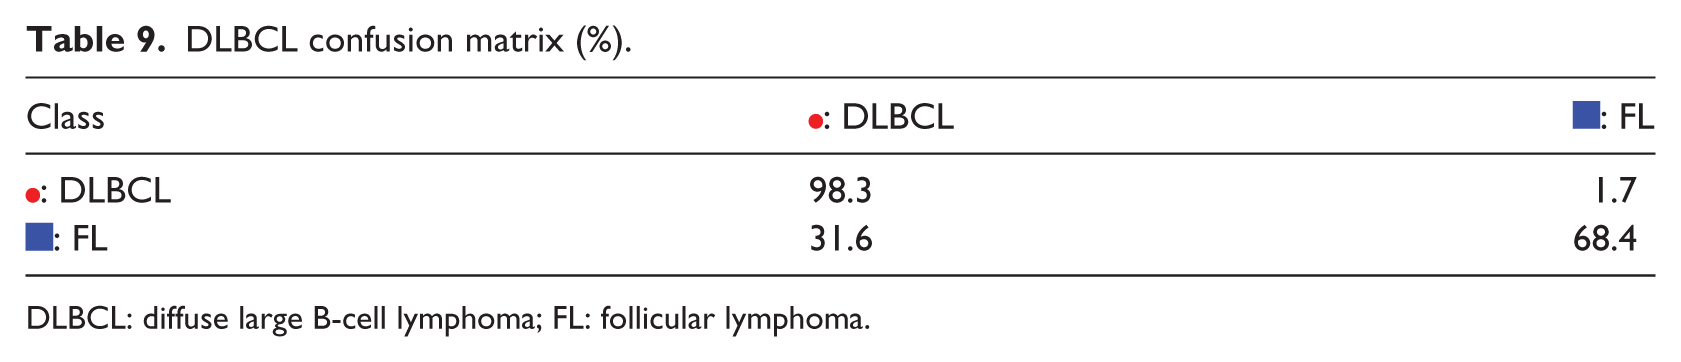
DLBCL: diffuse large B-cell lymphoma; FL: follicular lymphoma.
In the examples above, the S-rRBF provides descriptive visual information in intuitively explaining its decisions. The visualization of the internal layer of the S-rRBF is visually more informative compared to other models, due to the learning algorithm of the proposed model. While in other dimensional reduction algorithms, the dimensions of the inputs are reduced independent of their class labels, in the proposed S-rRBF the dimensional reduction is an integrated part of its learning mechanism that naturally takes the class labels into account. The primarily mathematical property for the integrated dimensional-reduction-learning mechanism is expressed in the reference vector modifications in equation (8). Here, the modification encodes the information for the class labels into the 2D internal organization of the neural network, generating visual maps that are highly relevant with its decision process.
Conclusion
In this study, a cancer classifier trained on small and imbalanced data set is proposed. As opposed to most of the existing supervised neural networks that offer no transparency in their decision process, and thus have to be treated as black box, the proposed S-rRBF offers visual information on its internal layer. This auxiliary information complements the classification decision of the S-rRBF in intuitive manner, in which it explains why a problem is hard or easy to classify. It is intuitive to see that a new input that falls into areas where there are overlapping samples that belonging to conflicting class is hard to classify, while one that falls in the areas within distinctive clusters of a certain class is unlikely to be misclassified. The proposed visual transparency can potentially improve the usability of neural networks in medical diagnosis, in which not only the classification accuracy but also the explainability are important.
The experiments indicate that the S-rRBF do not outperform all of the compared models on all of the problems. However, when outperformed, its performances were generally close to the best classifier. Considering its generality and transparency, which are not offered by other classifiers, it is reasonable to choose the S-rRBF in wide range of cancer diagnosis problems.
This article reports on the preliminary study to test the reliability and explainability of the S-rRBF against many cancer diagnosis problems. The immediate future task is to integrate the S-rRBF into a diagnosis system that can be used in realistic clinical settings. Currently, the proposed neural network provides visual information but not logical explanation for its decisions. Thus, in the future, it is also important in converting the visual information into more understandable semantics for explaining the neural network.
Footnotes
Declaration of conflicting interests
The author(s) declared no potential conflicts of interest with respect to the research, authorship, and/or publication of this article.
Funding
The author(s) received no financial support for the research, authorship, and/or publication of this article.