
Abstract
Data on disease burden are often used for assessing population health, evaluating the effectiveness of interventions, formulating health policies, and planning future resource allocation. We investigated whether Internet usage and social media data, specifically the search volume on Google, page view count on Wikipedia, and disease mentioning frequency on Twitter, correlated with the disease burden, measured by prevalence and treatment cost, for 1633 diseases over an 11-year period. We also applied least absolute shrinkage and selection operator to predict the burden of diseases. We found that Google search volume is relatively strongly correlated with the burdens for 39 of 1633 diseases, including viral hepatitis, diabetes mellitus, multiple sclerosis, and hemorrhoids. Wikipedia and Twitter data strongly correlated with the burdens of 15 and 7 diseases, respectively. However, an accurate analysis must consider each condition’s characteristics, including acute/chronic nature, severity, familiarity to the public, and the presence of stigma.
Keywords
Introduction
The term “disease burden” refers to the financial, medical, or socio-economic impact of a disease or health problem. 1 Researchers in public health frequently measure the burden of various diseases or health problems across different geographic locations or at different time points, for purposes such as assessing population health, evaluating the effectiveness of interventions, formulating health policies, and planning future resource allocation.
There is no consensus on the best measure of disease burden; the choice often depends on individual value or specific need. One common measure is financial cost. It summarizes the direct and indirect costs due to illness, which can be nontrivial for the low-income population. For example, Paez et al. examined the out-of-pocket expenses, which are the economic burden for patients and their family, for more than 100 chronic conditions in both adults and children. What they revealed was that the annual out-of-pocket expenses increased by 39.4 percent from 1996 to 2005 in the United States, after inflation adjustment. 2
Another measure of disease burden is mortality rate. It counts the number of deaths due to a specific medical condition in a particular population, scaled to the size of that population, in unit time. In one study on the correlation between diabetes and ischemic heart disease (IHD), Laing et al. found that young adult women with diabetes were more than eight times more likely to die of IHD than those without diabetes were. Similar trends were observed among young adult men, older men, and older women; patients with Type I diabetes were found to have a relatively higher IHD mortality rate than patients with Type II diabetes. 3
By contrast, morbidity rate describes the frequency with which a disease occurs in a population and is often calculated by incidence rate and prevalence rate. Incidence rate refers to the proportion of newly diagnosed cases of a disease in a population, while prevalence rate accounts for both newly diagnosed and pre-existing cases of a disease. Corbett et al. found that worldwide, among 0.9 million cases of newly diagnosed adult cases of tuberculosis (TB) in 2000, 9 percent were attributable to HIV. In selected African countries and the United States, 31 and 26 percent of TB cases were attributable to HIV, respectively. However, TB led to about 11 percent of adult deaths from AIDS. 4 This study indicated the comorbidity of TB and HIV and highlighted the need for a targeted intervention strategy in countries with a high prevalence of HIV and TB.
A more sophisticated measure of disease burden is disability-adjusted life years (DALYs). It is defined as the years lived with disability (YLDs) plus the years of life lost (YLLs) owing to a disease or health problem. Both YLDs and YLLs are age-weighted to reflect productivity and societal investment (e.g. years lived as a young adult are valued more than years spent as a young child or older adult). DALYs is the primary measure of disease burdens developed for the most comprehensive worldwide observational epidemiological study to date—the Global Burden of Disease Study, 5 in which researchers have been estimating DALYs among populations of different ages, sex, and countries for more than 200 diseases and causes of death since 1990. Several developed countries, including the Netherlands 6 and Australia, 7 use DALYs to survey and compare their nationwide burden of diseases for public policymaking.
Obviously, each of these established measures of disease burden has its own limitations. The financial cost of a disease, for instance, does not reflect health-related quality of life and untreated cases. 8 Mortality rate does not capture the disease burden prior to death, 9 and in practice, it is often difficult to determine the actual cause of death as it is often the consequence of multiple diseases or injuries. 10 Morbidity does not adjust for the severity and impact of diseases. DALYs require a large amount of time and resources to calculate. This situation has led to many pandemic and rare diseases being left unstudied and made it barely possible to compare the disease burden across a large number of diseases over time.11,12 Furthermore, the estimates of disease burden from different studies sometimes conflict with each other. The prevalence of Parkinson’s disease in Spain was reported to be 1.5, 0.6, and 0.2 percent in 1994, by three separate groups.13–15
In recent years, new data from the Internet have revealed novel utility in different fields. For instance, Ginsberg et al. 16 used some search query keywords describing influenza-like illness on Google to predict influenza epidemics, as they were highly correlated with the actual influenza prevalence data reported by Centers for Disease Control and Prevention. Similarly, Moat et al. 17 identified correlations between the stock prices of 30 Dow Jones Industrial Average component companies and weekly Wikipedia page review data and were able to increase their portfolio return by 65 percent using Wikipedia page review data instead of conventional strategies to build prediction models. As one of the most popular social networking sites in the world, Twitter has also been used to estimate and predict disease burden, especially during the outbreak of pandemic diseases. Signorini et al. 18 demonstrated that Twitter data can be used to track public sentiment about the H1N1 flu and predict its activity during 2009 and 2010, when it was affecting more than 100 countries all over the world. Therefore, we investigated whether mining these new data sources, primarily Google Trends, Wikipedia page review data, and Twitter data, would allow the estimation of disease burden for a large number of diseases in an automated and cost-efficient way. Specifically, we examined the alignment of disease burden in terms of disease prevalence and financial cost for 1633 diseases over 11 years using these three Internet data sources. We also applied the least absolute shrinkage and selection operator (LASSO), a regression method that accomplishes variable selection and regularization, to predict the burden of diseases, using the Internet data along with other variables that we quantified in a previous study 19 for four specific diseases.
Data and methods
Data collection
Google Trends and Wikipedia are two publicly available data sources that record searching and browsing activities related to various diseases and health conditions on the Internet. On Google Trends (https://www.google.com/trends/), users enter one to five key words to retrieve their relative search volume. The upper-right panel of Figure 1 shows the output of querying “breast cancer,” “obesity,” “acne,” “headache,” and “anemia” in the interactive user interface. The x-axis gives the timeline and the y-axis gives the normalized search volume in percentages, where the denominator is the highest search volume among all queried terms in the given time frame (e.g. in Figure 1, the highest search volume is for breast cancer around October 2004). Google Trend also allows users to specify the geographic location, time period, data source category (i.e. Arts & Entertainment, Books & Literature, Health), and the type of search (i.e. web search, image search, news search), or to use their application programming interface (API) for batch queries. In our experiment, these parameters were set to worldwide, from 2004 (earliest available year for Google Trends) to 2014, all categories, and web search, respectively. Furthermore, we developed a two-step strategy to retrieve the relative search volume for 1633 diseases from 2004 to 2014. As shown in the left panel of Figure 1, the first step was to find the disease with the highest search volume during the defined time framework among all our diseases of interest and set it as the baseline disease. Thereafter, we categorized all the diseases into five disease groups, with the baseline disease inserted into each group, and queried Google Trends again (shown on the right panel, Figure 1). Hence, the normalization denominator for each group was the same. Wikipedia provides a simpler API that allows us to download the weekly page review counts of each disease term from 2008 to 2014. We computed the annual Wikipedia review counts by adding up all 52 weeks of a year.
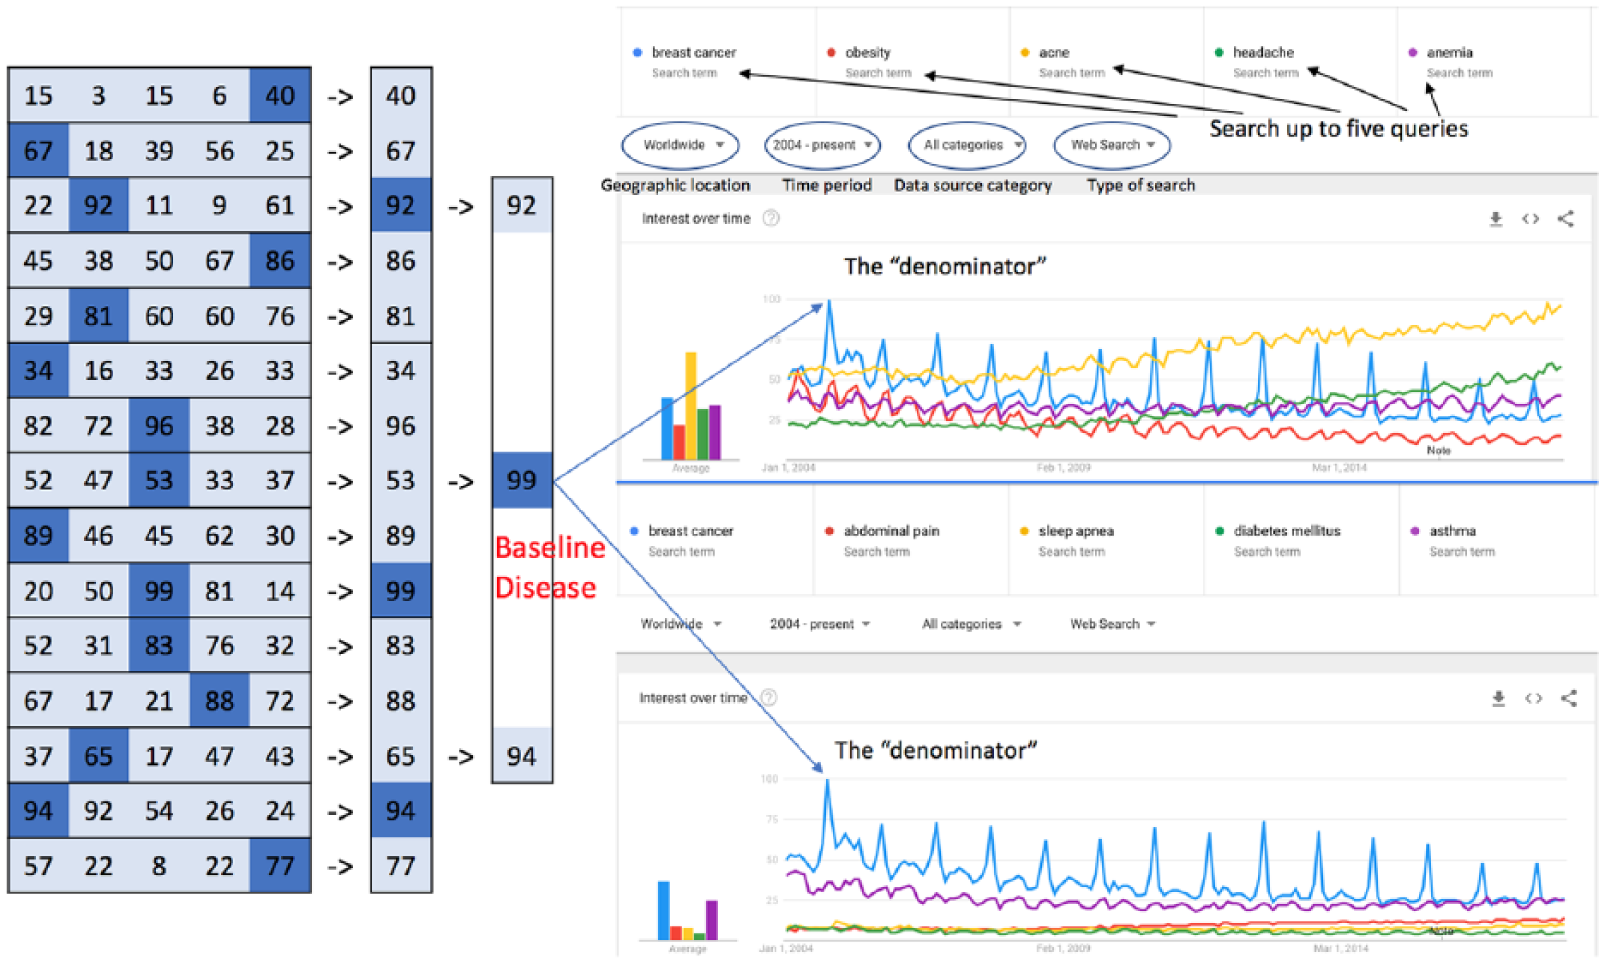
Strategy to retrieve relative search volume from Google Trends for 1633 diseases.
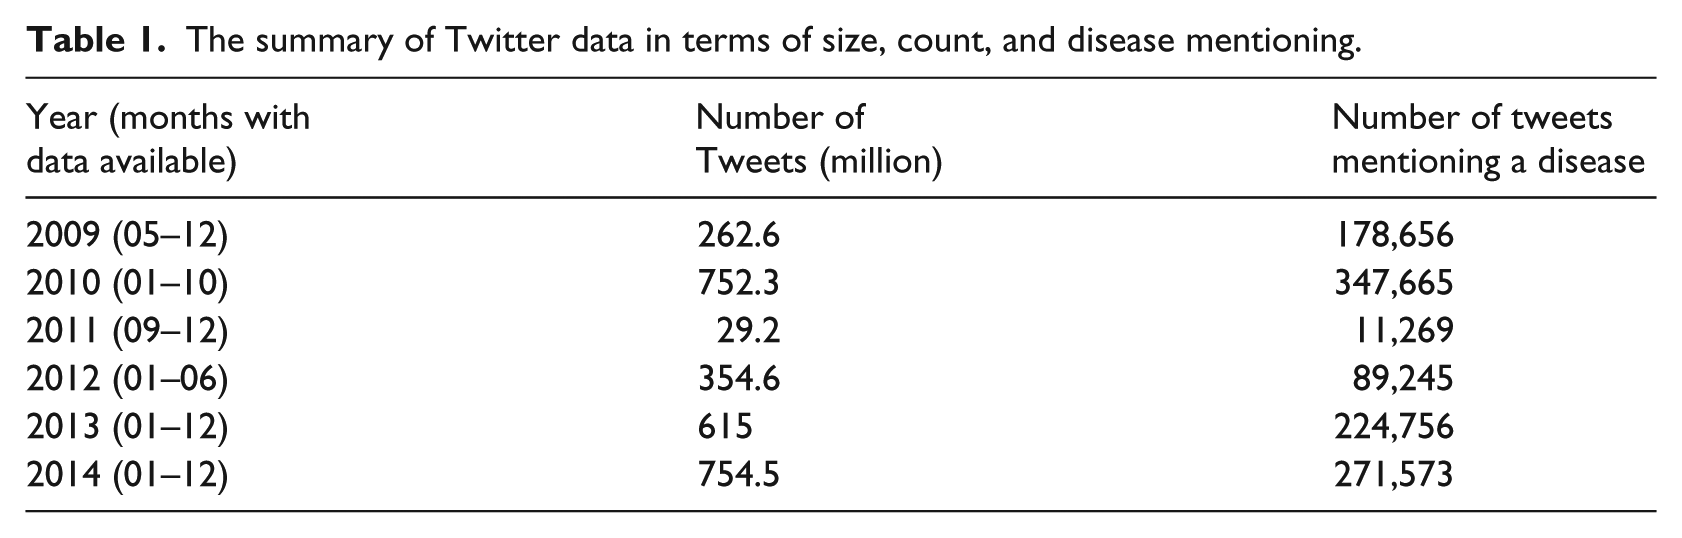
Since the foundation in 2006, Twitter has generated huge amount of data, which has been analyzed to provide insights about the public interest or concern in different diseases. In this work, we analyzed the tweets in 52 months (see Table 1), which were obtained through https://archive.org/details/twitterstream. With non-English posts removed, we analyzed a total of 2.77 billion tweets, which was 410 Gigabytes. To search for disease mentioning throughout a large dataset like this, both algorithmic efficiency and computing power are important. We applied Xapian, an open-source probabilistic information retrieval library to index the data and then searched from the indexed dataset. We also employed Slurm Workload Manager (an open-source job scheduler used by many of the world’s supercomputers and computer clusters) to submit the computational job to HiPerGator, the supercomputer at the University of Florida (https://www.rc.ufl.edu/services/hipergator/) to accelerate the indexing process. Eventually, the disease mentioning Tweets for each year were computed as the sum of available months’ data in that year before transforming into relative mentioning frequency (see section “Analytical method”).
The summary of Twitter data in terms of size, count, and disease mentioning.
Disease nomenclature
When diseases or medical conditions are mentioned in different online contexts, they can be abbreviated, exhibit various morphological or orthographical variations, or have multiple synonyms. For example, medical professionals refer to stroke as cerebrovascular accident, cerebrovascular insult, or brain attack. To ensure the completeness and consistency of the query results, we used the metathesaurus of the unified medical language system (UMLS), 20 a knowledge source that “compiles names, relationships, and associated information from a variety of biomedical naming systems.” For the diseases of interest, we queried Google Trends and Wikipedia using all of its synonyms and defined its search volume as the highest search volume among all its synonyms.
Benchmark data on disease burdens
We obtained the benchmark data on disease burdens during 2004 and 2010 from our previous study, 19 and the data for 2011 to 2014 from a large medical claims database, MarketScan®. It is managed by Truven Health to provide healthcare data such as individual claims, lab test results, and hospital discharge for different stakeholders including employers and health plans, policy makers and practitioners, and healthcare providers and facilities. 21
Using the UMLS, we set the disease terminology for our analysis to be PheWAS codes as they were developed to represent clinically meaningful phenotypes with appropriate granularity. 22 Due to the aggregation of the diseases and medical conditions by the PheWAS codes, the total number of diseases was reduced to 1633.
In addition to the disease prevalence and treatment cost data, we added three data sources for each disease: the number of PubMed publications, the amount of National Institutes of Health (NIH) funding, and the count of clinical trials. In our previous study, they were used to measure how medical research resources were allocated. Based on the assumption that maximal societal benefits can only be achieved when medical research resources are allocated proportional to the disease burden across the full distribution of diseases and conditions, we proposed and computed research opportunity index (ROI) and identified the diseases that required more research resources or the diseases that received more resources than their actual disease burden. 19
More specifically, for these 1633 diseases from medical claims databases with non-zero Internet or disease burden data, we calculated the relative prevalence and the relative treatment cost, together with the relative number of publications, the relative number of clinical trials, and the relative amount of NIH funding. The “relative” treatment cost, for instance, is defined as a given disease’s treatment cost divided by the total treatment cost of all the 1633 diseases. This way, different factors become unitless and comparable.
Analytical method
We denote the relative search volume of disease i in year j on Google as
To determine whether the information from Google Trends, Wikipedia, and Twitter can approximate the burden of diseases from three dimensions, we first examined the correlations between the Internet data and disease burdens measured by relative prevalence and relative treatment cost for all the diseases of interest as a whole. We did so by computing the Pearson correlation coefficients of (
Second, we determined whether the Internet data could forecast the disease burden during the same year, 1 year later, and 2 years later on an individual disease level. Mathematically, for each disease i, we computed the Pearson correlation coefficients between the relative search volume on Google and relative disease prevalence (
Finally, we used a LASSO-based regression model to predict the relative disease burden (
Results
Correlations analysis for the entire disease landscape
For all the diseases as a whole, we analyzed the correlations between disease burdens, measured by relative disease prevalence
Table 2 lists the Pearson correlation coefficients. The coefficients in Table 2 are all greater than the corresponding values in Table 2, indicating that the prevalence of diseases is more correlated to search volume than treatment cost. This can be explained by the definitions of those two measures. The treatment cost of a disease equals to its prevalence times the average treatment fees for each patient with the disease diagnosis in a given year. When all diseases are evaluated as a whole, the treatment cost estimate will have a larger variation than disease prevalence, therefore reducing its correlation with the relative search volume data on Google. In addition, we computed the corresponding p values and adjust them by Holm’s method (https://s3.amazonaws.com/cds-1/p-values-table2.docx). The adjusted p values are all smaller than 0.05, proving the significance of the correlations.
The correlations between relative search volume on Google
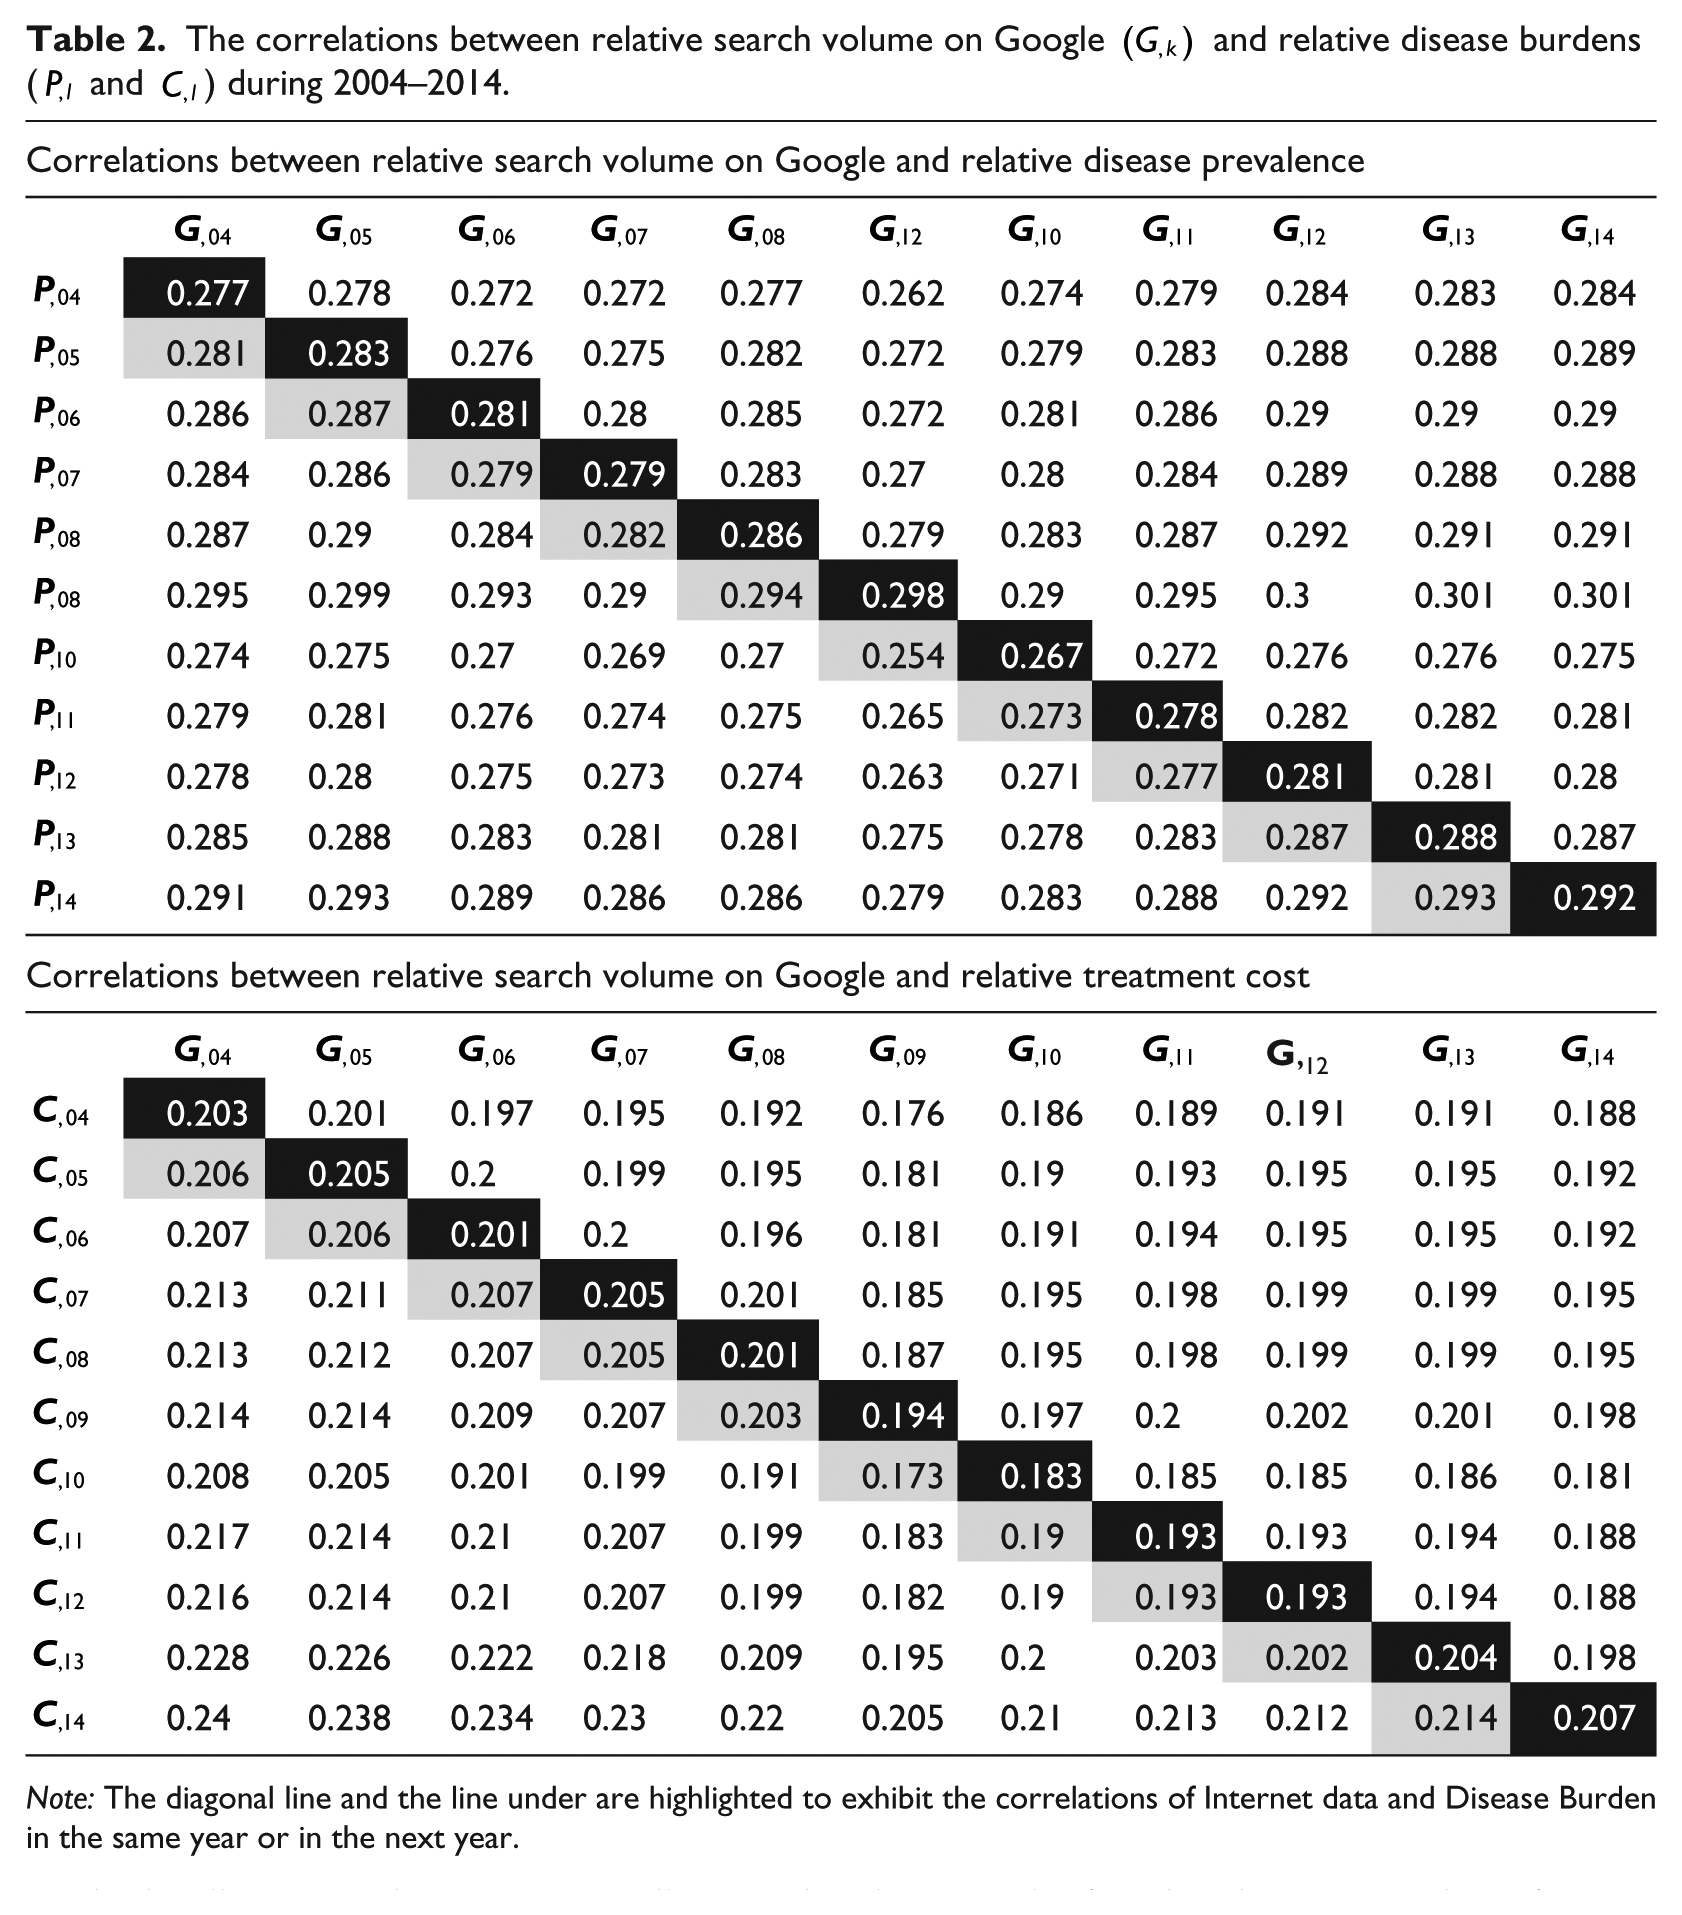
Note: The diagonal line and the line under are highlighted to exhibit the correlations of Internet data and Disease Burden in the same year or in the next year.
We were also interested in the relationship between the relative search volume on Google in a given year t and the relative prevalence of a disease in year t – 1 (the highlighted area under the diagonal lines in Table 2), as we initially assumed that individuals search the Internet once they receive a diagnosis. However, we did not observe such a trend. This might be owing to the fact that not all patients with a certain diagnosis will search the Internet and not all people who search for a particular disease on the Internet are diagnosed patients, or the fact that the computation of prevalence includes both newly diagnosed and pre-existing cases. An observable trend is that the Pearson correlation coefficients in the diagonal and right under the diagonal increase slowly with time, despite a few downward instances during 2009 and 2011. Such a weak increase suggests that it is becoming increasingly common to search the Internet for health-related topics.
We also tested the null hypotheses that cor(
The correlations between the relative page reviews on Wikipedia and relative disease burdens are also significant (https://s3.amazonaws.com/cds-1/p-values-table3.docx) and showed similar patterns during 2008 and 2014 (see Table 3)—the correlations in Table 3 are generally larger than the correlations in Table 3. Across the diagonal lines, cor(
The correlations between relative page view count on Wikipedia
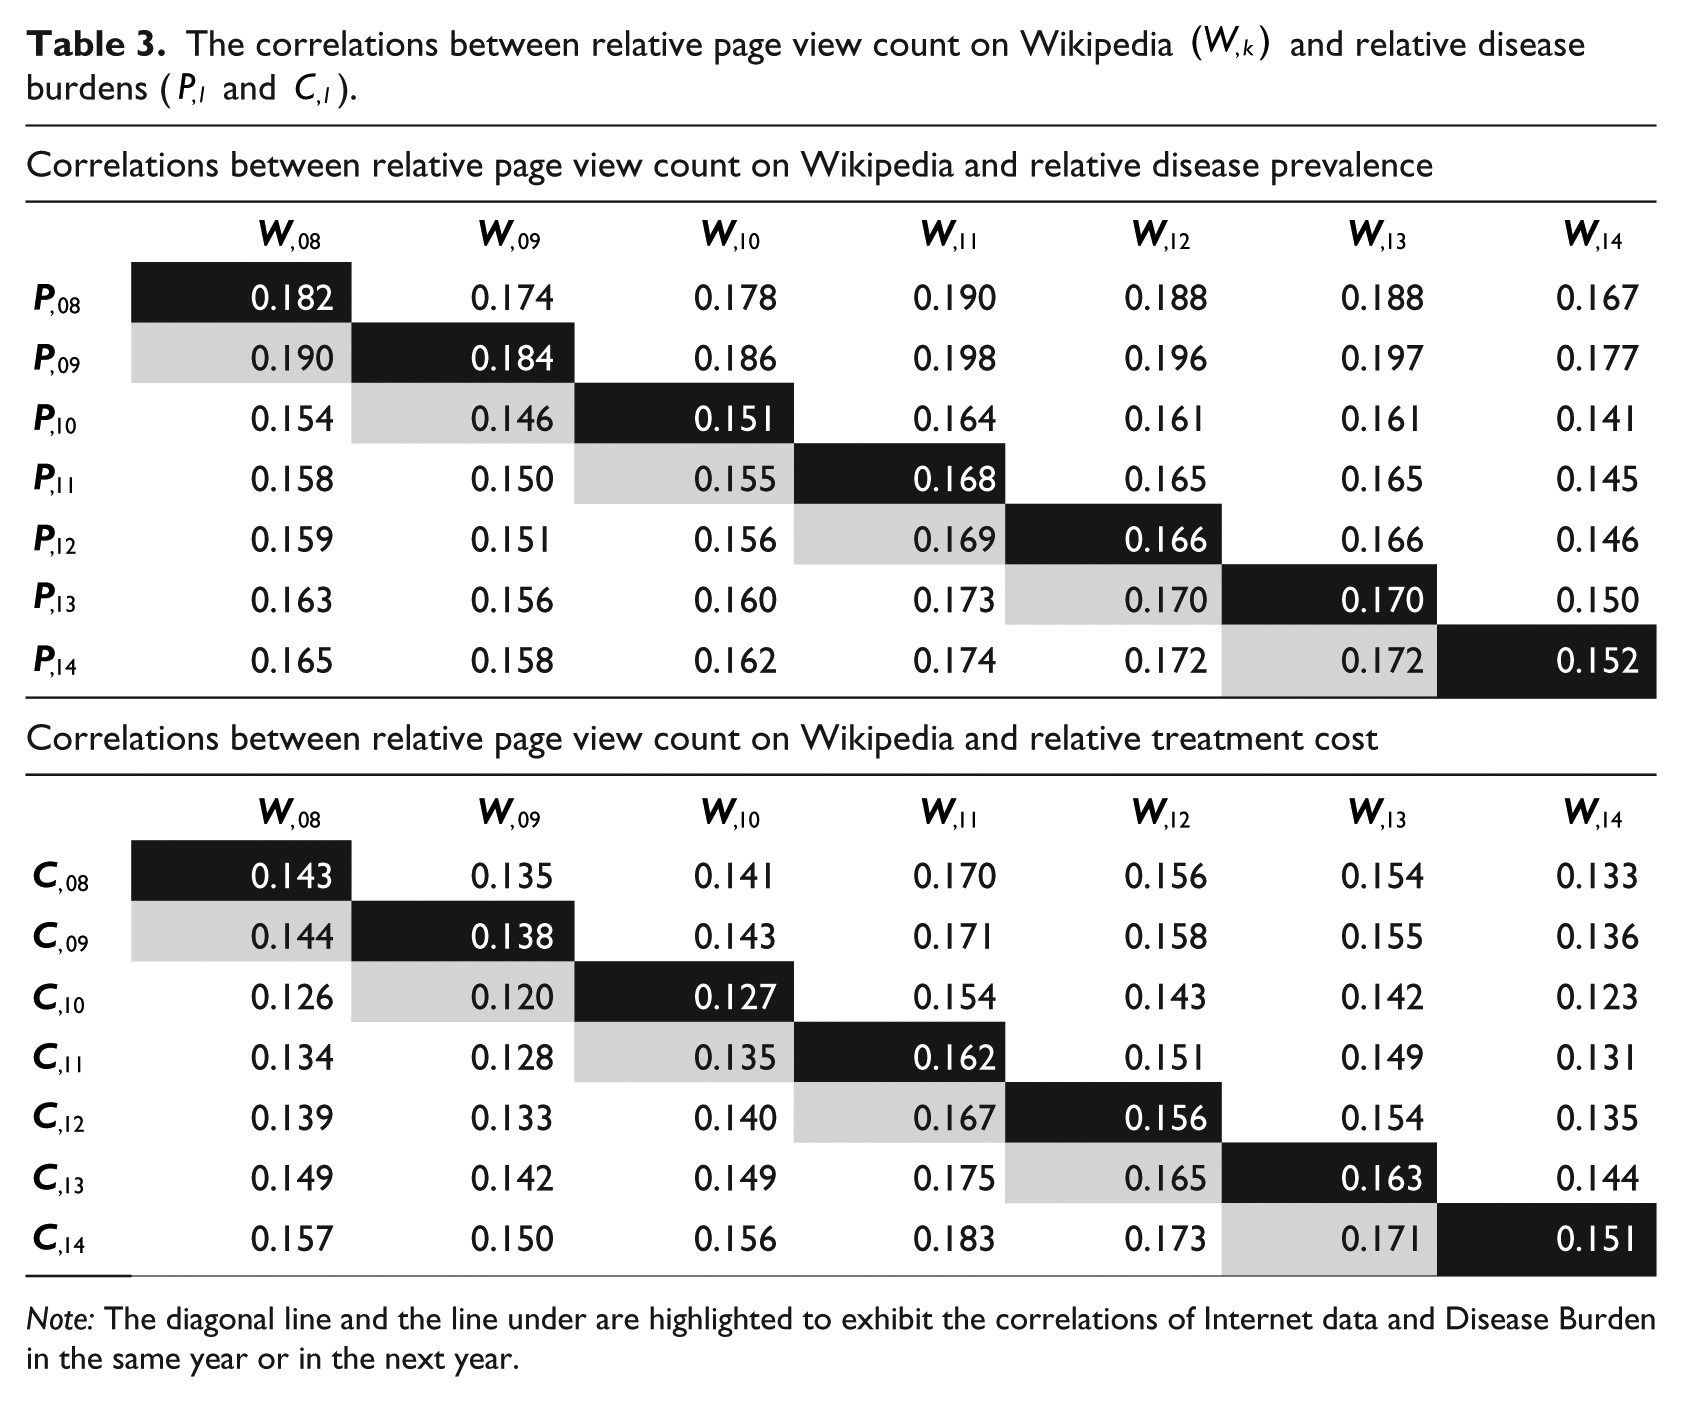
Note: The diagonal line and the line under are highlighted to exhibit the correlations of Internet data and Disease Burden in the same year or in the next year.
The correlations between disease burden and relative mentioning count on Twitter, however, are much smaller, as exhibited in Table 4 (the corresponding adjusted p value is 1 for each cell). Given the 140-character limit and the publicity nature of Twitter, it is possible that many patients do not use Twitter or Twitter users do not post about some very personal disease experience.
The correlations between relative mentioning count on Twitter
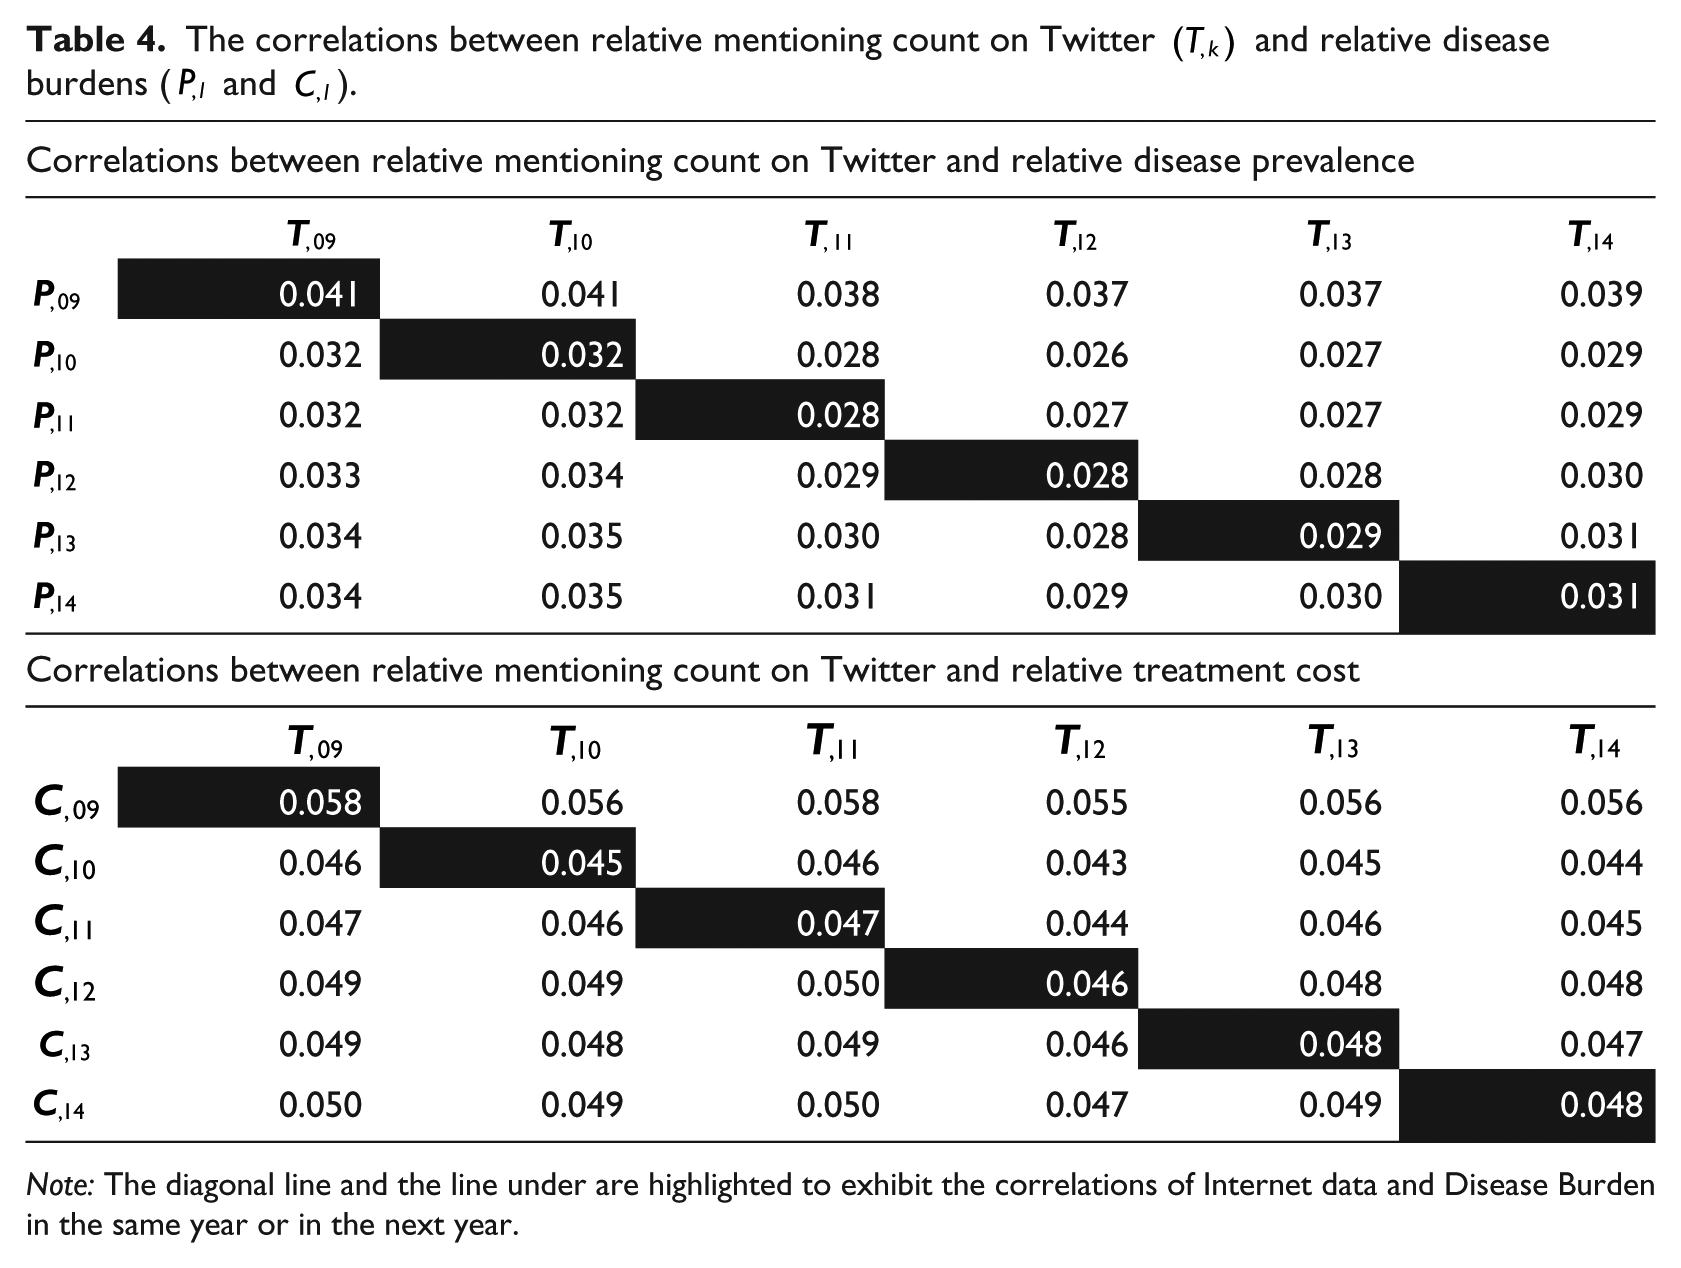
Note: The diagonal line and the line under are highlighted to exhibit the correlations of Internet data and Disease Burden in the same year or in the next year.
Correlations at individual disease level
Overall, the correlation coefficients between relative search volume on Google (or relative page reviews on Wikipedia) and relative disease burden measures are small—all are less than 0.3. Twitter data showed minimal correlations (all under 0.06) with the burdens of disease as a whole. We thus assessed the correlations between each data source and relative disease burdens one by one.
We first looked at the relative search volume on Google Trends (Gi) and the relative disease burdens (Pi, Ci,) with 0-year, 1-year, and 2-year intervals for individual diseases. Filtering by adjusted-p <0.05 on all the six correlation coefficients left 60 diseases. A total of 21 diseases that had high correlations owing to missing values in either Google Trends or disease burden data were then excluded, and the remaining 39 diseases and their Pearson correlation coefficients are listed in Table 5 (corresponding adjusted p values—https://s3.amazonaws.com/cds-1/p-values-table5.docx). Black and white values refer to positive and negative correlations, respectively.
39 diseases demonstrate strong correlations between relative search volume on Google and disease burden measured by relative prevalence and relative treatment cost.
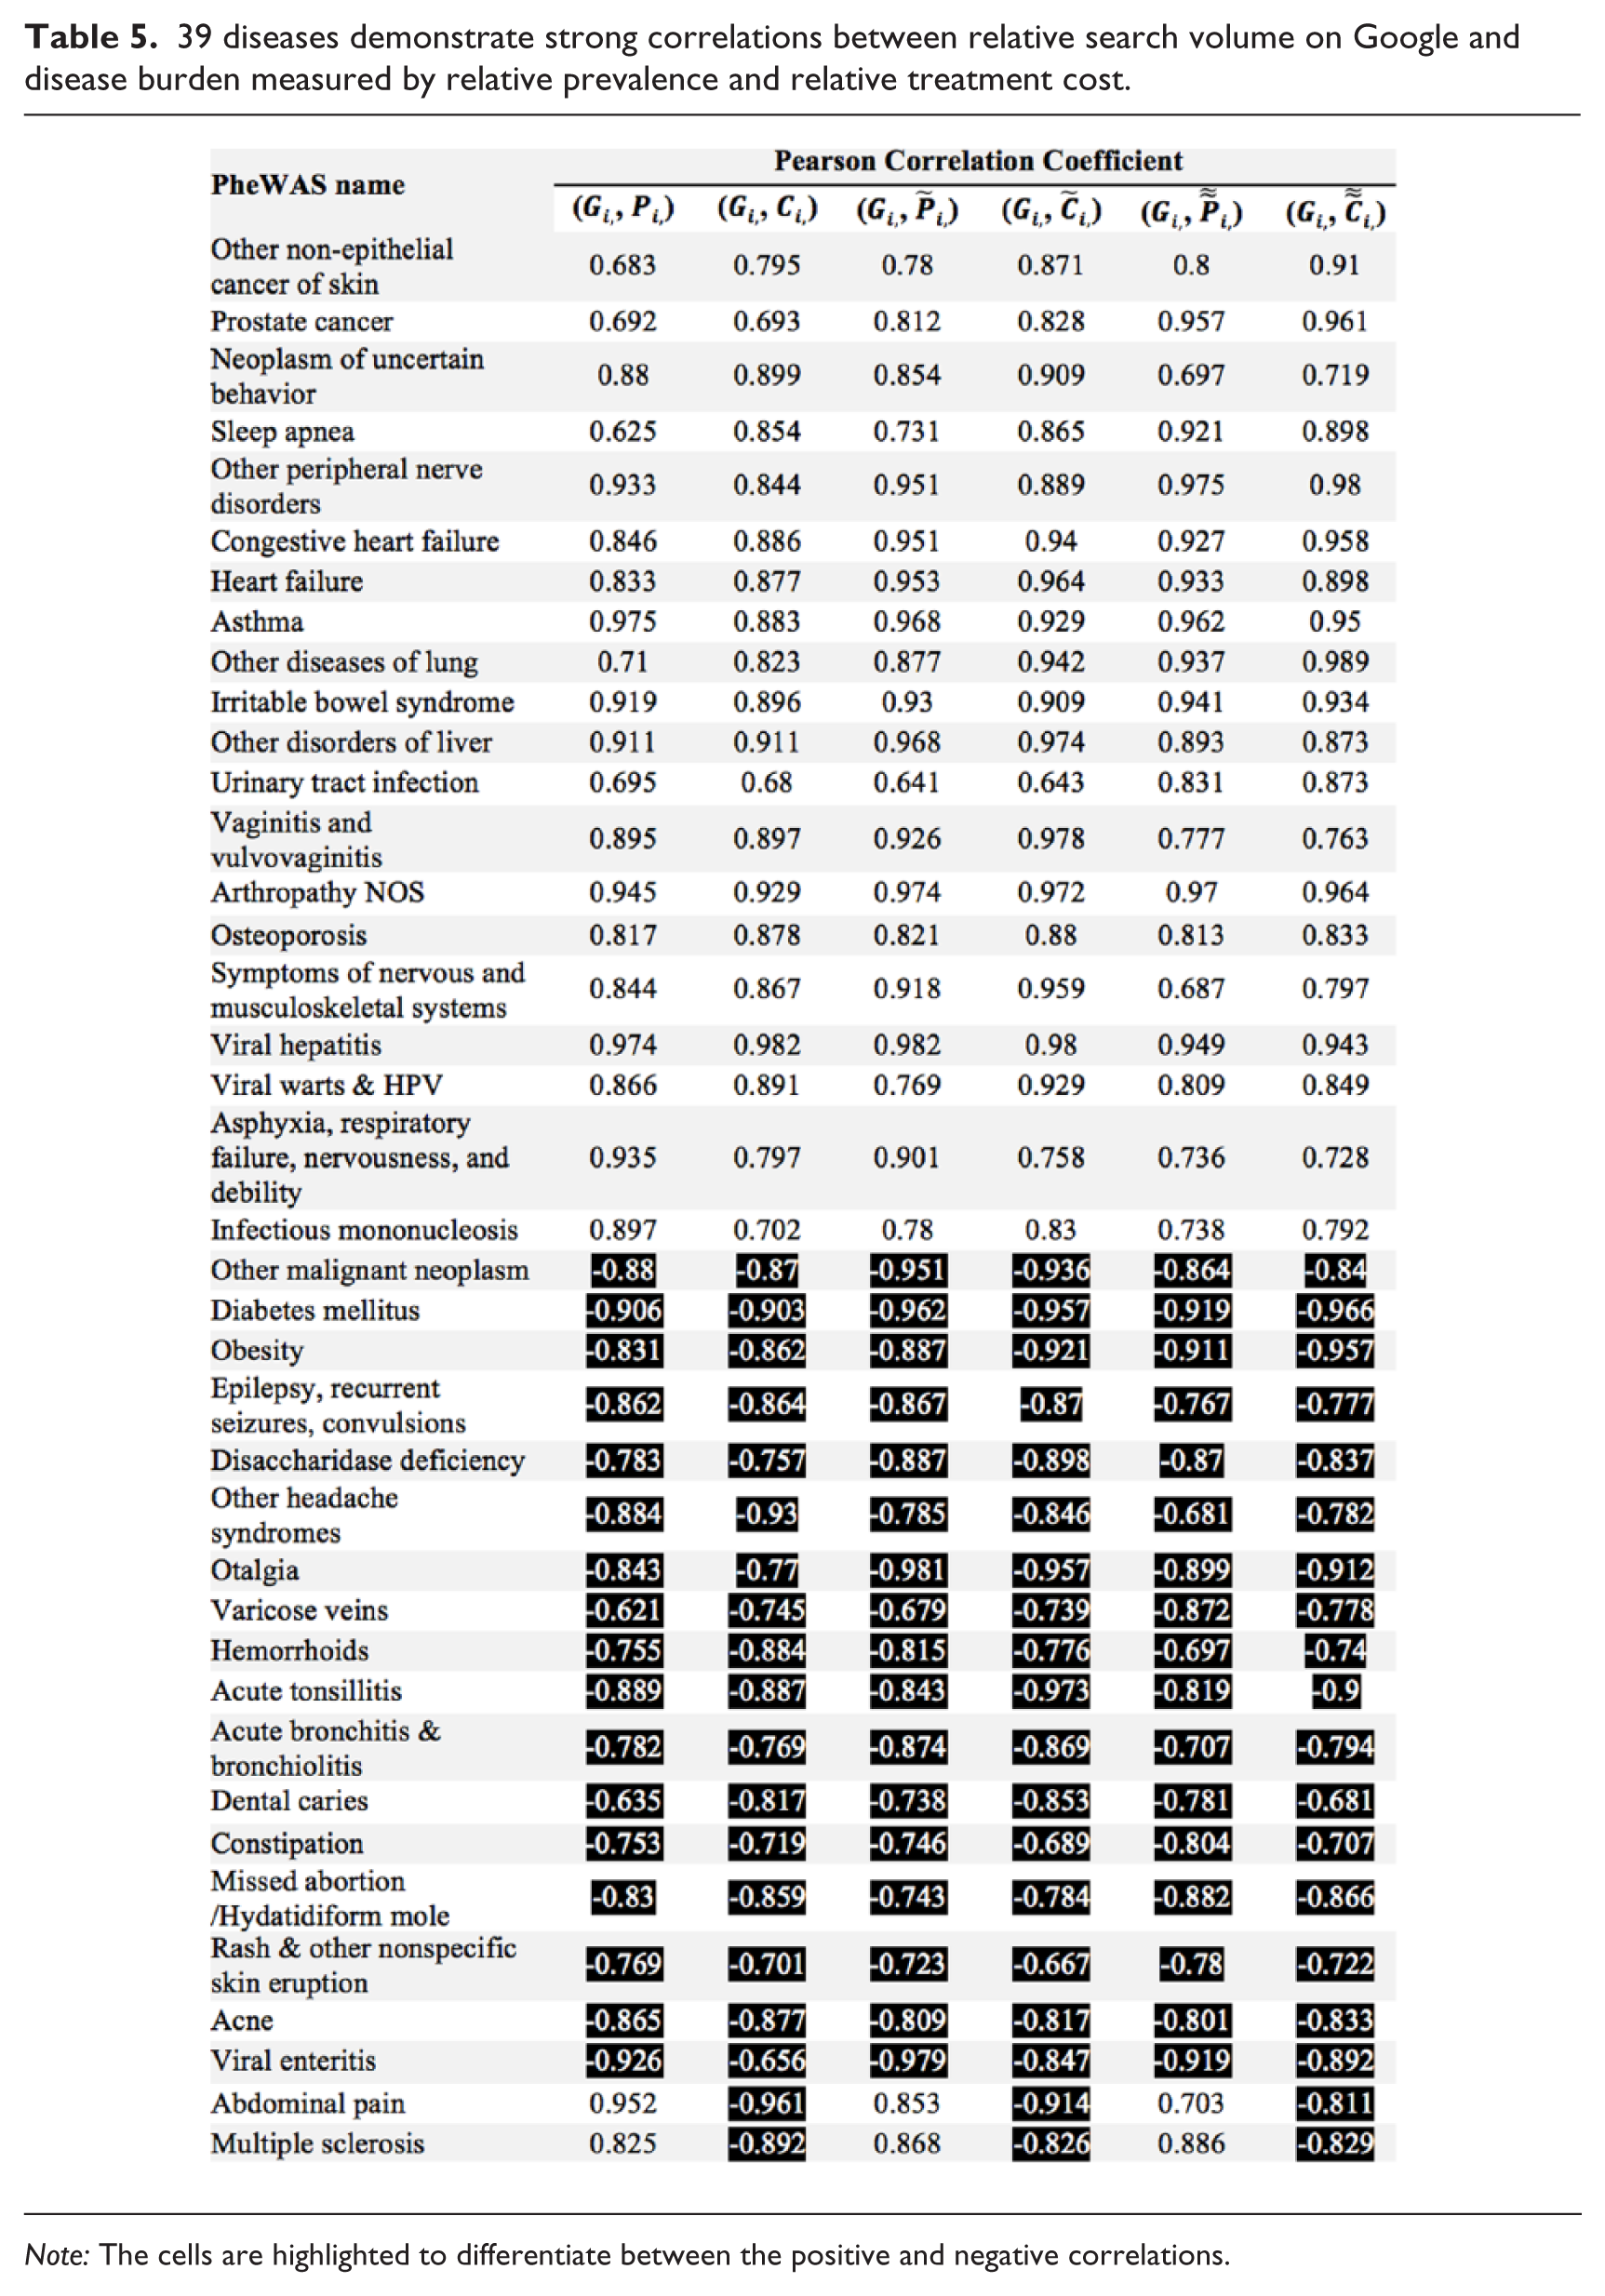
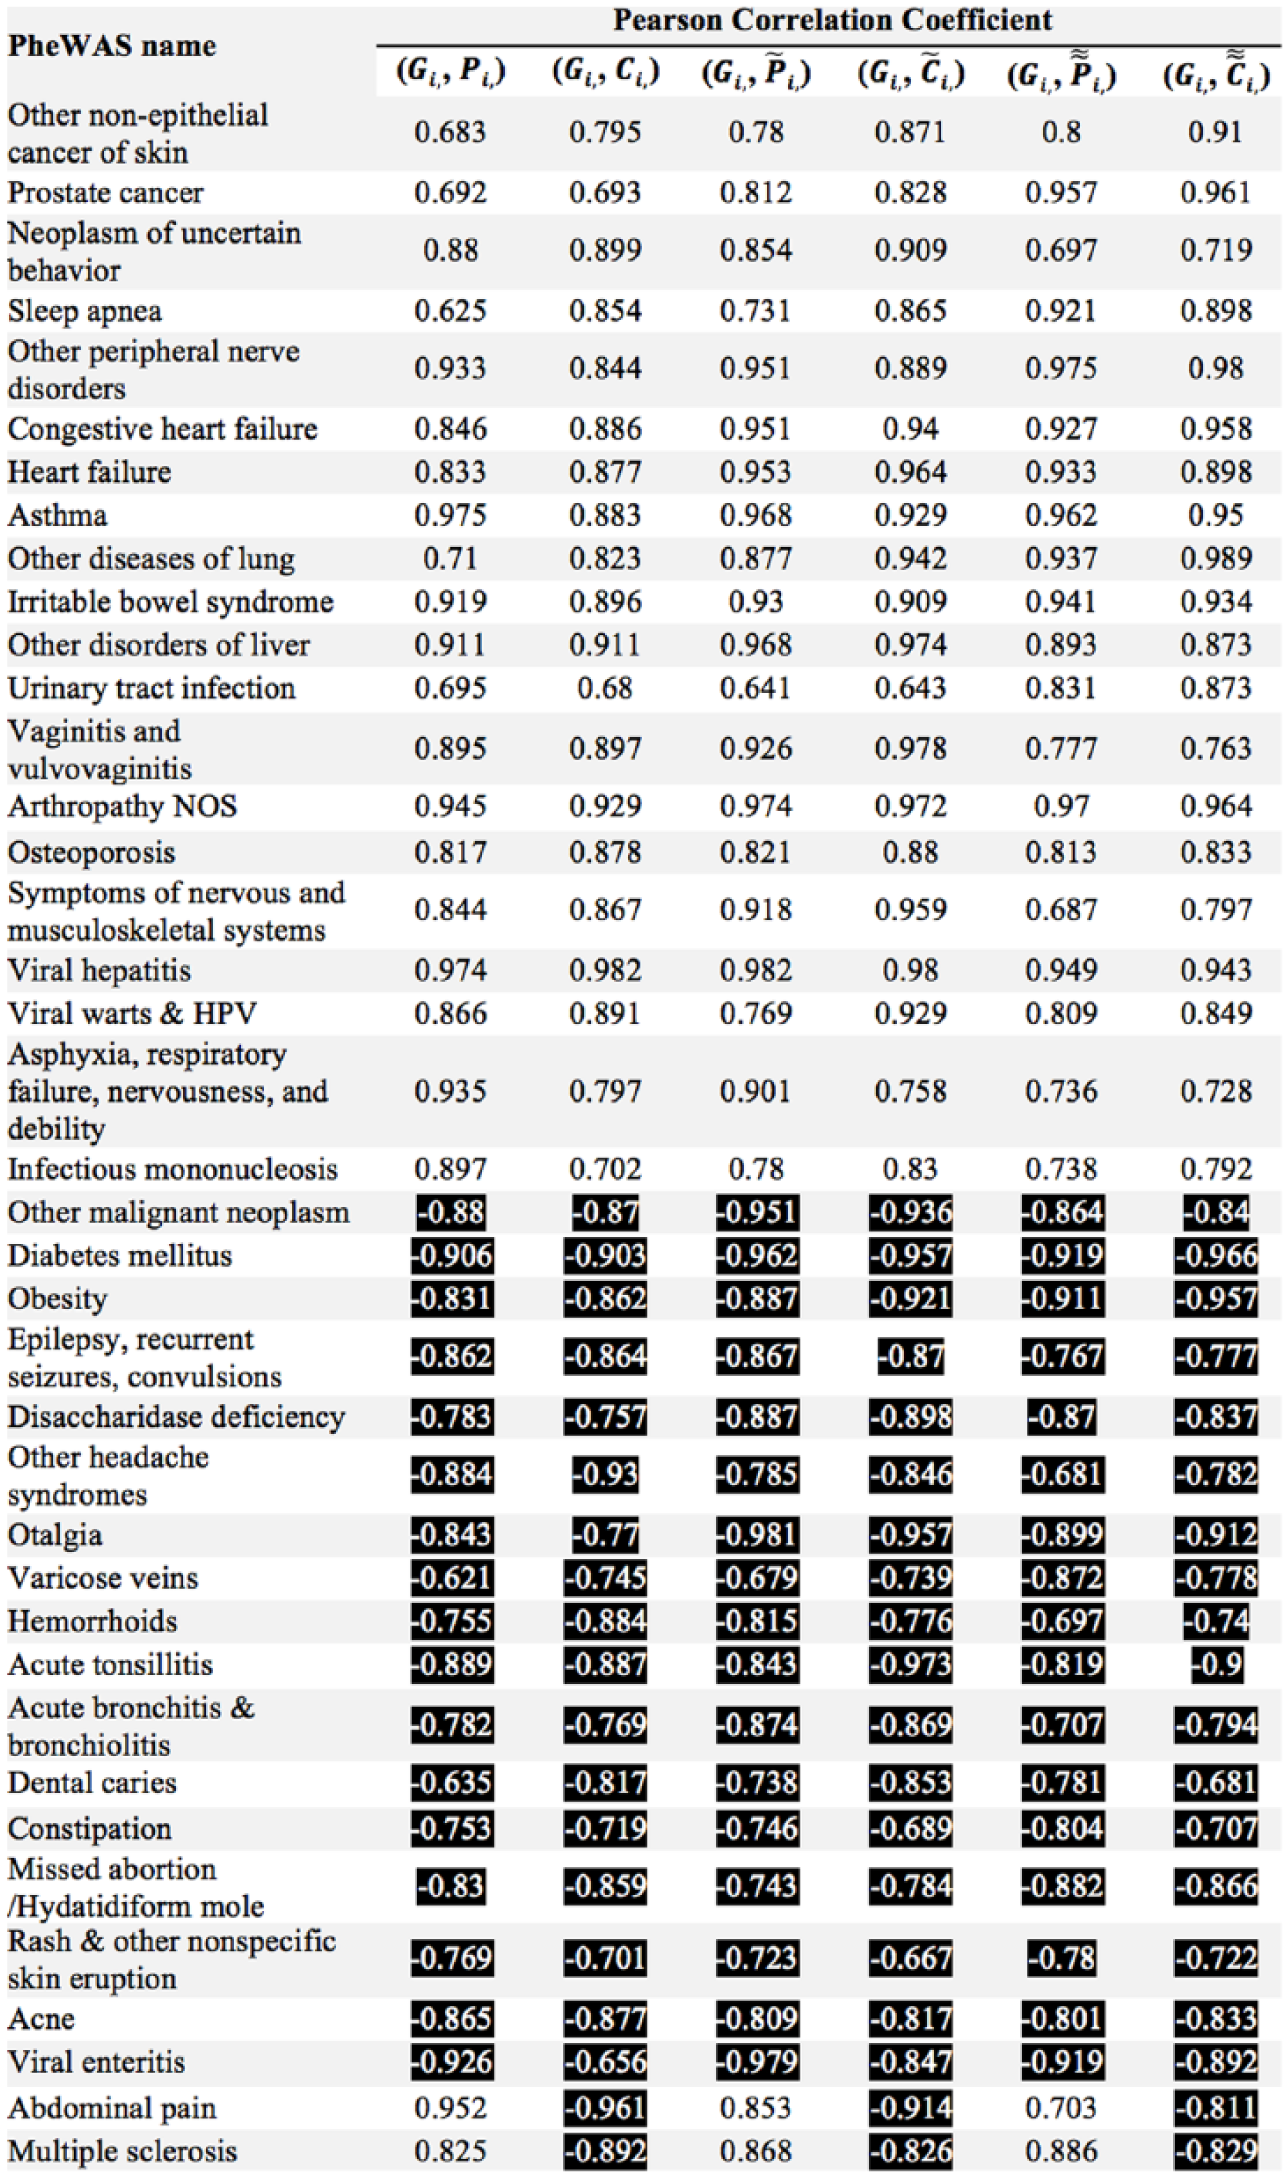
Note: The cells are highlighted to differentiate between the positive and negative correlations.
In Figure 2, we also plotted the correlation patterns for four representative diseases. Figure 2(a) shows that viral hepatitis is becoming less and less popular in Google Search, which corresponds to its decreasing prevalence and treatment costs. Figure 2(b) shows that diabetes mellitus is searched less and less frequently on Google, but both its prevalence and treatment cost are increasing with time. This might indicate that as a chronic condition, diabetes mellitus requires long-term treatment but is underestimated by the public. “Other headache syndromes” in Figure 2(c) exhibits a rising popularity in Google Search, but both its prevalence and treatment cost went down from 2004 to 2014. According to our communication with clinicians, one reasonable explanation is that headache is underdiagnosed as many people do not seek medical consultation for headache. Instead, patients simply turn to the Internet for information. In Figure 2(d), the relative search volume for multiple sclerosis on Google aligns well with its prevalence but the treatment cost has been rising dramatically, possibly owing to the increase in the cost of medication, which occurred in the same period. 27
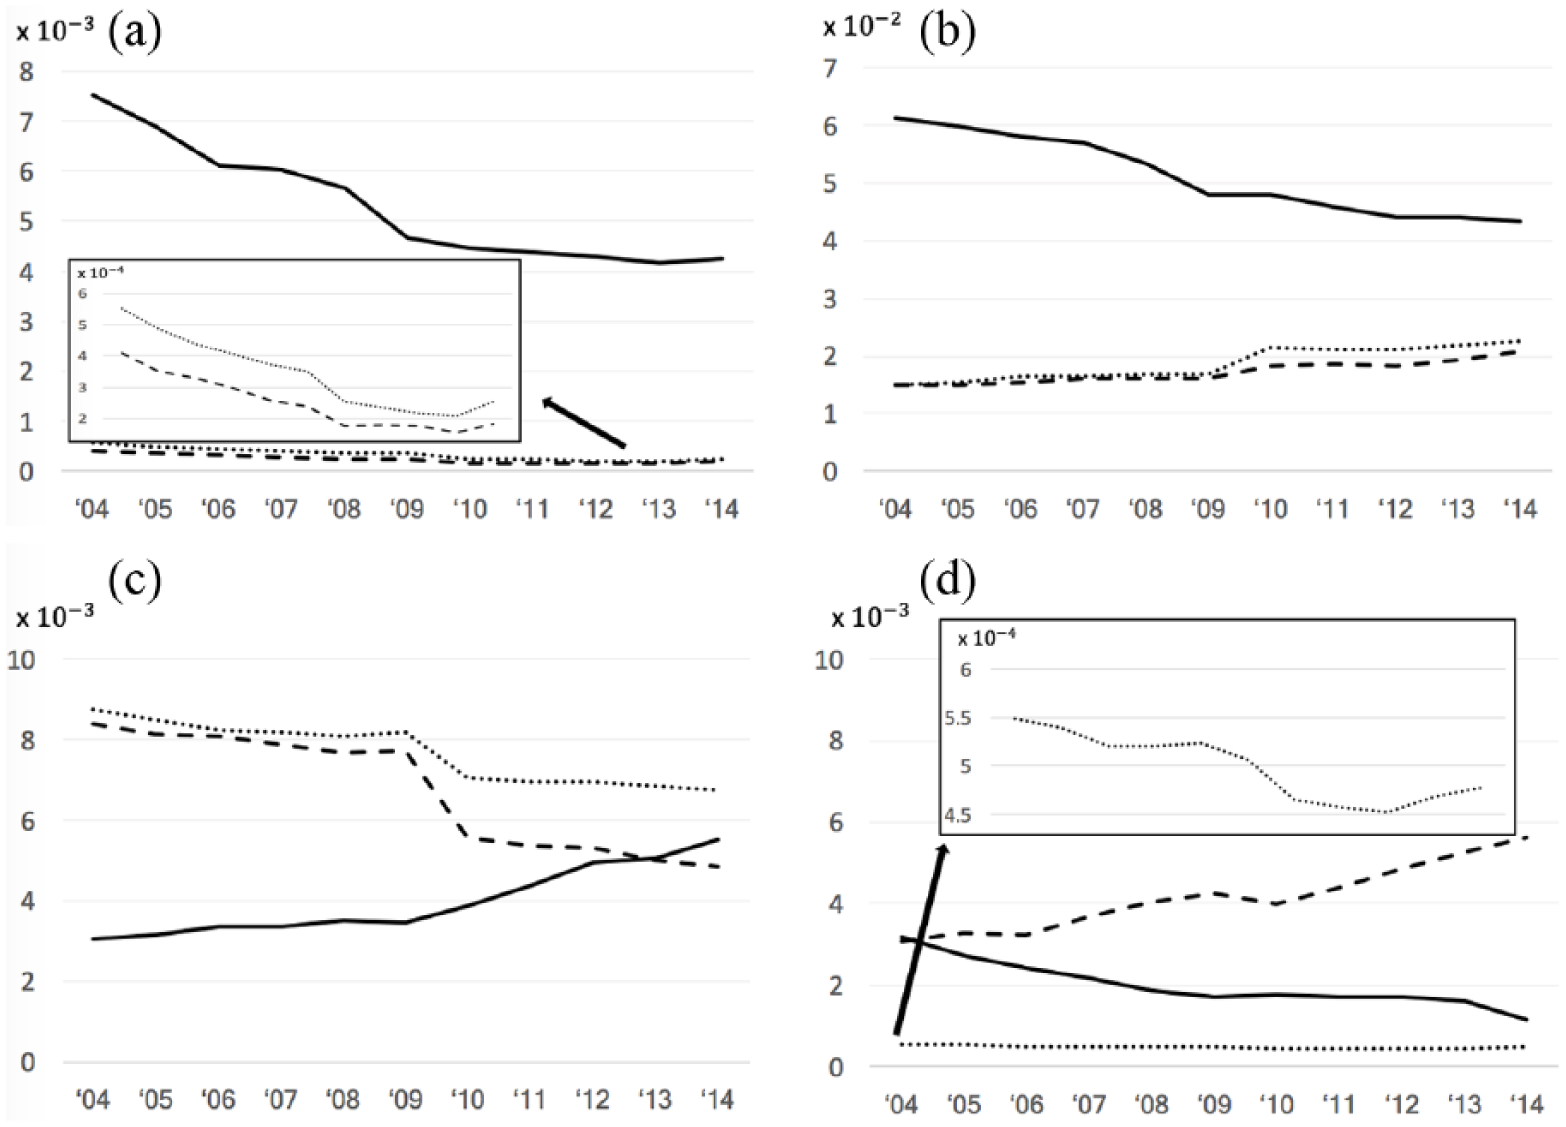
The correlations between relative search volume on Google Trends (solid lines) and relative disease prevalence (dotted lines) and treatment cost (dashed lines) for (a) viral hepatitis, (b) diabetes mellitus, (c) other headache syndromes, and (d) multiple sclerosis.
Second, we investigated the correlations at single disease level for Wikipedia page view count (Wi) and Twitter mentioning frequency (Ti). Since we only have 7 and 6 years of data for Wikipedia and Twitter, respectively, we only calculated the correlations based on 0-year and 1-year intervals. The highly correlated diseases are listed in Tables 6 and 7 separately. Among the 15 PheWAS diseases listed in Table 6, four diseases (highlighted in bolded font) also appeared in the Google Trends results (see Table 5), which are viral hepatitis, neoplasm of uncertain behavior, obesity, and other headache syndromes. The first three diseases showed the same type of correlations in results from both Google Trends and Wikipedia, which added to our confidence of the results. After filtering, only seven diseases exhibited high correlations between Twitter data and disease burden. In other words, most of the 1633 diseases were either not mentioned on Twitter or showed no correlations between their burdens and the mentioning frequency on Twitter.
Sixteen diseases demonstrate strong correlations between relative page view count on Wikipedia and disease burden measured by relative prevalence and relative treatment cost.
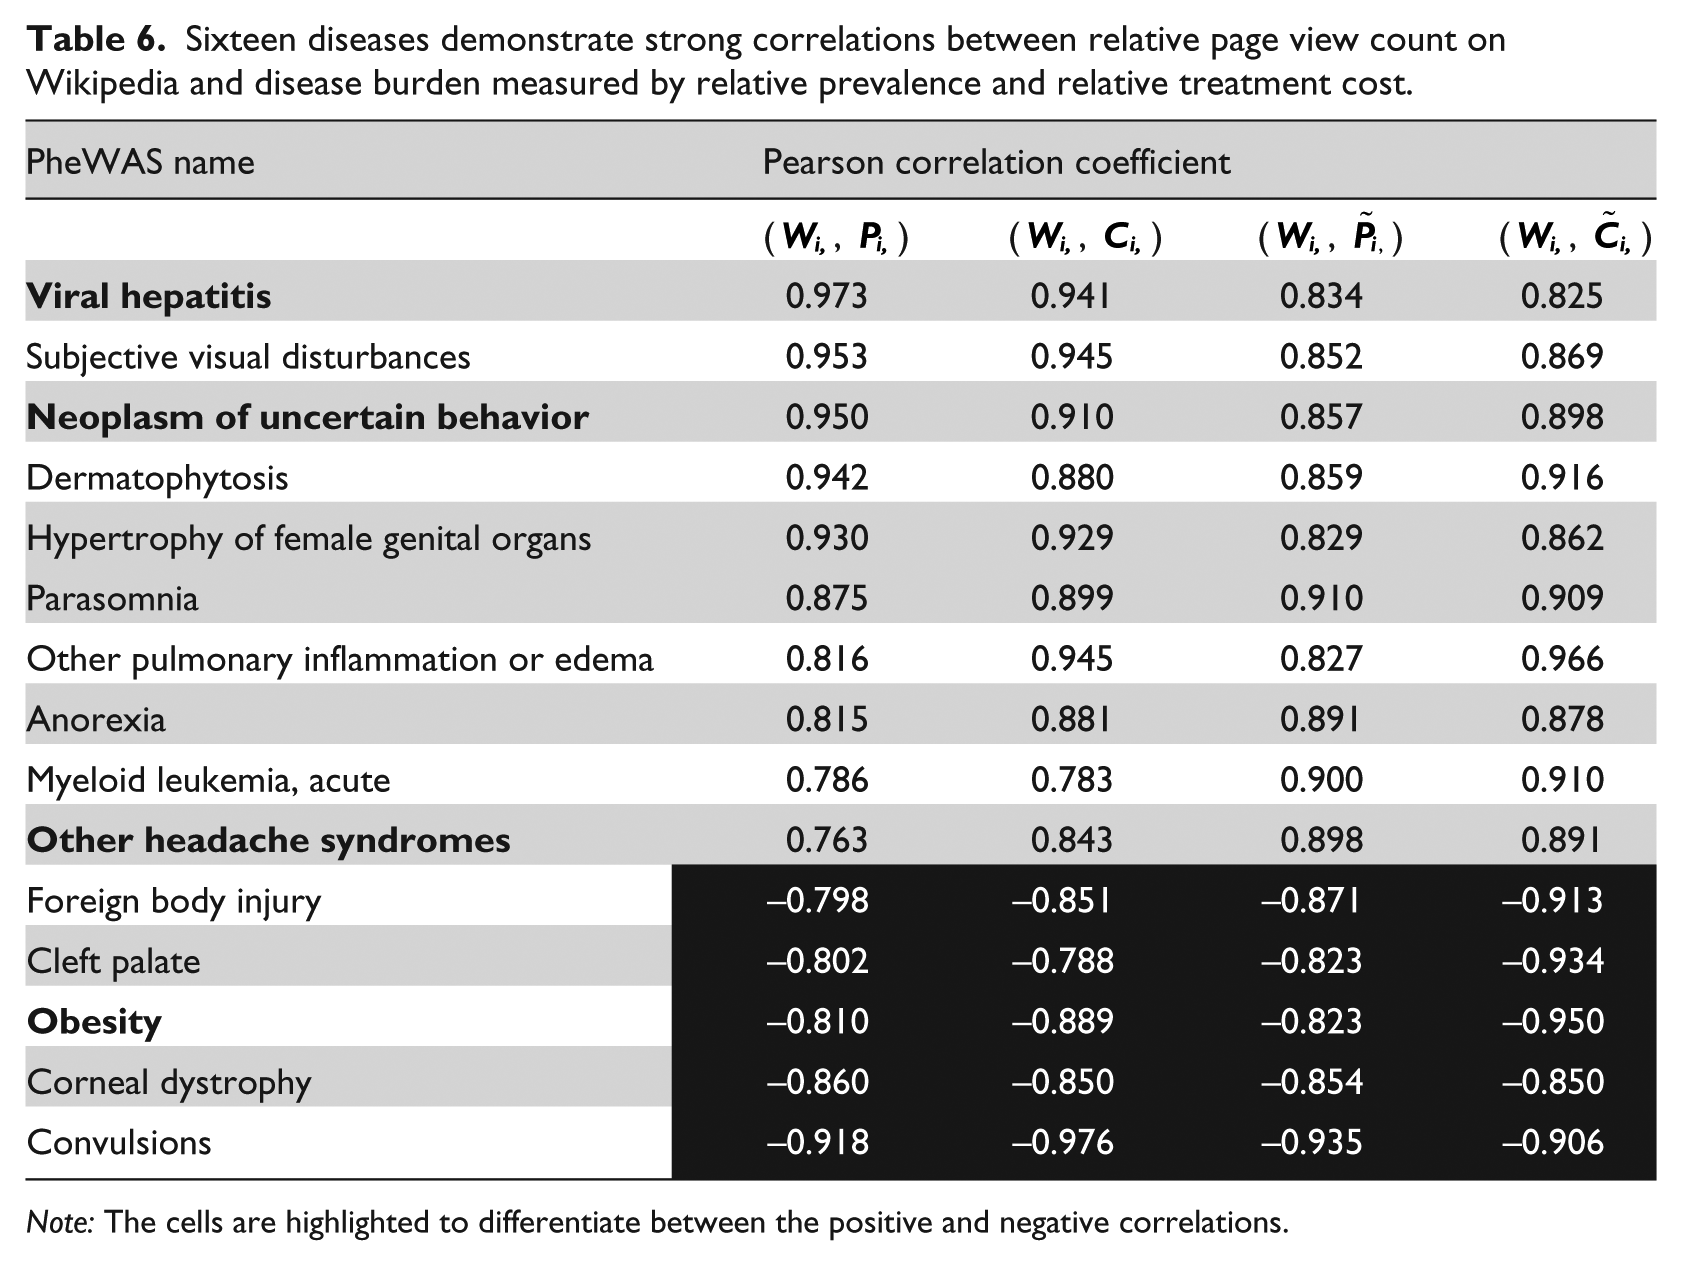
Note: The cells are highlighted to differentiate between the positive and negative correlations.
Seven diseases demonstrate strong correlations between relative mentioning frequency on Twitter and disease burden measured by relative prevalence and relative treatment cost.
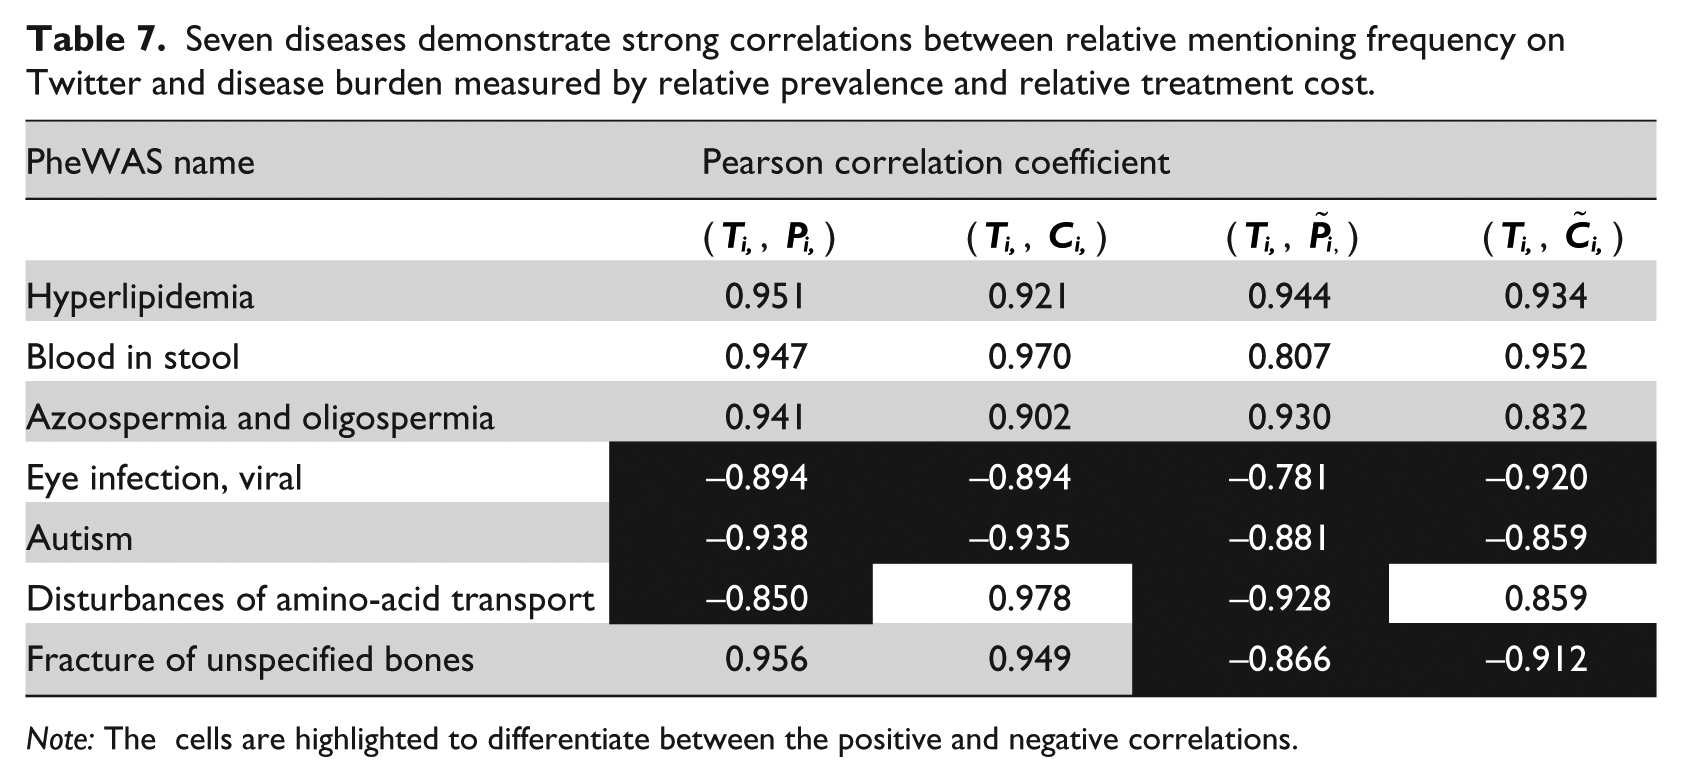
Note: The cells are highlighted to differentiate between the positive and negative correlations.
Predicting disease burdens using LASSO
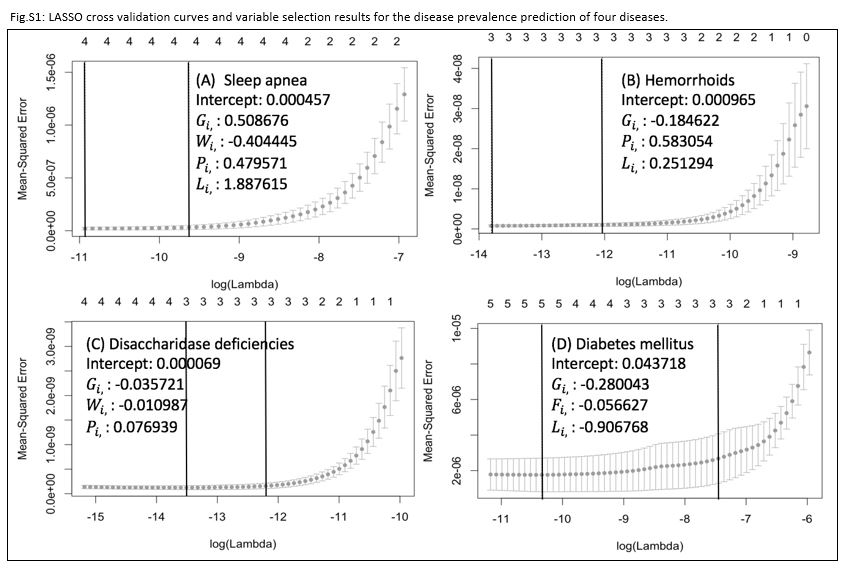
Finally, we explored whether the relative search volume on Google
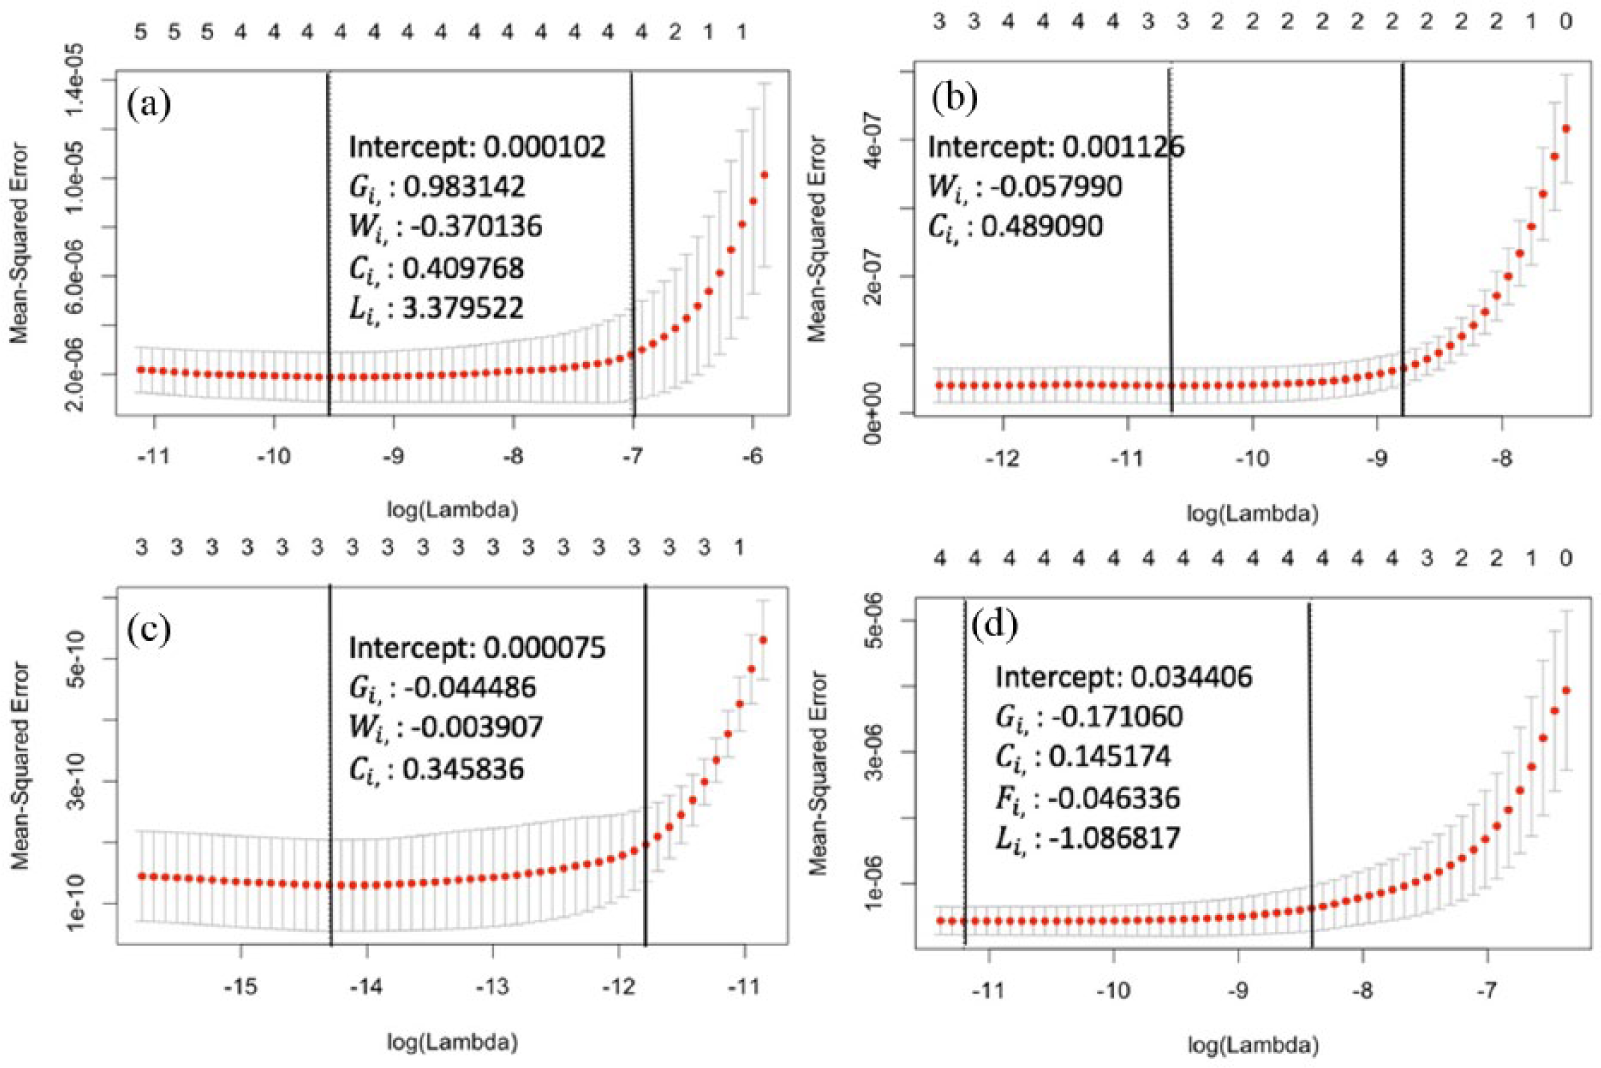
LASSO cross-validation curves and estimated coefficients of four diseases: (a) sleep apnea, (b) hemorrhoids, (c) disaccharidase deficiency, and (d) diabetes mellitus.
Discussion
In this study, we investigated the correlation between search volume on Google, page view counts on Wikipedia, and disease mentioning frequency on Twitter with disease burden, measured by prevalence and treatment cost, for 1633 diseases over an 11-year period. The correlations between Twitter data and disease burden were not significant at the entire disease level and only seven diseases exhibited high correlations between Twitter data and disease burden. The demographics of Twitter users can possibly help us interpret this result. According to most recent analyses on Twitter users, 54 percent of them earn more than US$50,000 per year 28 and 91 percent of them are under 30 years old. 29 Such population has been proved to be associated with better health condition and lower spending on health.30,31 Therefore, Twitter users might have less amount of health issues than the average Internet users and publish less on specific disease-related topics. The way we dealt with the Twitter data may also contribute to this situation: when deciding the disease mention for each Tweet, we looked for an exact match of disease synonym; it might cause bias when disease was misspelled, not mentioned, or mentioned in acronyms that were not included in the UMLS.
On the other hand, our analysis revealed that Google Search volume is much more robust for understanding the disease burden, especially for 39 diseases including viral hepatitis, diabetes mellitus, multiple sclerosis, sleep apnea, hemorrhoids, and disaccharidase deficiency. Out of the 1633 diseases, only 39 was listed as strongly correlated diseases for Google Search volume data because (1) the correlations at the entire disease landscape (ranging from 0.18 to 0.30) indicated that the number of correlated diseases was low; (2) we applied a strict filter that the Google Search volume should be correlated to the disease burden within the same year, 1-year gap, and 2-year gap; and (3) we had to remove some of the high-correlation diseases since either Google Search volume or disease burden data was missing.
In addition to the computed correlations, the LASSO regression analysis showed that the Internet data sources, disease burden, number of scientific articles from PubMed, number of clinical trials, and funding from the NIH have various power for predicting future disease burdens.
However, our analysis is limited to prevalence and treatment cost, but not other measures of disease burden due to data availability and comparability. The findings also caution us not to over-generalize when estimating disease burdens for the purpose of understanding population health, formulating health policies, or planning resource allocation. Instead, we should consider each individual disease according to its characteristics, such as the acute/chronic nature, severity, familiarity to the public, and the presence of stigma.
Conclusion
Estimating the disease burden using the Internet usage data is automated and cost-efficient. This study proved the robustness and feasibility of understanding the disease prevalence and treatment cost with the Google Search volume and Wikipedia page view count. Further research is necessary to compare the Internet usage data with other disease burden measures and adjust the estimation according to the characteristics of specific diseases.
Footnotes
Declaration of conflicting interests
The author(s) declared no potential conflicts of interest with respect to the research, authorship, and/or publication of this article.
Funding
The author(s) received no financial support for the research, authorship, and/or publication of this article.