
Abstract
Binge drinking is a severe health problem faced by many US colleges and universities. College students often post drinking-related text and images on social media, portraying their alcohol use as socially desirable. In this project, we investigated the feasibility of mining the heterogeneous data (e.g. text, images, and videos) on Facebook to identify drinking-related contents. We manually annotated 4266 posts during 21 October 2011 and 3 November 2014 from “I’m Shmacked” group on Facebook, where 511 posts were drinking-related. Our machine learning models show that by combining heterogeneous data types, we were able to identify drinking-related posts with an F1-score of 0.81. Prediction models built on text data were more reliable compared to those built on image and video data for predicting drinking-related contents. As the first step of our efforts in this direction, this feasibility study showed promise toward unleashing the potential of mining social media to identify students who binge drink.
Keywords
Introduction
Abusive alcohol consumption and underage drinking are serious, chronic problems faced by US colleges and universities. According to epidemiologic studies, about 25 percent of US college students report having academic difficulties due to drinking, with problems ranging from missing classes to doing poorly on examinations or papers.1,2 Nationwide, around 599,000 college students each year sustain alcohol-related injuries, and 1825 of these students die as a result of their injuries. In addition, there are approximately 696,000 alcohol-related nonsexual assaults each year among college students and 97,000 cases of alcohol-related sexual assault or rape. 3 College students with heavy drinking problems are also much more likely to abuse other substances, leading to more complex social and medical consequences. 4
In contrast to older age groups with drinking problems, college students often perceive drinking as an integral part of their higher education experience and a ritual to becoming an independent adult. Studies show that college students embrace the drinker image on social media websites, such as Facebook, Twitter, Pinterest, and Instagram, valuing it as a socially desirable identity.5,6 They also tend to overestimate the amount and frequency with which their peers drink,7,8 and this perception generates internal pressure to conform to the false norm. Since students conclude that heavy drinking is normal, they do not seek preventive or intervention health care at student health centers or elsewhere.9,10 Thus, in addition to community-based prevention efforts (e.g. limiting alcohol availability, increasing supervision from parents and other adults, enforcing underage drinking laws), innovative approaches are needed to use social media more effectively to identify college students with heavy drinking problems and simultaneously help them to reduce drinking and seek proper treatment. Due to the networking properties of social media platforms, these approaches could also educate students who do not have heavy drinking problems but are at risk due to peer influence.
Further research shows that between 94 and 98 percent of college students maintain a social media profile, and most report daily use 11 of various social media platforms.12,13 The majority of college students post drinking-related images or text on their profiles,10,14,15 and alcohol manufacturers spend heavily on marketing and advertising through social media.16,17 To counter drinking culture, public health and clinical research scholars are also utilizing social media platforms.18,19 For example, Morgan et al. 20 analyzed photos and comments from MySpace and videos from YouTube to locate images and videos showing people drinking alcohol or engaging in recreational drug use. They were able to identify general themes and patterns using an open coding technique. Moreno et al. 18 categorized 244 Facebook profiles into three groups and found that 64 percent of profiles have no alcohol references, 20 percent include one or more references to alcohol use but not intoxication, and 16 percent have one or more references to drinking problems. Hanson et al. 21 aimed to leverage Twitter data to better understand Adderall (a psychostimulant drug) abuse among college and university students. Lovecchio et al. 22 evaluated the short-term impact of an online alcohol course for first-year students and found that compared to the control group, the treatment group reported substantially lower levels of alcohol use, fewer negative consequences, and less of a positive attitude toward alcohol. However, these studies were designed to survey a small number of participants to qualitatively understand social media use among drinking college students or to test certain intervention methods in small-scale randomized controlled trials. They all require manual analysis of the participants’ profiles on specific social media websites. Expediting research on the influence of social media on alcohol use in adolescents and young adults and designing effective social media–based interventions to help the targeted population require accurate detection of drinking-related contents in an economical, fast, accurate, and automatic fashion. Therefore, there is an urgent need to investigate advanced machine learning, text mining, and image and video mining techniques for detecting drinking-related contents on social media websites in the format of text, images, and videos.
From the perspective of computer science, various machine learning and statistical techniques have been developed for both text and image/video classifications for many other applications, such as spam email detection, hospital readmission prediction, and face recognition.23–25 For text data, commonly used supervised machine learning algorithms include Naïve Bayes, 26 random forests, 27 and support vector machine (SVM).28–30 Latent Dirichlet Allocation (LDA) and its modifications are popular topic modeling algorithms that have been used in various applications of text classification and categorization. For instance, Phan et al. 31 presented a framework that addresses the challenge of classifying short and sparse text on the web, and Somasundaram and Murphy 32 used LDA to categorize bug reports for open-source projects to organize software for developers. One of the modified LDA methods-namely, Labeled Latent Dirichlet Allocation (LLDA)-has been introduced to infer the categories (i.e. sports, health, transportation, and politics) from user-tagged news articles, where the topics are restricted to the set of tags different users assigned to each article. 33 Examples of user-tags are website bookmarks, news categories such as sports, health, transportation, and politics. Image and video data are of very different nature than text, represented by two-dimensional grids of pixels. Traditionally, many systems utilized SVM 34 to classify images. Recently, neural network–based deep learning methods are gaining popularity after a decade of recession, 35 thanks to the significantly enhanced computational power and the abundance of multilayer perceptron. 36 The process of training the neural network starts with forward propagation to assign weights to the perceptron inside the layers, and then an optimization algorithm propagates backward on these weights to reduce errors. However, there are rarely applications that take heterogeneous data, such as both text and image/video data, together for classification.♦
RQ1. How feasible it is to use social media data for detecting posts about drinking?
RQ2. What is the best performing technique for analyzing each heterogeneous data type on social media?
RQ3. Can we improve the prediction by combining those data and methods together?
In other words, we aimed to examine state-of-the-art machine learning methods to automatically classify social media posts in the format of text, image, and video to determine whether they contained drinking-related content. This is the first step toward using social media data to identify college students with heavy drinking problems and helping them to reduce their alcohol use and seek proper treatment. In the next section, we introduce our dataset and describe our methodology. We then show the results in the “Results and Discussion” section. Finally, we conclude the article and highlight our future work.
Data and methods
Data collection
We crawled and de-identified posts from self-identified college students on the Facebook group named “I’m Shmacked.” I’m Shmacked is a company (http://imshmacked.com/) that targets high school and college students, organizes entertainment events, and video records student parties across the country. The company’s Facebook page is liked by over 118,000 users and has thousands of posts. Many of their events involve binge drinking, according to a report by Fox News in 2014 (http://fox6now.com/2014/02/18/im-shmacked-capitalizes-on-student-drinking/). Using Facebook’s Graph Application Programming Interface (API) (version 2.1; https://developers.facebook.com/docs/graph-api) and Facebook Platform Python Software Development Kit (SDK) (https://github.com/mobolic/facebook-sdk), we developed a Python application to retrieve all publicly visible contents posted on the timeline of the “I’m Shmacked” Facebook page. The returned posts were in JavaScript Object Notation (JSON) format with links to multimedia contents (i.e. images or videos). We ran our application on 3 November 2014, and collected 4266 posts, which served as the training and testing datasets for this study.
Text and multimedia content annotation
Five graduate students at the University of North Carolina at Charlotte ran two separate rounds of annotations to determine whether or not each post contained drinking-related contents. Graduate students were ideal for this task because having recently graduated from college, they understood their peers’ colloquial language on social media. In each round, if a given Facebook post contained both text and multimedia contents, two annotators assigned labels (“Yes,” “No,” “Maybe”) separately to both the text and multimedia contents.
Annotators also gave a final label to a given post. Figure 1 shows four different types of posts (text, image, video, link) that were classified as “Yes” by the annotators. We provided a drinking keyword list which helped the annotators manually classify the posts (Supplementary Box). For the first round of annotations, 3348 of 4266 (78.5%) posts were identical. In the second round, the annotators resolved the remaining 918 cases. The graduate students also explained their reasoning for the labels, such as mentions of colloquial expressions for drinking (e.g. arrived, blackout, crazy, drunk, hammered, high, hype, wasted, twisted) or images containing red cups or beer pong games. We include these reasoning hints as a feature in our dataset.
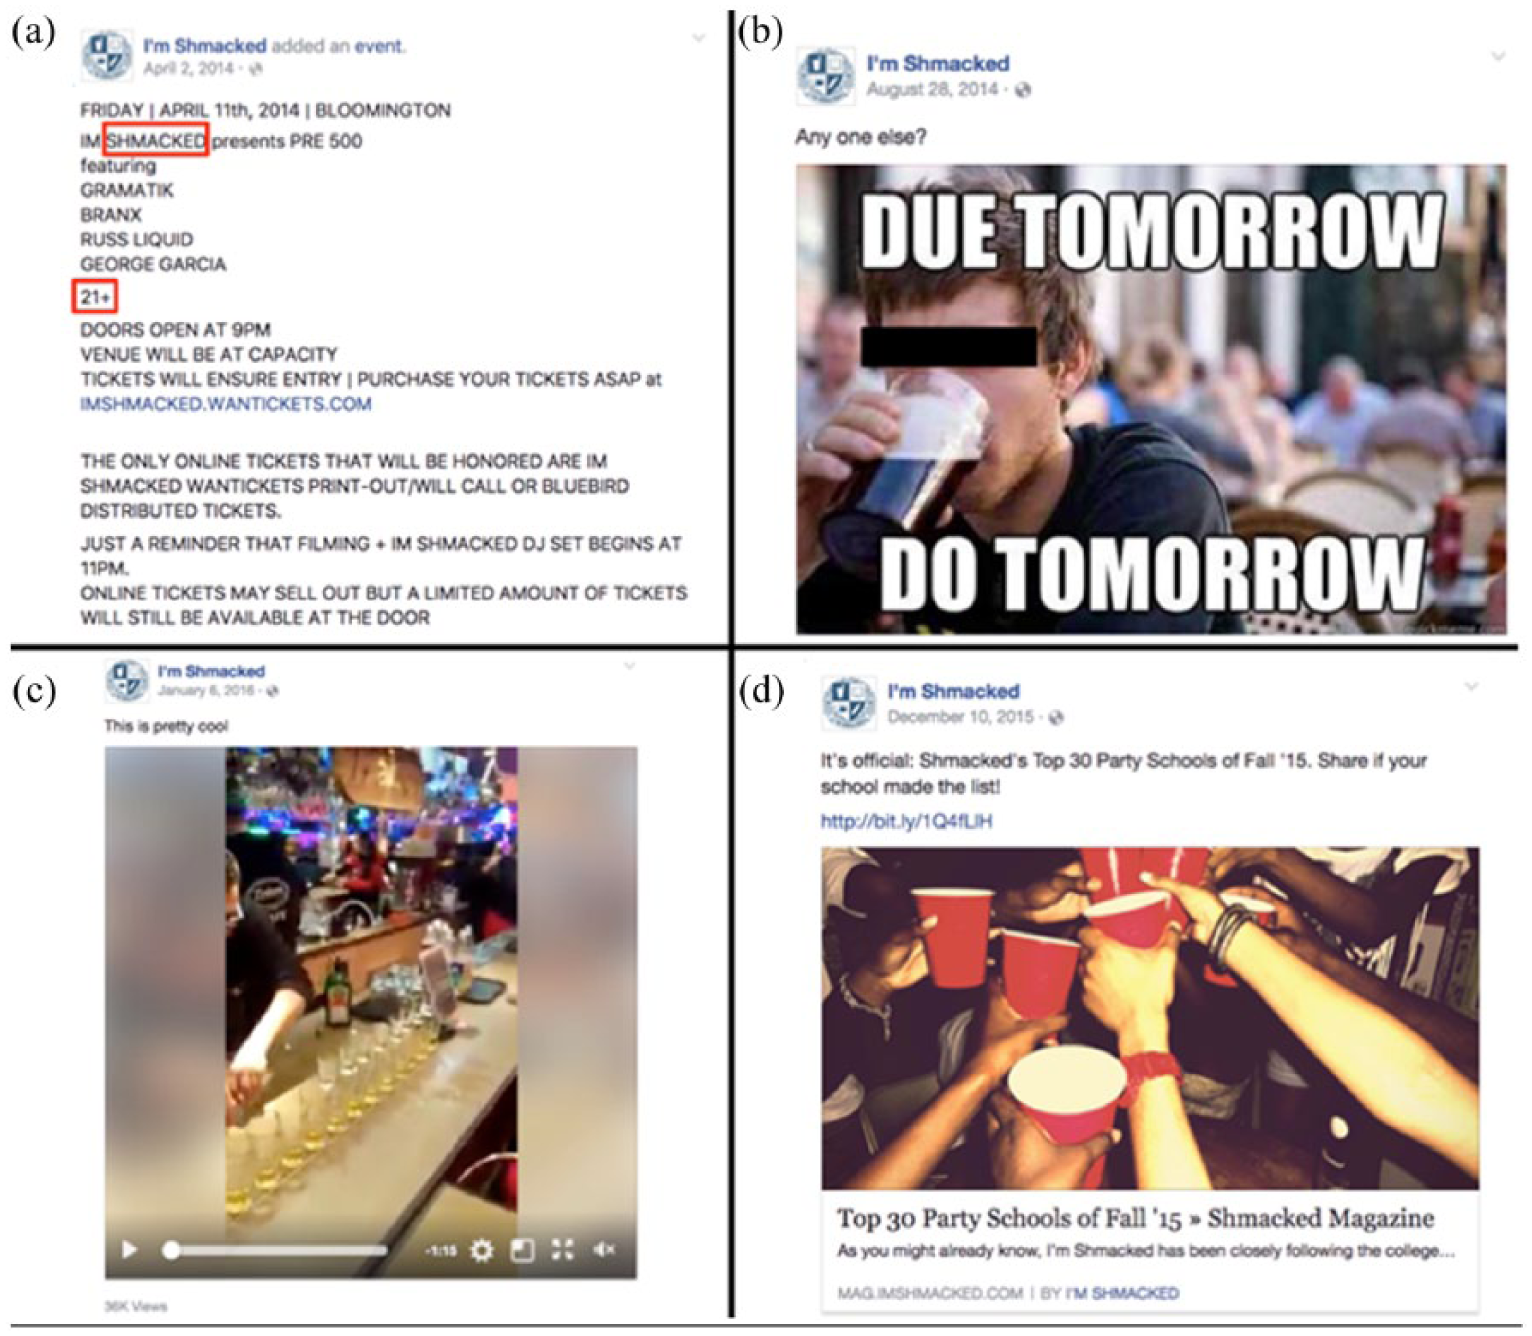
Four examples of the different post types (text, image, video, link): (a) Advertisement for a party. The keywords “Shmacked” and “21+” suggest involvement of drinking. (b) Meme showing a young man drinking beer. (c) Video showing a bartender pouring hard liquor in many cups. (d) List of I’m Shmacked’s top 30 party schools of Fall 2015.
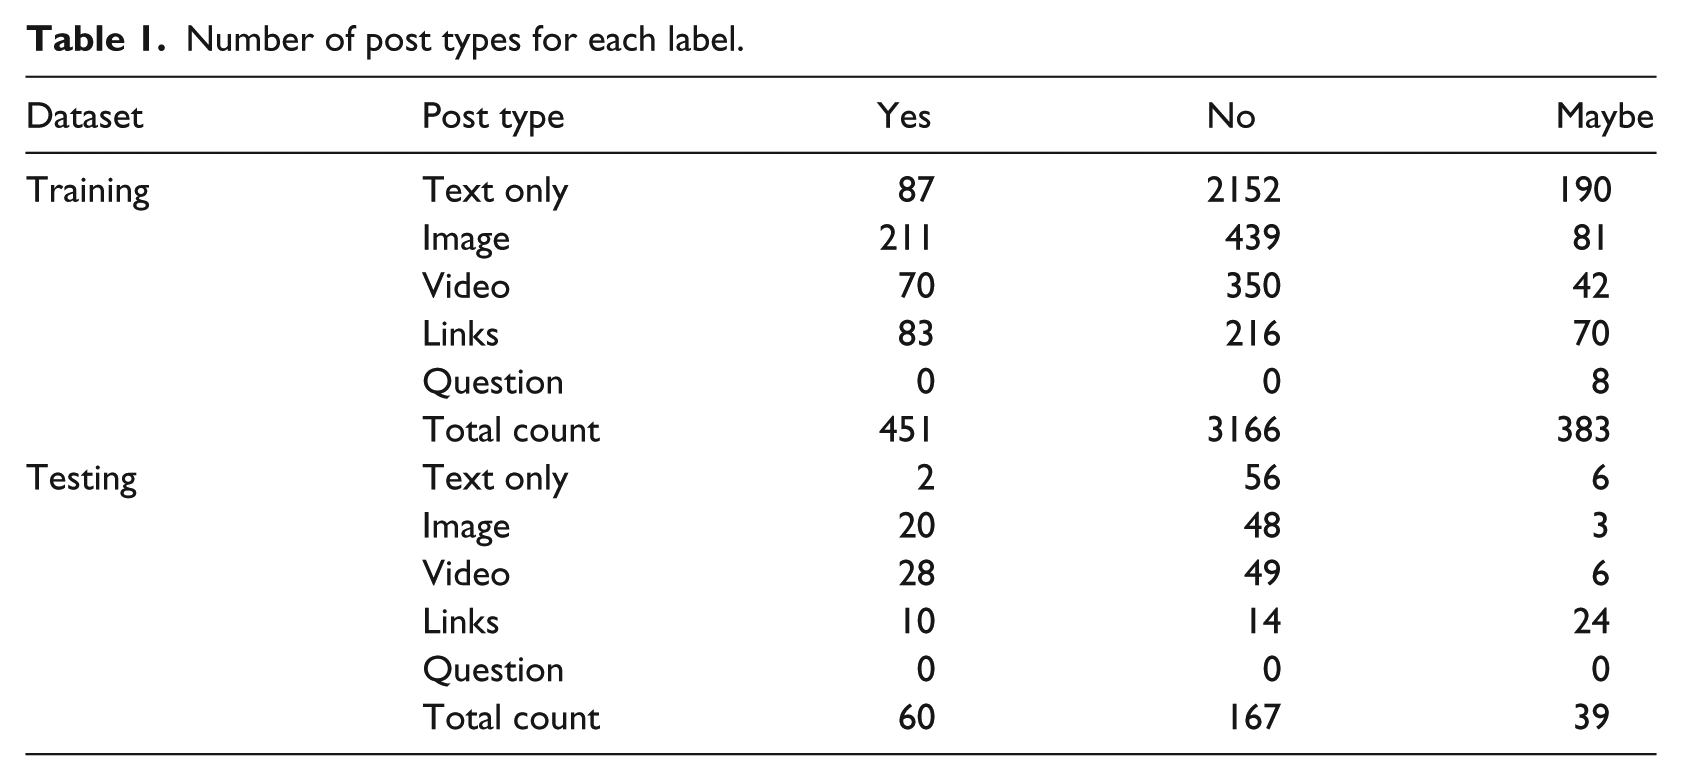
We split our dataset into 4000 posts for building the prediction models and 266 for testing them based on the posting date. The testing data were held out for independent evaluation of model performance. Each record for each post contained seven pieces of information: time stamp, user ID, message (text), link (to the image or video), post type (text, image, video, link, or question), label, and annotator’s hints. In Table 1, we report the number of the post types within each label. Around 61 percent of the posts contained text only without images, videos, or links; 18, 12, and 9 percent of the posts contained images, videos, and links, respectively. However, many of the posts (33%) had text besides multimedia.
Number of post types for each label.
Experimental design
We summarize the steps of our workflow in Figure 2. The workflow started with collecting Facebook posts, where many of them referred to Twitter, YouTube, and Instagram links. Then the annotators assigned one of three labels to each post, dividing them into classes (“Yes,” “No,” “Maybe”). In the data preprocessing step, we cleaned the text in order to improve the classification performance by filtering out emoticons, links, and hash tags, since they contain special characters, which are considered noise. 37 However, we replaced the link with the URL in order to preserve the existence of the link in text and inform the model whether or not the post had a link. The stop words were also filtered out, since they would impose sparsity and enlarge the feature vector. We imported the stop word list from the Natural Language Toolkit 38 corpus as the standard list for filtering.
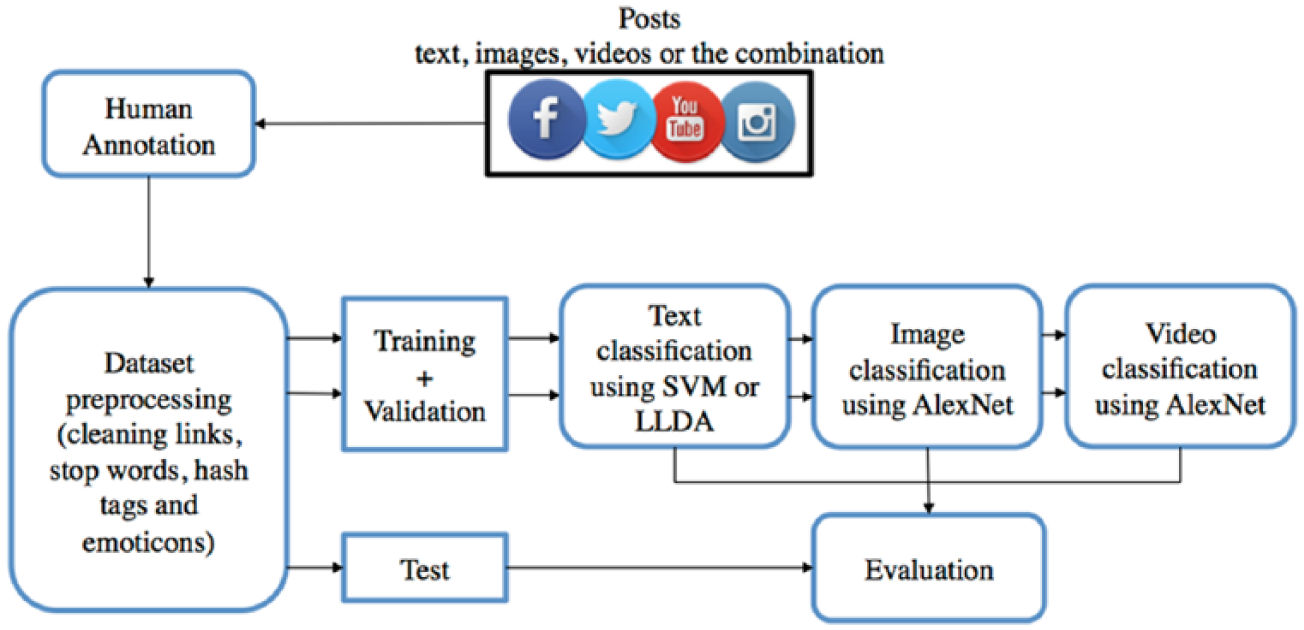
Experimental workflow: the major steps of collecting and annotating data, followed by training and evaluating the classification models.
In order to apply our various machine learning models on top of the heterogeneous data types, we first built one model per post type (i.e. text, images, videos) separately, then sorted the priority of the models according to the descending order of their performance. In the end, we combined the top performing models to improve performance.
Previously, we built SVM classifiers with linear kernel to identify drinking-related contents. 39 The experiment was based on the assumption that the data are linearly separable using the term frequency–inverse document frequency (TF-IDF) 40 as the feature vector. In this refined work, we consider the possibility that the data points might not be linearly inseparable and build SVM classifiers with polynomial, sigmoid and radial basis function (RBF) kernels. We still used the “TfidfVectorizer” function of the Python library “sklearn” 41 to create the TF-IDF feature vector before comparing the results of different SVM kernels using the functions provided by the same library. In implementation, we used the “LinearSVC” function, which is implemented using the “liblinear” C library instead of the linear kernel of the SVC function, because it performs better.
In addition, we adopted LLDA 33 to classify the posts by treating the classes (“Yes,” “No,” “Maybe”) as the labels to which the topics of the model are constrained. Topic modeling gained momentum since the Blei et al. 42 published the unsupervised method, LDA, where the number of topics has to be assigned before the inference process. In 2009, a supervised topic model—namely, LLDA—was introduced by Ramage et al. 33 We experimented with two LLDA inference algorithms—namely, Gibbs sampling and collapsed variational Bayes with a zero-order Taylor expansion approximation (CVB0)—to find the best performance model. The implementation of Gibbs sampling for LLDA is based on the sharing of Nakatani Shuyo from Cybozu Labs, Inc., on GitHub (https://github.com/shuyo/iir/blob/master/lda/llda.py), and the implementation of CVB0 is done using the Stanford topic modeling library (https://nlp.stanford.edu/software/tmt/tmt-0.4/).
When building the image classification model, we first resized all input images to the size of 256 × 256 pixels in order to fit them into the neural network (AlexNet). 43 To enhance the performance of the model, we also parsed more images from the videos. One image was extracted for every 100 frames from each of the 462 videos and then added to the training dataset. After the forward propagation of the images through the neural network in batches, the back propagation was performed using Nestrov’s accelerated gradient descent solver. The training process iterated for 30 epochs over all of the images. The test data were resized similarly and then forward passed into the neural network for classification. For video classification, we used one image per 10 frames as the training set. We applied the same process for images, using AlexNet with Nestrov’s accelerated gradient solver for 30 epochs.
In an attempt to boost our model’s prediction performance, we first visualized the posting frequency patterns along the weekday and hour of the day in order to determine whether it is feasible to use posting time as an informative feature. In Figure 3, we represent the weekdays on the x-axis and the hours on y-axis, where the opacity of each dot indicates the relative number of posts at a particular day and hour; the dots are color-coded according to the label representation. As shown in Figure 3, all of the days have similar publishing patterns for the posts of different labels, especially for the dominating majority class of nondrinking posts. Therefore, we decided not to use the time stamp as a feature in our prediction.
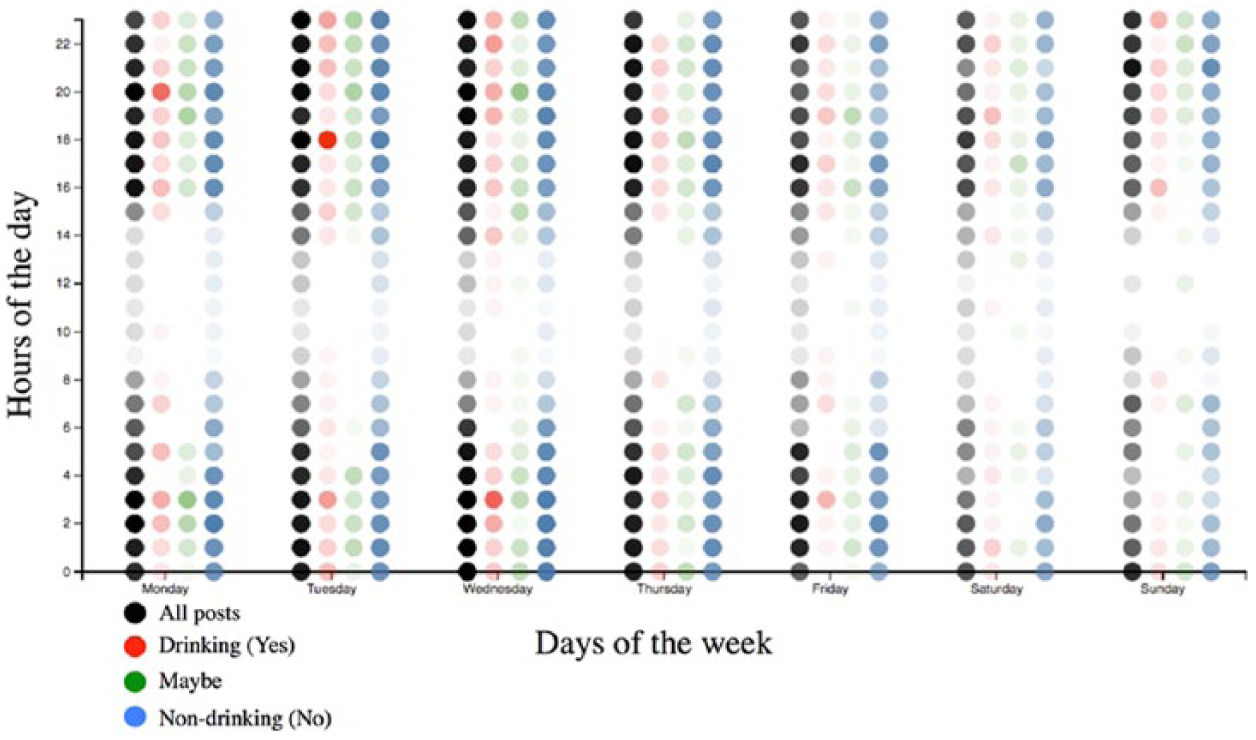
Posting patterns.
Results and discussion
Text classifiers
In Table 2, we report the precision, recall, F1-score, and support of SVM and LLDA algorithms for the “Yes” classification only and provide the rest (i.e. “No,” “Maybe,” and average divided by total) in Supplementary Table 1.
Precision, recall, F1-score, and support for the text classifier using SVM and LLDA.
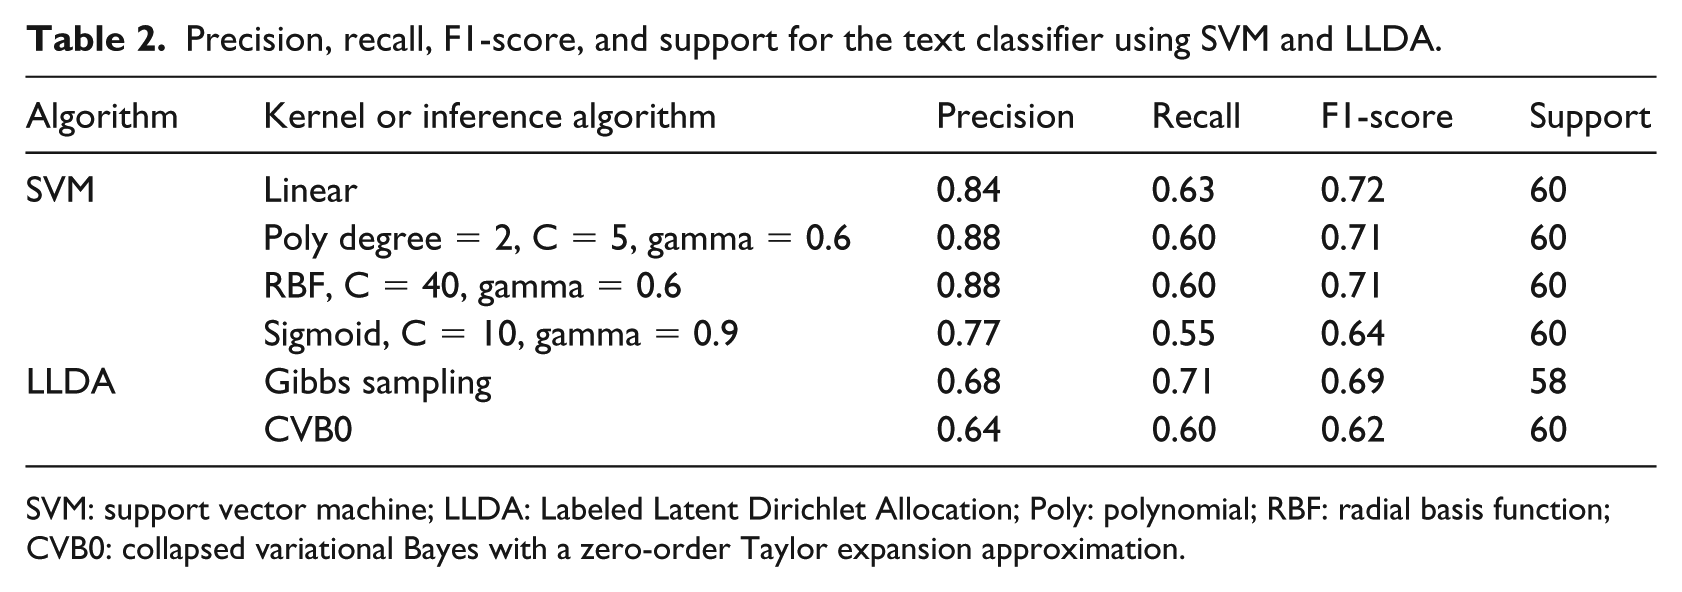
SVM: support vector machine; LLDA: Labeled Latent Dirichlet Allocation; Poly: polynomial; RBF: radial basis function; CVB0: collapsed variational Bayes with a zero-order Taylor expansion approximation.
The F1-score of the SVM’s linear kernel is the upper bound of the nonlinear kernels (polynomial, RBF, sigmoid). Table 2 shows the best F1-scores for the nonlinear after a grid search on the cost and gamma parameters. The reason behind the linear kernel’s better performance is the high ratio between the number of features (size of corpus vocabulary) and the number of posts, which is the typical nature of text data. In other words, there is no need to map the data points to a higher dimension in feature space using nonlinear kernels. Thus, it is easier to use the linear kernel and tune the cost parameter only for optimization rather than tuning the many interrelated parameters for the nonlinear kernels. 44
The separability of topic models relies on the ratio between the number of topics and the number of documents. This ratio in our dataset (3:4000) is very low in terms of extracting the possible latent topics, which are more than 3. Unlike the standard LDA, LLDA restricts the number of topics to the number of labels. 33 In addition, LDA in general has low performance on modeling social media, which is full of noise. Therefore, LLDA has a lower performance than the linear SVM classifier in our experiments.
On the other hand, including the content from crawled links as an input for the LLDA model increases accuracy, since topic models generally perform better with vocabulary-rich corpuses. The size of the vocabulary is 7825 and 5383 words when including and excluding the content from the links, respectively. Since the CVB0 is designed for large document collections, 45 the Gibbs sampling performed better on our dataset.
Image, video, and combined classifiers
To make a comparison between the three classification models, we reported the precision, recall, F1-score, and support for the “Yes” class only in Table 3 and also provided scores for the rest of the classes in Supplementary Table 2. In addition, we compared the text classification models when including and excluding content from links in Table 3. We excluded the results of the LLDA model, since SVM is a better text classifier.
The precision, recall, F1-score, and support of the text, image, video, and combined models for “Yes” class prediction.
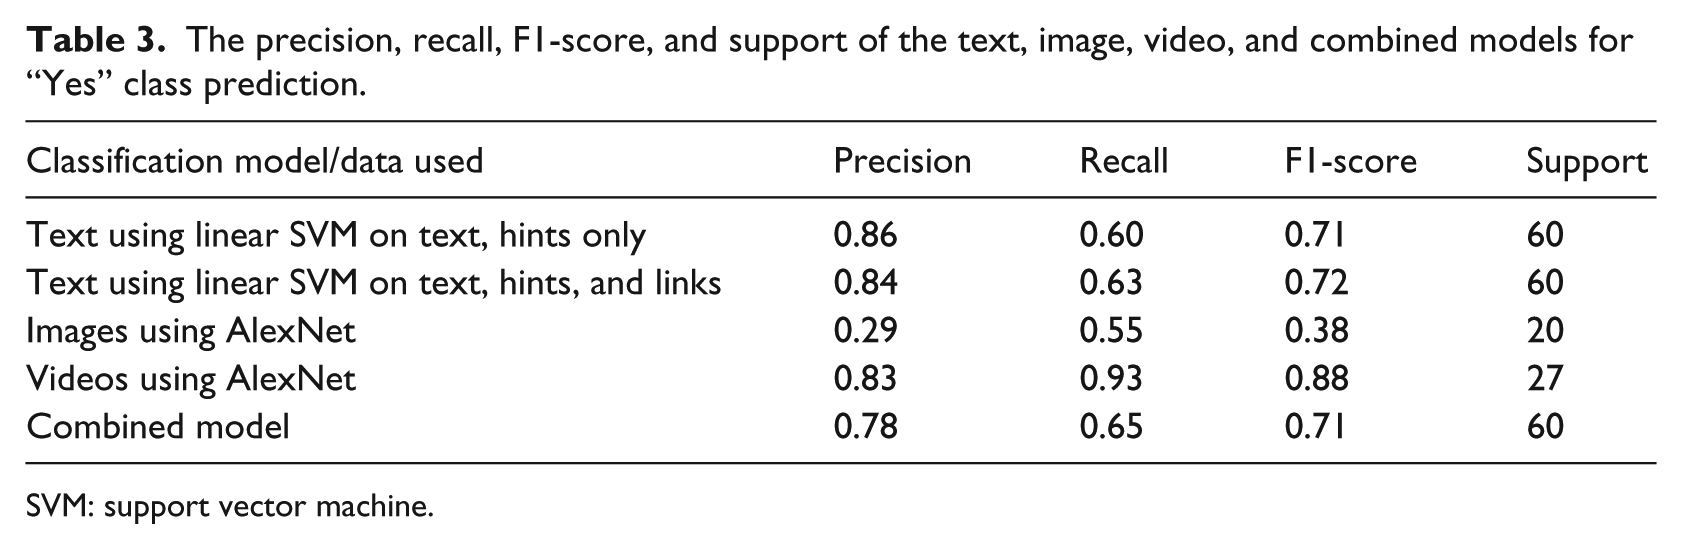
SVM: support vector machine.
SVM scores were very close on both text datasets (with and without links). The F1-score measure of the image classifier was insignificant compared to other models. After the images from the videos were resized to 256 × 256 pixels, the video classification model achieved the highest F1-score, which might be attributed to the larger number of images generated from video in the training dataset. Since each video might have different classification outcomes according to the different images we extracted and used for building the prediction models, we finalized the classification by considering the most frequent class labels. The low F1-score of the image classifier might be due to the lack of amount of training examples fed as input to the neural network. The image classifier had 5799 images for training, while the video classifier had almost four times that amount (i.e. 20,254 extracted images for training).
Since the image classification model had a low F1-score, we combined the results from text and video only for the final predictions, where the video’s predictions had a higher priority over the text’s predictions when deciding the final prediction. The video classifier was better than the text classifier in recall and F1-score; however, the support of the video classifier was substantially lower. When using the combined model, the recall was slightly improved and the precision decreased when comparing with the text classifier.
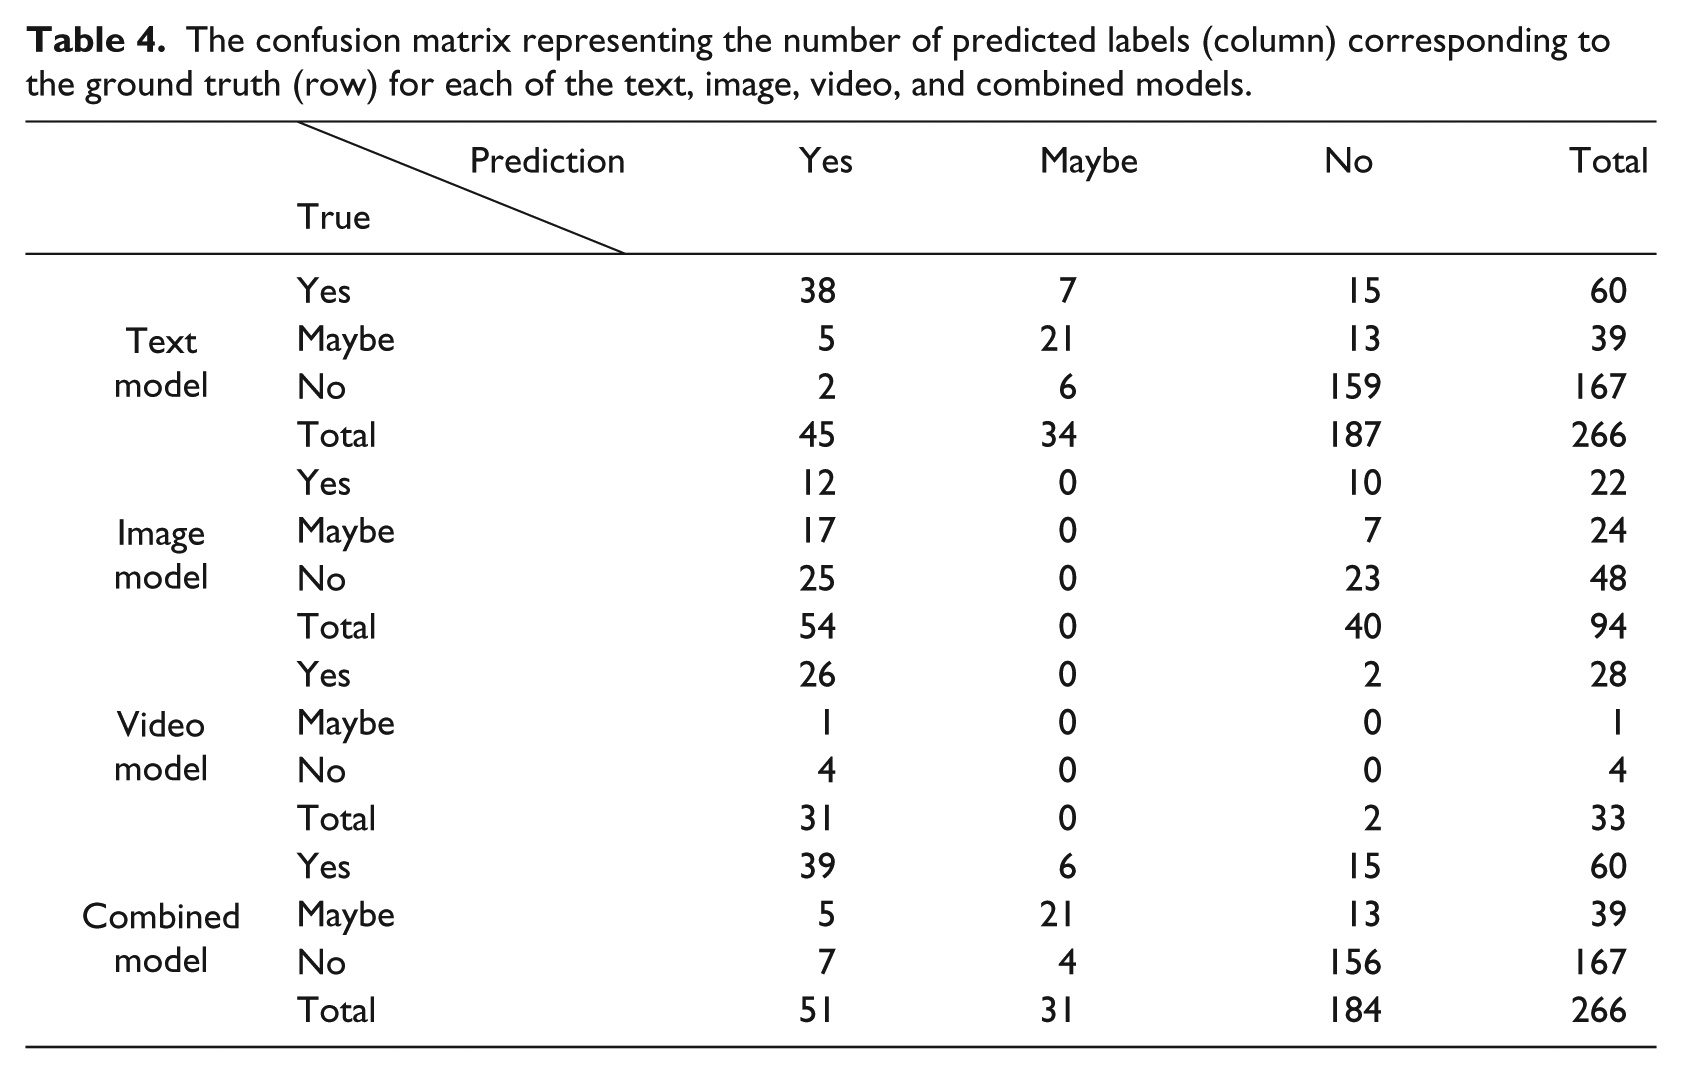
Table 4 shows the confusion matrix for the text, images, videos, and combined models separated by a comma in each cell, respectively. The confusion matrix conforms to the results in Table 3, where the F1-score measure of text and combined model is almost the same.
The confusion matrix representing the number of predicted labels (column) corresponding to the ground truth (row) for each of the text, image, video, and combined models.
Conclusion
In conclusion, we found that automating the detection of drinking-related posts on social media is feasible using text and image/video classification techniques. We applied SVM on the text of the collected posts and AlexNet on the images and videos in order to build prediction models to classify between drinking and nondrinking posts. The F1-score of the text model and video model reached 0.72 and 0.88 on the held-out dataset, respectively. The image model’s F1-score is less than 0.50, and thus, we did not use it in the combined model. We also found that the text classification model is the most reliable compared to the other two models, due to the number of training posts provided (i.e. 61% of the posts are text only). At the end, the text classification model performed almost the same as the combined model, because the video classification model did not improve on the misclassified posts from the text model. Our original expectations were that the video classifier would have corrected those misclassified posts and improve the F1-score, but unfortunately, the results did not support our expectation. The main reason was the low number of training examples for the video classifier, which decreased the support for the high F1-score.
There were three challenges in building high-performance models based on mining heterogeneous data types. First, there was a much higher abundance of text posts than image or video posts on Facebook. Second, we observed that college students who binge drink do not keep the drinking-related images or videos on their profiles for long periods of time. So truly, powerful and reliable prediction models should be able to monitor social media users’ activities in a real-time fashion with the presence of more images and videos. Last but not least, most of the posts on Facebook are discussions about diverse but irrelevant topics. The majority of the posts in our dataset are labeled “No,” which affected the recall scores for the “Yes” and “Maybe” classes, and accordingly lowered the F1-scores.
To our knowledge, this is first feasibility study on detecting drinking-related contents on social media by classifying heterogeneous data types; the promising results encourage us to pursue further research in this area. We envision that an ultimate social media–based application will provide a number of advantages relative to current practices: (1) it diminishes patients’ reluctance to admit and report their drinking problems to authority figures; (2) when students resist participating in public alcohol education programs or treatment plans, an intelligent application can deliver targeted information in a private and comfortable setting to students whenever and wherever they need such help; and (3) a machine intelligence–based solution is economical and easy to scale up once a useful solution is known. A directed, but nonintrusive, intervention program is desired by many stakeholders who care about the growth and development of college students while considering privacy rights of individuals.
The underlying technologies are also transferrable to addressing other public health issues, such as illegal drug use, depression, suicide, eating disorders, crime prevention, and improving students’ adjustment to college. However, there are several challenges we need to address before achieving this goal. First, although the Substance Abuse and Mental Health Services Administration defines heavy drinking as drinking five or more drinks on the same occasion on each of 5 or more days in the past 30 days, this term needs to be further quantified when transforming into users’ online activities on social media. We need to conduct more studies with behavioral and substance-abuse scholars to determine what online behaviors indicate unhealthy, heavy drinking and to identify target users for social media–based interventions. Another avenue of interest is to implement near-real-time classification, which is sensitive and reliable enough to catch all relevant and risky drinking activities posted on social media. As observed in our study, social media users often delete inappropriate contents, particularly in the format of image and video after impromptu posting. Last but not least, the posting of drinking-related contents on social media is still a rare event by nature. Such imbalance inevitably impedes the performance of machine learning algorithms. We did not address much of this issue in this study. In the future, we aim to develop techniques that perform undersampling or oversampling of asymmetric categories to create more balanced training datasets and improve model performance.46,47
Supplemental Material
Supplementary_File – Supplemental material for A feasibility study on identifying drinking-related contents in Facebook through mining heterogeneous data
Supplemental material, Supplementary_File for A feasibility study on identifying drinking-related contents in Facebook through mining heterogeneous data by Omar ElTayeby, Todd Eaglin, Malak Abdullah, David Burlinson, Wenwen Dou and Lixia Yao in Health Informatics Journal
Footnotes
Acknowledgements
We show our gratitude and thank our colleagues at the University of North Carolina at Charlotte, Boshu Ru, Jingyi Shi, Yi Zhen, Charles Warner-Hillard, and Kimberly Harris, for their hard work in annotating the dataset.
Declaration of conflicting interests
The author(s) declared no potential conflicts of interest with respect to the research, authorship, and/or publication of this article.
Funding
The author(s) disclosed receipt of the following financial support for the research, authorship, and/or publication of this article: Funding for this study was partially provided by the National Library of Medicine (5K01LM012102).
Supplemental material
Supplemental material for this article is available online.
References
Supplementary Material
Please find the following supplemental material available below.
For Open Access articles published under a Creative Commons License, all supplemental material carries the same license as the article it is associated with.
For non-Open Access articles published, all supplemental material carries a non-exclusive license, and permission requests for re-use of supplemental material or any part of supplemental material shall be sent directly to the copyright owner as specified in the copyright notice associated with the article.