
Abstract
Social media posts regarding measles vaccination were classified as pro-vaccination, expressing vaccine hesitancy, uncertain, or irrelevant. Spearman correlations with Centers for Disease Control and Prevention–reported measles cases and differenced smoothed cumulative case counts over this period were reported (using time series bootstrap confidence intervals). A total of 58,078 Facebook posts and 82,993 tweets were identified from 4 January 2009 to 27 August 2016. Pro-vaccination posts were correlated with the US weekly reported cases (Facebook: Spearman correlation 0.22 (95% confidence interval: 0.09 to 0.34), Twitter: 0.21 (95% confidence interval: 0.06 to 0.34)). Vaccine-hesitant posts, however, were uncorrelated with measles cases in the United States (Facebook: 0.01 (95% confidence interval: −0.13 to 0.14), Twitter: 0.0011 (95% confidence interval: −0.12 to 0.12)). These findings may result from more consistent social media engagement by individuals expressing vaccine hesitancy, contrasted with media- or event-driven episodic interest on the part of individuals favoring current policy.
Introduction
Measles results from infection due to an RNA virus in the genus Paramyxoviridae. Transmitted by the respiratory route, measles is one of the most contagious diseases known. 1 Most individuals in the developed world recover without complications, and the death rate of 1–3 per 1000 is largely due to measles pneumonia. 2 The disease causes fever, cough, and rash,3,4 following an incubation period of 8–12 days.3,5,6 Subacute sclerosing panencephalitis is a rare but fatal and untreatable complication.2,7 Measles infection normally confers lifelong immunity. 8
Vaccination with the measles, mumps, and rubella (MMR) vaccine confers long-lasting protection, which may be life-long. 9 The two-dose MMR schedule shows an efficacy of approximately 94 percent. 10 High vaccination rates achieve herd immunity and are the basis for measles elimination. 8 The World Health Organization estimates that measles vaccination has prevented 20.3 million deaths worldwide during 2000–2015. 11 In the United States, although measles was declared locally eliminated, 12 it is repeatedly reintroduced. In late 2014 to early 2015, a measles outbreak linked to Disneyland theme parks caused approximately 130 cases in California alone; it spread to other states in the United States, as well as Canada and Mexico.13,14
Measles transmission in recent years has been linked to vaccine refusal. 15 Opposition to preventive inoculation is hardly new,16,17 although in recent years a now-retracted 18 study led by A. Wakefield may have reinvigorated anti-vaccination controversy.19,20 Significant media attention to this research and personal anecdotes from celebrities may have caused a sense of fear and distrust in the vaccine among some individuals, potentially contributing to a decrease in vaccination rates in some locations.19,21,22 Despite these real concerns about falling vaccination rates, overall US national levels of MMR vaccine coverage appear to have remained high in recent years.23,24
Social media sites may now have become a reflection of the beliefs and practices of people in their daily lives. 25 Use of social media is extensive; Twitter reports more than 300 million active users globally in 2016 26 and significant numbers of online American adults interviewed by the Pew Research Center endorsed using Twitter in 2015 (23%) and Facebook (FB; 72%). Furthermore, Twitter and FB provide large amounts of publicly accessible data over a number of years, from very large user bases.
Social media have had a large and growing role in health communication.27–30 Public health and research organizations have also turned to social media as a form of digital public health surveillance to augment traditional methods of risk or disease monitoring31–38 or as a communication tool.39–41 A growing number of non-traditional sources for health information, including blogs and alternative news sites, are available online.42–46
Examination of social media can provide insight into public discussion of vaccination 47 and may be predictive of geographical variation in vaccination compliance.48,49 While Internet communication has played a large role in vaccine opposition for a number of years, 50 social media provide an outlet to share beliefs widely in real time.42,51,52 Individuals opposing vaccination have also made substantial use of social media and emerging communication technologies.51,53,54
Previous studies examining social media and public discourse on measles vaccinations have focused on posts during an outbreak35,51 and predictors of which articles are shared on social media. 55 Others have found differences in linguistic usage between pro- and anti-vaccination posts in certain settings. 56 Other studies have focused on vaccines other than MMR.52,57 An important resource for understanding vaccine sentiment worldwide is provided by the recently introduced Vaccine Sentimeter, 47 which used the public Twitter API and other sources of information (including news sources and blogs), to yield an index of vaccine sentiment (positive, negative, and neutral/unclear). This tool reports data from May 2012 to November 2014. 58 Previous studies have also used machine learning classifiers to simply explore and describe the Twitter conversation during a disease outbreak. 59 Other studies have used social media to relate human mobility to disease transmission, 60 to forecast disease incidence during an outbreak,61,62 and to track the spread of rumor and perceived risk during an outbreak. 63
In this report, we examine FB and Twitter social media discussion of vaccination in relation to measles from 2009 to mid-2016, a period including several widely publicized outbreaks. We related volume and machine-learned vaccine-related stance 64 to Centers for Disease Control and Prevention (CDC)-reported weekly measles counts. Vaccine hesitancy refers to “delay in acceptance or refusal of vaccination despite availability of vaccination services.” 65 We conjectured that individuals who do not express vaccine hesitancy (who are in favor of current practice) become drawn into the debate during actual outbreaks of measles (which may, for example, be perceived as a threat). Accordingly, we hypothesized that the number of posts exhibiting a given stance—pro-vaccination (essentially in favor of current practice), or vaccine hesitant—expressed in FB posts and on Twitter regarding vaccinations would differ depending on whether a measles outbreak was occurring in real time or not.
Methods
Overview
We constructed a list of keywords regarding opinion about vaccinations or measles and used a commercial social media analytics platform66,67 (Crimson Hexagon) to collect FB posts and tweets, from 2009 to mid-2016, that contained these keywords. We trained the BrightView classifier provided by the platform to group FB posts and tweets into four classes: pro-vaccination, expressing vaccine hesitancy, on-topic but unclear, and off-topic. The BrightView classifier is a supervised learning algorithm based, in part, on stacked regression analysis of simplified numerical representation of text. 68 These machine-coded classifications were assessed by comparison with human classifications of a random sample of FB posts and tweets. Finally, we compared the volume of FB posts and tweets to CDC reports of daily measles counts.
Data collection: social media
FB and Twitter data
FB and Twitter data yield spatiotemporal patterns for measles/vaccination posts of interest. Using Boolean search, we searched for FB posts and tweets related to vaccination (the query is found in Appendix 1). To focus posts expressing the original stance of individuals, retweets and posts with URLs (or those likely to be advertisements) were filtered out prior to our primary analyses. To compare those results to the broader conversation, such posts were included in subsequent analysis. Along with the post contents, we collected the date and time the posts were published as well as metadata regarding the Twitter and FB accounts submitting the posts.
Using the primary corpus (having already removed retweets, for example), we assessed the effect of highly repetitive tweets as follows. We computed the edit distance 69 for all pairs of unique tweets found in our search. From this, for each tweet, we identified all tweets in our corpus within an edit distance of 20 for each tweet (chosen to allow posts to differ by, for instance, a short URL or user name). For each author, we assessed whether that author had emitted at least one tweet or not to which there corresponded another tweet in the corpus which was within a distance of 20 (whether by the same or by an additional author).
Data collection: measles cases
Measles data were acquired from the CDC Morbidity and Mortality Weekly Report (MMWR) website, tabulated MMWR Reports of infrequently reported notifiable diseases, for years 2009–2016. The period covered by our study was 4 January 2009–27 August 2016. US measles data are presented by the CDC as (1) weekly reported cases and (2) cumulative to date. Cases are diagnosed based on laboratory findings or confirmed epidemiologic link to a laboratory-confirmed case. Methods of laboratory confirmation include viral isolation, detection of measles-virus specific nucleic acid, IgG seroconversion (or a significant rise), or a positive serologic test for measles immunoglobulin M antibody. 70 Since initial samples are ideally collected within the first few days following rash onset71–77 and possibly within a few weeks,72,73 diagnosis-related delays longer than this are unlikely. The cumulative column reported by the CDC contains additional cases not reported in the weekly totals, since cases newly reported from past weeks are added to the cumulative total. Thus, neither of these reporting streams provide a complete count of all cases occurring in a given week. For the cumulative series, we removed outliers (reporting error) using a 5-week centered median filter 78 and then computed the final differenced series (number of new cases added to the cumulative total each week).
Stance analysis
Using the built-in BrightView classifier, 66 the media analytics platform was also trained to separate FB posts and tweets as (1) vaccine hesitant, (2) pro-vaccination, or (3) neither; a total of 96 posts were used for each (the minimum recommended being 25 per category). The third category was further subdivided into (3a) unclear whether pro-vaccination or vaccination hesitancy despite being related to vaccination or (3b) unrelated to vaccination. Individuals exhibiting vaccine hesitancy do not form a monolithic bloc,65,79 and so we viewed vaccine hesitancy in a broad sense. We classified as vaccine-hesitant tweets expressing views including universal opposition, opposition to contents of selected vaccines or vaccination schedules, or a conviction that vaccine-related injuries occur at higher rates than commonly believed. Individuals expressing views in favor of vaccination, of current policy, or simply expressing opposition to vaccine hesitancy were classified simply as “pro-vaccination”; no evidence supports the view that “pro-vaccination” individuals form a monolithic bloc either.
To validate the training, three raters manually reviewed and categorized FB posts and tweets into the same four categories and their categorizations were compared to the machine-learned categorizations. The human categorization process consisted of each rater independently reading each tweet or FB posts and determining for each post the following: does the post either (1) clearly express vaccine hesitancy in whole or in part, (2) favor vaccination, or clearly critique vaccine hesitancy or “anti-vaxxers,” (3) reference vaccination without clearly expressing or opposing vaccine hesitancy, or is it (4) irrelevant to the debate).
Reviewers first trained together on randomly selected tweets from our corpus (excluding any used in training the machine). A group discussion with all three raters followed to reconcile disagreements in the categorization and to gain familiarity with the discussion on Twitter (i.e. to become aware of the language used in these posts, as well as prominent or potentially polarizing figures in the vaccination debate). The raters subsequently completed a second iteration of the training with a smaller set of tweets followed by a brief discussion. We then provided the raters with Google sheets containing 512 randomly chosen tweets (excluding any used in training either the raters or the machine; the sample size would provide a confidence interval (CI) of half-width approximately 0.02 for estimated proportions near 0.5).
All rated the same tweets, masked to the results of other raters and that of the machine. In addition to the tweet content and URLs to the original tweet, the raters were provided the authors twitter handle (user name) and their actual name, geolocation, and gender if they were available through Crimson Hexagon. For tweets classified by the machine as expressing vaccine hesitancy by the machine, we report the fraction of such posts actually classified as vaccine hesitant by each rater; similarly, for tweets classified as pro-vaccination by the machine, we report the fraction of posts classified as pro-vaccination by the raters.
After completing tweet classifications, we conducted a similar process for the three human raters to classify a set of FB posts, masked to the classifications assigned by other raters and by the machine. Their classifications were analyzed for validation of the machine-learned categorizations. The sample size was halved, since the FB posts were substantially longer than tweets.
Statistical analysis
We report (1) the total weekly volume of identified FB posts and tweets identified as pro-vaccination, vaccine-hesitant, or neither pro- nor vaccine-hesitant (but on topic), (2) the weekly volume of tweets classified by the machine as pro-vaccination, and (3) the weekly volume of tweets classified by the machine as vaccine hesitant. For FB posts and separately for tweets, and for each of these three outcome variables, we computed the Spearman rank correlation with (a) the CDC weekly counts and (b) the first-differenced cumulative count series described above. As a sensitivity analysis, we used our classification of weeks as being in or not in an outbreak (as described in section “Methods”) and report the number of FB posts and tweets, advocating and criticizing vaccine hesitancy, during outbreak and non-outbreak periods; we computed the odds ratio for association. CIs in all cases were constructed using time series bootstrap, 80 with a fixed width of 8. All calculations were conducted in R, version 3.2 for MacIntosh (R Foundation for Statistical Computing, Vienna, Austria).
Results
Identified posts
A total of 58,078 FB posts and 82,993 tweets were identified. Of FB posts, 22,331 were known to be located in the United States. A total of 38,644 tweets were known to be located in the United States. Geolocation was unavailable for 33,335 out of 58,078 (57.40%) of FB posts and for 30,086 of 82,993 (36.25%) of tweets. The earliest post matching our query occurred on 23 June 2009.
Classification
For FB, the algorithm classified 22,306 posts as against vaccination, a total of 17,928 posts as pro-vaccination, and 2431 posts as uncertain but on topic (“neither” in the table). The machine algorithm classified a total of 43,259 tweets as against vaccination, a total of 16,297 tweets as pro-vaccination, and 12,222 tweets as uncertain but on topic (“neither” in the table). The number and stance of FB posts and tweets classified as expressing vaccine hesitancy or expressing pro-vaccination views are shown in Figures 1 and 2, respectively.
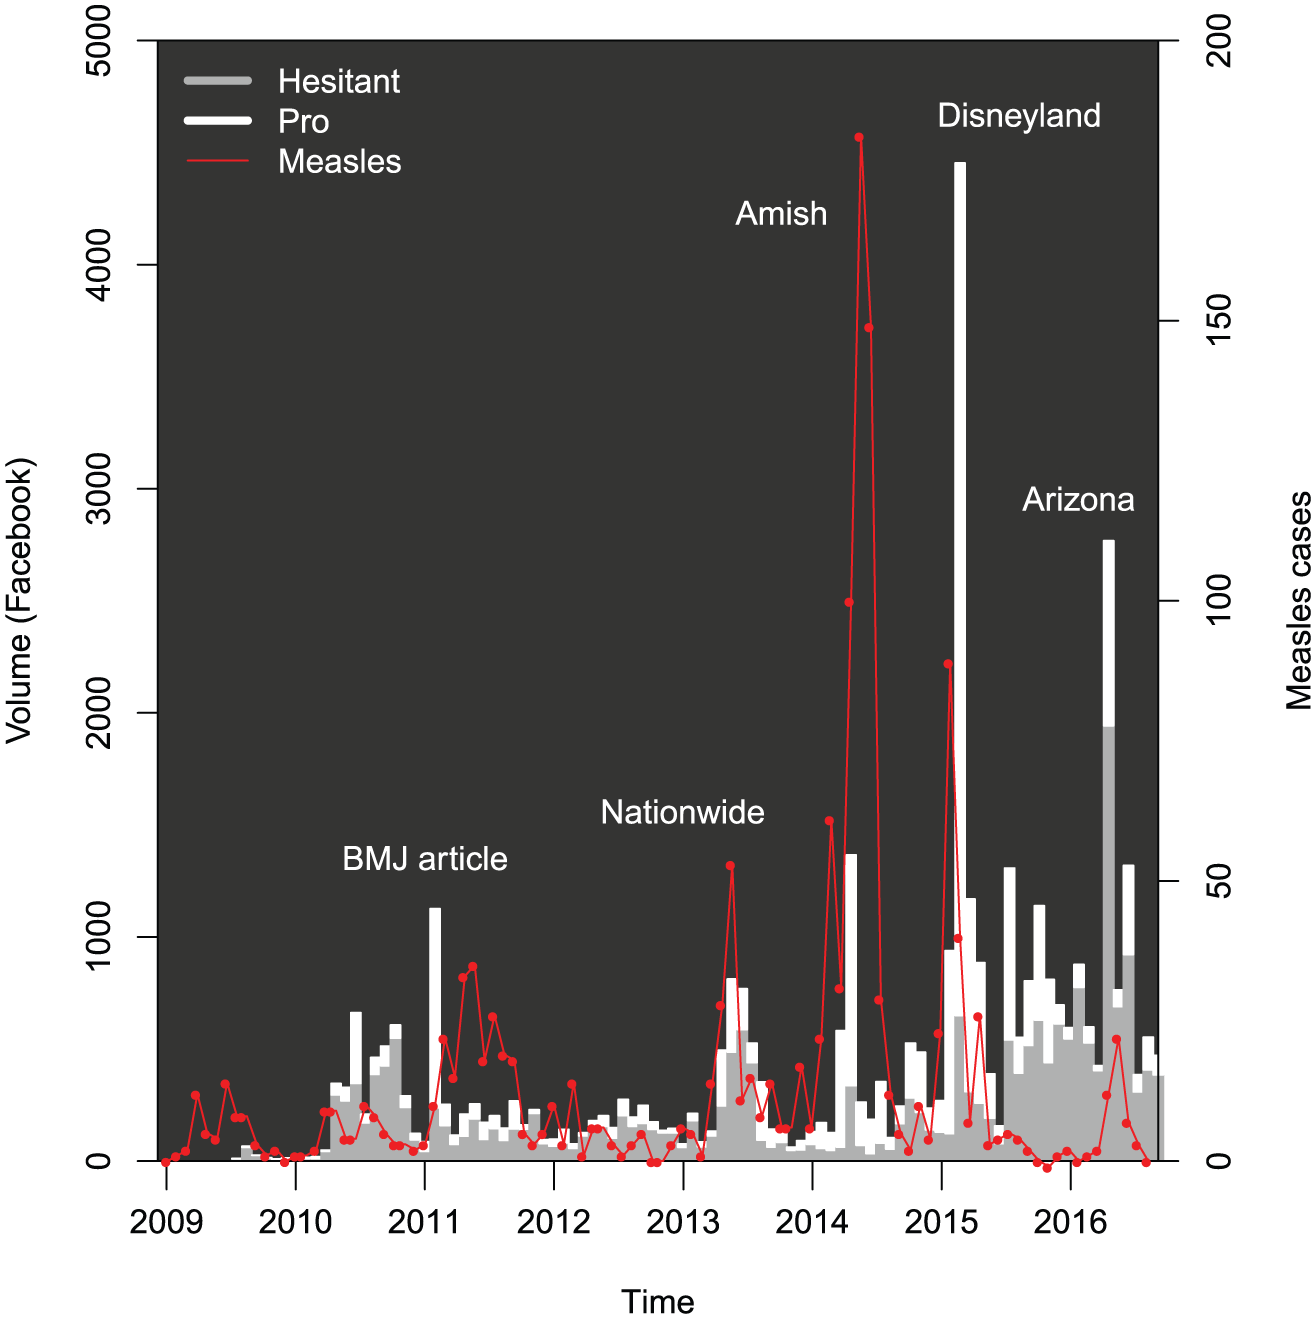
Facebook volume matching query, by stance, 2009–2016, according to classification by as described in the text. Measles cases are shown by the differenced cumulative series derived from CDC reports, as described in the text. Facebook volume and reported measles cases shown in consecutive periods of 4 weeks, with a first period consisting of 3 weeks. BMJ article indicates Deer (2011). Additional details on the measles outbreaks are given in Appendix 1.
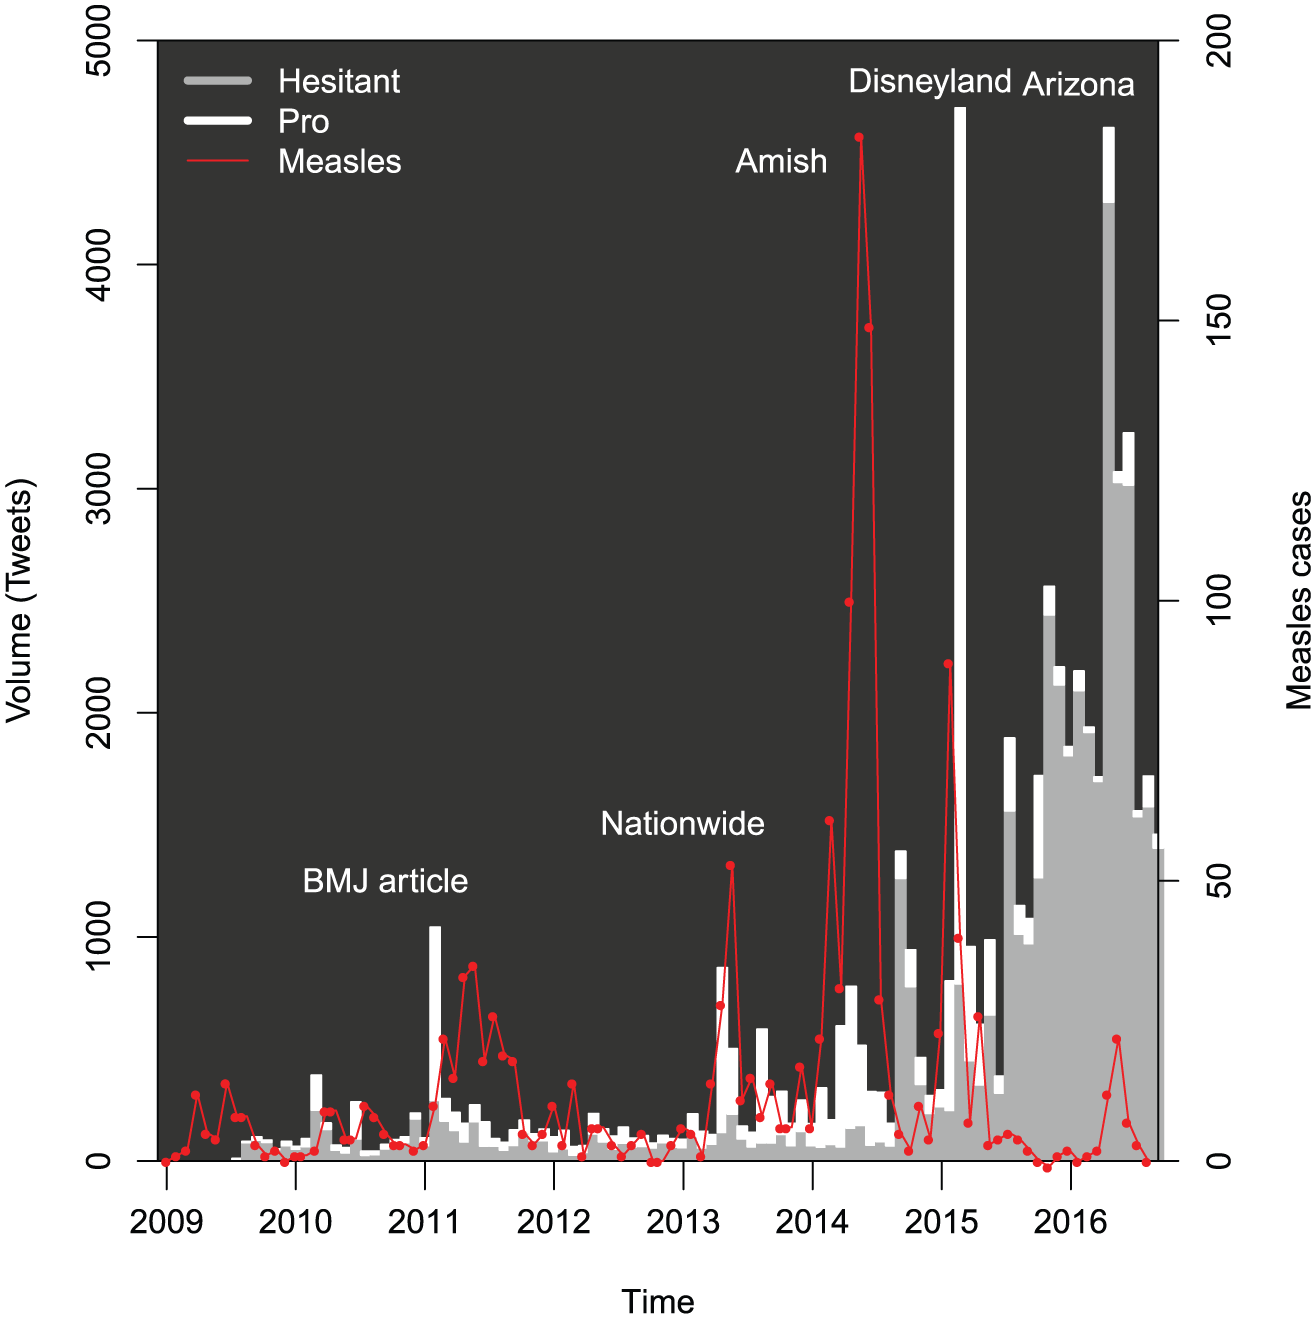
Tweet volume matching query, by stance, 2009–2016, according to classification by BrightView, as described in the text. Measles cases are shown by the differenced cumulative series derived from CDC reports, as described in the text. Tweet volume and reported measles cases shown in consecutive periods of 4 weeks, with a first period consisting of 3 weeks. Additional details on the measles outbreaks are given in Appendix 1.
The figures also show changes in reported measles cases over the study period. Epidemics occurring during most of 2011 were reported at the time as “the worst measles year in 15 years,” with 222 cases provisionally reported across 31 states. 81 Another epidemic period corresponds to epidemics across 16 states, including New York City during the spring and summer of 2013, 82 as well as a publicized epidemic which included a large church in Texas. 83 A third includes the outbreak in Ohio largely among Amish residents, which was also the largest outbreak post-elimination. 84 The figure also illustrates the outbreak which apparently began in Disneyland, causing approximately 130 cases in California and spreading to other states. 13 Finally, a recent epidemic period includes an outbreak in Arizona. 85
Validation
Comparison of the machine algorithm with each human rater is shown in Table 1, and agreement of the human raters with each other is shown in Table 2. The first table shows the fraction of times the human rater agreed with a machine classification of a post as being vaccine hesitant versus pro-vaccination.
Agreement of stance classification of social media posts by three human raters and automated algorithm.
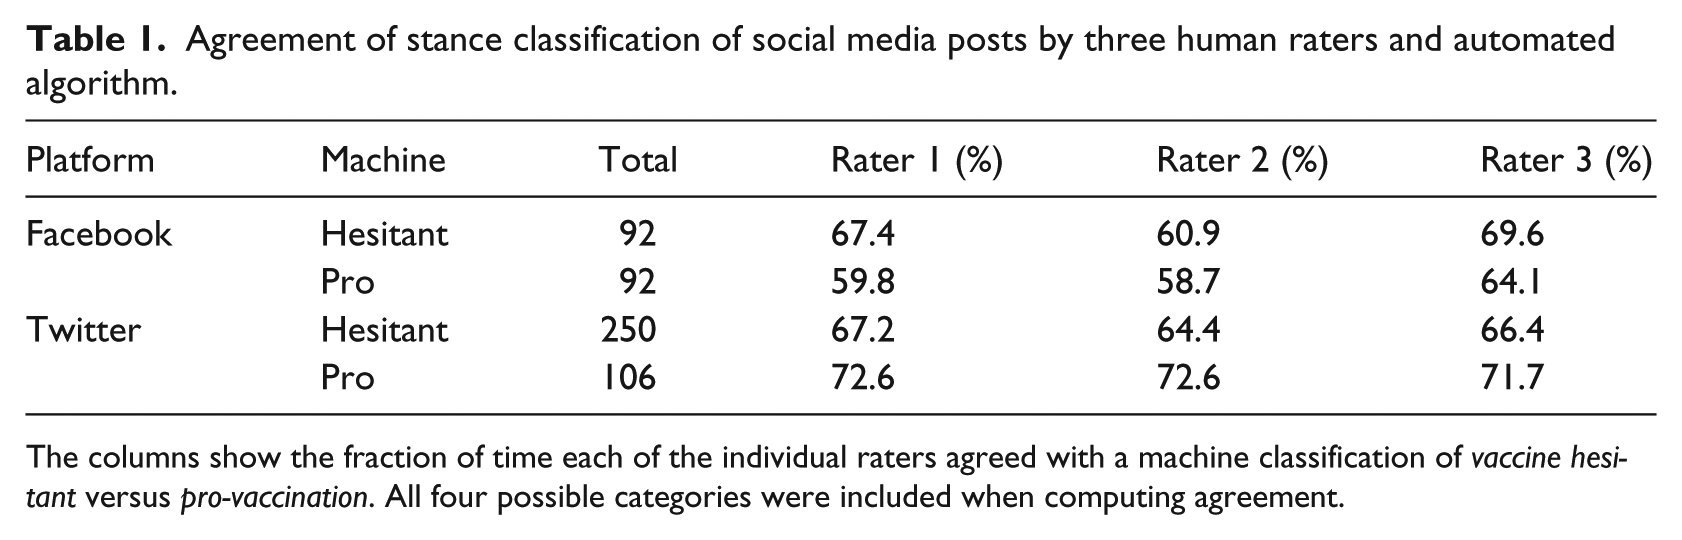
The columns show the fraction of time each of the individual raters agreed with a machine classification of vaccine hesitant versus pro-vaccination. All four possible categories were included when computing agreement.
Agreement of human raters with one another.
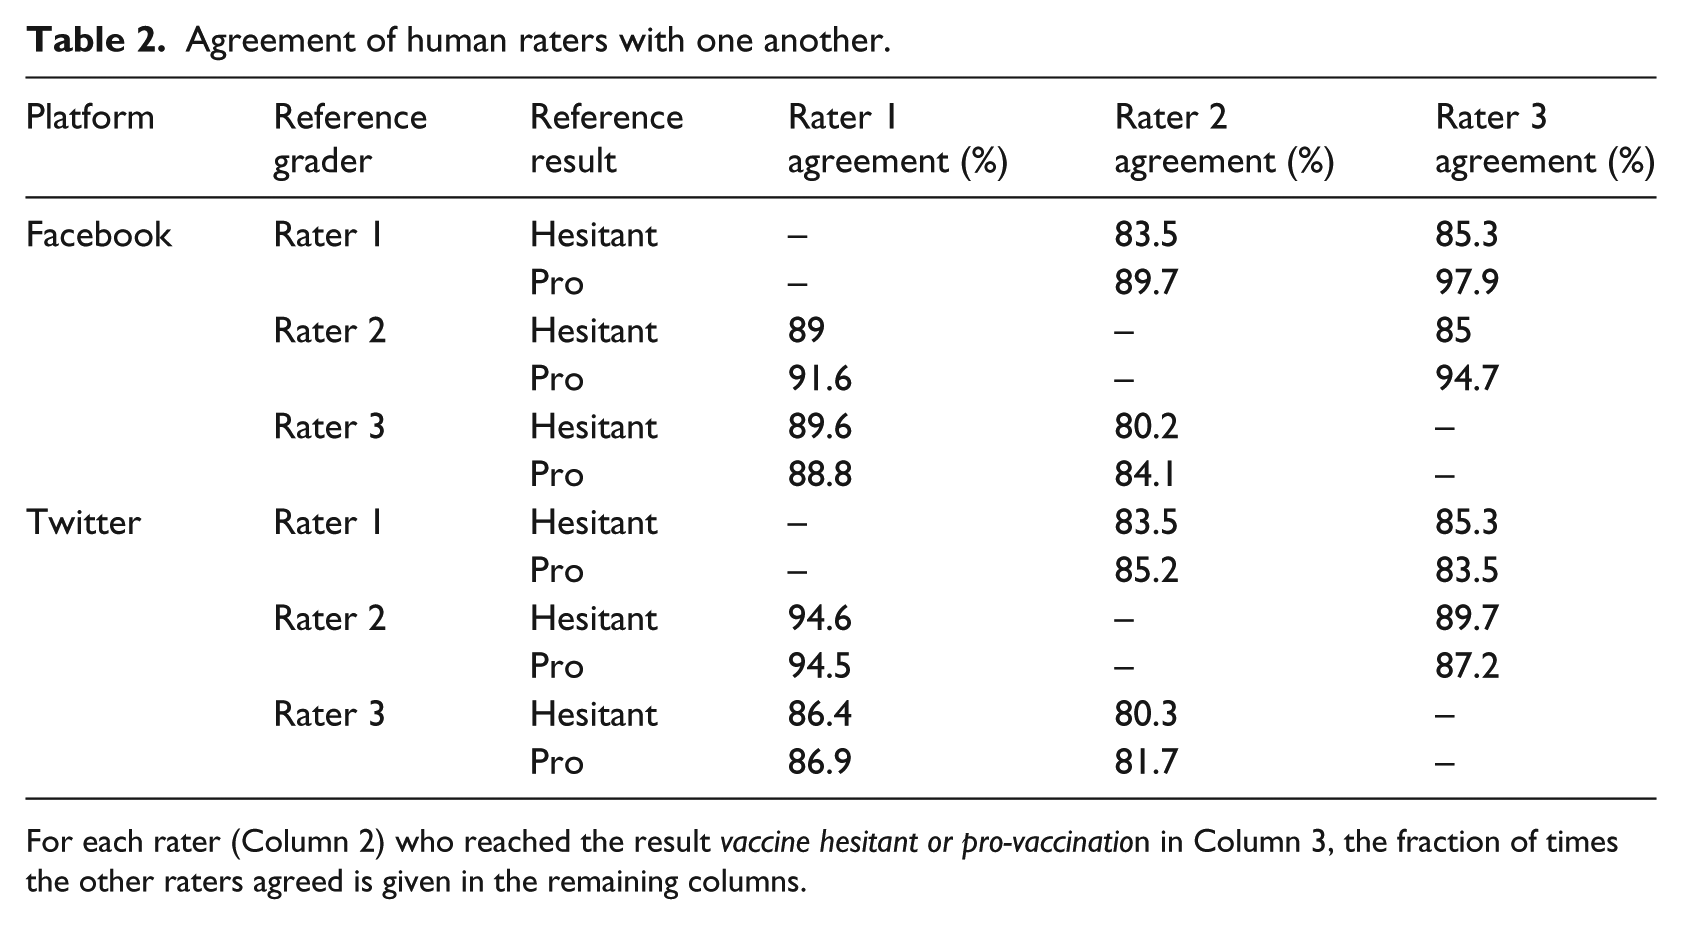
For each rater (Column 2) who reached the result vaccine hesitant or pro-vaccination in Column 3, the fraction of times the other raters agreed is given in the remaining columns.
Social media and measles surveillance
For the total FB post volume identified by our search and the weekly measles reports, we found that the Spearman rank correlation was 0.11 (95% CI: −0.02 to 0.22). For the number of pro-vaccination FB posts, the correlation with the weekly reports was 0.22 (95% CI: 0.09 to 0.34). For the number of FB posts expressing vaccine hesitancy, the correlation with the weekly reports was 0.01 (95% CI: −0.13 to 0.14).
For the total tweet volume identified by our search and the weekly measles reports, we found that the Spearman rank correlation was 0.06 (95% CI: −0.08 to 0.18, time series bootstrap). For the number of pro-vaccination tweets, the correlation with the weekly reports was 0.21 (95% CI: 0.06 to 0.34). For the number of tweets expressing vaccine hesitancy, the correlation with the weekly reports was 0.0011 (95% CI: −0.12 to 0.12). Correlations with the differenced cumulative series and for FB are shown in Table 3.
Correlation of social media stance with reported US measles cases, 2009–2016.
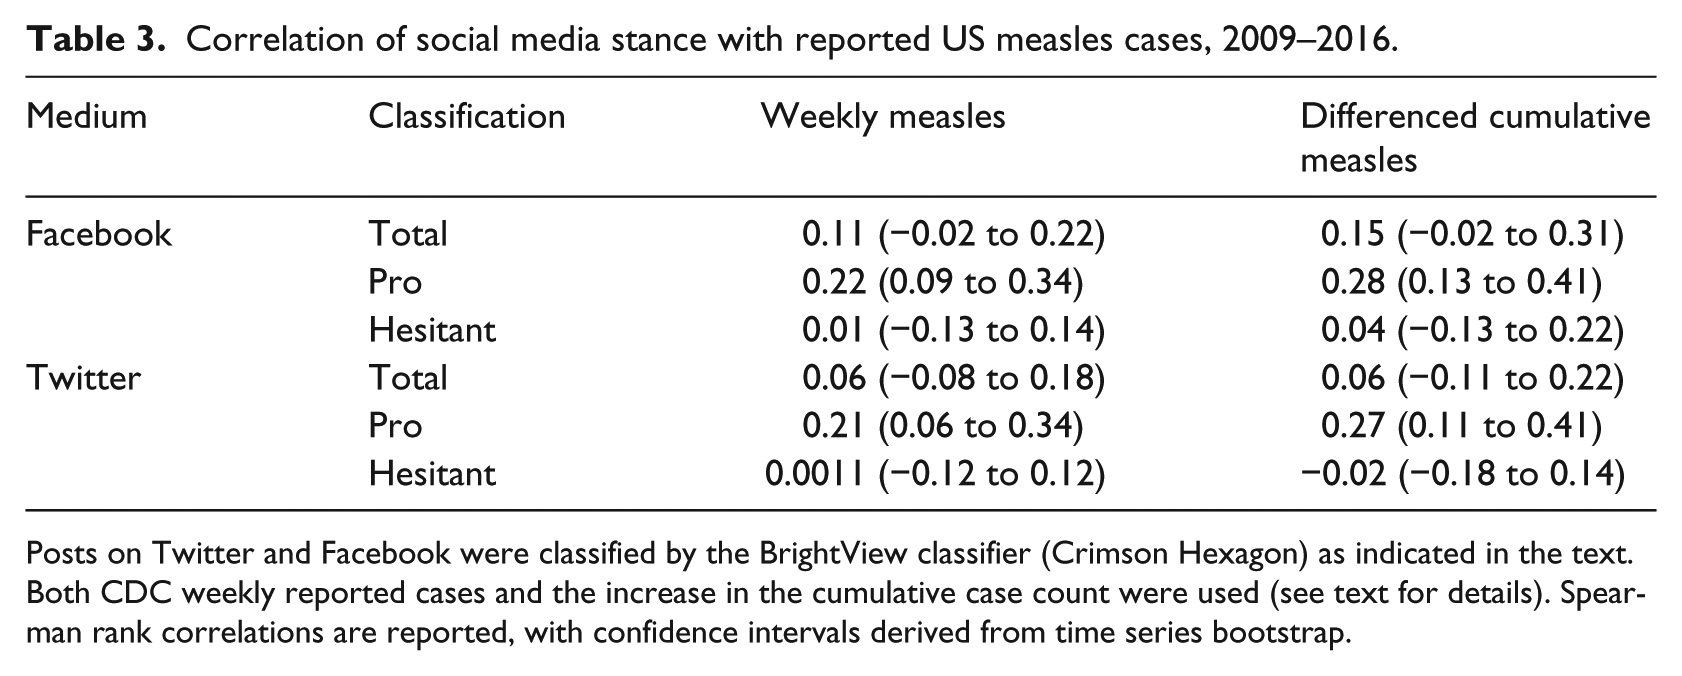
Posts on Twitter and Facebook were classified by the BrightView classifier (Crimson Hexagon) as indicated in the text. Both CDC weekly reported cases and the increase in the cumulative case count were used (see text for details). Spearman rank correlations are reported, with confidence intervals derived from time series bootstrap.
We also conducted the same analysis restricting the posts to those known to be in the United States. Because geolocation information for FB was almost entirely unavailable after March 2015, we restricted the analysis of US-based FB posts to the period ending 31 March 2015. As before, we found significant Spearman correlation between the weekly case counts and the frequency of posts classified as pro-vaccination (0.269; 95% CI: 0.17 to 0.41), but not for those posts classified as vaccine hesitant (0.0406; 95% CI: −0.14 to 0.24). Similar results were found for the frequency of tweets (for which unavailability of geolocation did not mandate restriction to the period ending 31 March 2015); the Spearman correlation between the weekly case counts and the frequency of tweets classified as pro-vaccination was 0.196 (95% CI: 0.06 to 0.34), while for those classified as vaccine hesitant, we found 0.00111 (95% CI: −0.12 to 0.12).
In the analyses above, we used a dataset filtered to focus on individuals’ original expressions (that excluded retweets, URLs, and presumed advertisements). To compare results of that more focused corpus to the broader conversation, we conducted a sensitivity analysis based on a broader query in which we did not remove retweets dollar signs or URLs (see Appendix 1 for details). For this broader query, similar results were obtained, although corpus volumes were larger. We found a Spearman correlation between weekly case counts and non-vaccine-hesitant tweets of 0.173 (95% CI: 0.05 to 0.28). The Spearman correlation between weekly case counts and non-vaccine-hesitant tweets was 0.0804 (95% CI: −0.05 to 0.2). Similar findings were obtained for FB and for the differenced cumulative series (not shown). In all cases, non-vaccine-hesitant tweets and posts showed a greater relationship with measles case counts than was seen for vaccine-hesitant tweets.
As a further sensitivity analysis, we also examined the proportion of pro-vaccination tweets and tweets expressing vaccine hesitancy in the weeks we classified as being in an outbreak or not being in an outbreak. The classification of weeks as corresponding to an outbreak or not is provided in Appendix 1, based on the two CDC measles time series. For FB, the odds ratio for a given post being pro versus hesitant during an outbreak was 3.2 compared with a non-outbreak week (95% CI: 1.21 to 6.62). We found that for Twitter, the odds ratio for a given tweet being pro versus hesitant during an outbreak was 4.3 compared with a non-outbreak week (95% CI: 1.28 to 12.2). We also used the two series to define epidemic or outbreak periods nationally; details are provided in Appendix 1. Note that in general, an “epidemic” or “outbreak” simply indicates more than the usual number of cases, and no unambiguous definition is possible. Topic wheels for vaccine-hesitant and non-vaccine-hesitant Twitter posts prior to and during the 2014–2015 outbreak are provided in Appendix 1.
Excluding the year 2009, for which there is a low volume, we found an overall Spearman rank correlation of the total on-topic tweets with the weekly reported cases of 0.04 (95% CI: −0.12 to 0.19). We found an overall Spearman rank correlation of the total pro-vaccination tweets with the weekly reported cases of 0.2 (95% CI: 0.04 to 0.34), while the Spearman rank correlation of the total vaccine-hesitant tweets with the weekly reported cases was −0.05 (95% CI: −0.2 to 0.09).
Additionally, we computed the Spearman correlation of the measles time series with total tweet volume matching our query, tweets classified as pro-vaccination, and tweets classified as vaccine hesitant, but with the additional step of excluding all accounts which individually contributed more than 0.2 percent (chosen arbitrarily) of the total identified tweets; high-volume accounts may contain contributions from automated scripts. We found an overall Spearman rank correlation of the total on-topic tweets with the weekly reported cases of 0.07 (95% CI: −0.06 to 0.21). We found an overall Spearman rank correlation of the total pro-vaccination tweets with the weekly reported cases of 0.2 (95% CI: 0.05 to 0.34), while the overall Spearman rank correlation of the total vaccine-hesitant tweets with the weekly reported cases was 0.01 (95% CI: −0.11 to 0.13).
When we removed tweets from accounts identified as having produced a highly repetitive tweet (see section “Methods”), the number of tweets classified as pro-vaccination decreased from 16,297 to 13,029, while the number of tweets classified as vaccine hesitant decreased from 43,259 to 13,462 When correlating the weekly number of remaining pro-vaccination and vaccine-hesitant tweets with the reported weekly case series, we found that for the remaining pro-vaccination tweets, the Spearman correlation was 0.208 (95% CI: 0.059 to 0.339), while for the remaining vaccine-hesitant tweets, the Spearman correlation was 0.0092 (95% CI: −0.11 to 0.131).
Discussion
Social media have, in a few years, gained pervasive importance in many fields 86 and have begun to change healthcare 87 and healthcare research 88 as well. Social media can be used to assess public discussions of health-related issues and behaviors (such as vaccination) and as a vehicle for disseminating public health information, health promotion messages, or other evidence-based interventions.41,89–91 In contrast, social media may also be a vehicle for the dissemination of views not supported by evidence.51,92
We classified social media posts related to measles as vaccine hesitant or not and compared the frequency of such responses with the occurrence of measles in the United States. Across the two social media platforms we examined, the proportion of pro-vaccination versus vaccine-hesitant posts, at times, depended on the presence of an outbreak. For the corpus we identified, posts classified as vaccine-hesitant occurred more regularly on the topic of vaccinations and/or measles than those classified as pro-vaccination. However, during a reported outbreak, pro-vaccination posts overtook the number of vaccine-hesitant posts, a feature which was attenuated in the first year. During these online discussions, vaccine-hesitant individuals may call into question the safety and efficacy of vaccines, while non-vaccine-hesitant individuals criticize and blame those who choose not to vaccinate for the recent outbreaks in vaccine-preventable diseases and for putting immunocompromised and vulnerable populations at risk for these diseases. 93 Our work differs from prior work in that we examined the relationship between volume and stance of the conversation and the occurrence of measles itself, as well as the comparison of Twitter and FB. It is possible that online discussions are driven, in part, by media coverage of outbreaks, an effect not captured by our classification of weeks based only on reported case series. Our findings are consistent with a simple view: many individuals who promote vaccine hesitancy are frequently or continually engaged in online discussions of vaccination, while non-vaccine-hesitant individuals on the whole engage in the debate when current events—such as a measles outbreak—bring measles to public awareness.
Our results suggest an ongoing substantial presence of vaccine hesitancy and vaccination opposition in social media, contrasted with sporadic involvement by individuals favoring vaccination. What effect could this social media involvement be yielding? While many factors affect message credibility,94–96 of particular concern is the potential importance of bandwagon effects in a social media setting. 96 Is it possible that the large volume of social media content in opposition to vaccines can contribute to such an effect? If so, strategies to increase social media engagement by institutions and individuals in favor of vaccination should be developed, urgently. It may be valuable for medical and public health practitioners to ask not only how they may use social media effectively but how they may empower or encourage social media activism by advocates of evidence-based positions (such as vaccination).
Categorizing social media posts requires inferring a user’s stance from a user’s post. For example, tweets were capped at 140 characters, which may have forced users to use non-standard abbreviations or phrases that either lack clear context or are poorly phrased. Such texts may be harder to interpret, whether by machine or human. Our machine classification appears to have underestimated the number of pro-vaccination posts, when compared to human raters. This potentially results in underestimating the correlation of pro-vaccination post frequency with outbreak data. We also note that by correlating US measles cases to all available posts, regardless of geocoding, we potentially weaken the effect and bias the analysis toward null hypotheses—an effect perhaps partially offset by international coverage of the 2015 measles outbreak. 97 Finally, we observe that an article critical of Wakefield’s research 98 appears to have caused a large number of pro-vaccination posts, even though no outbreak was occurring. This effect would also dilute the correlation of pro-vaccination posts and outbreak counts. Our use of the BrightView classifier appears to have achieved substantial agreement with the humans, but to have fallen short of human-level performance in its classifications; training on a larger corpus with a more nuanced classification may improve our ability to assess sentiment and stance. 99 Finally, our study was descriptive and retrospective; no predictions of future social media behavior were ventured.
Footnotes
Appendix 1
Acknowledgements
The authors thank Byron Wallace for useful discussions.
Declaration of conflicting interests
The author(s) declared no potential conflicts of interest with respect to the research, authorship, and/or publication of this article.
Funding
The author(s) disclosed receipt of the following financial support for the research, authorship and/or publication of this article: T.C.P. and T.M.L. gratefully acknowledge support from the US NIH NIGMS MIDAS program, 1-U01-GM087728, and T.C.P., T.M.L., and M.S.D. from the US NIH NEI R01 Grant EY024608. SFA acknowledges support from the US NIH NIGMS (grant number F31GM120985). C.F. acknowledges support from the Ingram Alumni Fund, Vanderbilt University. The funders/sponsors played no role in hypothesis generation, review, approval, or decision to publish.