
Abstract
MedHistory is a web-based software module that graphically displays medication usage (y-axis) against time (x-axis). We set out to examine whether MedHistory would improve clinician’s interactions with the medical record system. The authors invited house-officers at our institution to complete a survey about inpatient medication administration before and after using MedHistory. Detailed logs were also kept for 1 year after the study period. Compared to the pre-intervention survey, the post-intervention survey found that reviewing medication history was easier (pre: 13.2% vs post: 32.4%, p = .008), that medication review now fit within resident workflow (38.9% vs 75.7%, p < .001), and that there was increased satisfaction with the electronic health records software (2.6% vs 29.7%, p = .002). Additionally, determining the timing (29% vs 50.1%, p = .045) and dosing history (21.1% vs. 43.2%, p = .036) of inpatient medication administration was easier with MedHistory. Anti-infective agents and drugs requiring frequent adjustments were the most commonly reviewed. A graphical timeline of inpatient medications (MedHistory) was met with favorable response across multiple areas, including efficiency, speed, safety, and workflow.
Background
Medication administration is an essential part of inpatient medical care, yet remains an important source of iatrogenic adverse events. 1 Multiple strategies employ information technology to minimize inpatient medication adverse events, including electronic health records (EHR), computerized physician order entry, clinical decision support systems, alerts, barcodes, and electronic medication administration records, with variable effect.2–7 Adverse events related to inpatient medication administration persist, despite the wide-scale use of information systems related to inpatient medication administration.8,9
The usability of these systems, particularly the speed, efficiency, and design, is increasingly recognized as important in determining their efficacy, as is the visualization of the resultant data generated.10,11 In 2012, an American Medical Informatics Association (AMIA) task force called for standardization of certain components of EHRs to improve accessibility, usability, and interoperability. 12 Many systems are still not optimized to display and process the large amounts of data presented in an inpatient clinical setting.12,13 In addition, these systems are often built without usability in mind, which may limit the benefit to clinicians. 14 Graphical displays assimilate large quantities of data into succinct, visually appealing charts.15,16 For inpatient medication administration, graphical tools could allow the clinician to quickly visualize the timing, name, and dosages of a patient’s medication history.
Objectives
We postulated that software designed to graphically present inpatient medication administration history would improve clinician’s interactions with the medical record system and allow for easier access to data, ultimately improving efficiency and satisfaction. By creating this software, and subsequently surveying medical residents at our institution before and after using the software, we sought to address these questions. In addition, following the study (when the software was subsequently made generally available), we kept detailed records of usage patterns to identify patterns and trends in the data sought and used by clinicians.
Methods
MedHistory
MedHistory (MH) is an inpatient medication review tool that we created to improve physician review of inpatient medication administration. MH graphically displays medications (y-axis) against time (x-axis), allowing clinicians the ability to quickly assess medication administration history. By default, the graph presents a simple view indicating which medications were administered, but does not specify timing or dose. However, MH is interactive, easily allowing granular data display. For example, clinicians can click on a specific medication name to display specific dosing and timing. In addition, the graph can be filtered by time or medication class (Figure 1). MH is embedded within the existing sign-out and rounding tool (a proprietary web-based solution) previously used by all residents, as well as most clinical fellows and attending staff at our institution. 17 Recognizing a need for improved medication review, MH was custom-built by the authors over several months prior to study initiation. Beta-testing was done by a small group of clinical volunteers not involved in the study. MH is a web-based tool, largely built with JavaScript/HTML, specifically jQuery (https://jquery.com) and Flot (http://www.flotcharts.org). It was designed for desktop computers, and also works on tablets and mobile devices.
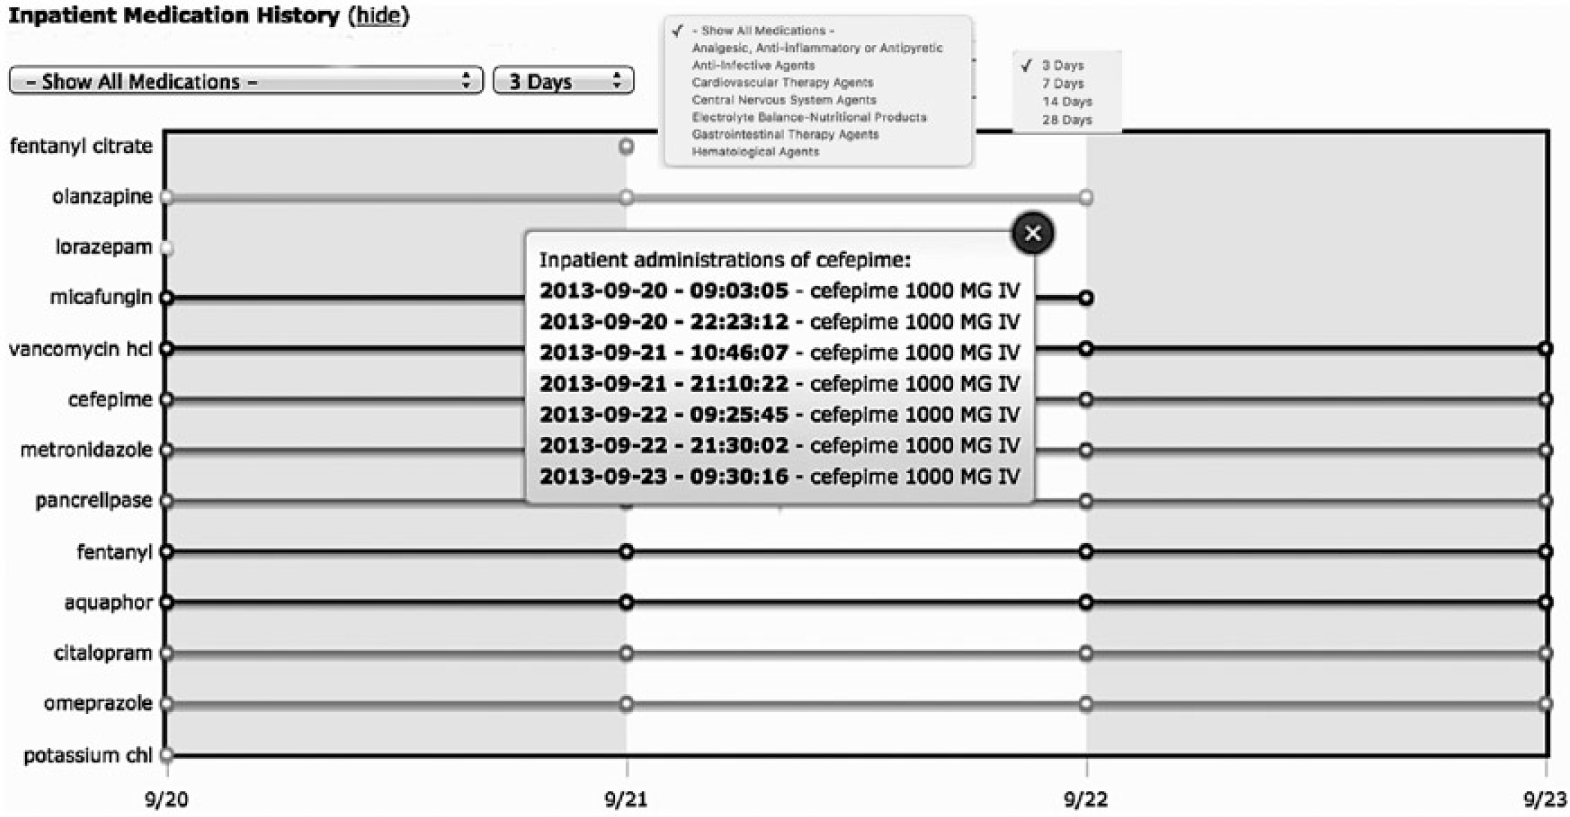
MedHistory shows medications plotted against time (in days). The graph is interactive, allowing clinicians to click for more granular information, for example, specific medication dosages and timing.
Study design
Prior to release of the software, all internal medicine residents (n = 189) at our institution (a large, 1000+ bed quaternary care medical center) were invited to complete an optional survey on current practices, limitations, and opinions related to inpatient medication review. A link to the survey was sent via email. After ascertaining current post-graduate year, the questions focused on current practices with respect to inpatient medication review: for example, what specific software they used currently, the settings in which individuals reviewed inpatient medications (cross cover, discharge planning, etc.), challenges they faced in reviewing these medications, and specific classes of medications for which they felt detailed medication review was particularly important. Finally, the last five questions asked residents to rate a series of subjective statements using a Likert scale that assessed satisfaction with existing tools (e.g. “Efficiently reviewing medication administration history is easy” and “I am satisfied with current methods of reviewing medication administration”). The survey was administered at the end of the academic year, so all respondents had at least 11 months of experience with the current Electronic Medical Record (EMR).
Residents who completed the initial survey were granted access to MH and given a brief overview and instructions on usage. Clinical setting was not restricted, and residents could use MH in a variety of settings (intensive care unit (ICU), general wards, consult service, etc.). After 2 weeks, a reminder email with instructions on usage was sent to those with access to MH. After 5 weeks of usage, the residents who completed the initial survey were invited via email to complete a second survey. The follow-up survey was identical to the initial questionnaire, with the addition of four statements the residents were asked to rate using a Likert scale (e.g. “the graphing tool made viewing medication history easier” and “the graphing tool made discharge planning safer”). The residents were instructed to answer these last questions only if they had used MH.
At the end of the study, MH was made generally available to all clinicians at our institution and at a sister institution. We kept detailed, blinded, de-identified usage logs during a 12-month post-study period. We tracked patterns of usage, including time of day and week, specific medication classes, and specific medications viewed, as well as role (attending, fellow, resident, etc.) of the users.
Analysis
Baseline comparisons between the initial survey group and those who completed the survey and indicated they had used MH were done using Pearson’s chi-square test. The pre- and post-usage questions, graded using a Likert scale as described above, were compared with the Wilcoxon signed-rank test. Questions answered only by those who used MH were tabulated as well.
Study data were collected and managed using REDCap electronic data capture tools hosted at our institution. 18 Statistical analyses were performed using Stata software, version 12.0 (StataCorp, College Station, TX) and R (R Core Team, 2016; https://www.R-project.org). The Partners HealthCare Human Research Committee determined the study to be exempt from review.
Results
Invitation emails were sent to 189 people, and 101 filled out the pre-usage survey. The survey respondents represented all four post-graduate years. A total of 48 residents opted to fill out the post-usage survey, 38 of whom indicated they had used MH. Initial resident respondents (n = 101) indicated that they reviewed inpatient medications for a variety of purposes, including cross cover (72/101, 71.2%), discharge planning (77/101, 76.2%), day-to-day management (99/101, 98%), and as consultants (34/101, 33.6%). Initial respondents also indicated several challenges to inpatient medication review, including accuracy (24/101, 23.8%), availability (31/101, 30.7%), data presentation (86/101, 85.2%), and speed (87/101, 86.1%). There were no significant differences between individuals who completed only the initial survey and those who used MH and completed the follow-up survey (Table 1).
Baseline characteristics and comparisons of initial survey respondents with MedHistory (MH) users.
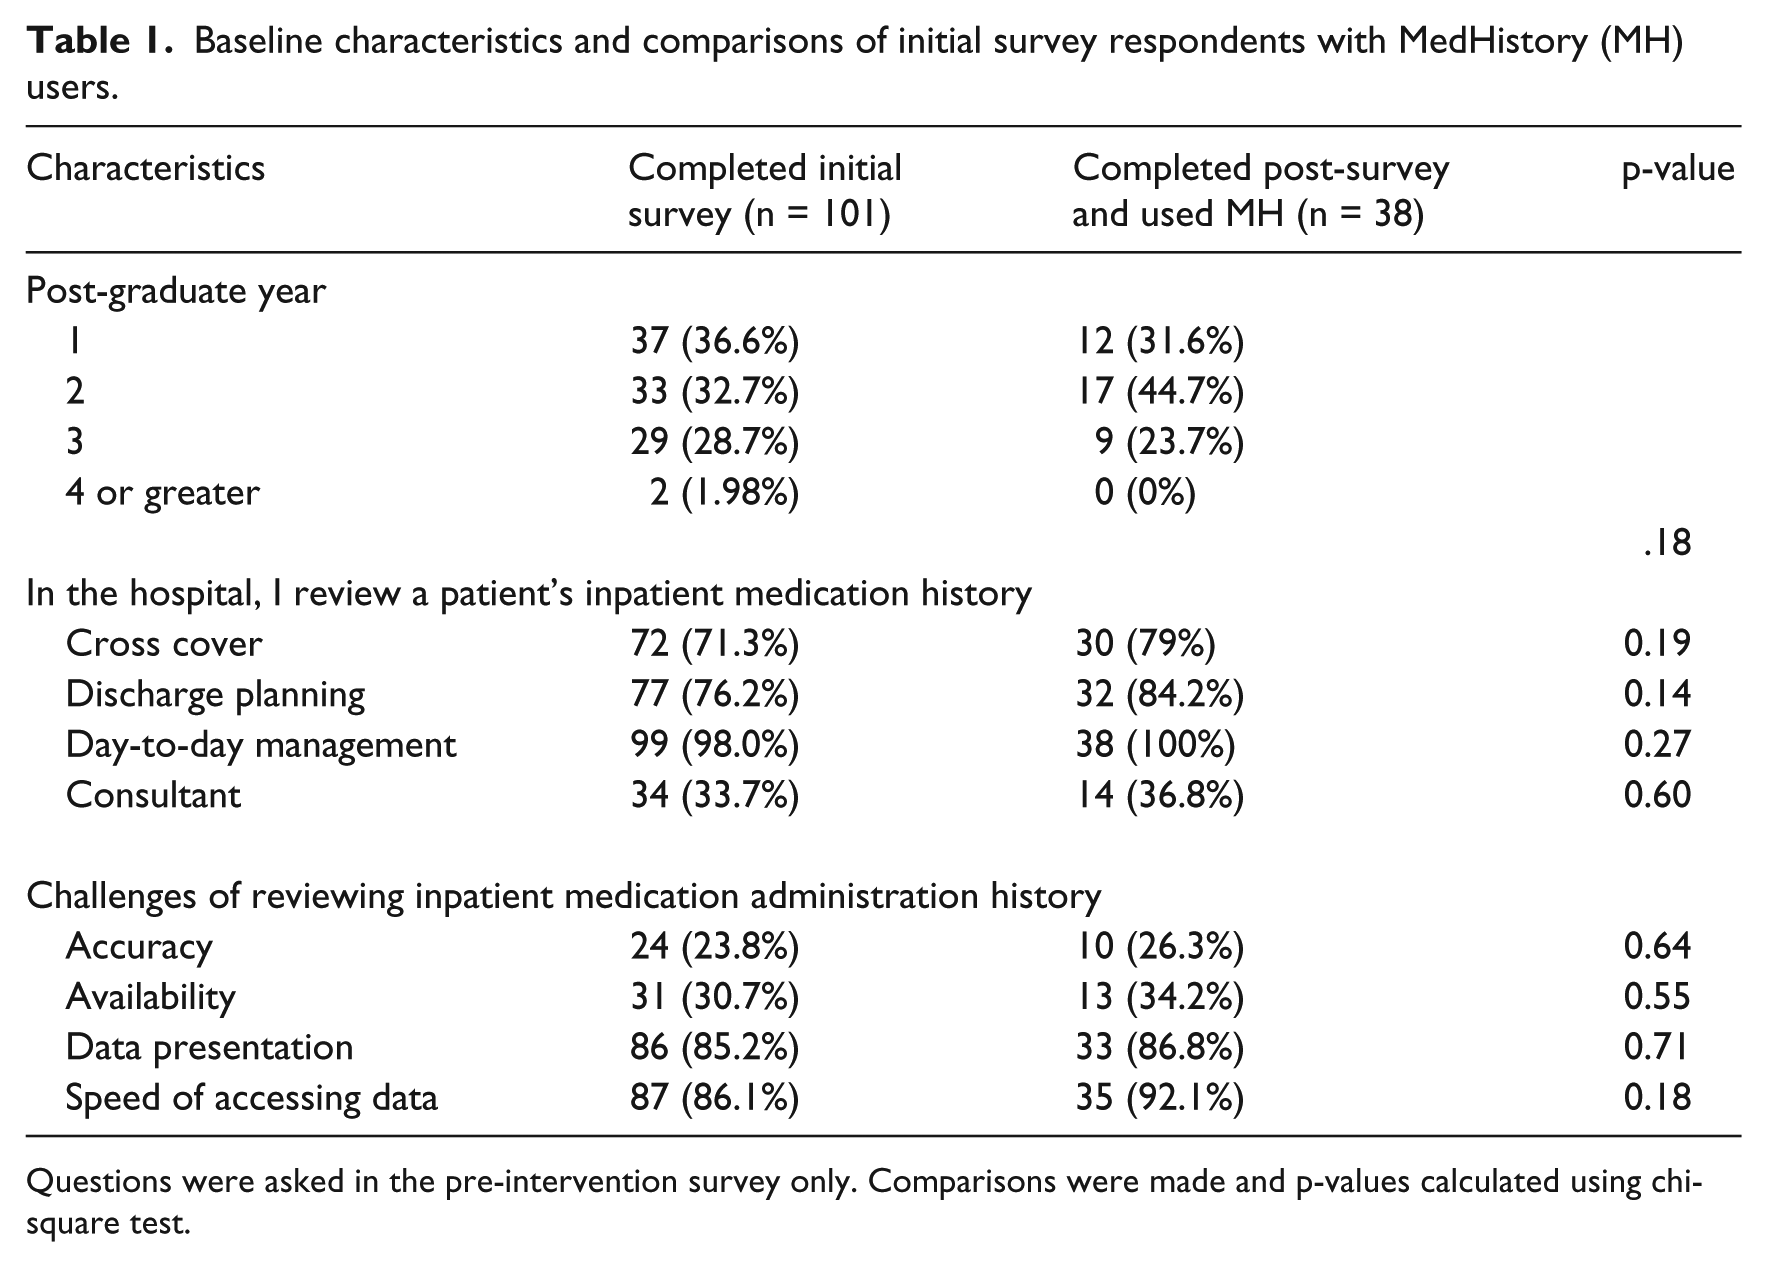
Questions were asked in the pre-intervention survey only. Comparisons were made and p-values calculated using chi-square test.
MH was generally met with positive response, with most individuals answering “agree” or “strongly agree” to survey questions using a Likert scale. Of the 38 residents who completed both surveys and indicated they used MH, the vast majority (31/38, 81.5%) felt the tool made viewing medication history easier, 78.9 percent (30/38) indicated it saved them time, and 50 percent (19/38) felt it made discharge planning safer (Figure 2, “agree” or “strongly agree”). Compared to the pre-intervention survey, the post-intervention survey found that reviewing medication history was easier (pre: 13.2% vs post: 32.4%, z = −2.65, p < .01), that medication review now fit within resident workflow (38.9% vs 75.7%, z = −3.89, p < .001), and that there was increased satisfaction with the EHR software (2.6% vs 29.7%, z = −3.09, p < .01). Additionally, determining the timing (29% vs 50.1%, z = −2.00, p < .05) and dosing history (21.1% vs 43.2%, z = −2.10, p < .05) of inpatient medication administration was easier with MH (Figure 3).
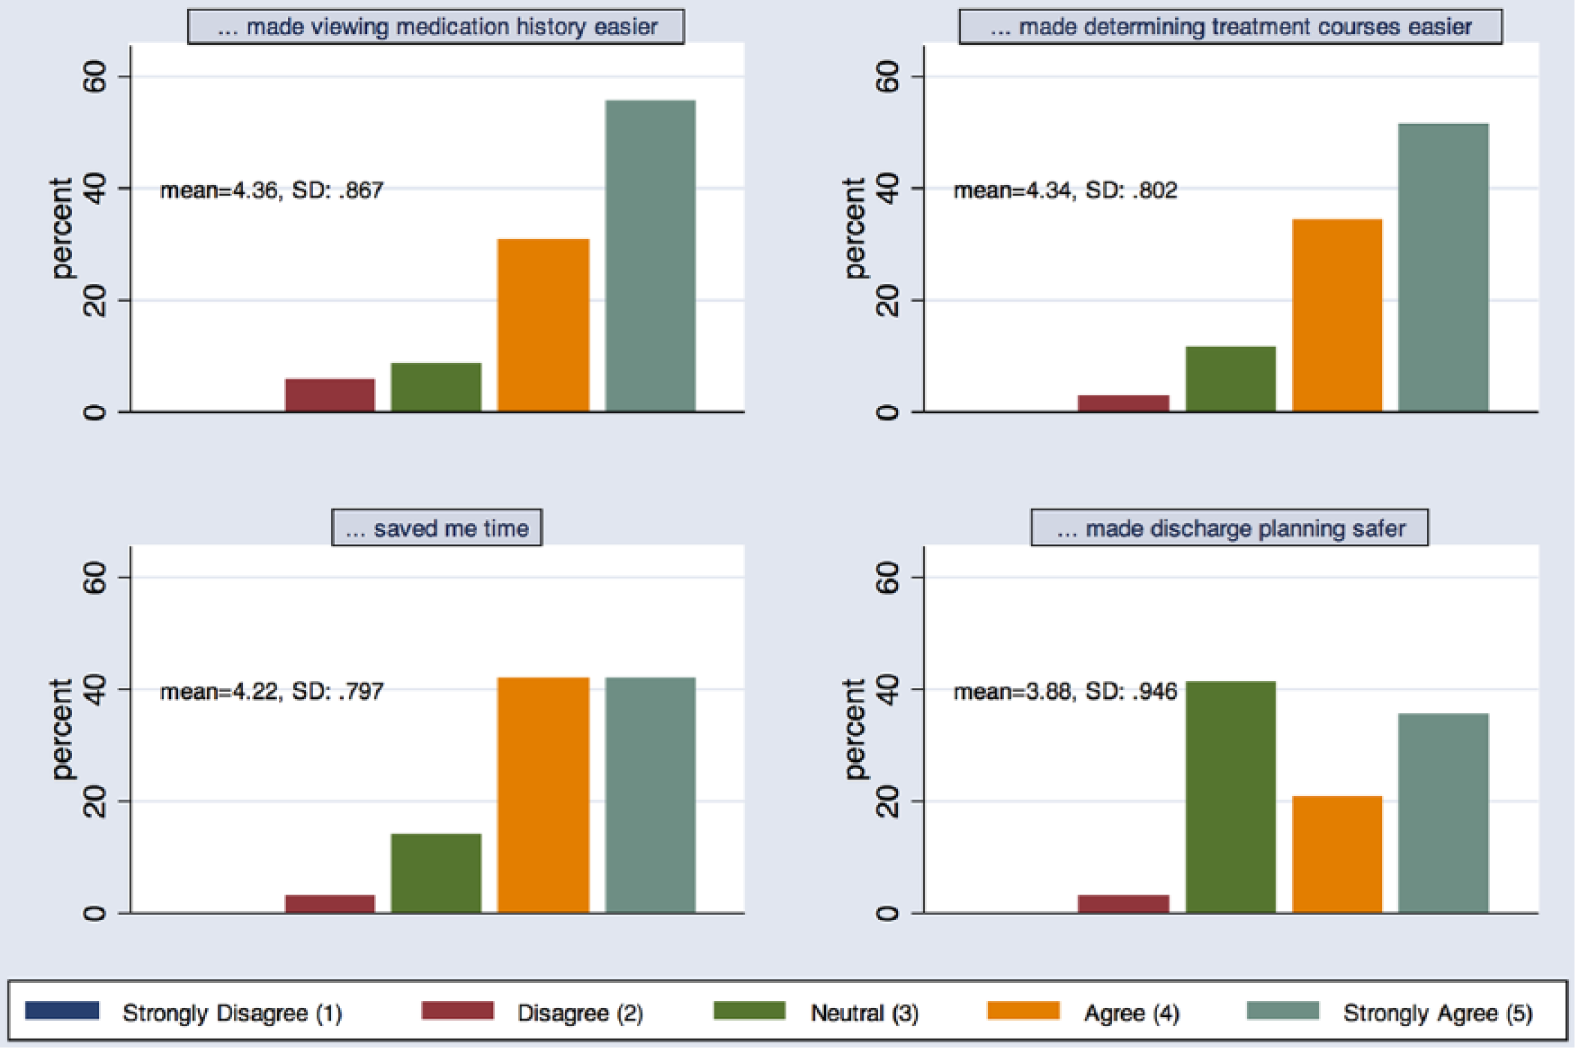
Post-intervention survey results. For all four questions, MH was met with favorable response.
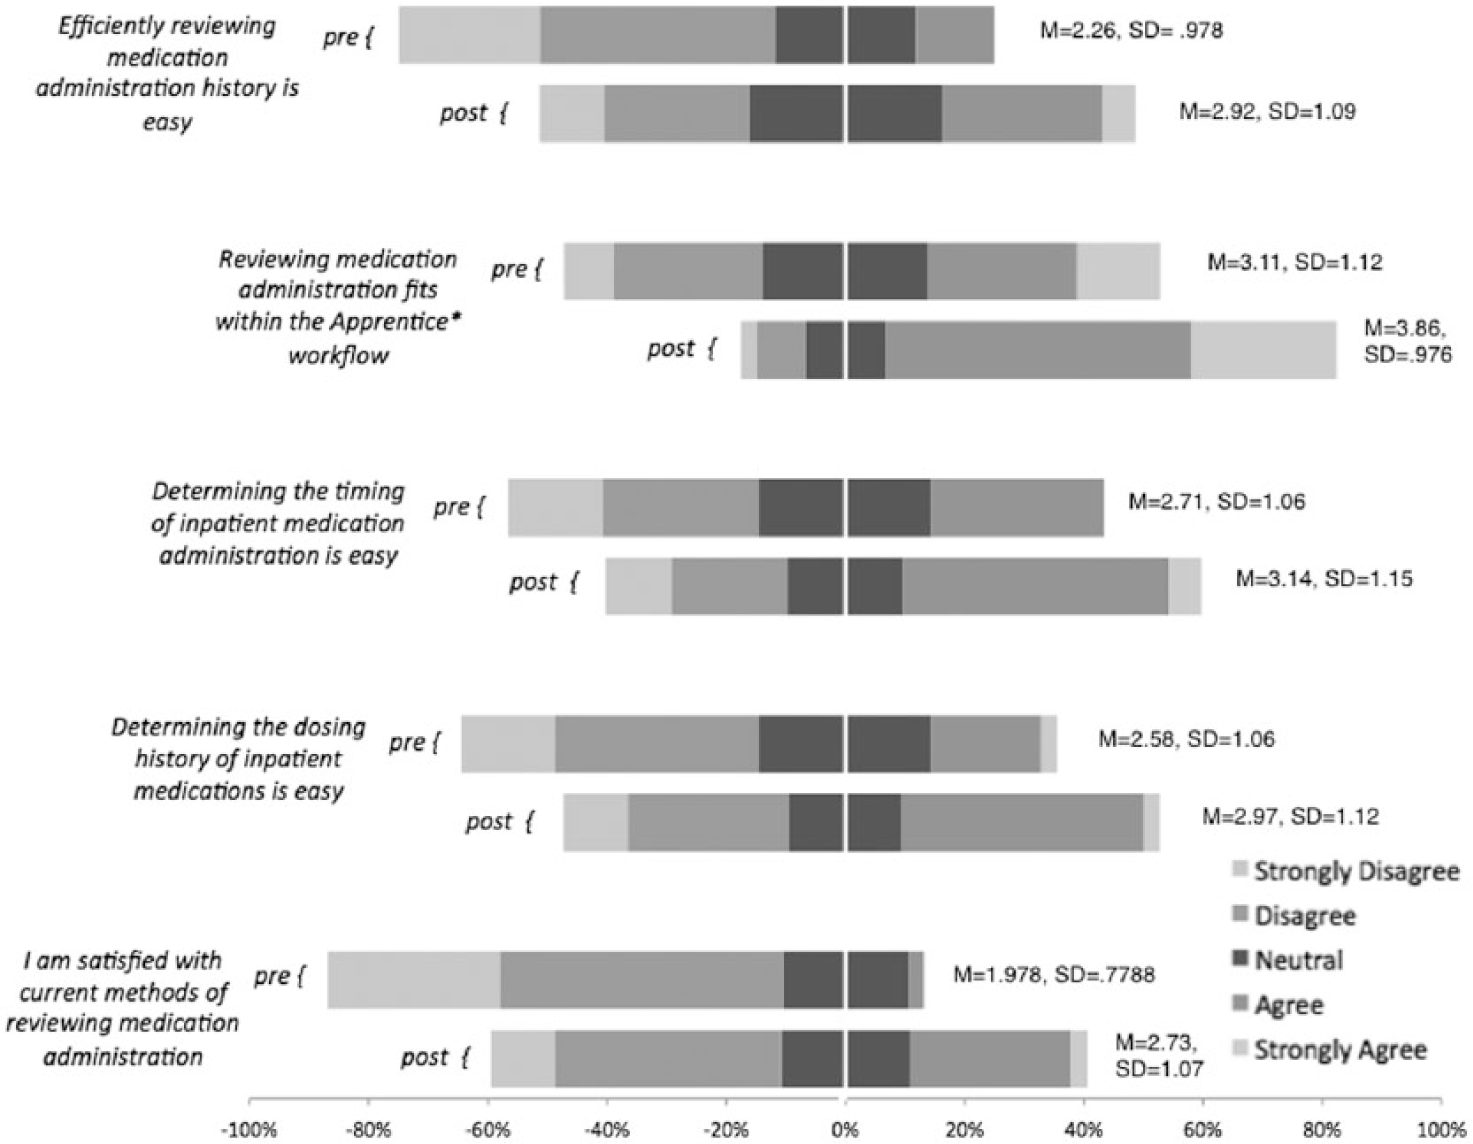
Comparison of pre and post-intervention survey questions. All five questions were asked on a Likert scale (“strongly disagree” → “strongly agree”). Each stacked bar represents percent responses for that question, with pre- and post-intervention questions paired for comparison.
Patterns of usage were tracked for 12 months following the end of the study period through detailed log collection. Study authors and beta-testers were specifically removed from the log data that were analyzed. Anti-infective agents were the most widely used drug class filter (67%, n = 12,037; Table 2). In addition, 3 of the top 10 medications viewed over the 12 months of analysis were antibiotics (vancomycin, cefepime, and ceftriaxone). Other medications commonly viewed were medications requiring frequent dose adjustments (furosemide and metoprolol) or medications requiring adjustments based on laboratory values (potassium, warfarin, heparin, and insulin) (Table 2). Finally, residents and medical students tend to use MH the most, though fellows and attendings also used MH.
Most frequent medications, drug class distribution, and the number of users by role/position for the 12 months following the study period when MH was widely available.
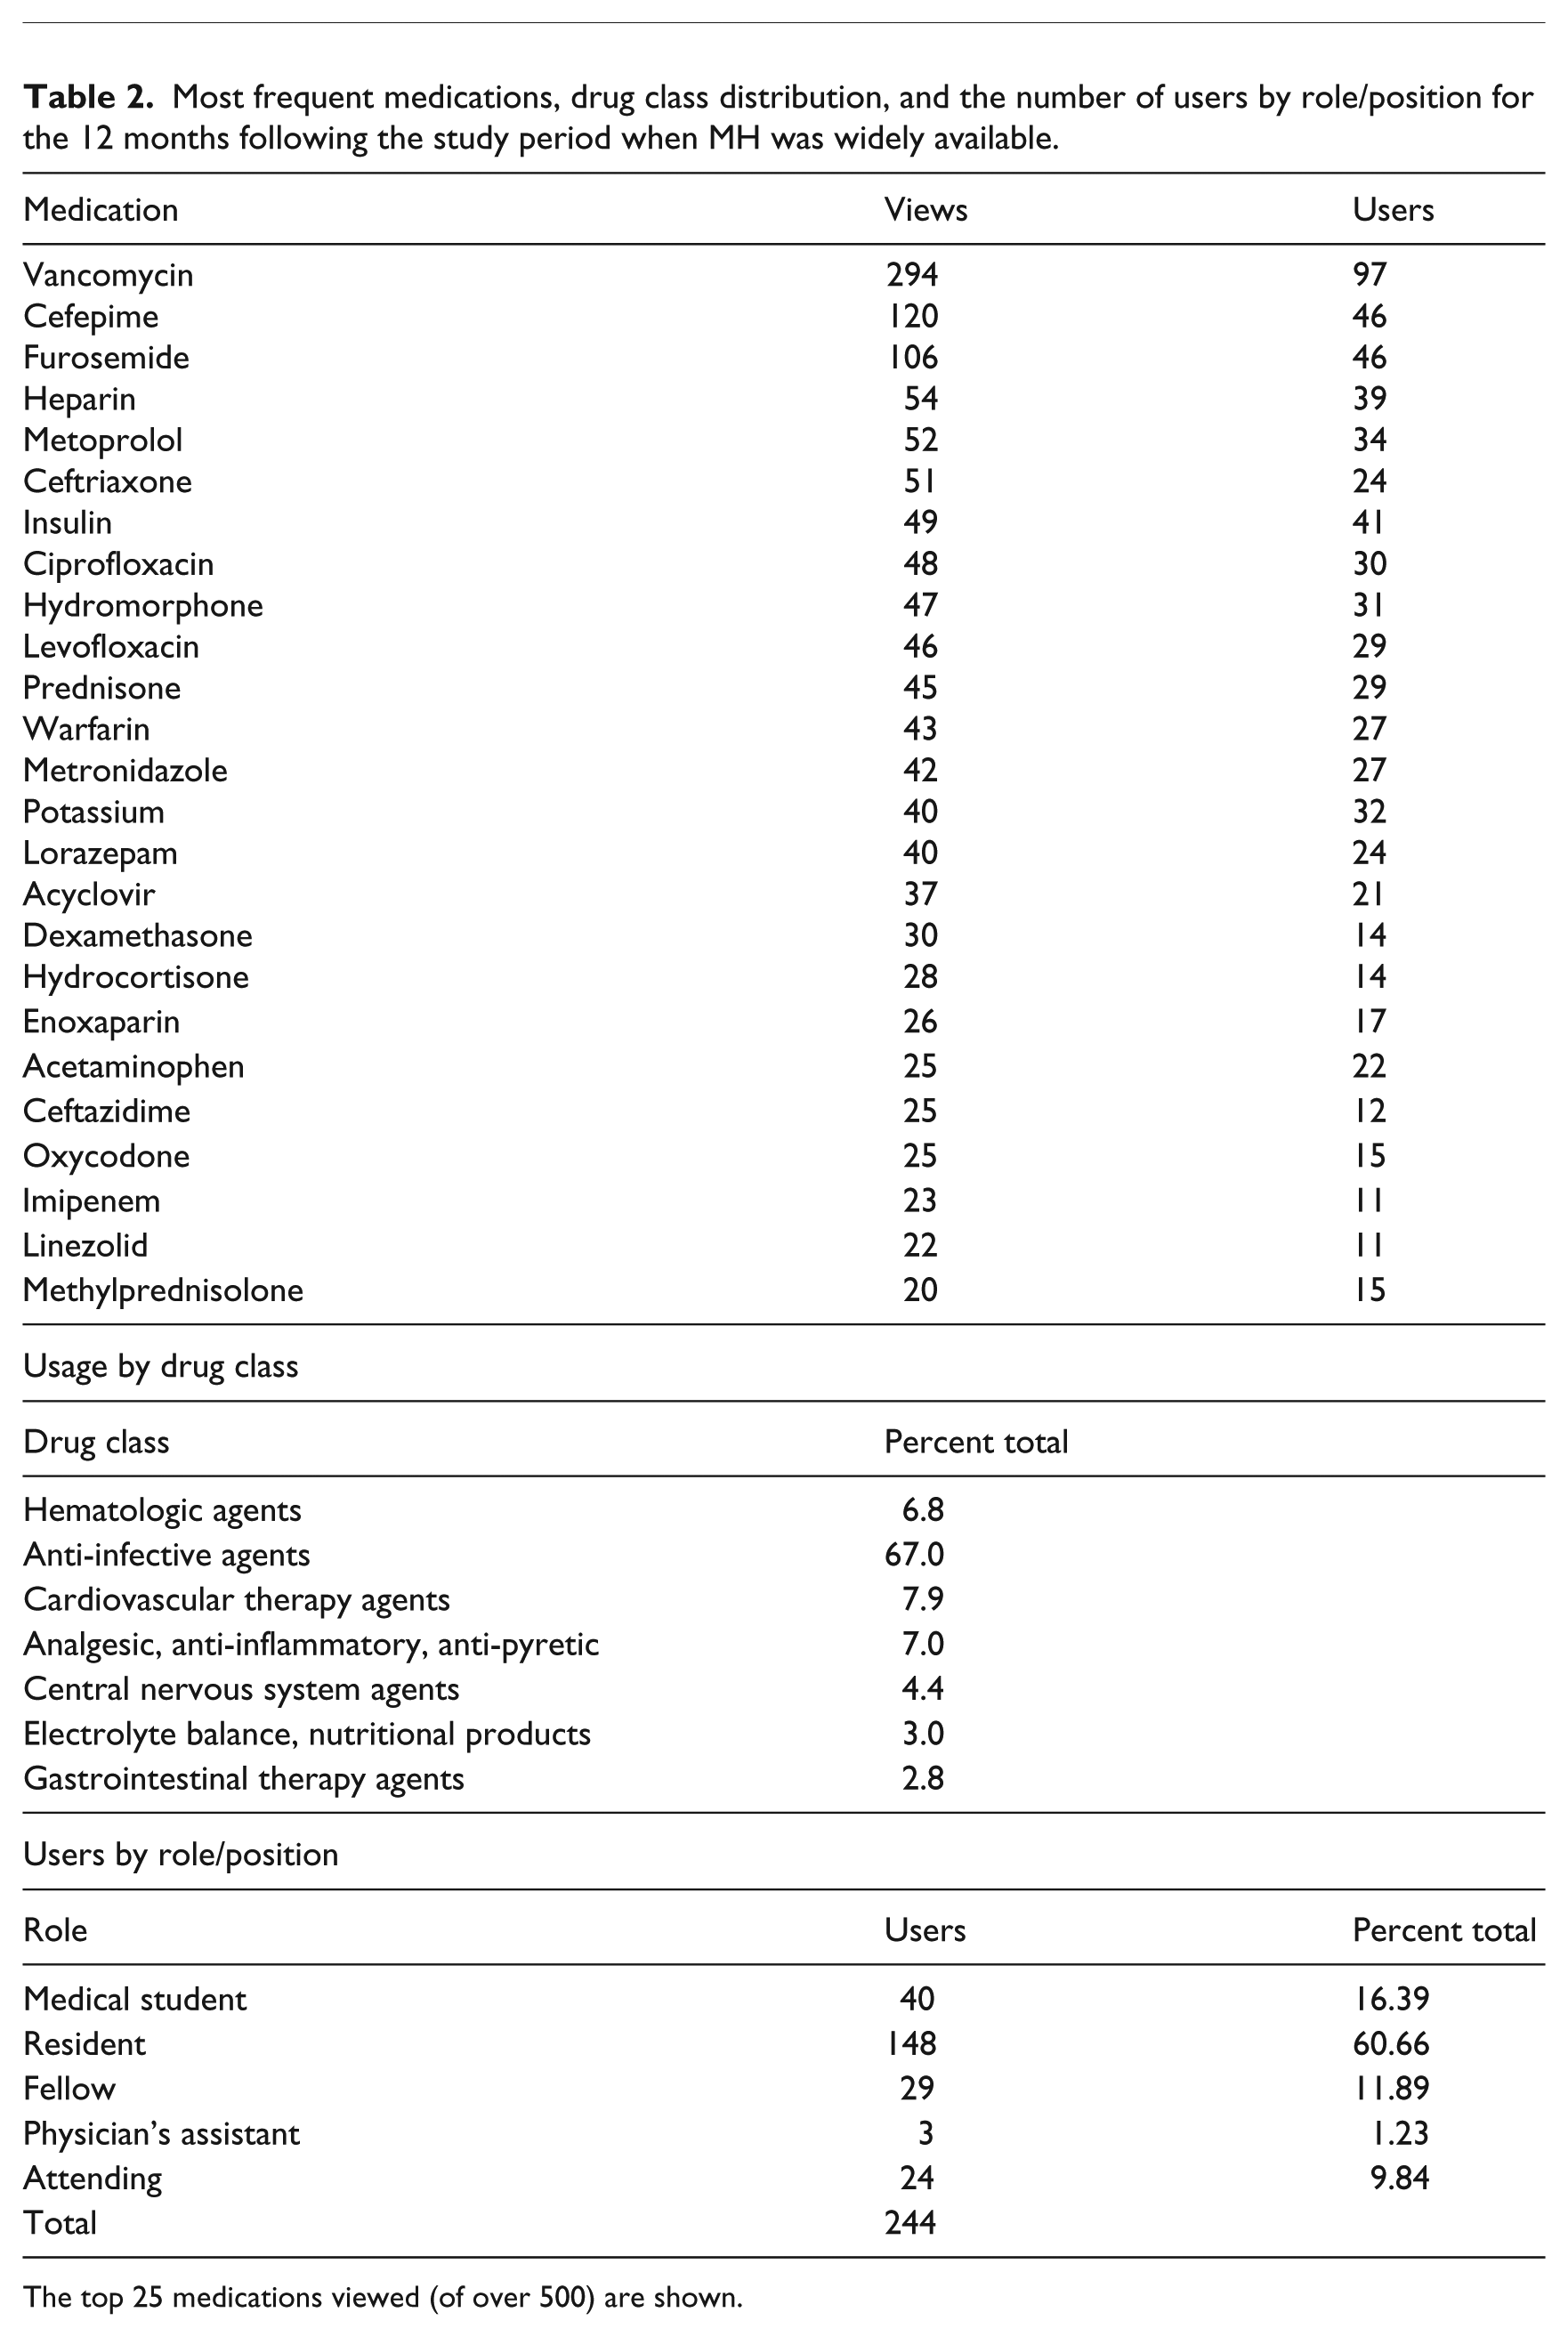
The top 25 medications viewed (of over 500) are shown.
Discussion
We have shown that implementation of a graphical timeline-based method of displaying inpatient medication history (“MedHistory”) subjectively improved medication review—more than 80 percent of residents indicated improvements in time spent on medication review and ease of viewing medication administration. In addition, comparing pre- and post-intervention surveys, significant improvements were noted in ease of use, as well as subjective workflow benefit, specifically around medication review.
MH did not require instructions or training for clinicians to use—our only active intervention was a reminder email halfway through the study period. Usage of MH relied on the intuitive nature of the graph, a critical part of understanding visualizations of patient data. These visualizations can subsequently support complex tasks, like a detailed patient medication history. 19 MH also emphasized time, an essential part of visualizations. 20 As clinicians are exposed to increasing quantities of patient data in the hospital, improved methods of processing and visualizing this data are critical to clinician workflow and patient safety. Medication administration, an essential part of inpatient medical care, is an ideal focus for these kinds of interventions.
Usage patterns in the 12 months following the study period revealed several important insights. First, our data point to several medications that users sought more detailed information about. These medications (e.g. vancomycin, furosemide, cefepime, and potassium) are ripe targets for clinical decision support at the point of electronic ordering. Traditional representation of medication dosing (name, dose, route, and frequency) may not be adequate to fully represent the clinical significance of these medications. Anti-infective agents as a class were particularly heavily utilized (10 of the top 25 medications, 67% overall) which emphasizes not only their importance in inpatient medicine but also the number of clinical events potentially associated with this class of medications (drug rash, drug fever, acute interstitial nephritis, etc.) where exact timing and dosing is important. MH facilitates a more comprehensive medication history that is challenging to replicate using traditional tools, particularly at our institution. Prior to initiation of MH, medication review was electronic and based on commercial modules in conjunction with in-house modules; however, it was text-based, slow to load, and could only display 5–10 medications at once. The prior solution had a time-series representation, but it had similar limitations—only 5–10 medications could be viewed at once, it was slow to load, and had extraneous information, for example, all medication orders were listed as separate entries, so one medication could be listed many times if the dosing had changed.
Finally, usage patterns reflected the workflow of an academic medical center. The majority of users were residents and medical students (those closest to medication ordering and adjustments), but also included consultants and more senior clinicians. Usage peaked on Mondays and was particularly high in the late-morning, perhaps reflecting the importance of MH in work rounds but also discharge planning (Figure 4).
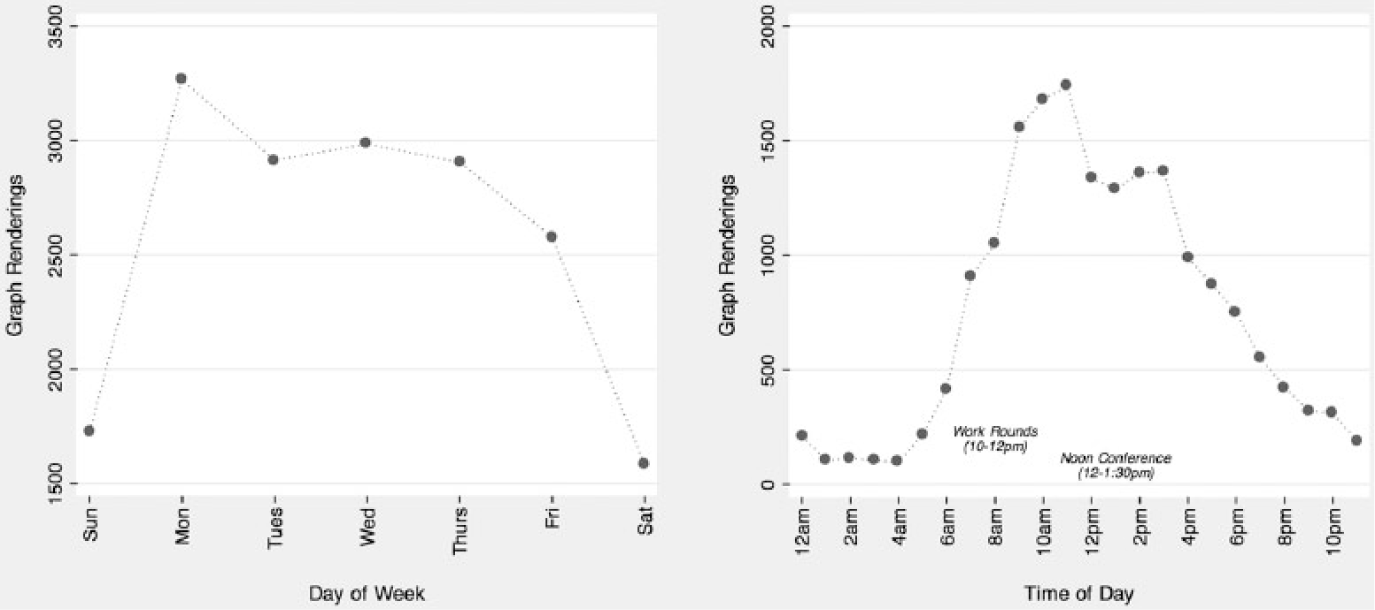
MH viewing patterns by day of week and time of day.
Strengths of our study included the fact that the study group consisted of residents from all post-graduate years, so represented different stages of clinical training. In addition, MH was integrated in the current rounding and sign-out tool that all house-staff use, so did not require separate installation or configuration. Our study design allowed for qualitative, immediate feedback on a new intervention; none of the study group had been exposed to MH until the study period.
Our study also has several important limitations. Because our study group was using MH for the first time, it is possible that the efficacy of the intervention was limited by a learning curve. Efficiency and comfort with the software would be expected to improve over time. In addition, our study data were largely qualitative. Though residents indicated subjective improvement across multiple measures, we did not objectively assess improvements in time or efficiency. Our response rate was also modest, with only 38 out of 189 possible residents using MH and completing both surveys (though this rate is similar to other studies of residents in general21,22). Although we found no significant difference between respondents who completed only the initial survey and those who completed both surveys, both groups could still represent those biased toward new technology and clinical improvements. Finally, our study subjects included only medical residents—we did not survey non-residents.
Conclusion
In conclusion, a graphical timeline to display inpatient medications was met with favorable response across multiple areas, including efficiency, speed, safety, and workflow. This approach has the potential to improve clinician review of medication administration and other forms of clinical data for which timing and duration are relevant. Future studies could objectively measure the impact of these systems on patient safety and clinician efficiency.
Footnotes
Funding
The author(s) received no financial support for the research, authorship, and/or publication of this article.
References
Supplementary Material
Please find the following supplemental material available below.
For Open Access articles published under a Creative Commons License, all supplemental material carries the same license as the article it is associated with.
For non-Open Access articles published, all supplemental material carries a non-exclusive license, and permission requests for re-use of supplemental material or any part of supplemental material shall be sent directly to the copyright owner as specified in the copyright notice associated with the article.