
Abstract
The workflow in modern hospitals entails that the medical treatment of a patient is distributed between several physicians and nurses. This leads to intensive cooperation, which takes place under particular time pressure and requires efficient conveyance of relevant patient-related medical data to colleagues. This requirement is difficult to achieve with traditional data representation approaches. In this paper, we introduce a novel concept of anatomically integrated in-place visualization designed to engage with cooperative tasks on a neurosurgical ward by using a virtual patient’s body as spatial representation of visually encoded abstract medical data. Based on the findings of our field studies, we provide a set of formal requirements and procedures for this kind of visual encoding. Moreover, we implemented a prototype on a mobile device that supports the diagnosis of spinal disc herniation and has been evaluated by 10 neurosurgeons. The physicians have assessed the proposed concept as beneficial, especially emphasizing the advantages of the anatomical integration such as intuitiveness and a better data availability due to providing all information at a glance. Particularly, four of nine respondents have stressed solely benefits of the concept, other four have mentioned benefits with some limitations and only one person has seen no benefits.
Keywords
Introduction and prior work
Patient-related medical data are stored and maintained in order to support different diagnostic and treatment processes in a hospital and are shared within and between professional groups, such as physicians, nurses and sometimes technicians. Here, the increasing complexity of these processes due to, for instance, new diagnostic methods and the expanding interdisciplinary as well as inter-hospital collaboration, is amplified by the challenges in organizing clinical work due to shift rotations and understaffing. Therefore, the timely access of the medical personnel to the currently relevant patient data is crucial for treatment quality. In this paper, we present a visualization approach to support clinical cooperation by building on the visual tradition in medicine. Compared to prior work, we focus on the specific requirements of such cooperative tasks, that is the need of a synoptic-like representation of the current patient’s status for a fast information transfer. In particular, our approach allows to visualize multiple clinical parameters in an intuitive, anatomically integrated fashion. In the following, we describe our main contributions and the delimitation to other methods more in detail.
Various visualization approaches have been proposed for intuitively accessing patient’s medical data in order to improve clinical support and quality assurance. 1 In general, we can distinguish two main categories, depending on the aim of such visualizations. The first category is characterized by the exploratory nature of the approaches and commonly refer to electronic health records (EHRs). That is, the visualization provides an overview of a patient’s complete set of medical and potentially administrative data and offers functionality for data selection including refinement, reconfiguration of layout and visual data encoding, and detection of data correlations or outliers. 2 The second category comprises task-oriented visualization approaches that address medical tasks with specific requirements and with a focus on efficient information access and transfer. Examples are, for instance, communication to patient of the prostate cancer health risk 3 or reading of imaging diagnostic records. 4 For the purpose of such visualization systems a relatively small subset of patient data, in some cases not documented in the EHR, 5 is relevant.
Visualization tools for patient data predominantly utilize concepts from information visualization, for example, encoding time-related medical data as colorized geometric primitives that are placed at a timeline.6–8 Some newer works intend to enhance the comprehensibility and navigability of the timeline-based EHR visualization, using it in combination with a data abstraction layer 9 or a generic data model such as the Observational Medical Outcomes Partnership Common Data Model. 10 Still, the physicians are in general not very familiar with abstract visual representations, which can impair their understanding. 11 Therefore, some visualization approaches additionally utilize a virtual human body in order to provide a more intuitive data access. For instance, Kirby and Rector 12 presented one of the first systems that uses a visualization of the human body as the central entry point for an efficient access of medical data items that are presented as text. Sundvall et al. 13 presented a prototype of a 2D visualization framework for patient’s medical data based on Google Earth. It supports so-called placemarks, the standard Google Earth approach to position body-referenced information as icons and text. An et al. 14 developed a 3D navigation and visualization method for medical data that uses different levels of detail (LOD) in combination with different visualization strategies applied to data at different levels. Particularly, on the two topmost levels a virtual human body is used to refer to affected organ systems or organs, which serve as access points to respective disease descriptions. Shi et al. 4 proposed a visualization tool that uses a 3D anatomical human model in combination with a three state color encoding of pathological severity in order to facilitate for radiologists the access to the current and historical medical status of a patient. The user can access the original data, such as DICOM images or imaging diagnostic reports, by selecting the highlighted organs. Jaatun et al. 5 developed a tablet-based digital pain body map that allowed patients with cancer to visually express their pain by drawing its location on a 2D virtual body and applying a color encoded scale for its intensity. The tool is aimed at an improvement of the communication between patients and medical personnel and supports the information exchange between different physicians and nurses by a patient handover. The existing anatomy-based approaches have in common the focus on the on-body visualization of few, mainly a single parameter, while further data are presented using abstract visualization methods or text.
The overall goal of our interdisciplinary research project is the analysis of cooperative clinical work practices on a neurosurgical ward and the development, implementation and evaluation of appropriate visualization concepts to improve these practices by providing efficient and task-oriented access to the health status, i.e., the relevant medical data, of a patient. The focus is on pre- and post-operative medical tasks that are distributed among several doctors and nurses due to shift rotations and occasional understaffing and therefore rely on their cooperation in the form of circulation of patient’s status. As this cooperation takes place in the strict time slots of the main medical tasks, e.g. ward rounds, it is characterized by the particular time pressure under which the patient’s status must be conveyed from one physician or nurse to the next.
In the initial analysis, our field studies revealed major findings that are relevant for our visualization concept (further details are given in Sec. Field Study). (1) Only a specific and relatively small subset of data in a concise and objectified form has to be conveyed, depending on the usage context. (2) A significant part of such subsets are diagnostic data related to the anatomy, e.g., clinical symptoms. (3) Neurosurgical personnel strongly rely on their visual tradition and can therefore easily get used to anatomical visualization metaphors.
In this paper, we present a new visualization concept based on our findings regarding the cooperative clinical work practices on a neurosurgical ward. Our approach focuses on transferring diagnostic medical data with anatomical reference. Inspired by the prior work that partially utilizes a virtual human body for visualizing medical data4,5,12–14 and encouraged by the positive feedback from the neurosurgical personnel regarding anatomy related visualization techniques, we exploit the visual tradition in medicine as much as possible in order to achieve an anatomically integrated in-place visualization. This means that several, task specific data are encoded with appropriate visual attributes, which then are applied by displaying the respective anatomical structures of a 3D avatar.
Following the basic visualization principle of the previous body-based approaches, we especially focus on providing a visual synopsis of patient’s task-specific status, i.e. a consistent, simultaneous representation of multiple key data. Here we take advantage of the fact that, as observed during our field studies and stressed in the interviews by our medical partners, in the considered cooperative constellations only relatively small subsets of patient diagnostic data are relevant for the physicians (see the major finding one above), which allows us to minimize the necessity of manual online data selection and filtering. Still, we have to face the challenging task of mapping multiple quantified medical data to visual attributes – except spatial location, which is pre-defined by the anatomy – in a way that they can be effectively perceived in a simultaneous visualization.
The main contributions of this paper are as follows: 1. The concept of an anatomically integrated in-place visualization of medical data with anatomical reference including the definition of requirements and visual encoding procedures for this kind of visualization. 2. The design goals and data categories for clinical neurological symptoms related to the differential diagnosis for patients with spinal disc herniation. This serves as case study for applying our visualization concept and the formal requirements. 3. A prototypical implementation of the visualization concept and its evaluation by 10 neurosurgeons.
Our evaluation shows a strong consensus among the assessing physicians about the usefulness of applying our visualization concept to the diagnostic data of patients with spinal disc herniation.
It should be emphasized that our concept is designed for visualization of a specific kind of medical data that refer to anatomical structures. Therefore, for a more advanced use it may need to be combined with information visualization techniques to incorporate medical data without anatomical reference.
Design method and goals
In the context of our interdisciplinary long-term project on a neurosurgical ward, we investigate fundamental questions of analyzing and in part reconfiguring cooperative medical work practices. From a sociological perspective, articulation work, 15 i.e. the ongoing work of integrating distributed tasks and maintaining a coherent treatment trajectory by collection, processing and organizing patient data, is at the core of clinical cooperation. However, this information flow is hampered by gaps and distortions due to the limited availability or time-consuming access to patient-related medical data, which in turn is at least partly related to their inadequate visual presentation.
In our project, we aim at the design and development of an integrated in-place visualization of patient-related medical data in order to support and potentially even modify specific cooperative workflows. We address the fundamental problem of the acceptance, effectiveness and efficiency of new technologies in working practices using a participatory design approach, similar to Belden et al.
16
and Sedlmair et al.
17
That is, we set up a design and implementation process that involves visualization researchers, sociologists and neurosurgeons in order to analyze specific cooperative real-world situations on the neurosurgical ward. Our design and implementation process (see Figure 1) comprises high-frequency interaction between these groups of experts, in particular during the initial definition of the overall goals of the intended visualization tool and the field studies that comprise observations of cooperative workflow situations and interviews. This interaction is based on the mutual engagement in the design process following a symmetrical approach (Schubert and Kolb).
18
The insights of the field study are depicted in Sec. Field Study, whereas the deduced design goals are presented in Sec. Design Goals. The design and development process for the visualization prototype. The rectangles represent the three main stages. The last stage is an iterative prototype development, which leads to a gradual concept refinement on the basis of experts’ feedback.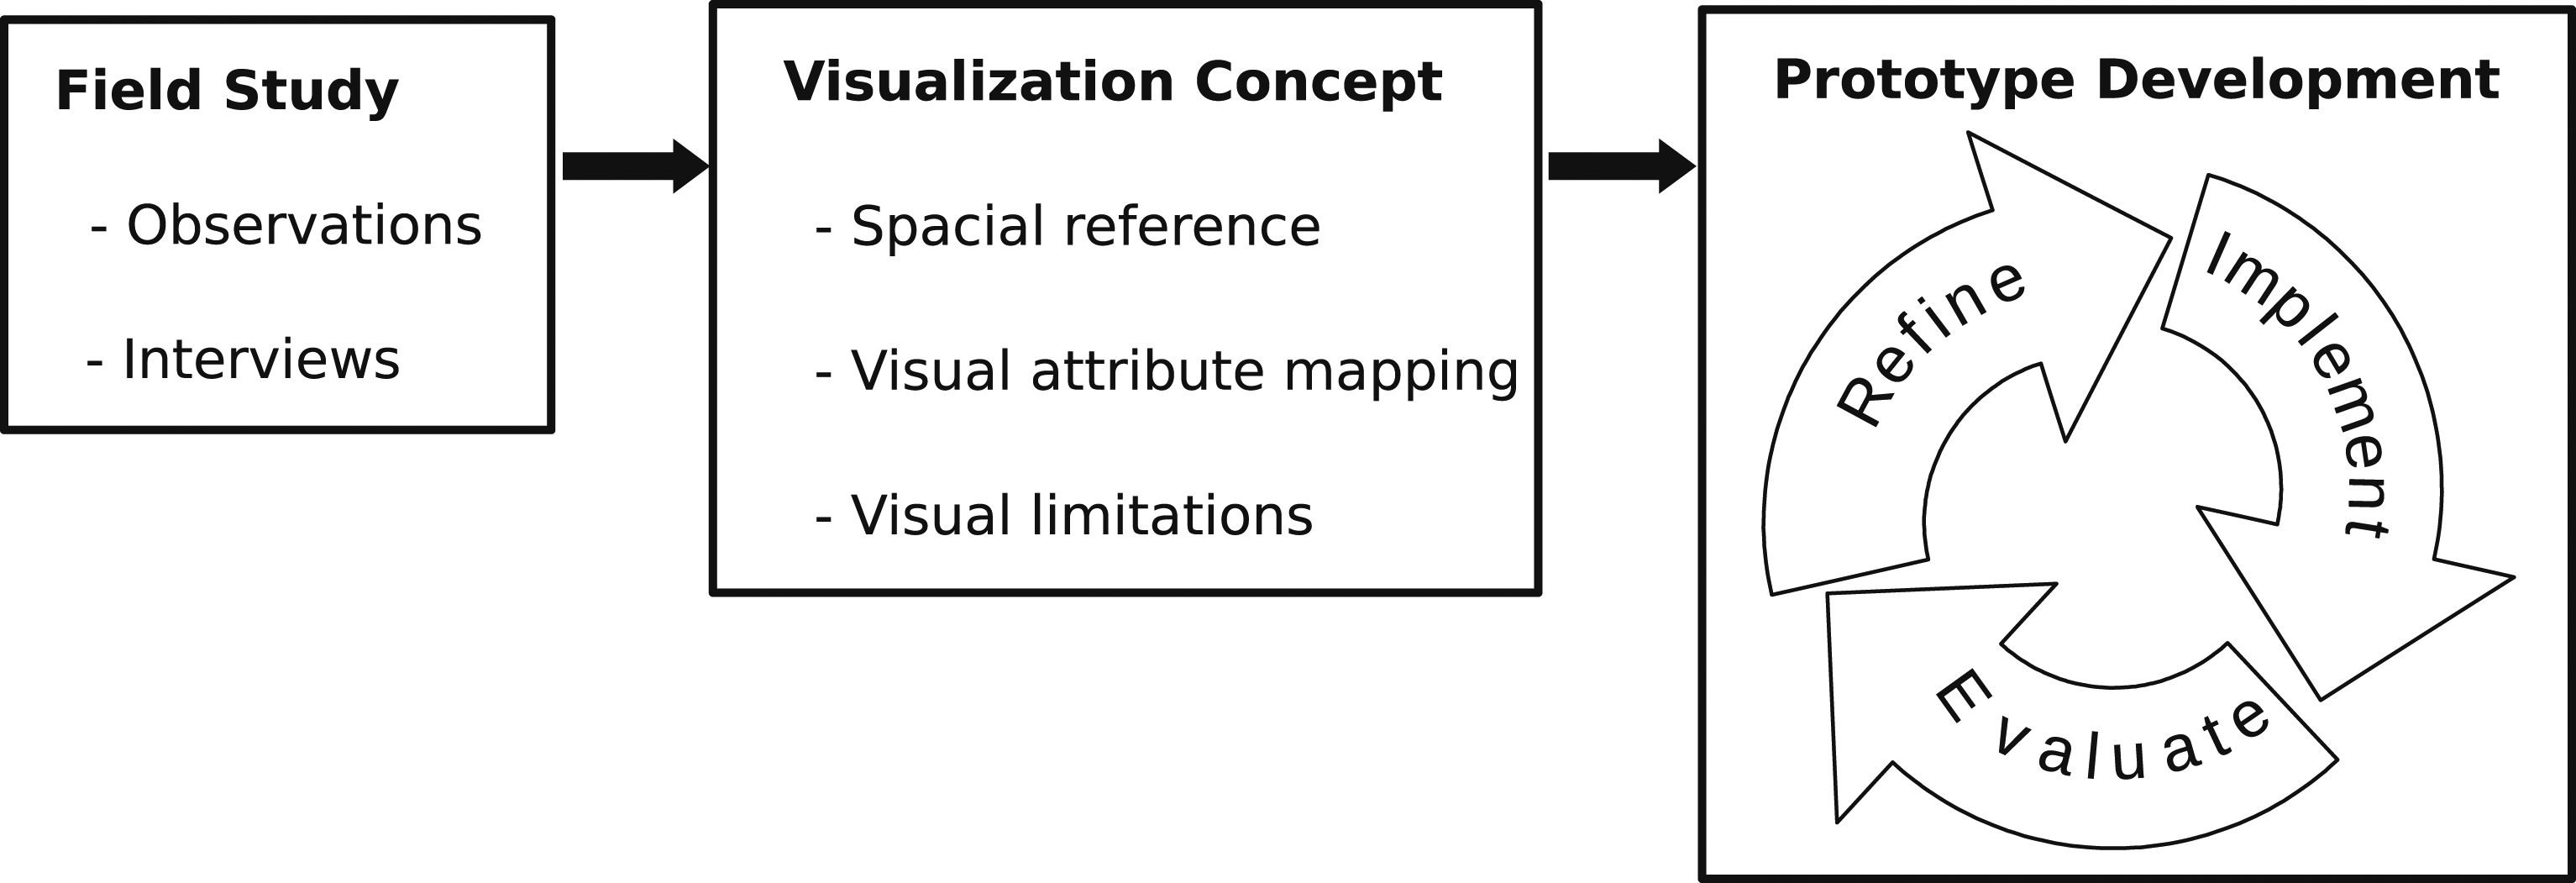
Moreover, we utilize participatory refinement of design and implementation similar to the principle of agile software development (see, e.g., Martin), 19 in which visualization researchers, sociologists and neurosurgeons jointly advance and refine the visualization design on the basis of the formulated design goals (see Sec. Design Goals) by utilizing prototype implementations of a visualization tool. For reasons of efficiency and in order to not bias the evaluation, three physicians (expert group) are involved in this stage, whereas the evaluation involves a distinct set of 10 physicians (test group; see Sec. Prototype Evaluation).
Field study
In this first phase of data collection and processing, field observations and interviews were conducted on the neurosurgical ward of a local, 480 bed hospital. Here, the sociologists, and partially visualization researchers, observed a total of 14 neurosurgeons for 22 days during their routine ward work to become acquainted with the workflows and relevance structures of their daily work. An important finding was the fact that the physicians rely on the patient’s anatomy as spatial reference of the diagnostic results not only using medical imaging for instance, but also by handwriting information, e.g., on anatomical sketches in examination forms. Furthermore, during these observations, specific cooperative work constellations have been identified. Due to the distributed character of the clinical work, the patient-related medical data collected by one physician, has to be conveyed to the colleague who continues with the patient’s treatment. In this context, the task-related subset of medical data that describes the patient’s current status and its change over time is of particular importance. A significant part of this subset constitute diagnostic data related to the anatomy, e.g., clinical symptoms. Moreover, the timely efficient assessment of the relevant medical data and its temporal change plays a crucial role for decision making and treatment quality. An effective conveyance of the patient’s status under these particular conditions requires a data representation in an objectified and concise form.
The cooperative work constellations can occur in synchronous or asynchronous mode. An example of synchronous cooperation is the shift handover or, more precisely, the presentation of patient during the morning ward meetings. In these cooperative constellations the information is passed on personally, mostly in verbal, i.e., volatile, form. However, a personal shift handover is not always possible due to the inherent irregularity of the clinical workflow that results from possible emergencies. In these cases, the required information has to be passed on to colleagues asynchronously. This kind of asynchronous cooperation frequently occurs when dealing with unfamiliar patients, e.g., during ward rounds or when writing of discharge reports. Currently, the physicians have to recover the patient’s status from different data sources. Furthermore, even when treating a patient they are familiar with, the physicians often need to recollect the patient-related medical data they acquired themselves.
Design goals
Following the project motivation and the findings of the field studies, the overarching goal of the intended visualization system is to facilitate efficient transfer of the patient’s status in the context of distributed medical tasks. The resulting design goals listed below have been jointly deduced by the visualization researchers, sociologists and neurosurgeons from findings of the field studies, using a symmetrical approach (see above Design Method and Goals):
DG1 familiarity in novelty
The goal is to exploit the existing visual tradition, i.e., the usage of the anatomy as spatial reference, as far as possible and to prevent abstract visualizations in order to achieve a high degree of intuitiveness.
DG2 visual discriminability
A data mapping that allows the user to clearly discriminate between corresponding visual attributes in a given clinical usage context is crucial for the correct understanding of a visualization, and thus for an effective information transfer. The preference for anatomical visualization concepts defines the spatial location as a visual attribute a-priori, which makes such a mapping even more challenging to achieve.
DG3 context-related synopsis
In cooperative settings, it is important to provide a simultaneous visual access to all the data that are relevant in the given clinical usage context for conveying the current patient status at a glance.
DG4 intuitive comprehensibility
The visualization design has to focus on an intuitive and comprehensive interpretability in order to address the overall goal of efficient and effective transfer of the patient’s status.
DG5 concise visualization
In order to avoid clutter and distraction by secondary details, we aim to provide only the data that are relevant in the current clinical usage context and to focus on medically relevant, i.e., abnormal, value constellations.
DG6 visualization of chronological changes
The visualization should provide access to the evolution of the patient’s data.
DG7 mobility
The goal is to make the visualization available in all places using a mobile device.
The visualization concept
General considerations
This section describes our visualization concept, which aims at the achievement of the design goals (see Sec. Design Goals) in consideration of practical insights into the hospital workflow gathered in our field studies (see Sec. Field Study).
At the core of the concept is an anatomically integrated in-place visualization of medical data relevant to specific cooperative tasks. According to this visualization principle, an anatomical model serves as spatial representation of medical data that inherently refer to its structures, e.g., the clinical symptom paresis referring the affected muscle. Particularly, the visual attributes that appropriately encode the medical data to be visualized are applied by rendering of the corresponding anatomical structures, changing their default or “natural” appearance.
Using the human body as spatial reference, we directly address the design goal
However, the anatomically integrated in-place visualization poses a very fundamental challenge: How to design the mapping from abstract medical data to visual attributes under the restriction of a preset location/geometry, such that visual discriminability (
Formal definition and requirements
Medical data
In order to develop an anatomically integrated in-place approach to visualize a synopsis of task-specific patient data, we need a formal definition of the medical data and visual encoding attributes. Our data organization links the formalism of the Unified Medical Language System (UMLS)
1
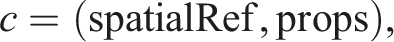
to the data required in the visualization process. As UMLS itself is organized as ontology, it covers all notions and terms, as well as spatial and diagnostic relations. During the implementation process, UMLS serves as knowledge background in the discussion with the physicians to extract task-specific medical data (see Sec. Mapping of Spinal Disc Herniation Data). Additionally, we require data types and domains, as they play a central role in the visual encoding of the patient data. The medical data to be visualized is organized in categories, each of them can have one or several properties. The categories are grouped into usage-dependent views. Below we give the precise definition of these concepts and their relations. • Property. A property p is defined as triple • Category. A category c is a pair • View. A view V ⊆ C is defined as the categories relevant to the given usage context.

Note: Views automatically reduce the amount of information to be visualized, and thus the necessity of user’s navigation, by preselecting the context relevant data.
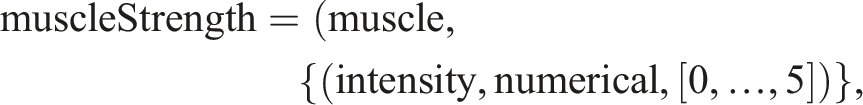
The following examples illustrate the structural concept introduced above.
The category ‘muscle strength’ refers to the anatomical structure ‘muscle’, comprising a single property with the type ‘intensity’ that documents the strength a patient can create in a specific muscle, quantified in six numerical values.
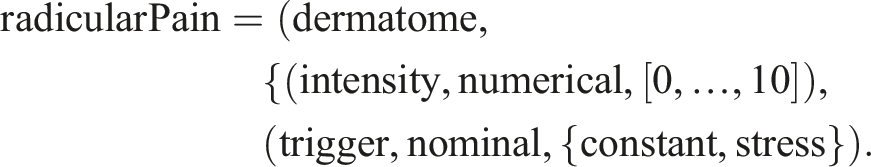
The second example describes the category ‘radicular pain’, i.e., pain caused by irritation of a nerve root and related to the skin region that is associated with the latter, i.e., dermatome. This category comprises one numerical and one nominal property.
There are several fundamental relationships between views, categories and properties: • A property type is unique within a category. Property types obtain their medical meaning only in combination with the category they are used in. • A property type can be shared between properties of several categories. This expresses similarity of medical concepts, such as ‘intensity’ of clinical symptoms in the prior examples, even if the respective property domains can be distinct. • A category is unique within a view. • A category can be shared between several views, as it can be relevant in different usage contexts.
In oder to be able to properly specify the mapping of medical data to visual attributes, we define the set T of all property types as

Visual attributes
Shape and position are mainly predefined as the anatomical structures that are used for visualization in our concept, the geometric visual attributes cannot be used for data encoding. 2 The remaining visual attributes are color components, namely hue, brightness and saturation, textures and transparency, as well as time using, e.g., animations.
Let a denote a visual attribute, A the set of all visual attributes, and a. range the discrete and finite set of distinctively perceivable values of a ∈ A. Note, that
Visual encoding/mapping
The mapping of medical data to visual attributes is represented in Figure 2 and comprises three levels, i.e.(a) encoding of categories (step 1–2), (b) encoding of property types (step 3), (c) encoding of property values for all properties of each category (step 4). The three level visual encoding of medical data.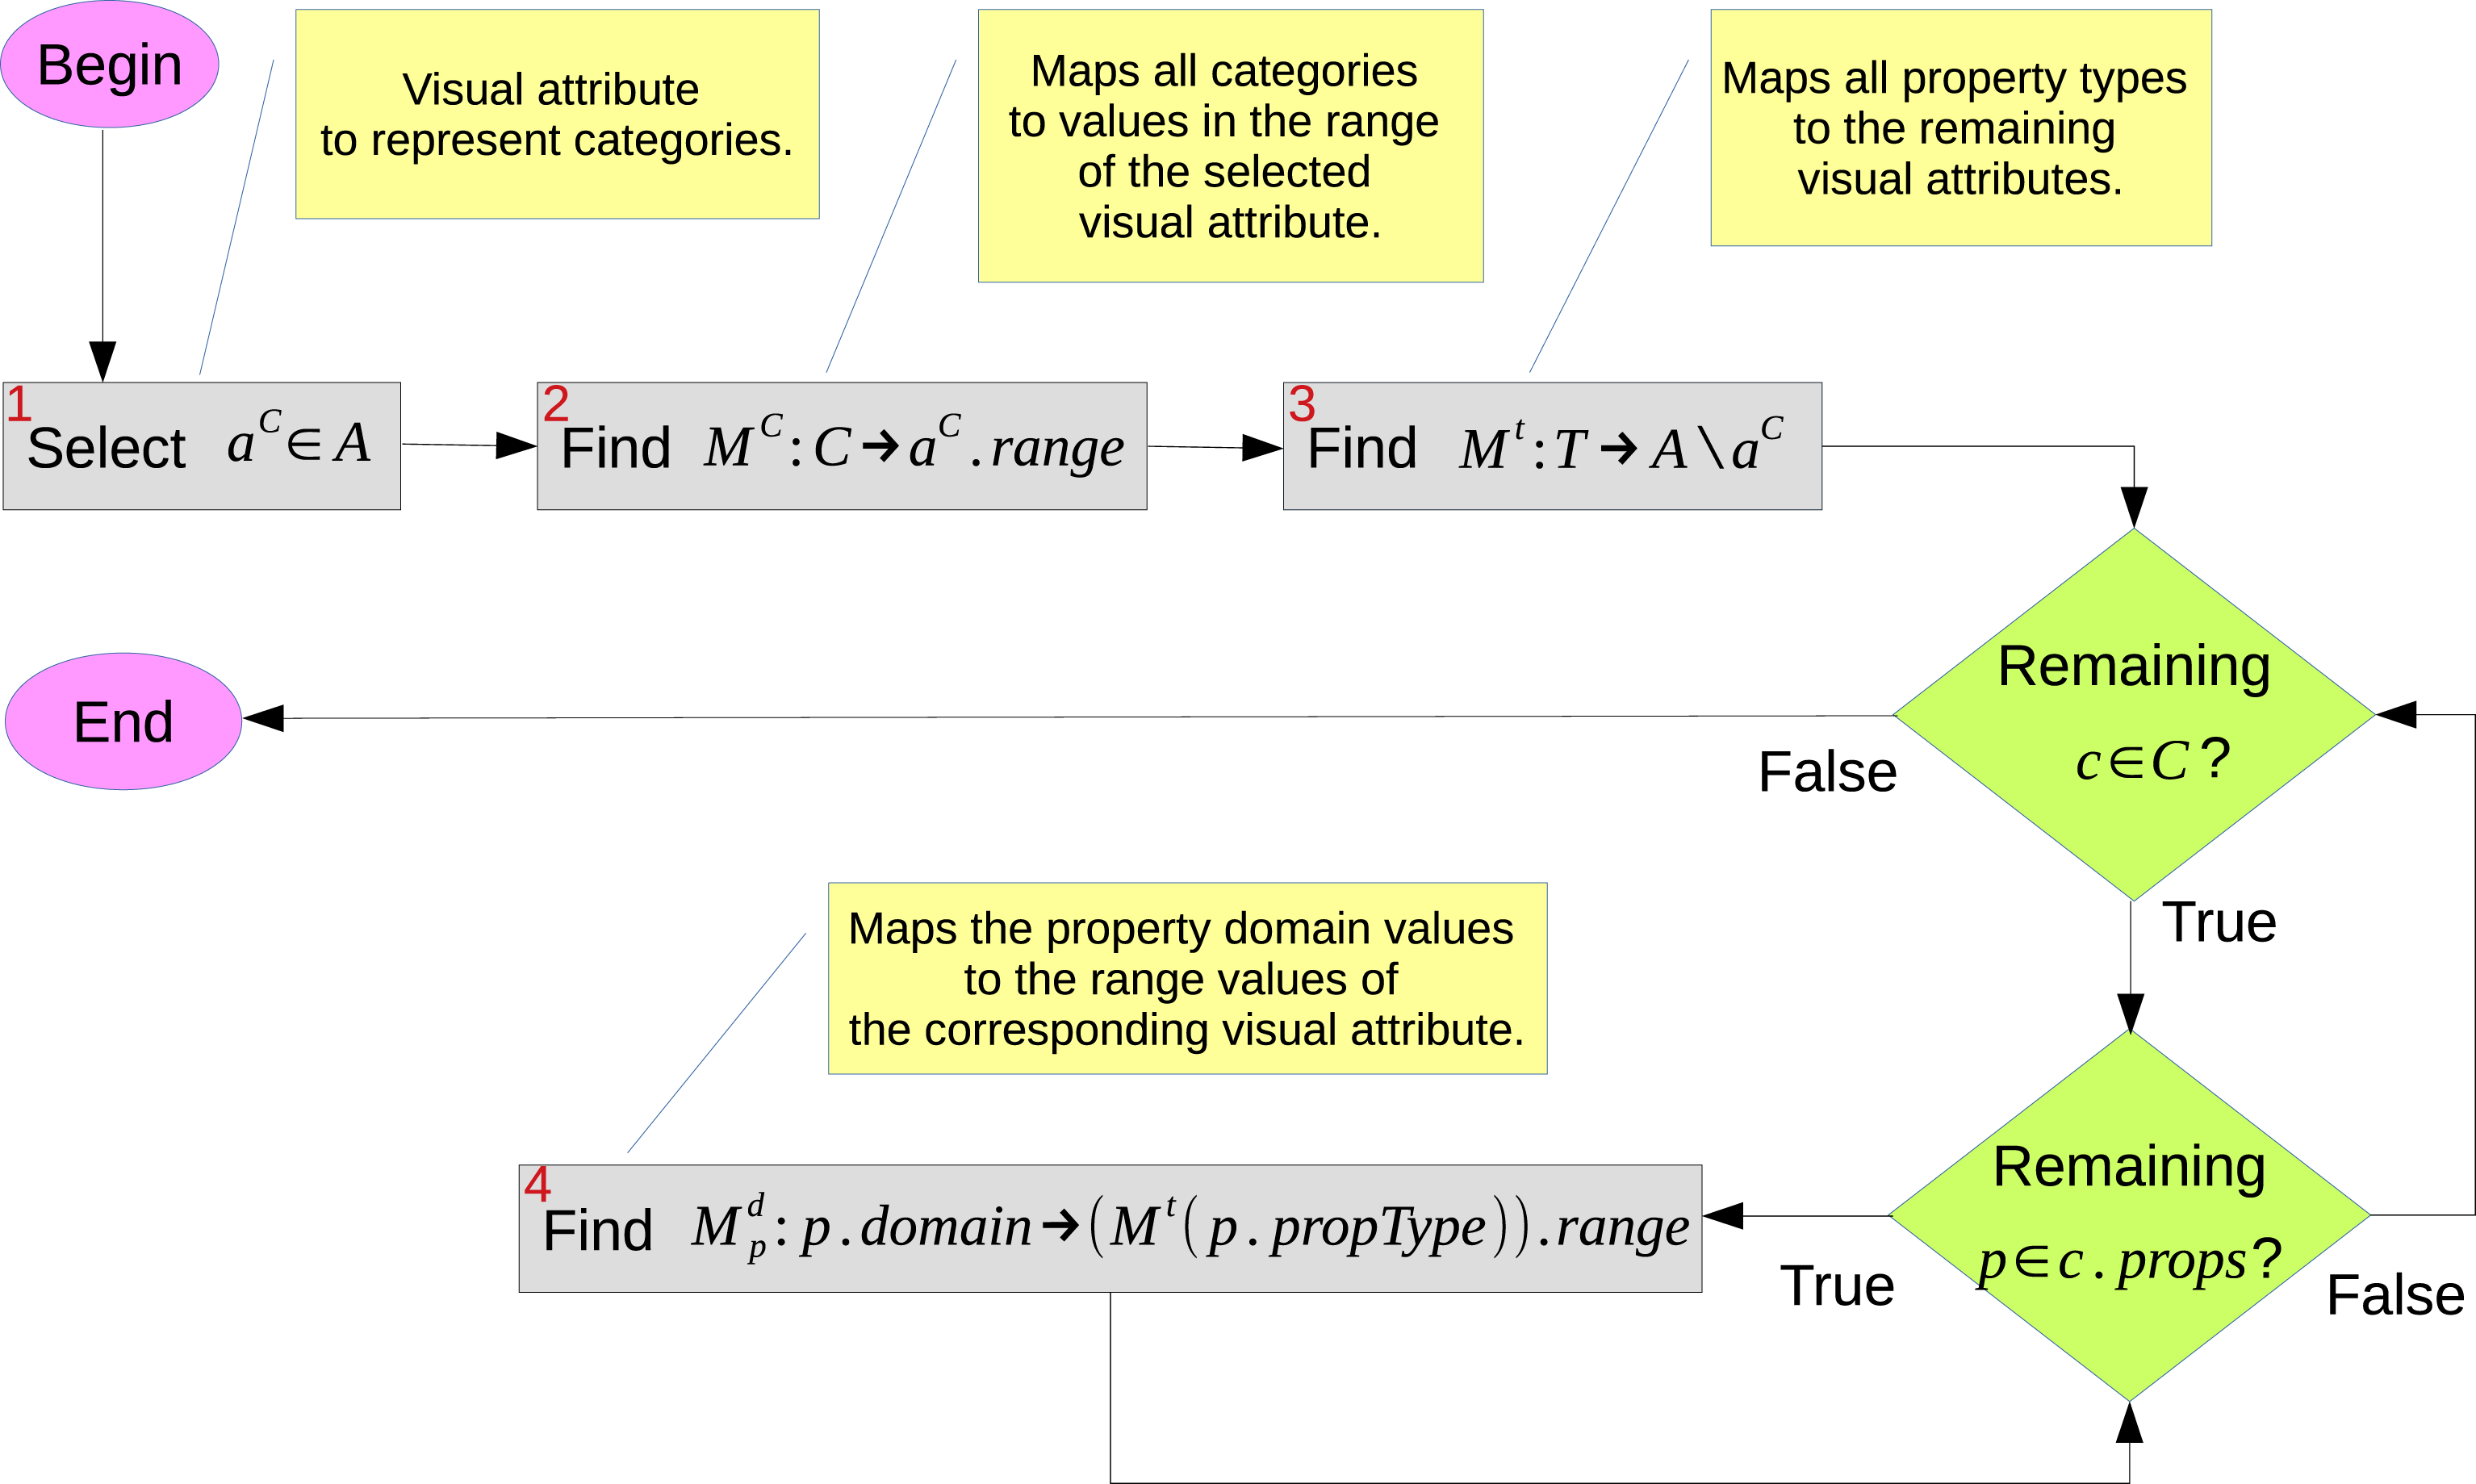
Injectivity requirement
In general, injectivity is a pre-requisite for any visual encoding/mapping in order to lead to an unambiguously comprehensible representation (see, e.g., Ziemkiewicz and Kosara). 23 We distinguish the following situations where either the mapping injectivity is strongly required or its violation has to be recognized and appropriately tackled.
Local Injectivity
In the case the mapping M c : C → a C .range or M t : T → A \{a C } (see Figure 2) is not injective within a given view V or category c, respectively, it is impossible to trace back the categories or property types from their visual representation. Local injectivity can be guaranteed if (1) all categories of a view are mapped to distinct values of a C , and (2) all property types of a category are mapped to distinct visual attributes.
Global Injectivity
While local injectivity guarantees the visual distinctiveness of categories and properties inside each single view and category, respectively, the global injectivity ensures the uniqueness of visual encoding across respective contexts, i.e. categories and views for property types and views for categories. Due to the restricted distinctiveness of visual attributes, global injectivity is hardly achievable, still it should be pursued as far as possible.
Spatial Injectivity
Obviously, several categories of a view can refer to the same anatomical structure. The violation of spatial injectivity rules out simultaneous visualization of the respective medical data and needs to be handled explicitly (see Sec. Further Visualization Concepts).
Property Domain Injectivity
A non-injective mapping of a property domain to the respective visual attribute range causes quantization and, consequently, leads to a loss of information. In some cases a quantized visualization can be acceptable, in particular in the context related synopsis (cf.
Visibility restrictions
A 3D visualization with free camera motion may intrinsically affect the visibility of geometric objects representing anatomical structures. In our case, we have two causes for restricted visibility. 1. An anatomical structure that relates to relevant medical data (target) may be occluded by another anatomical structure. For example, a muscle affected by paresis is hidden under the skin. 2. The spatial extension of an anatomical structure is too small in relation to the entire human body, so that the visualization cannot be clearly recognized. An example would be a tendon.
Both aspects are handled in our visualization concept as described in Section Further Visualization Concepts.
Further visualization concepts
Independent from the specific mapping that we introduce in Sec. Prototype Implementation, there are further aspects that we added to our anatomically integrated in-place visualization concept in order to achieve the design goals postulated in Sec. Design Goals.
Data selection
Besides two already described data selection mechanisms, which apply automatically, i.e., focusing on the abnormal and usage-dependent views, we provide the user with the possibility to additionally filter the data by their categories. Note that the usage-dependent preselection reduces the available categories to a manageable amount. This filter allows to tackle, inter alia, the visualization of multiple medical data for same anatomical structure, i.e., spatial non-injectivity (see Sec. Injectivity Requirement).
Alternating visualization
In the constellations where a simultaneous visualization of multiple medical data on the same anatomical structure is not possible, i.e., the spatial injectivity is not fulfilled (see Sec. Injectivity Requirement), an alternating visualization with additional user control to select one of the alternatives, e.g., through the data category filter, can be applied (see Figure 3(a), (b)). Visualization of temporal changes. Figures 3(a) to 3(b) show the visualization of the preoperative neurological status of a patient with an asymmetric patellar reflex, a moderate paresis in the right extensor hallucis longus muscle, a mild paresis in the tibialis anterior muscle, a severe pain and a hypoesthesia in the left L5 dermatome, whereby the pain (see Figure 3a) and the hypoesthesia (see Figure 3b) are visualized alternately; this visualization is used in 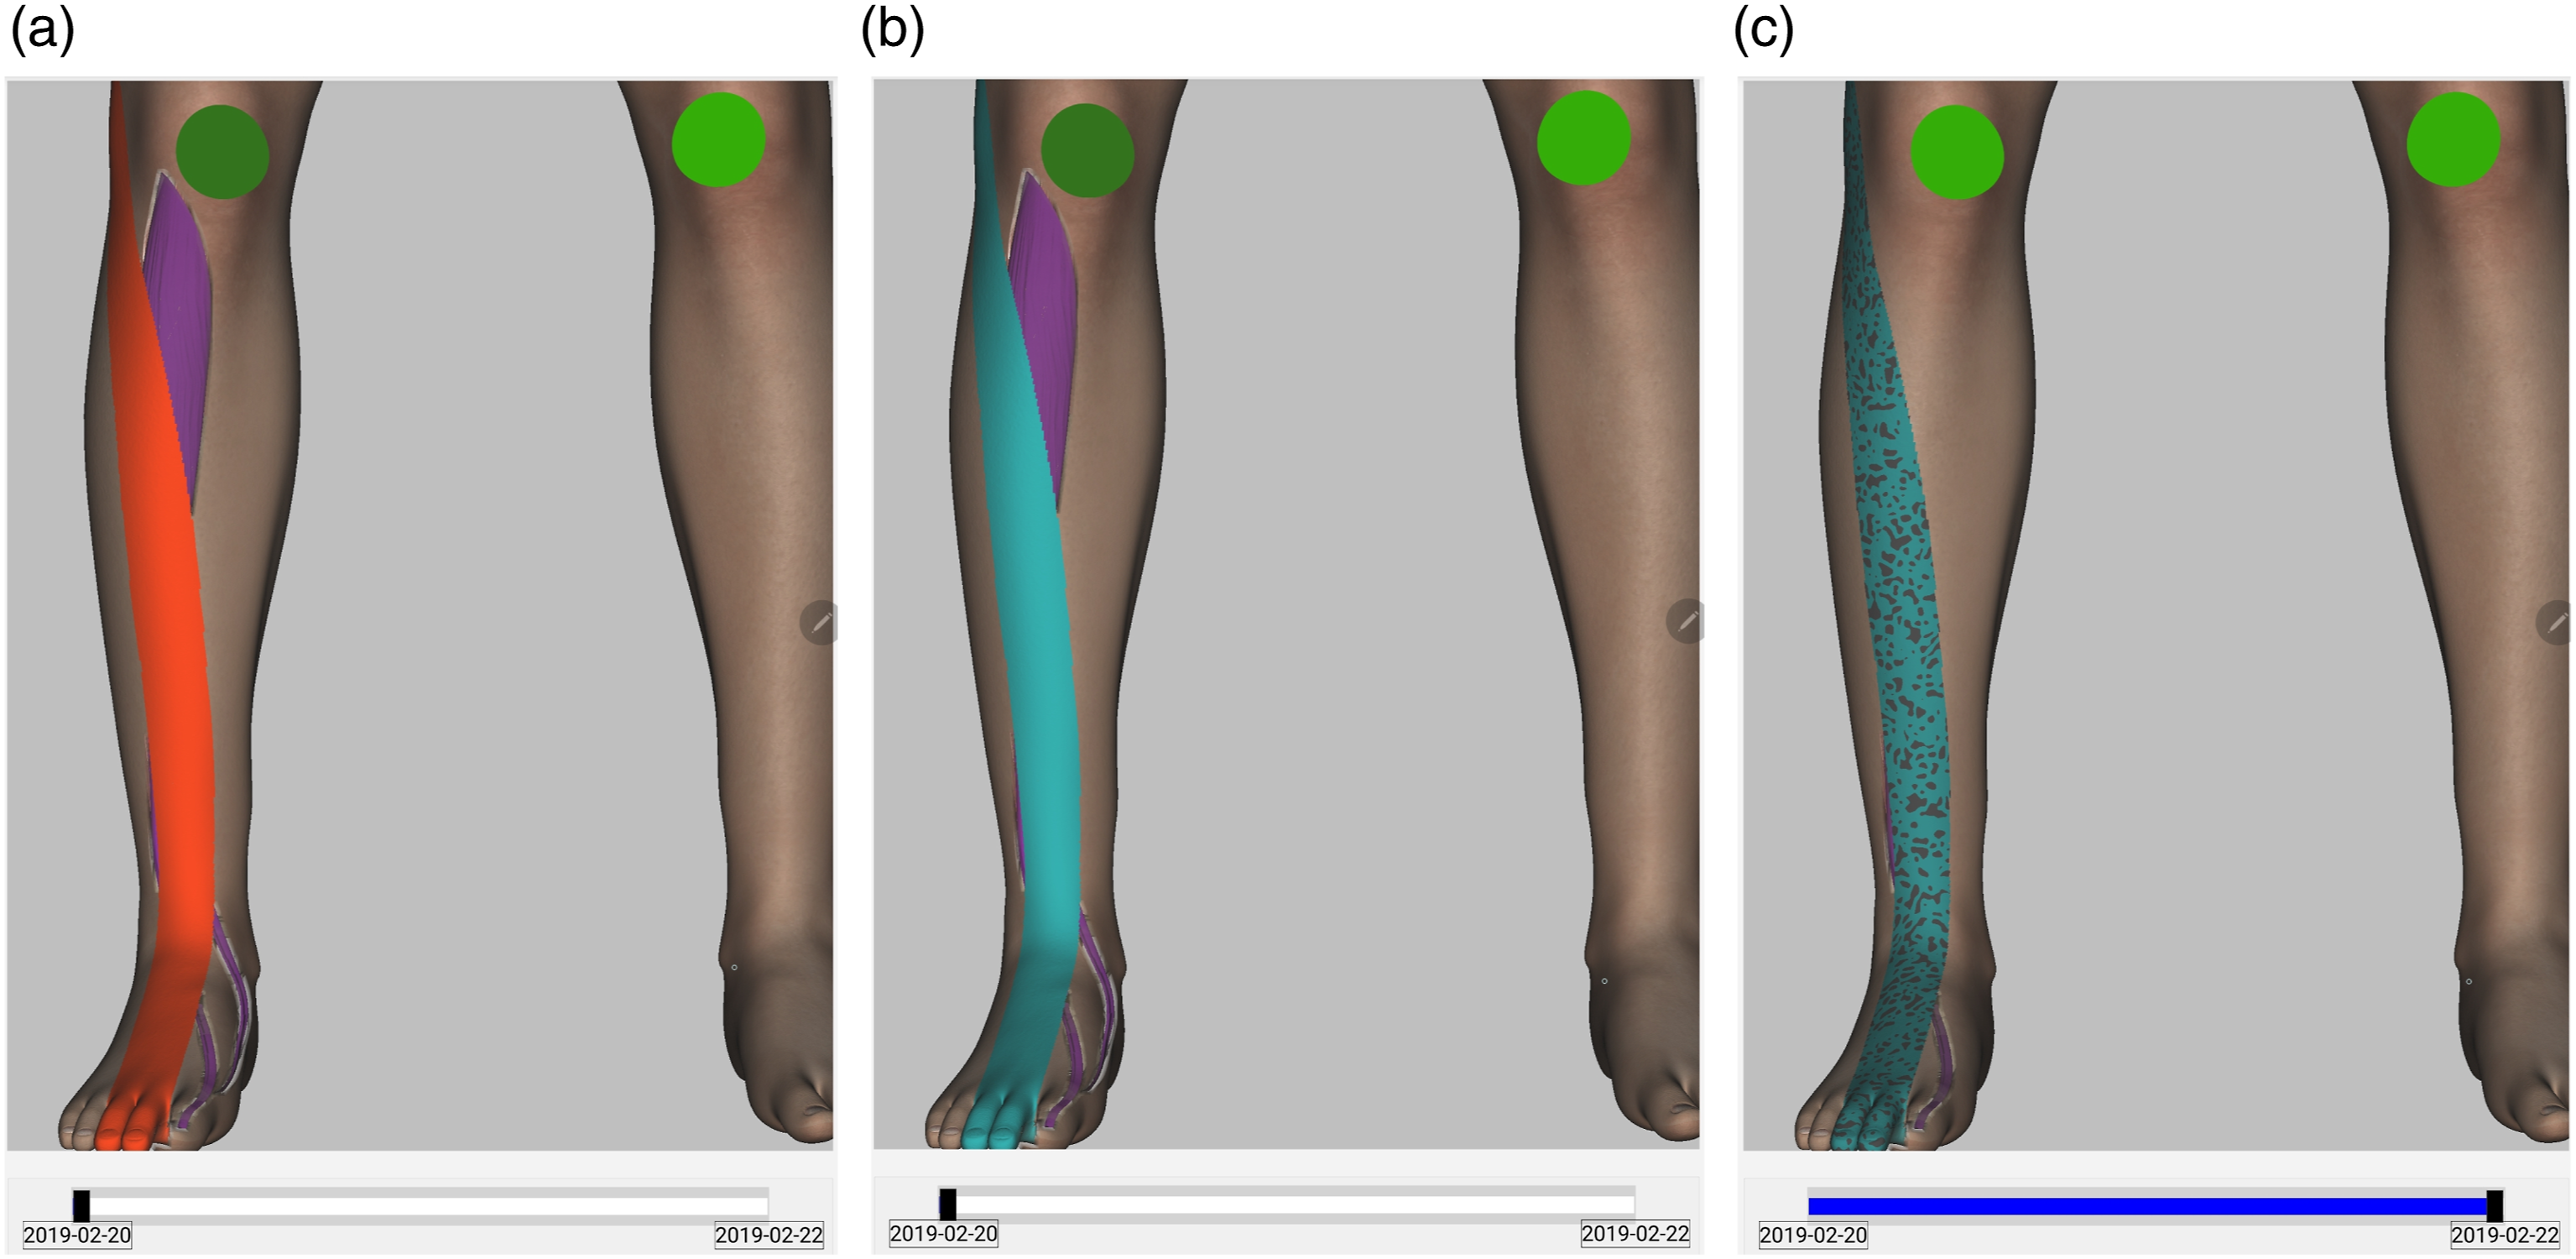
Textual overlays
In some situations, the physician may want to access the underlying information explicitly, i.e., in textual form. We enable this by textual overlays on top of the corresponding anatomical structure in order to, for example, resolve the quantization problem (see Sec. Injectivity Requirement) that results in a simplified visual representation or to support the physicians in the getting acquainted with our visualization tool.
Proxies
The small object extension problem (see Sec. Visibility Restrictions) can be tackled by means of an appropriately scaled proxy that is displayed on the body surface over the location of the target anatomical structure and rendered with the corresponding visual attributes.
Transparencies
In order to handle depth occlusions of anatomical structures carrying relevant information by other anatomical structures (see Sec. Visibility Restrictions), we use view dependent (semi-)transparency for the occluder, in case the occluder itself is not carrying relevant information, while preserving the surrounding anatomical context.
The specific technical approaches taken to implement textual overlays, proxies and transparencies are described in Sec. Rendering Implementation Details.
Prototype implementation
Based on the design goals stated in Sec. Design Goals and the visualization concept introduced in Sec. The Visualization Concept, we present a prototype implementation on a mobile device. As a proof of concept, we focus on patients with spinal disc herniation and the relevant medical data for assessing a patient’s neurological status.
Development environment
As geometric model for the anatomically integrated visualization we use plasticboy’s 3D human avatar 3 , which fulfils the substantial requirement of an exact and faithful representation of the human anatomy. Even though the model already includes the main organ systems subdivided into the corresponding anatomical structures, this subdivision is not sufficiently detailed for the use with our visualization approach. Thus, we map the initial plasticboy anatomical human model to the hierarchy of the Foundational Model of Anatomy Ontology (FMA) 4 . Furthermore, dermatomes, which constitute very important anatomical structures in the context of neurosurgery, are not reflected in the model. Hence, we set up an anatomy refinement procedure based on indexed texture maps that allowed us to define substructures on the existing geometries.
Our prototype was developed in C++, using Qt 5.12 for Android for the platform integration and our own rendering framework, which is based on the Vulkan 1.1 API. The latter allows an efficient resource management, which is important especially on mobile devices.
We developed the prototype in Qt Creator natively, using the Qt Android integration and our own Vulkan Framework.
Prototype features
Mapping of spinal disc herniation data
Raw Data Categories
Data Categories: The raw data categories (left block), the final categories after discussion with the physicians (center block), and the visual attributes incl. Anatomical reference (right block). Only the abnormal states are listed. Specific aspects are indicated as 1 : quantization, 2 : usage of proxy geometry.
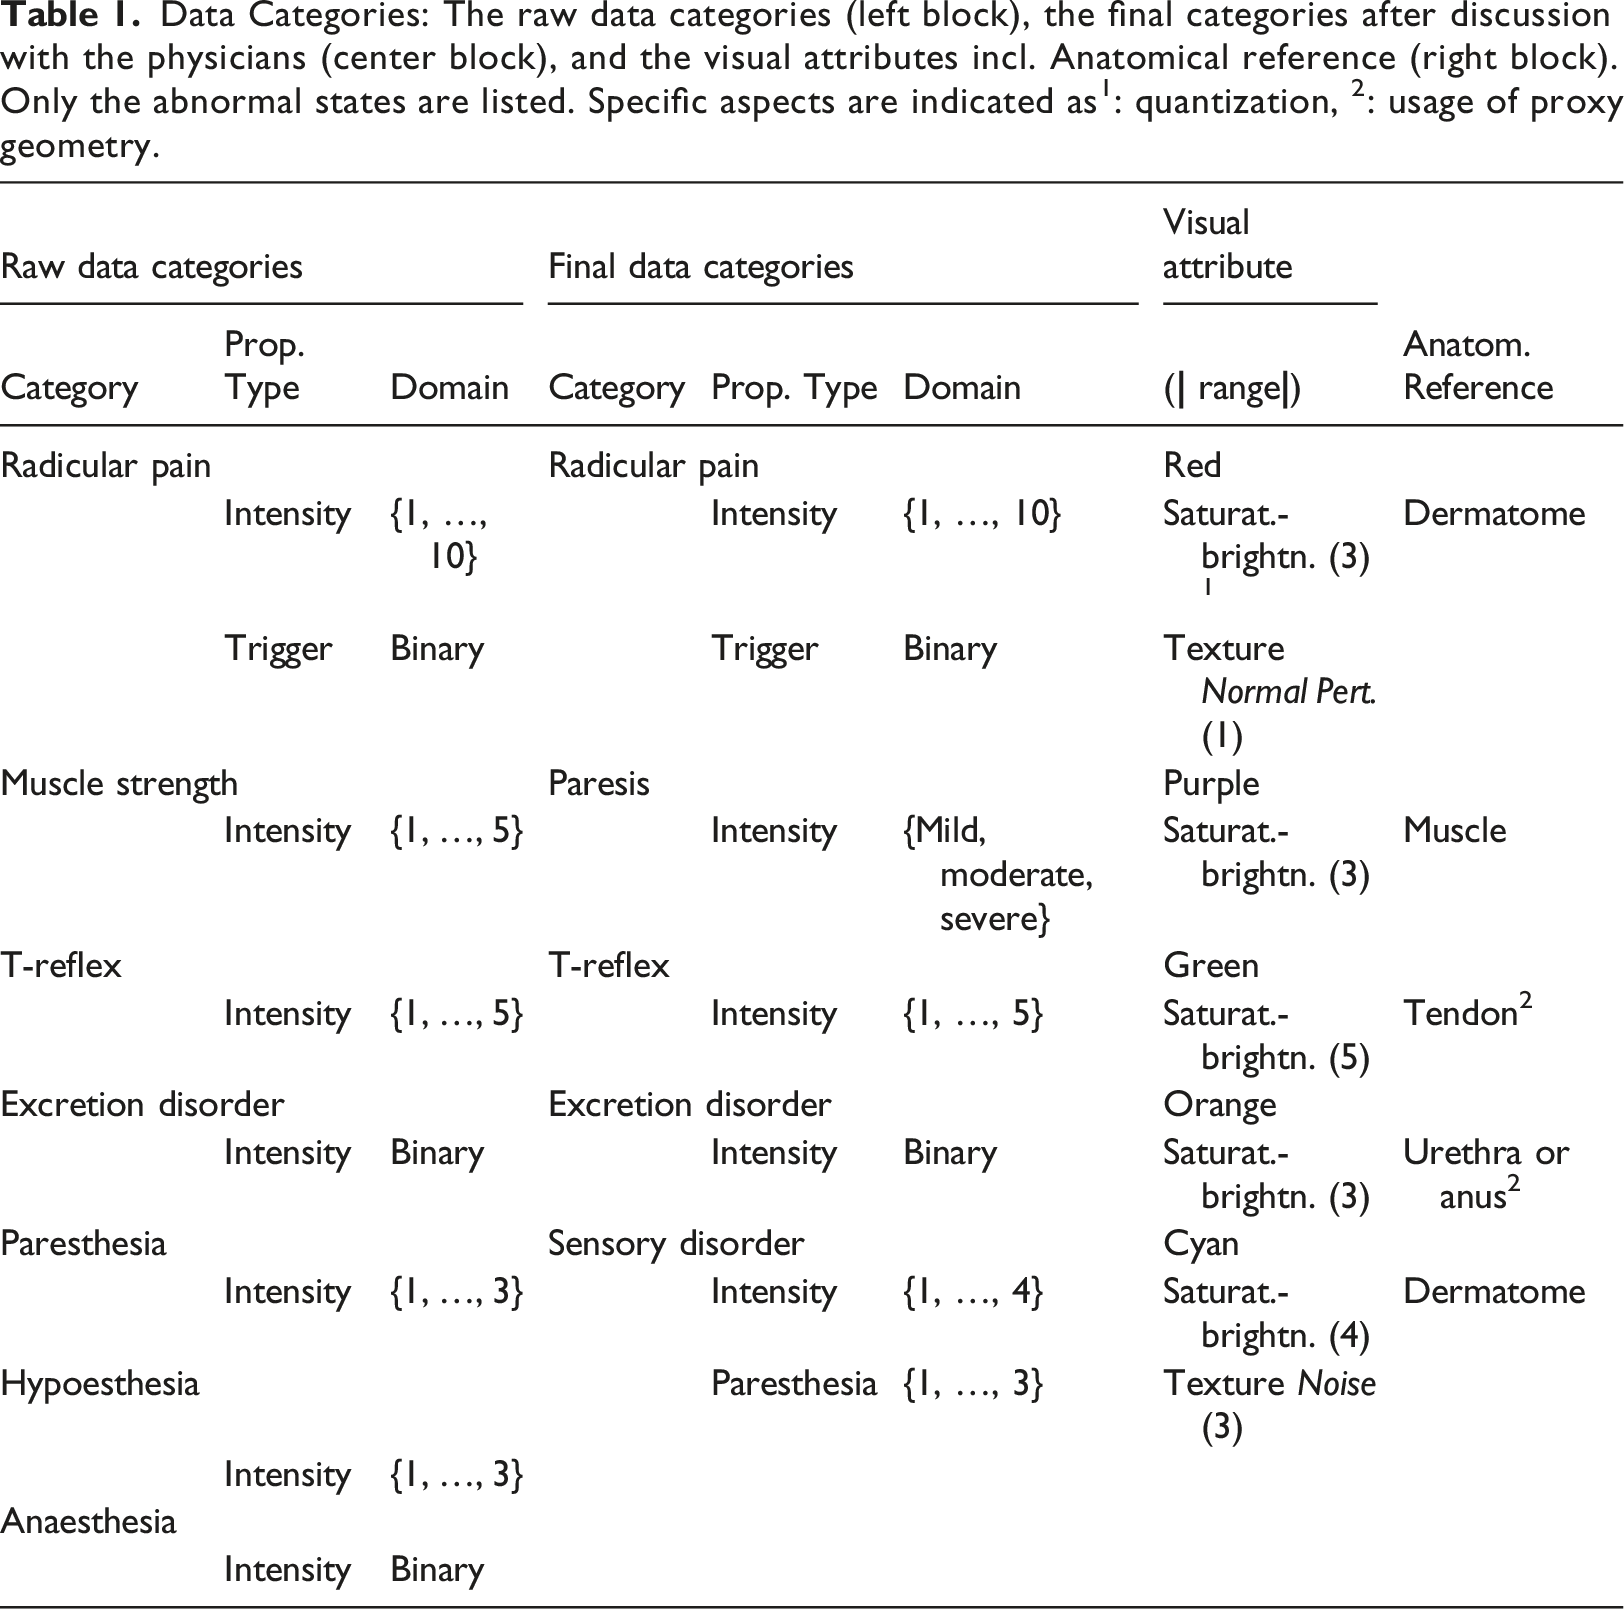
The category radicular pain has a further property with the type trigger, which states if the pain is constant or only occurs under stress, e.g. during movements, whereby the former is assumed to be the normal, i.e., default situation for pain that does not need any visual indication.
Data Category Refinement
The above raw categories mainly reflect concepts from the Unified Medical Language System (UMLS) vocabularies, related to neurological findings, which then have been partially refined with the participation of domain experts, in order to better map the application logic to the given context of cooperative tasks.
During the first trials with the prototype and discussions with neurosurgeons, two changes to the initial raw data categories have been applied.
First, the three categories related to sensory disorder, i.e., paresthesia, hypoesthesia and anaesthesia have rather complex interrelations. For example, hypoesthesia and anaesthesia can be considered as different stages of sense decrease, whereas paresthesia is in a certain sense orthogonal because it does not describe a decrease of sensation but rather its abnormality, e.g., tingling, and, thus, it can occur in combination with hypoesthesia. Therefore, the new category sensory disorder represents anaesthesia and hypoesthesia as a joint property with the type ‘intensity’ and has an additional property with the type ‘paresthesia’.
Second, insufficient muscle strength, measured in the Medical Research Council scale 0, …, 5, is used in daily clinical practice as indication for paresis that trigger for potential urgent actions such as emergency surgery. Therefore, we adopted this practice by using the category paresis with the ordinal data type comprising the values ‘mild’, ‘moderate’, ‘severe’.
Mapping of Data to Visual Attributes
The final medical data categories in Table 1 are visually encoded in consideration of the rules deduced in Secs. Visual Encoding/Mapping and Injectivity Requirement, that is, the mapping functions M
c
and M
t
are at least locally injective. We selected hue as the visual attribute a
C
to encode category (cf. Step 1 in Figure 2). The category mapping M
c
(cf. Step 2 in Figure 2) takes into account the distinctiveness of the resulting five hues with regard to each other as well as to their context in the anatomical model, e.g., a red color is not suitable for visualization on muscles because it highly coincides with their natural, i.e., healthy, appearance. The shared property type intensity is mapped in all categories to a composite visual attribute saturation-brightness in the HSV color space, i.e., M
t
(cf. Step 3 in Figure 2) is also globally injective. We decided to combine two respective visual attributes in a single one to increase the visual discriminability ( The legend of the prototype visual encoding. Figure 4a depicts the active tab of the sensory disorder category: the right L2-L5 dermatomes visualize four intensity levels, the left L3-L5 dermatomes show three levels of the paresthesia, i.e. Noise texture; Figure 4b shows the active radicular pain tab: the right L3-L5 dermatomes visualize three intensity levels, the left L3-L5 dermatomes show same levels in combination with the stress trigger, i.e., Normal Pert. Texture (cf. Table 1); the exact property values can be looked up by means of overlays similarly to Figure 6c.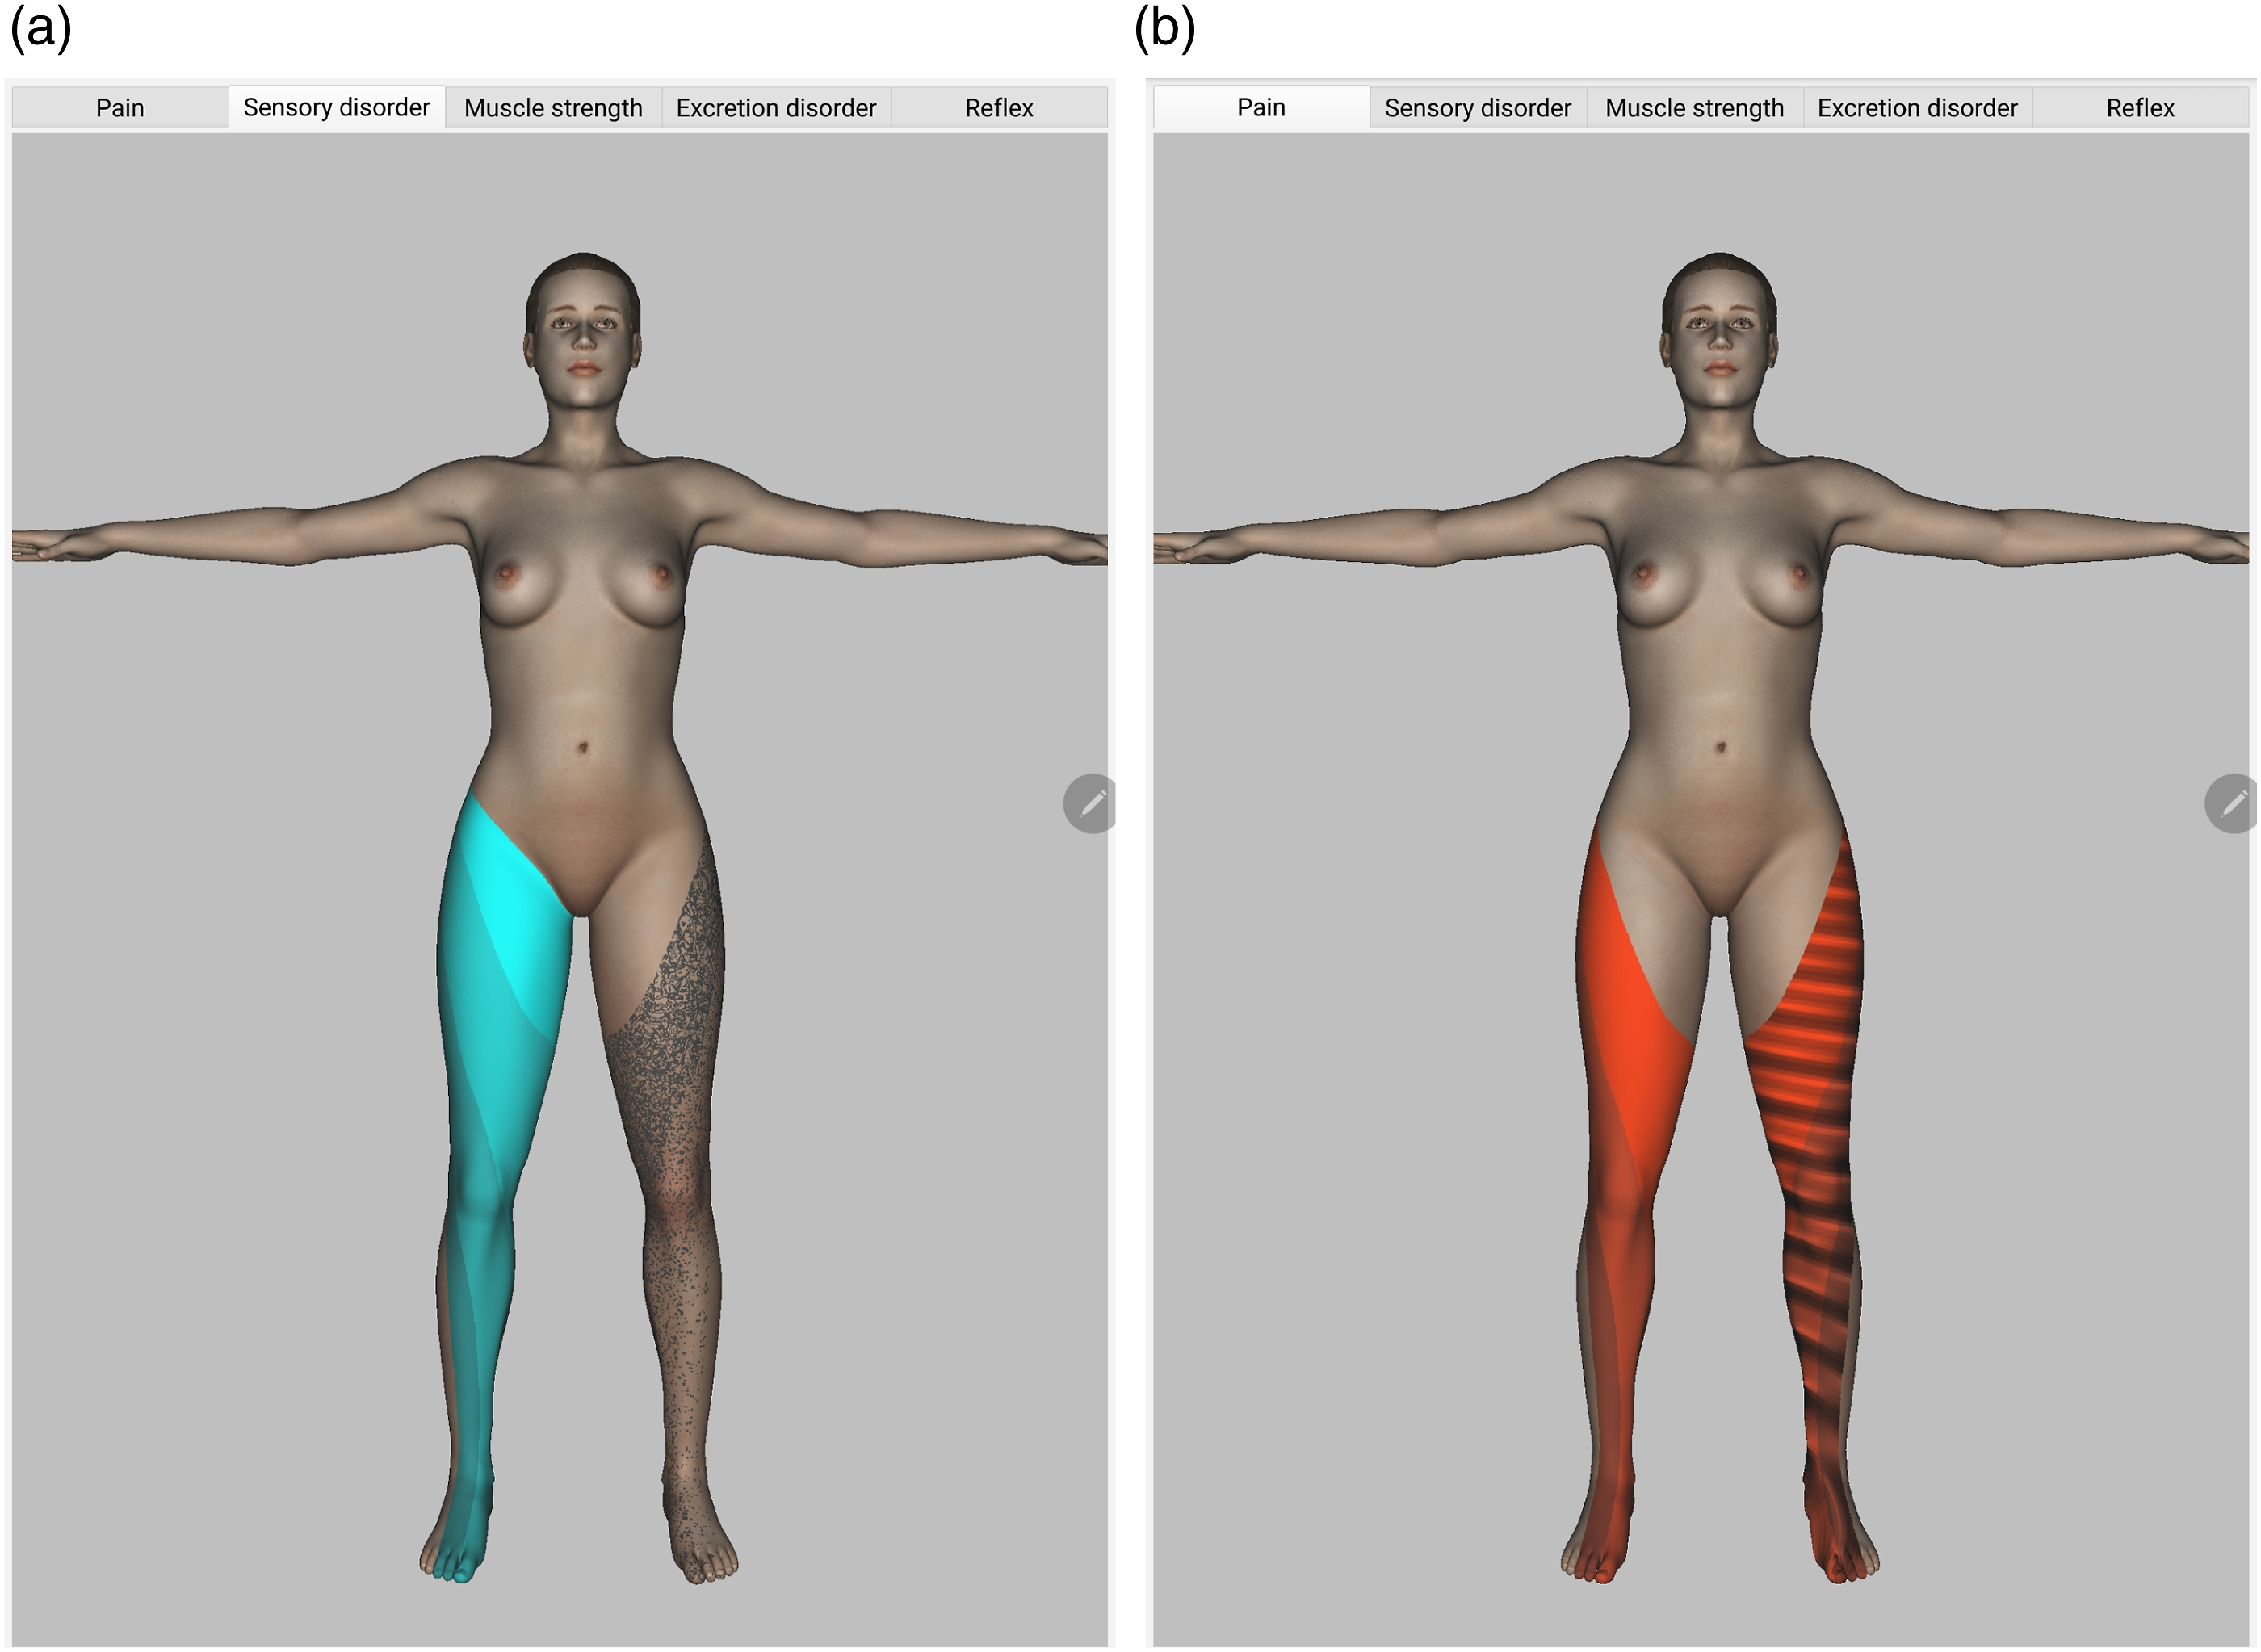
There are two additional features of the mapping to visual attributes that need to be mentioned (cf. Table 1):
(1) The 10 intensities of the pain category result in a visual quantization, i.e., the corresponding property domain mapping is not injective (see Sec. Injectivity Requirement). In this case, the technical reason for the quantization coincides with the physician’s suggestion for a reduction of the number of intensities for this symptom to account for the subjectivity of the patient’s sensation (cf. Jaatun et al., 5 who encoded pain intensity using three colors instead of the 1-to-10 scale, which was evaluated as suitable by most users; cf. also the 0-to-3 Digital Palpation pain scale in Masulo et al. 24 ). (2) the anatomical reference for the categories T-reflex and excretion disorder are too small and require a proxy geometry (see also Sec. Rendering Implementation Details and, e.g., Figure 3).
Rendering implementation details
In this section, we briefly describe some implementation details related to the realization of specific visualization features, partially mentioned in Sec. Further Visualization Concepts.
Anatomical Proxies
The main idea in generating anatomical proxies is to utilize projective textures, 25 e.g., appropriately scaled circles, on the skin surface above the anatomical structure that is too small for a direct visualization (cf. Sec Visibility Restrictions and the patellar reflex, e.g., in Figure 3).
Occlusion Handling
In order to visualize hidden anatomical structures in an integrated overview of the most relevant information without requiring specific selection, navigation or zooming efforts, we dynamically decrease the opacity of areas above the occluded target structure, depending on the current camera transformation (cf. Sec. Visibility Restrictions). Similar to Viola et al.
26
and Burns and Finkelstein,
27
we use an image space approach that allows an efficient detection of occluding fragments in real time on mobile hardware (see Figure 5). Dynamic transparency area with hierarchical information: the right gastrocnemius muscle with paresis data (purple) is visible through the skin of the same body region and partially occluded by the left leg.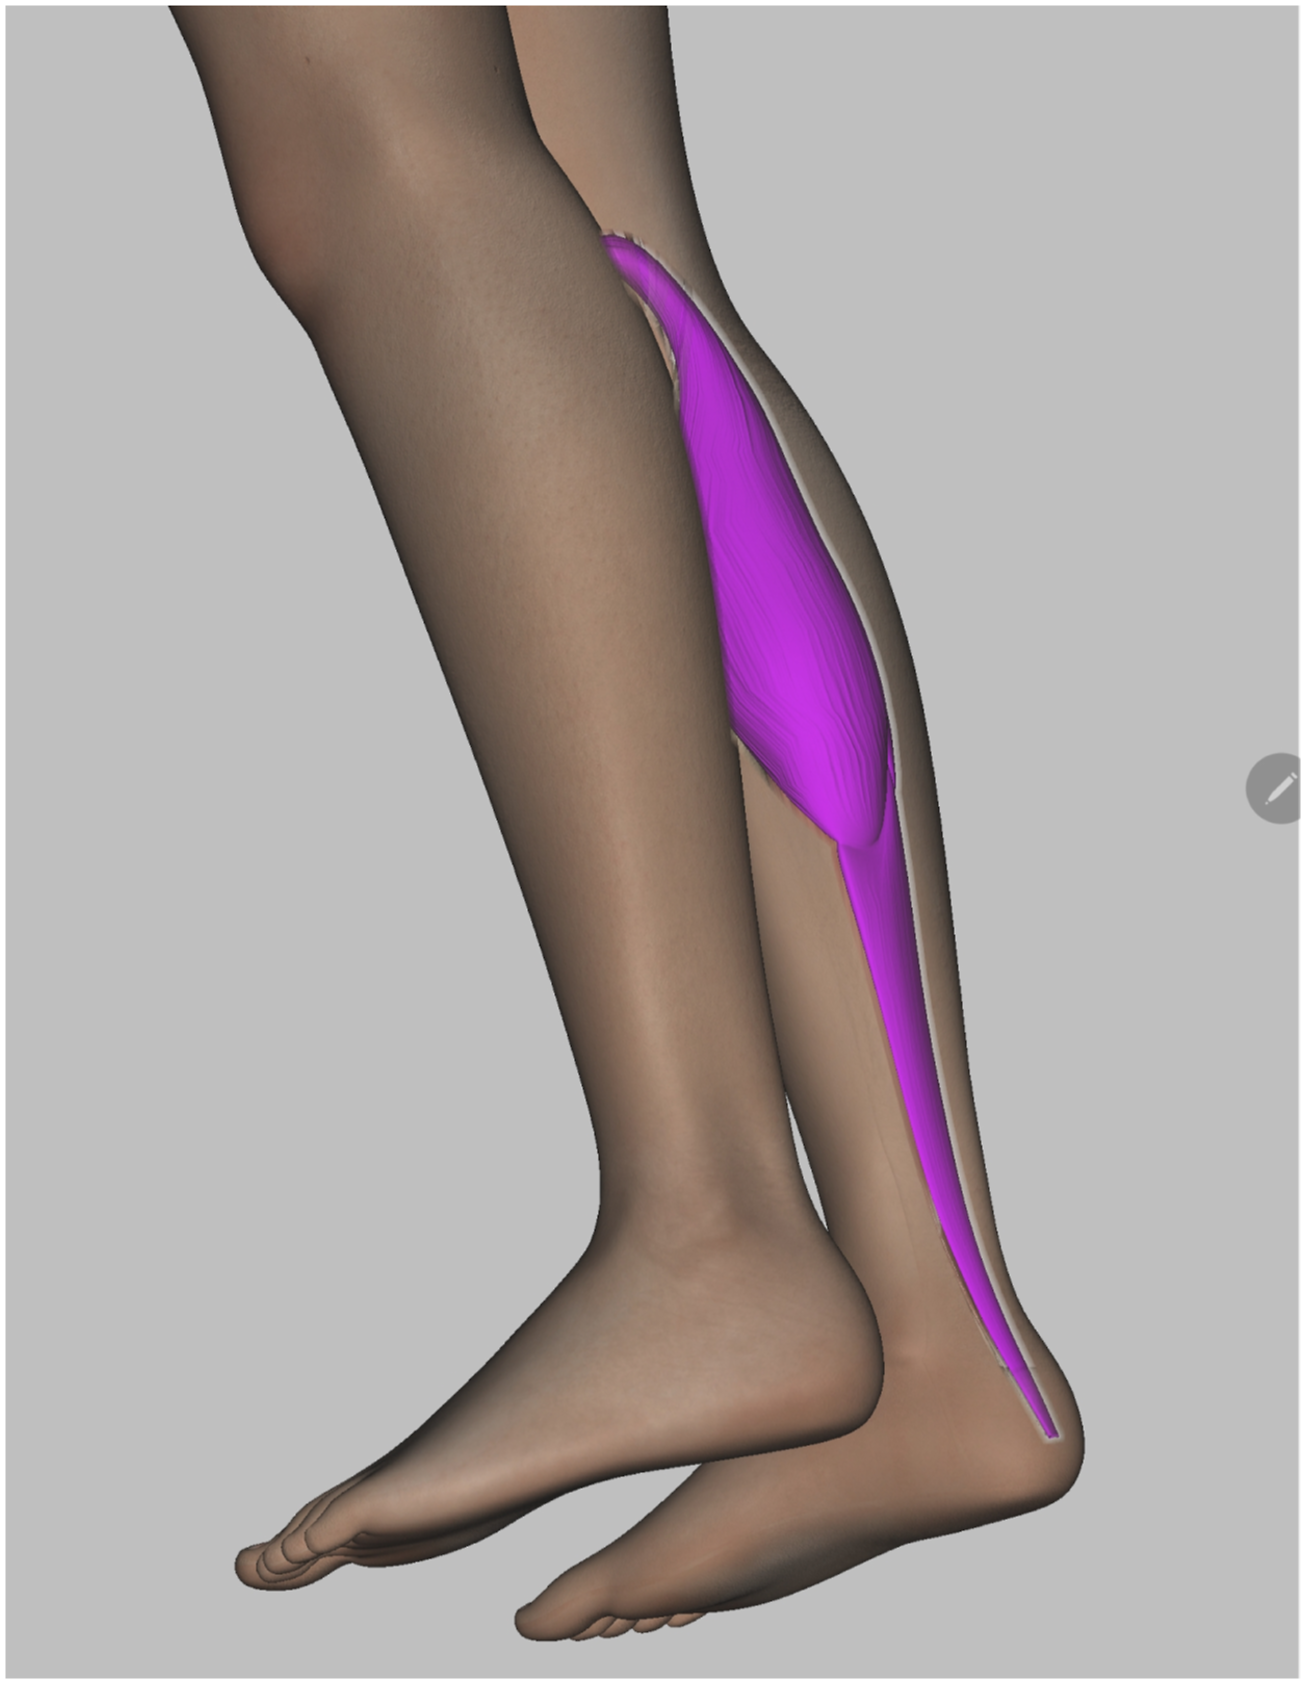
Context Menu
The prototype includes a context menu for accessing the advanced features such as the data category filter (see Figure 6a) and the overlays with textual data (see Figure 6c). The filter provides for the user the possibility to hide/show data visualizations by their category as described in Sec. Further Visualization Concepts, e.g., for handling of the spatially non-injective cases (see Sec. Injectivity Requirement). The overlays display textual data corresponding to the visualization on a anatomical structure selected by the user. Usage of further prototype features in 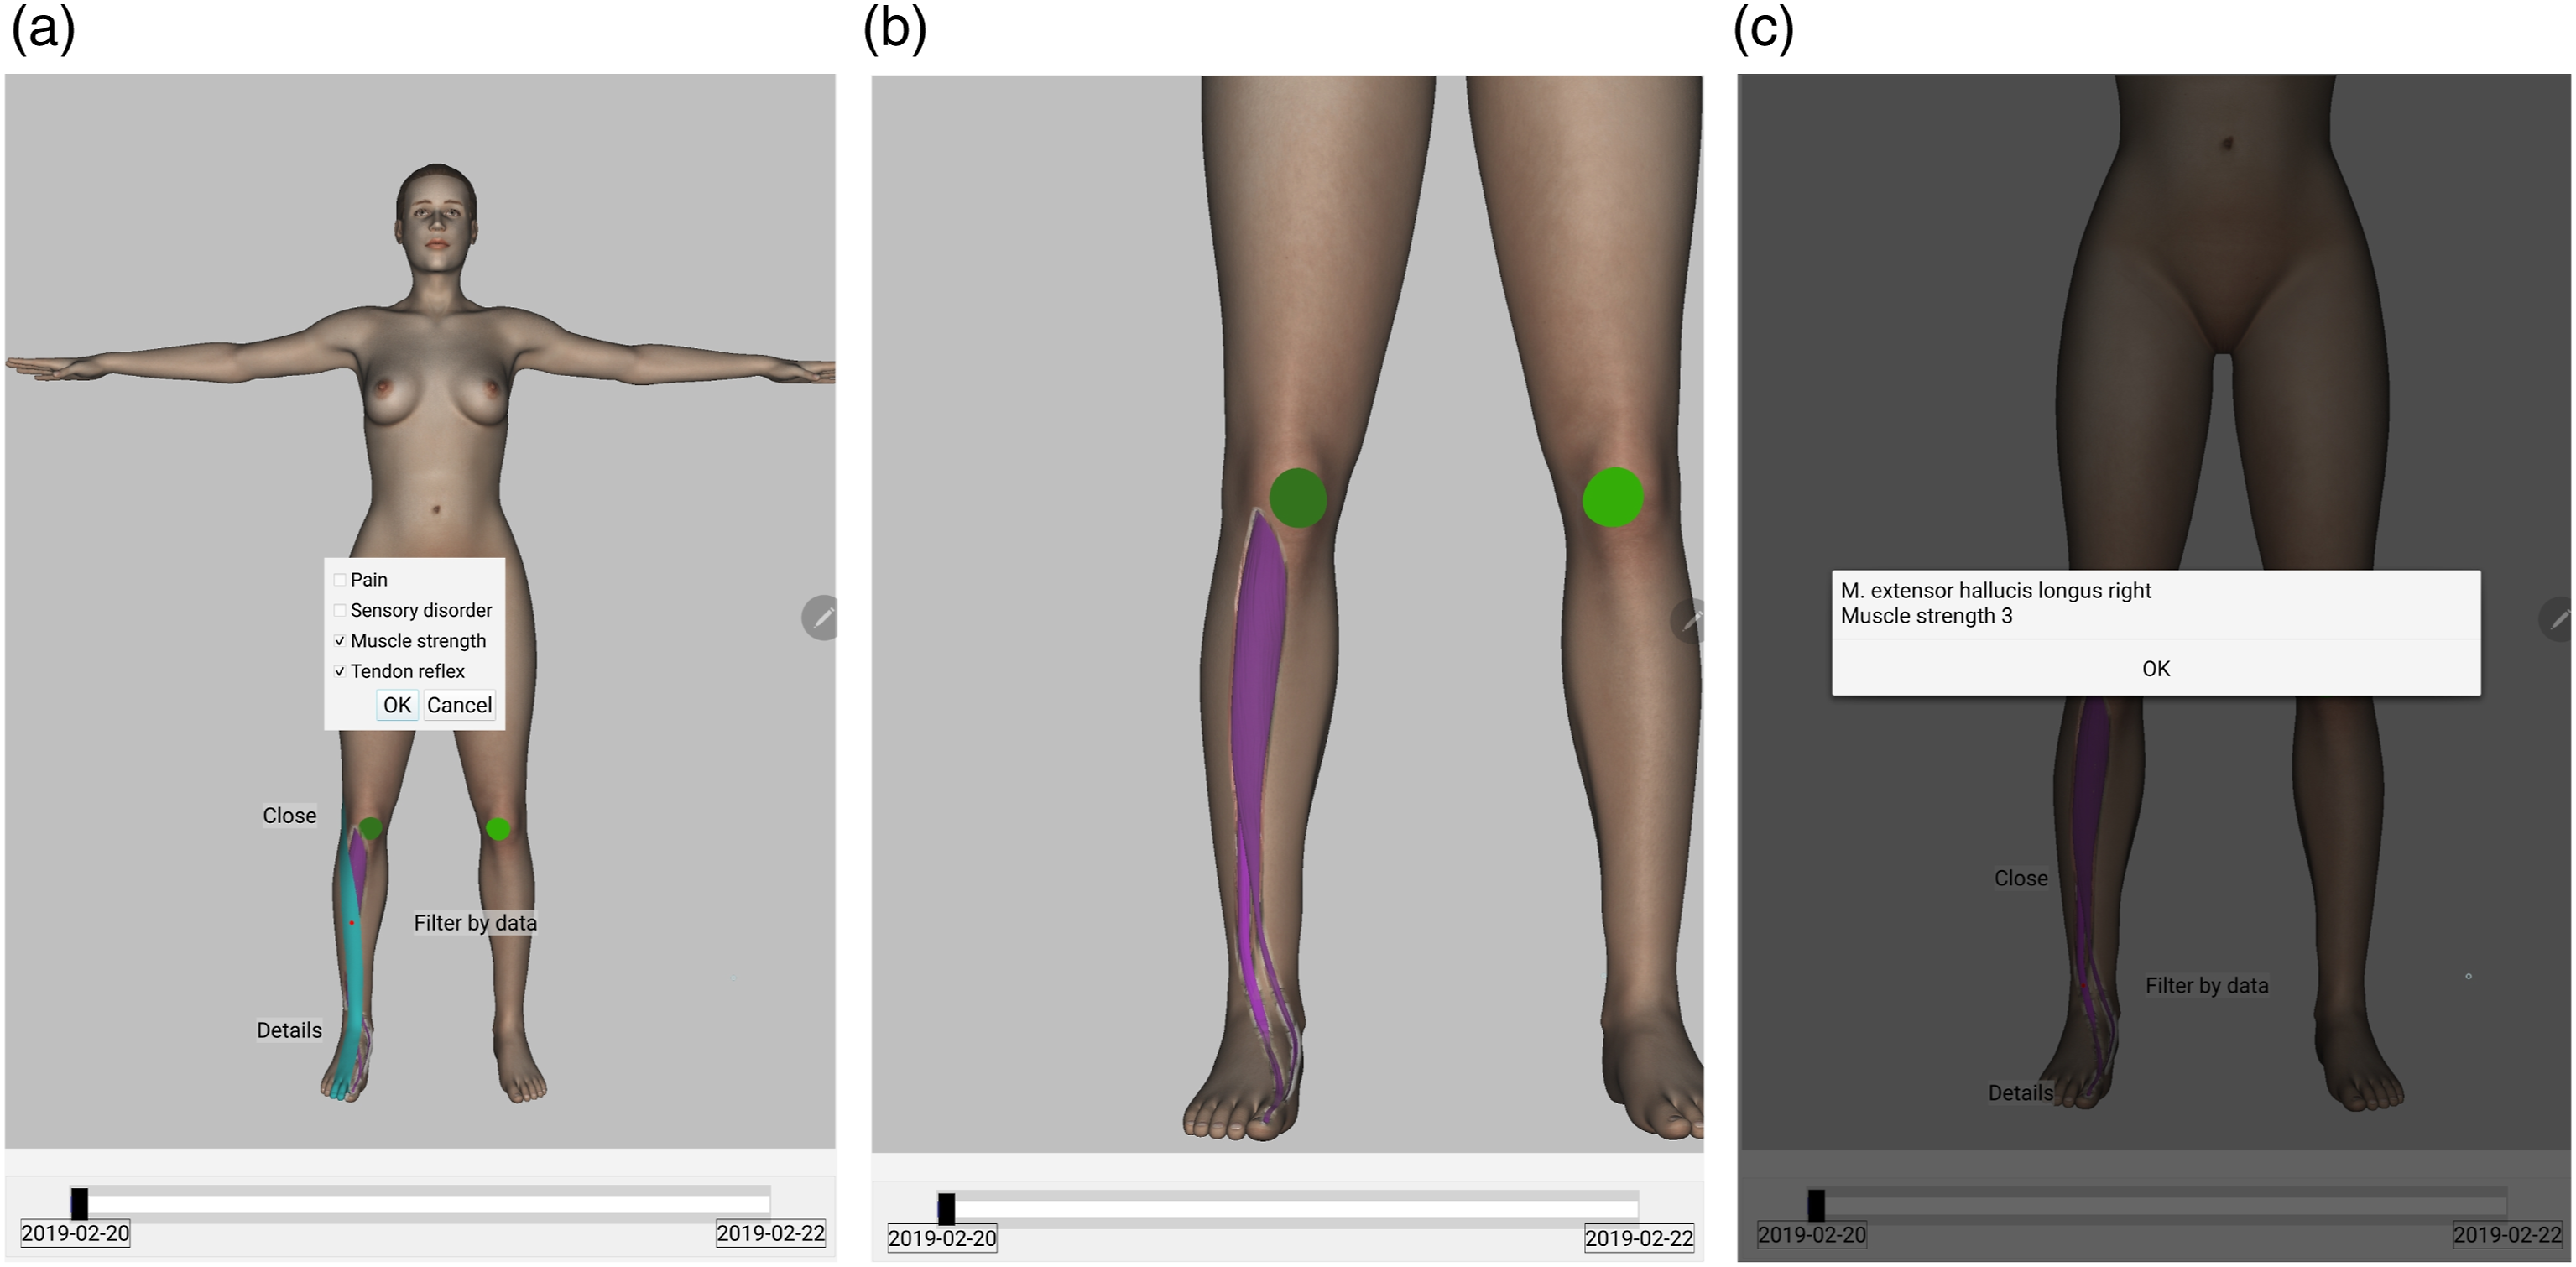
Visualization of Temporal Changes
For assessment of healing progress a slider with dates of available clinical examinations is integrated below the main 3D view (see Figure 3). Moving the slider, the user can navigate to the date of interest or scroll consecutive examination results. By selecting a date, the entries with the corresponding timestamp are retrieved from the database and the virtual body is rendered with updated visual attributes.
Prototype evaluation
Objectives
With the goal to evaluate the potential of our visualization concept and its limitations, we conducted a user study, addressing the following objectives.
(a) Use of anatomy for spatial data representation (cf. (b) Synopsis-like visualization of multiple data (cf. (c) Narrowing the amount of data to be visualized according to the given usage-dependent view (cf. (d) Use of a mobile platform (cf.
(a) Reading of a neurological patient status; (b) Reading of the healing progress by comparison of different status snapshots (cf. (c) Usage of interactive mechanisms, for instance data category filter or zooming (see Sec. Rendering Implementation Details), where the direct reading is impeded.
Setup
The evaluation comprises three practical tasks and a questionnaire. Figure 7 gives an overview of the evaluation process, including the evaluation objectives to achieve in each specific stage. The evaluation process of the visualization prototype. The left and middle column show the numbers of practical tasks or questionnaires and their short descriptions, respectively. The right column displays the evaluation objectives, as described in EO1-EO4, targeted by the corresponding task or questionnaire.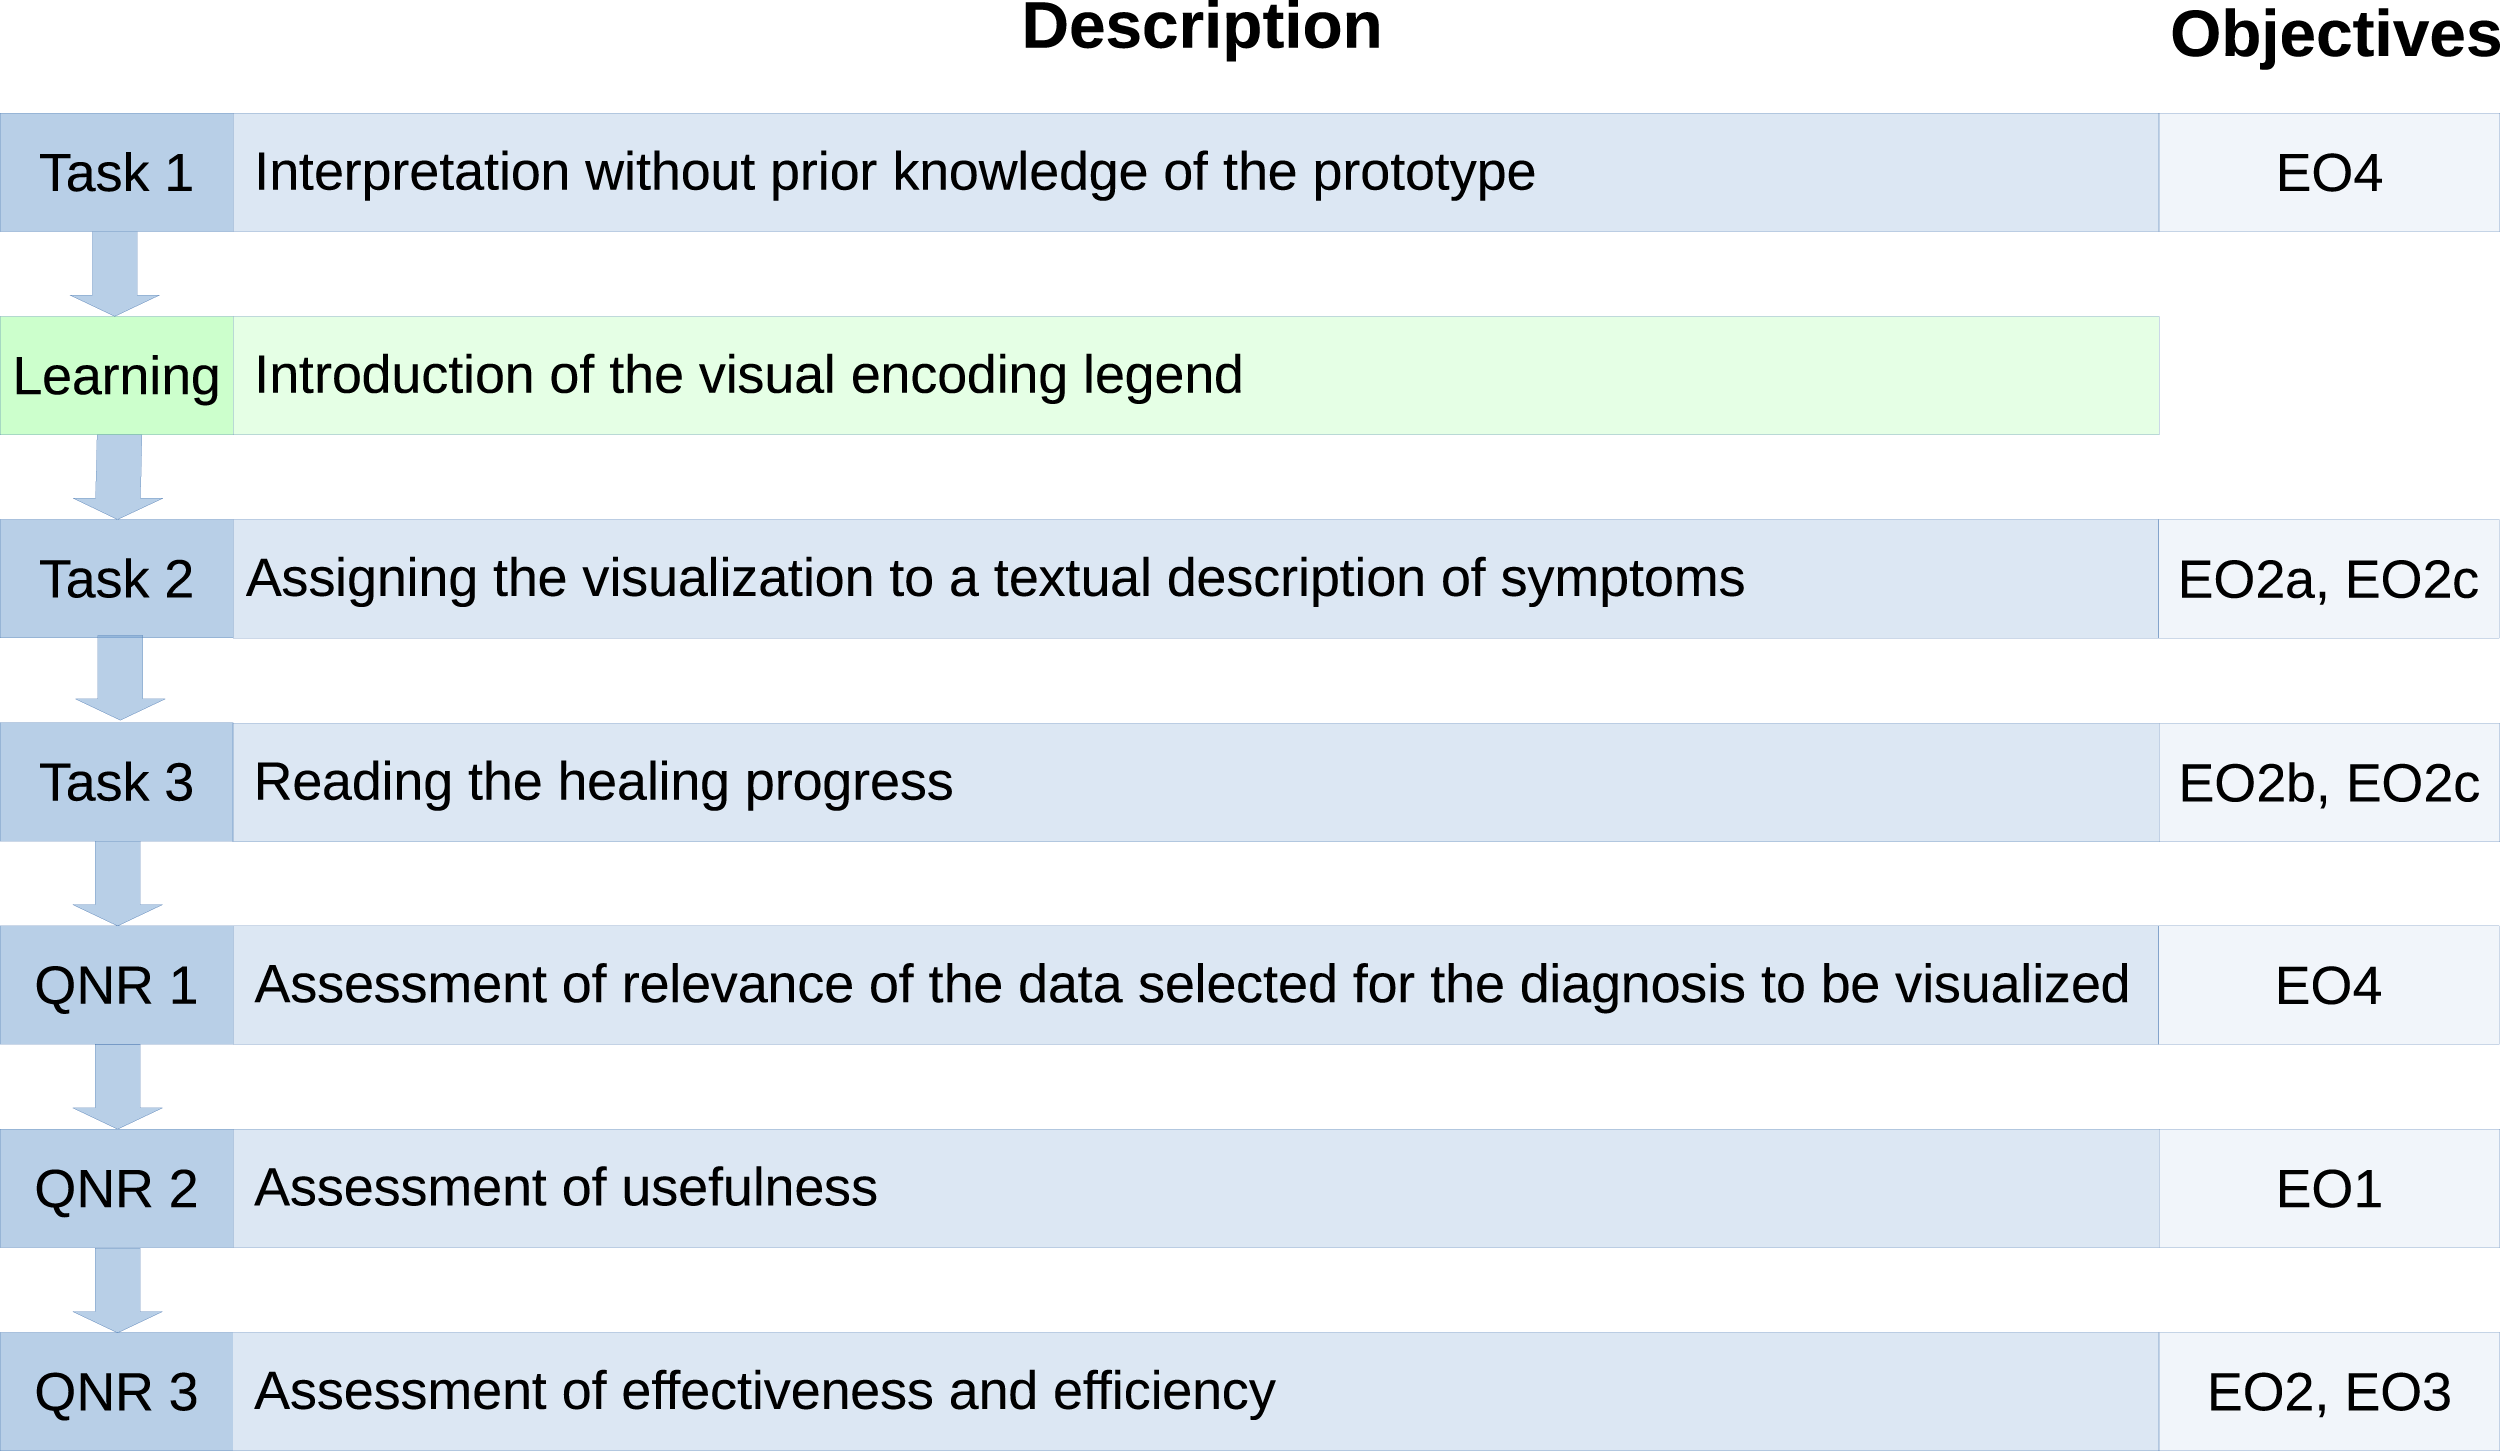
The practical tasks are designed as follows.
Task 1
In the first task, the physicians need to give their intuitive interpretation of two visualizations (see Figure 8) without previous knowledge about the meaning of the visual attributes. The assumption to be tested is that embedding in the anatomy (see Two visualization samples used for spontaneous interpretation in 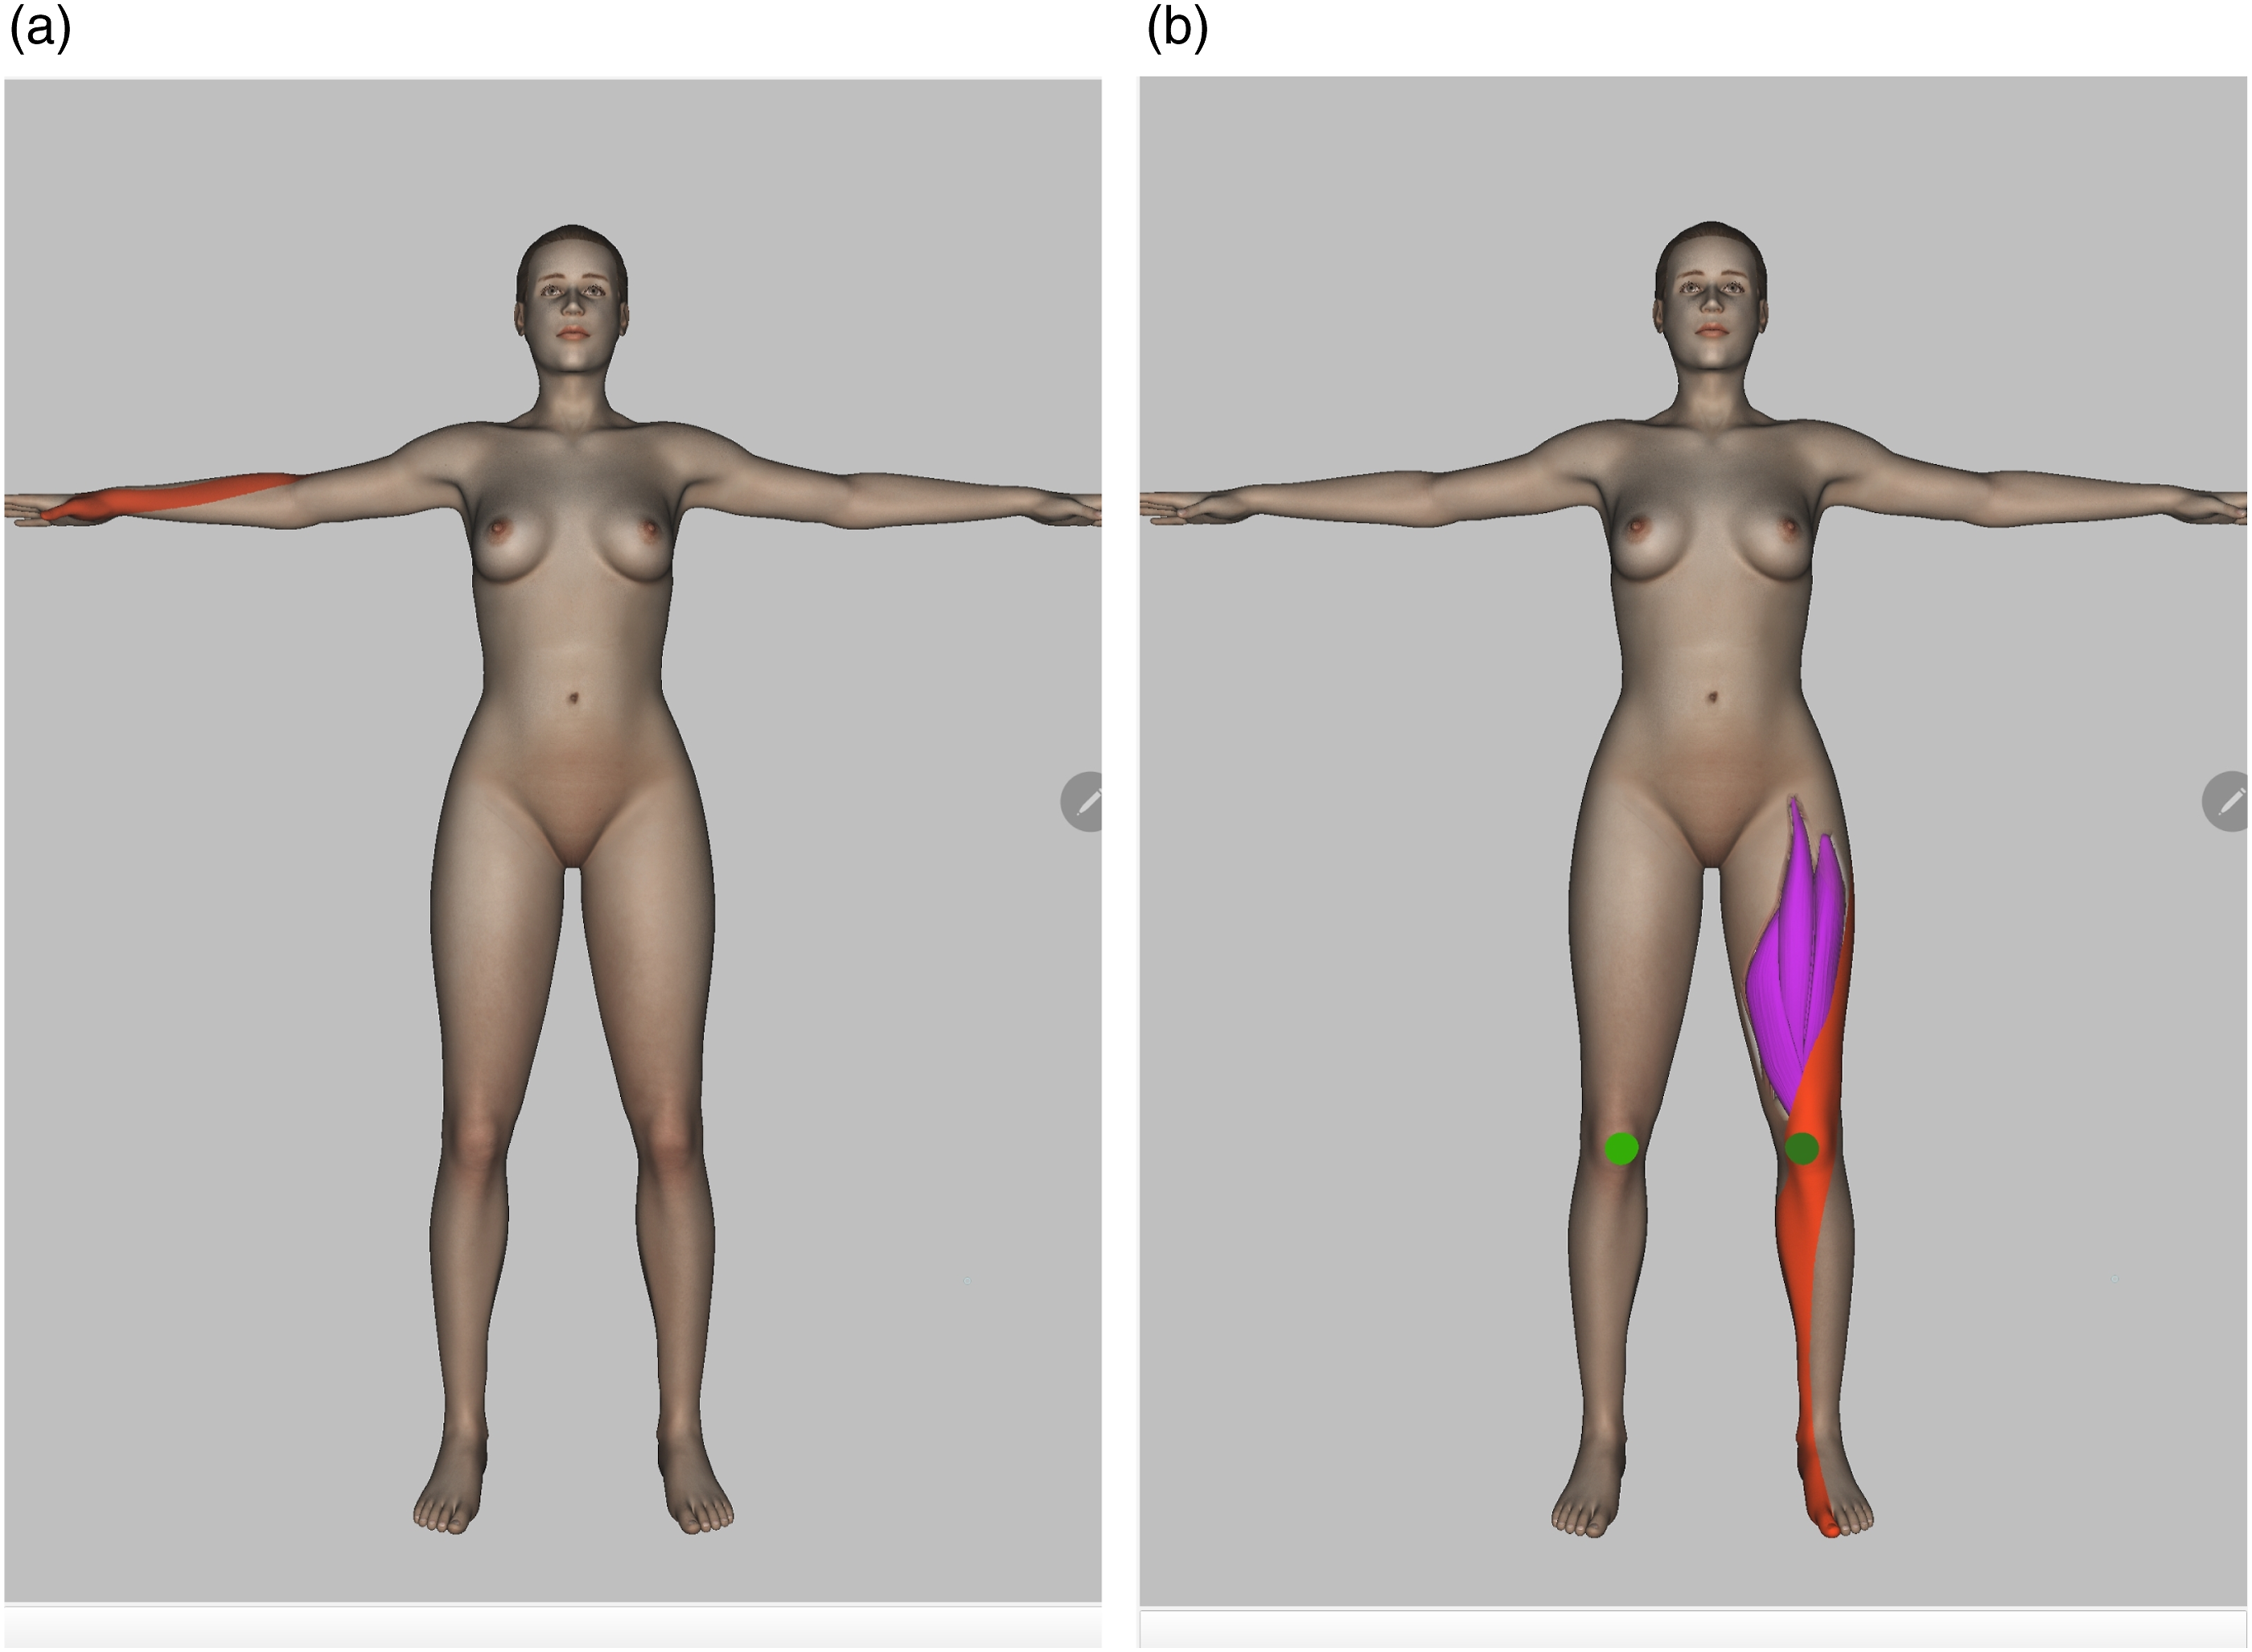
Task 2
The visualization of a neurological patient status (see Figures 3a and 3b) has to be assigned to the corresponding textual description of clinical symptoms. The participants need to choose the correct status out of seven real-life descriptions. The task can be seen as succession of two sub-tasks, in which different evaluation objectives are addressed. (a) The direct reading of visual attributes (see
Task 3
The last task is to read the healing progress (see
The questionnaire comprises three main sections:
QNR 1
The first section is dedicated to the evaluation of data in the usage-dependent view related to patients with spinal disc herniations (see Quantitative results of the questionnaire. 9a: the x-axis represents the symptom categories. 9b: the x-axis shows the prototype features to be assessed. 9c: the x-axis shows possible answers to the question: Would the proposed visualization concept yield the following benefits in your work routine?.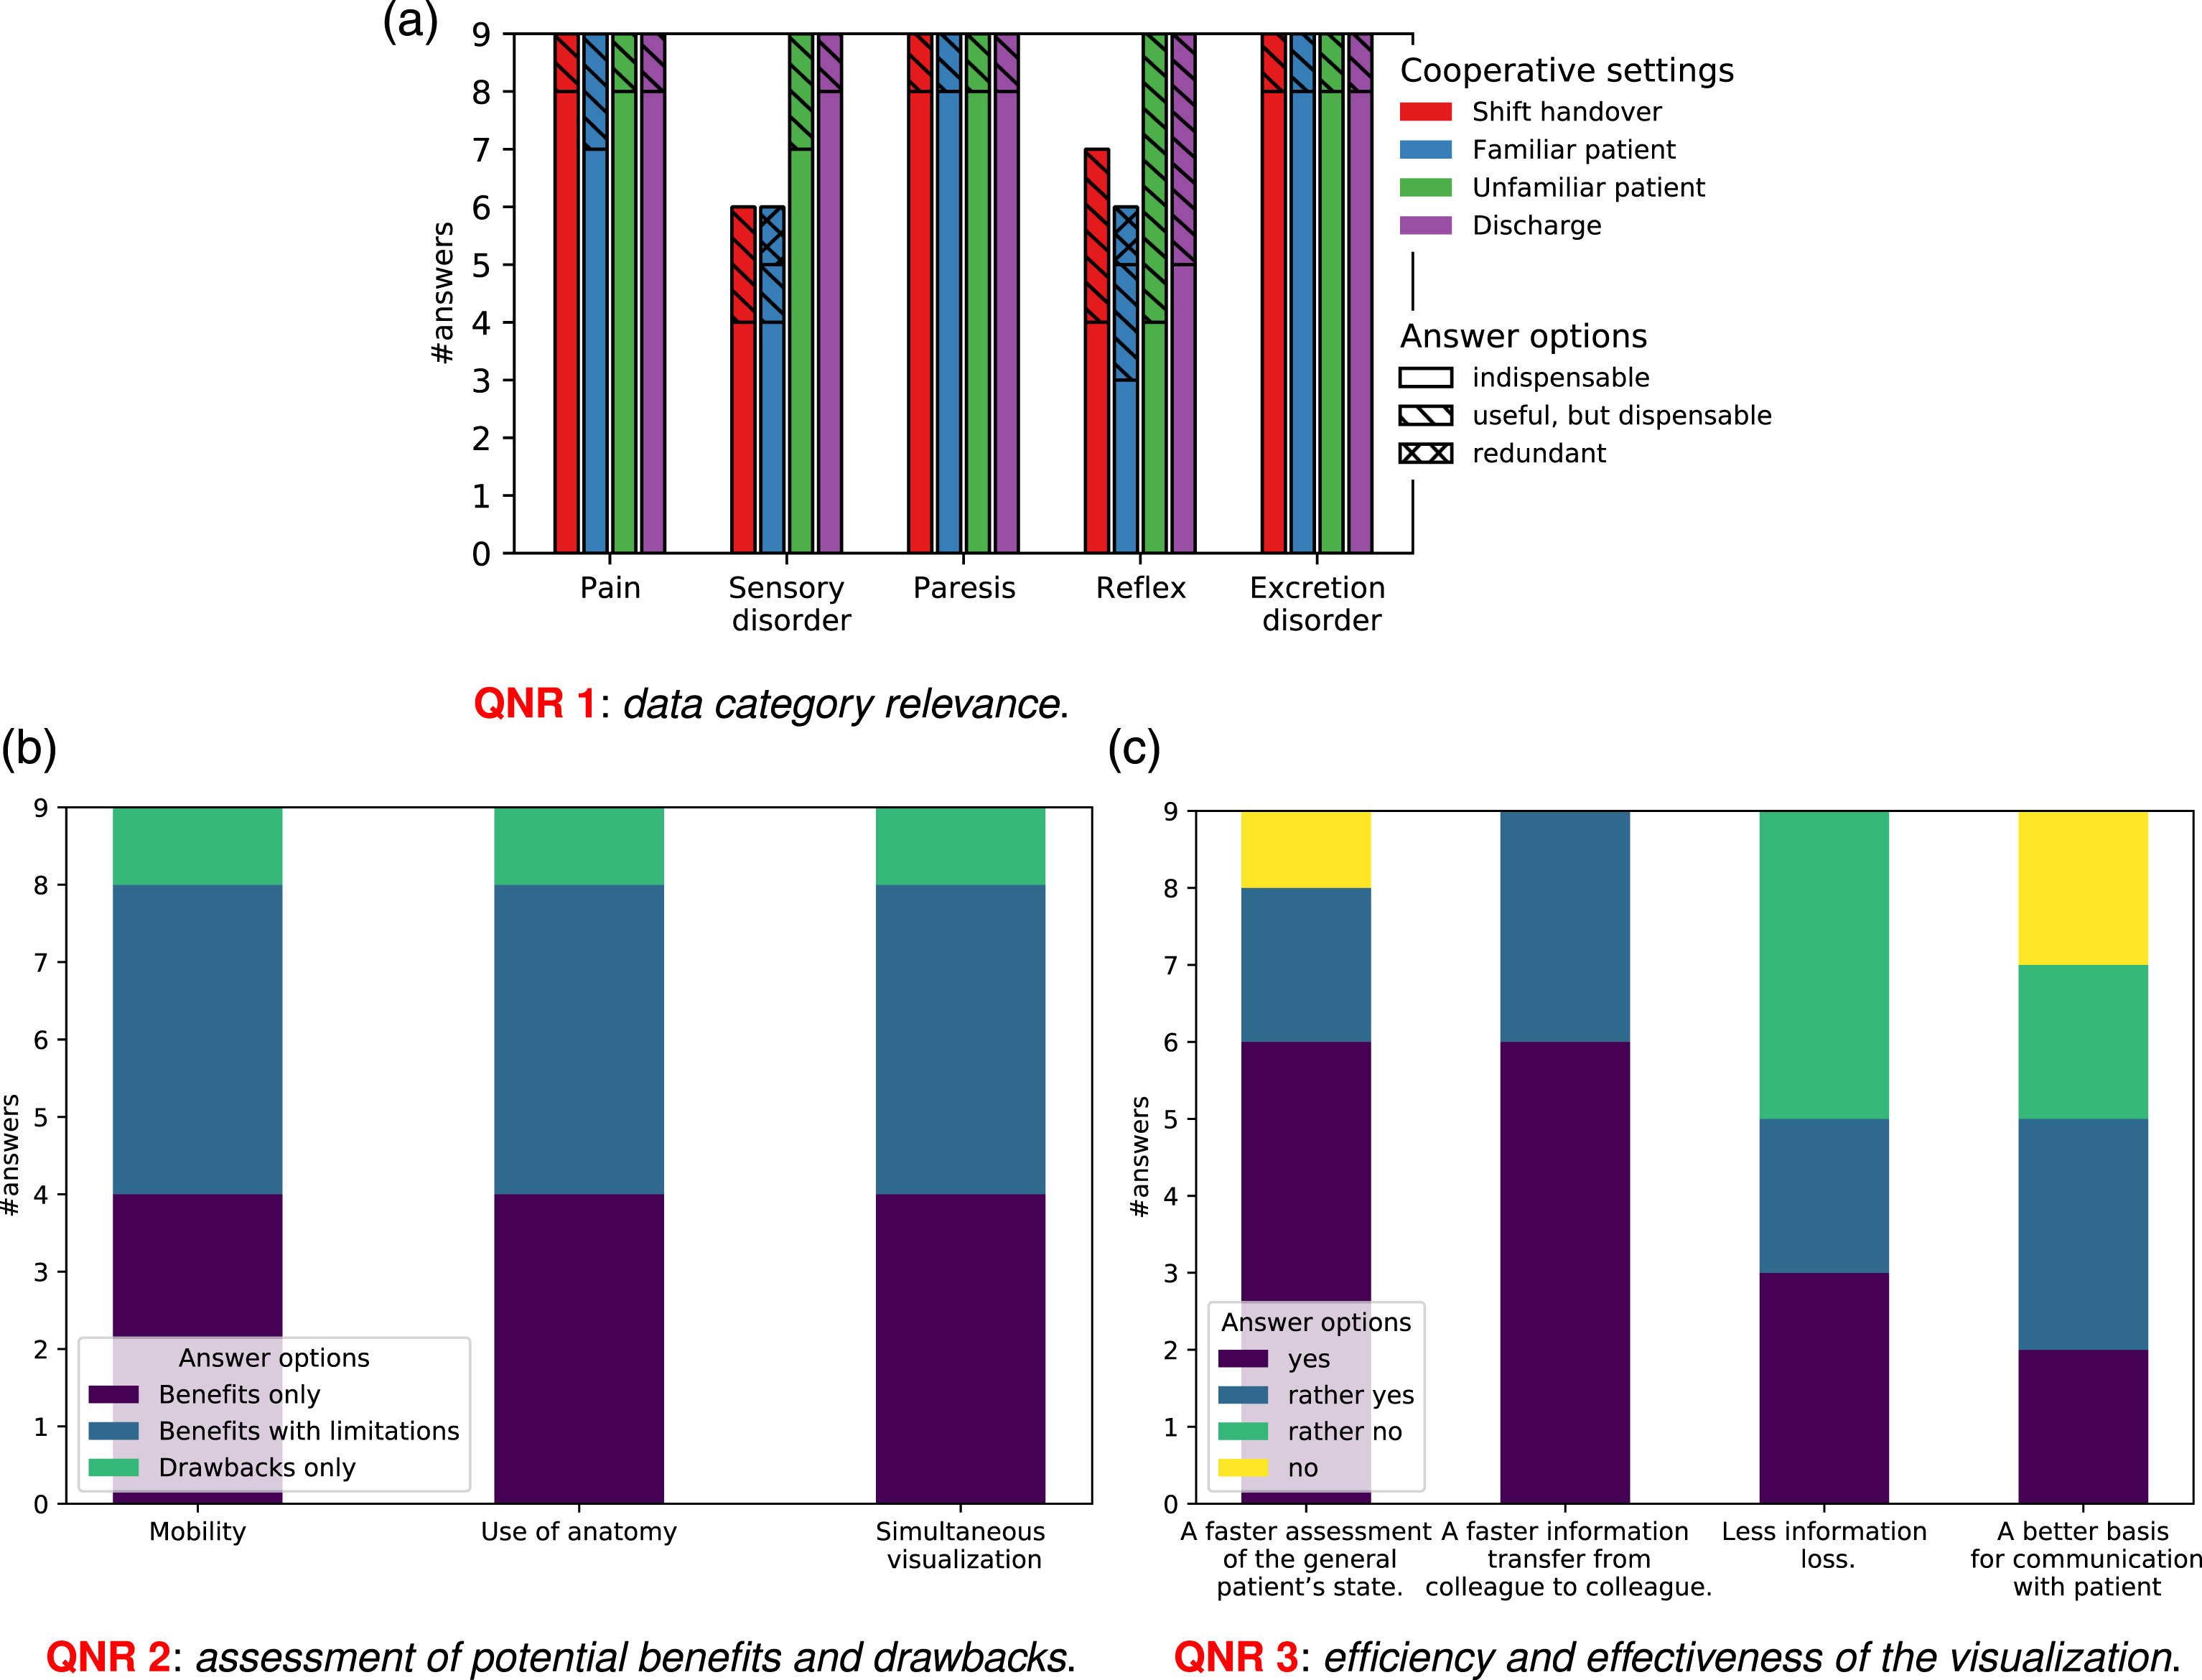
QNR 2
In the second section the physicians assess the usefulness of the anatomically integrated in-place visualization concept, including the simultaneous visualization of multiple data and the availability on a mobile device (see
QNR 3
The third section includes questions regarding the effectiveness (cf.
Procedure
The exact evaluation procedure is structured as follows. (1) After a brief introduction to the overall context, the participants are directly confronted with Task 1. (2) Afterwards the visual encoding legend (see Figure 4) is introduced and the participants are familiarized with the most important interaction features of the prototype. (3) Next, the physicians have to perform (4) Finally, the participants have to reflect on the practical experience answering the questionnaire, i.e.,
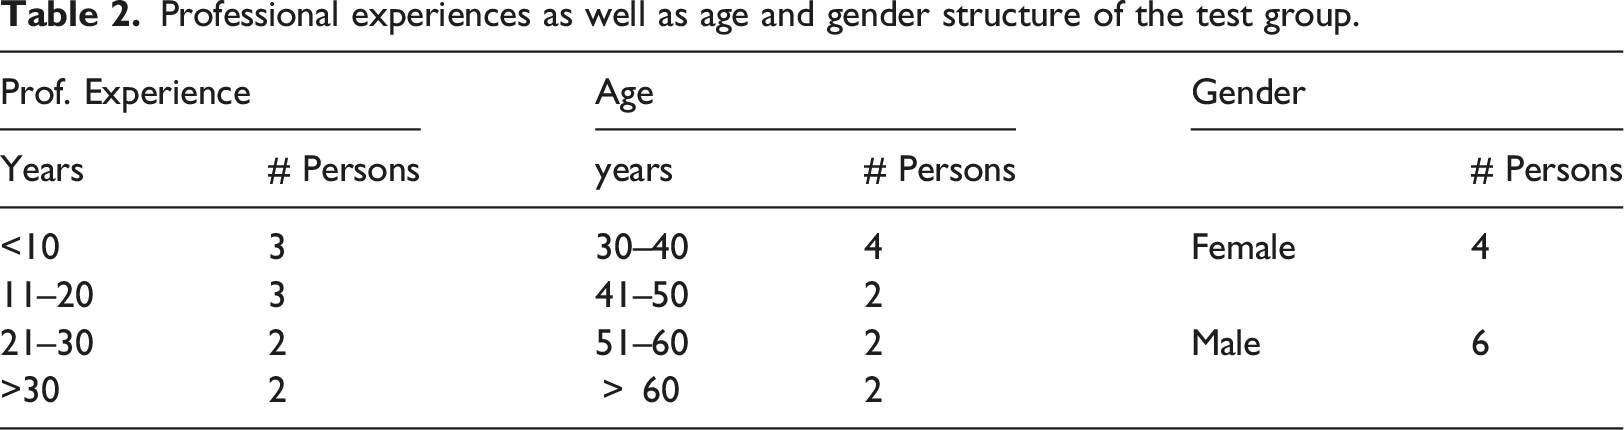
Professional experiences as well as age and gender structure of the test group.
Quantitative results
In the following we present an overview of the quantitative evaluation results, structured according to the aforementioned tasks and questions. The qualitative results and lessons learned are discussed in Sec. Discussions.
In
In
The healing progress in
The quantitative results regarding the questionnaires
Discussions
Evaluation findings
In the following we discuss the evaluation results according to the objectives determined in Sec. Objectives
Usefulness
The results of
The physicians appreciated the availability of “a lot of information at a glance” thanks to the synopsis-like visualization (cf.
Most physicians see a clear benefit in the mobility of the prototype (cf.
Effectiveness
The evaluation tasks demonstrates that the proposed visualization allows to effectively convey the neurological status of the patient (cf.
The prototype’s capability to reduce the loss of information in the hospital workflow (see Figure 9c) has been rated controversially. The participants who remain rather skeptical, explained their attitude by the fact that the information still can be lost before reaching the prototype, due to a deficient collection and input of raw data by the examining physician. Surprisingly, only few physicians assessed the prototype as advantageous for communication with patients (see Figure 9c). This, however, is due to the characteristics of the workflow itself, i.e., all physicians admitted that the proposed visualization would allow to explain diagnosis to the patient more easily, but this would stimulate further discussions with the patients, which is in conflict with the strongly limited time budgets.
Efficiency
Comparing with the currently used textual representation of the respective medical data, the physicians attest to the prototype’s potential for accelerating the transfer and evaluation of the patient’s status (see
Data selection
As follows from the rating in Figure 9a, all defined data categories are of high importance for assessment of neurological status of a patient with spinal disc herniation (cf.
Considerable variations occur in the category T-reflex only. The latter is caused by differences in the individual diagnostic methods: several participants actively apply reflex test during a clinical examination, whereas other physicians consider this test less relevant (cf. also the above discussion about effectiveness). In relation to the completeness of the view, six (6/9) physicians proposed further data categories to be added. While some of these proposals reflect individual variations in the diagnostic practices, referring to, for instance, additional pathological reflexes or pain qualities, other suggestions address the extended use of the prototype by integrating, for example, prior deceases or instability signs, required for decision making or surgery planning.
Limitations
Primarily, the prototype supports the evaluation of our core concept, i.e., anatomically integrated in-place visualization, and, thus, focuses on the visualization of usage-dependent medical data with anatomical reference, more precisely, neurological symptoms of spinal disc herniation, in the form of a synopsis, i.e., a consistent, simultaneous representation of multiple key data. The preference for using anatomy as a spatial reference and for the synoptic form of data visualization are major findings from our field studies, and their effectiveness, efficiency and acceptance by the physicians have been verified in our evaluation. Nevertheless, these visualization principles are potentially less useful in other medical application scopes, such as trend analysis of extensive medical data records, visualization of a single data category with a high domain cardinality, or the handling of medical data without anatomical reference. There is, however, the option to integrate other visualization approaches such as abstract timeline-based approaches into our visualization concept.
The use of human anatomy as spatial representation of abstract medical data, facilitating a more intuitive visualization semantic, at the same time implies some additional challenges with regard to visualization design. The general problem of mapping of a large amount of data to the limited number of visual attributes becomes in this case even more significant, because the spatial position and the form of anatomical structures are fixed. As discussed in Sec. The Visualization Concept, we address this problem with such concepts as data selection at different levels and alternating visualization. Nevertheless, by further increasing the number of patient data associated with same anatomical structure, the current solutions are not sufficient. Therefore, we aim to approach such complex situations in future work, e.g., by developing quantifiable textures that allow for encoding of a larger amount of quantified data.
Moreover, the on-body visualization can lead to configurations that are challenging in terms of visibility (cf. Visual Attributes). The proposed solutions are described in Sec. Further Visualization Concepts and Rendering Implementation Details. However, they potentially require additional user interaction, which can impair the information reading, as demonstrated in the practical tasks during the evaluation. In this respect, we consider the evaluation results as intermediate. A more substantial evaluation of the efficiency of user interaction mechanisms requires a greater familiarity of physicians with the prototype.
Finally, the current prototype does not allow for a personal adaptation to individual variations in diagnostic practices (see Sec. Evaluation findings). This suggests to introduce some personalization options by the view definition, on top of the core data categories.
Conclusion and future work
In this paper we presented a novel concept for anatomically integrated in-place visualization of medical data. The concept is designed in accordance with the requirements arising from specific tasks in cooperative clinical workflow, namely conveying of cooperation relevant patient data between colleagues, and it aims at closing the existing gap in current visualization approaches. Our approach allows for a spatially integrated comprehensive visualization of medical data, such as clinical symptoms, on a 3D human avatar using their inherent references to affected anatomical structures and an appropriate visual encoding. Preselecting patient data as a function of their relevance in the given clinical usage context, i.e., view, provides an at-a-glance synopsis of relevant information to physicians.
The evaluation of the prototypical implementation of the visualization concept by a group of neurosurgeons revealed positive feedback, in particular concerning the use of anatomy as spatial representation of data and the potential speed-up of information assessment. The current prototype covers the application scenarios in the context of distributed clinical cooperation related to the diagnosis of spinal disc herniation. Still, having a sufficient level of abstraction, the visualization concept is also transferable to other cooperative tasks and diagnoses, where a) data with anatomical reference are used, and b) a quick patient status overview is beneficial.
For a better integration in the existing workflow, each specific implementation would require field studies and participation of medical experts in the design process, particularly in regard to selection of task-specific medical data and intuitive visual encoding. In the next project phase, we plan to extend the prototype, aiming at the cooperation among nursing personnel on a neurosurgical ward, which, even though working with the same patients as the physicians, use different patient data to accomplish their tasks. An example of relevant data with anatomical reference in this context is information about the healing state of surgical wounds.
At the same time, the evaluation revealed some limitations of the current solution in the situations where the target anatomical structures are not sufficiently distinguishable without user interaction.
Beyond the extension of our prototype to further clinical usage contexts, we intend to address several of the issues that have arisen in the evaluation, such as the flexibility to adapt to individual professional procedures and the problem in distinguishing adjacent anatomical structures.
Footnotes
Acknowledgements
The authors would like to thank the medical staff at the neurosurgery department of the Diakonie Hospital Jung-Stilling in Siegen, Germany, for their willingness and engagement in our field and user studies.
Declaration of Conflicting Interests
The author(s) declared no potential conflicts of interest with respect to the research, authorship, and/or publication of this article.
Funding
The author(s) disclosed receipt of the following financial support for the research, authorship, and/or publication of this article: The work is funded by the Deutsche Forschungsgemeinschaft (DFG, German Research Foundation) – Project-ID 262513311 – SFB 1187, sub-project A06 “Visual integrated medical cooperation”.
Ethic Statements
This work is covered by the approval ER 14 2019 of the ethic council of the University of Siegen.
Disclose statements
This study used only fully anonymized or simulated patient data; thus, no patient’s informed consent was required. All physicians, participated in the evaluation, provided a written informed consent.