
Abstract
Chronic obstructive pulmonary disease is a heterogeneous disease. In this retrospective study, we hypothesize that it is possible to identify clinically relevant phenotypes by applying clustering methods to electronic medical records. We included all the patients >40 years with a diagnosis of chronic obstructive pulmonary disease admitted to the University of New Mexico Hospital between 1 January 2011 and 1 May 2014. We collected admissions, demographics, comorbidities, severity markers and treatments. A total of 3144 patients met the inclusion criteria: 46 percent were >65 years and 52 percent were males. The median Charlson score was 2 (interquartile range: 1–4) and the most frequent comorbidities were depression (36%), congestive heart failure (25%), obesity (19%), cancer (19%) and mild liver disease (18%). Using the sphere exclusion method, nine clusters were obtained: depression–chronic obstructive pulmonary disease, coronary artery disease–chronic obstructive pulmonary disease, cerebrovascular disease–chronic obstructive pulmonary disease, malignancy–chronic obstructive pulmonary disease, advanced malignancy–chronic obstructive pulmonary disease, diabetes mellitus–chronic kidney disease–chronic obstructive pulmonary disease, young age–few comorbidities–high readmission rates–chronic obstructive pulmonary disease, atopy–chronic obstructive pulmonary disease, and advanced disease–chronic obstructive pulmonary disease. These clusters will need to be validated prospectively.
Introduction
Chronic obstructive pulmonary disease (COPD) is a heterogeneous disease characterized by persistent airflow limitation. It is caused by the inhalation of cigarette smoke and other noxious particles and gases. Mortality rates are 40.8 per 100,000 United States inhabitants every year, and as of 2010, chronic respiratory diseases were the fourth leading cause of death in the United States and are projected to be the third by 2020.1,2
Until recently, international guidelines were basing specific treatment recommendations solely on airway obstruction, quality of life, number of exacerbations and exercise capacity oversimplifying in practice a very heterogeneous group of patients. This approach has resulted in improved symptoms and decreased number of COPD exacerbations, but its impact on survival has been disappointing. 1 Main causes of death in patients with respiratory conditions are related to cardiovascular disease and cancer3,4 with other comorbidities also playing an important role. 5 Therefore, in its latest revision, the Global Initiative for Obstructive Lung Disease started providing guidance for the management of common comorbidities. However, their recommendations are limited by the lack of disease-specific outcome studies. 1
Several studies have attempted to capture the heterogeneity of COPD patients using clustering techniques in order to describe phenotypes, provide more personalized therapies and pencil possible pathophysiology links.6–13 However, most of them have had restrictive inclusion criteria, small sample sizes, have relied on highly specialized measurements and have rarely included United States subjects. The motivation of our study is to fill the gap left by previous similar studies by adding clinically relevant COPD phenotype categories 14 using cluster analyses on readily available electronic medical record data. This can constitute the first step toward stratified treatment in patients with COPD. 15
Materials and methods
Study location and patient population
This retrospective analysis included all the patients older than 40 years, admitted to the University of New Mexico Hospital, a 580-bed University tertiary hospital, between 1 January 2011 and 1 May 2014 and carrying a diagnosis of COPD (ICD9 codes: 490, 491, 492 or 496), regardless of their primary admission diagnosis. 16
This study was conducted in accordance with the amended Declaration of Helsinki. The University of New Mexico Health Science Center review board approved the protocol and waived the need for informed consent, protocol number: 14-312.
Study design and data collection
We used i2b2, a de-identified replica of our hospital medical records system that includes data on diagnoses, procedures, prescriptions, hospital admissions and laboratory results. 17
Our data collection included the following: demographics, comorbidities included in Charlson’s comorbidity index, presence of atopy, obesity, number of admissions, prescriptions for inhalers grouped as short acting beta-agonist, long-acting beta-agonist, anticholinergics, steroids and their combinations, prescriptions for oral steroids, beta-blockers and statins. We collected comorbidities according to previously validated methods. 18 I2b2 does not include pulmonary function tests. To capture the severity of disease, we included weight loss 19 and elevated plasma bicarbonate 20 among the variables collected. All the variables, including age (40–65 years and >65 years) and number of admissions (one admission and ≥two admissions), were coded as binary for the analysis. The denominator for the number of admissions was the duration of the study.
Data analysis
Cluster analysis is a set of methodologies that group objects (e.g. patients) based on their characteristics. We used the sphere exclusion method with applications in cheminformatics, bioinformatics and pattern recognition.21,22 It is a disjoint, similarity-based method; that is, a patient can belong to only one cluster, and the measure used for grouping is similarity. In a multidimensional space with as many dimensions as variables, a distance metric between individuals is dissimilarity, which is complementary to similarity (1: similarity). By definition, similarity can have a value between 0 if all the variables are different and 1 if they are equal.
In sphere exclusion, the only input needed from the analyst is a similarity threshold. The algorithm first computes the similarity between all individuals. It then chooses the individual with the most “neighbors” within the specified similarity cut-off. These individuals form the first cluster are excluded from further analysis. The process is then repeated iteratively until the only individuals left are singletons—individuals without neighbors.21–23
To choose the optimal similarity threshold, the clustering algorithm is run over a range of similarity thresholds without excluding individuals at any step. In this case, each subject can belong to more than one cluster. For this data set, we found the optimal balance between number of clusters and clustering overlap to be at similarity threshold of 0.62. 23 Plotting the Dunn index 24 and correlation coefficient 25 for different similarity thresholds provided consistent results (Figure 1).
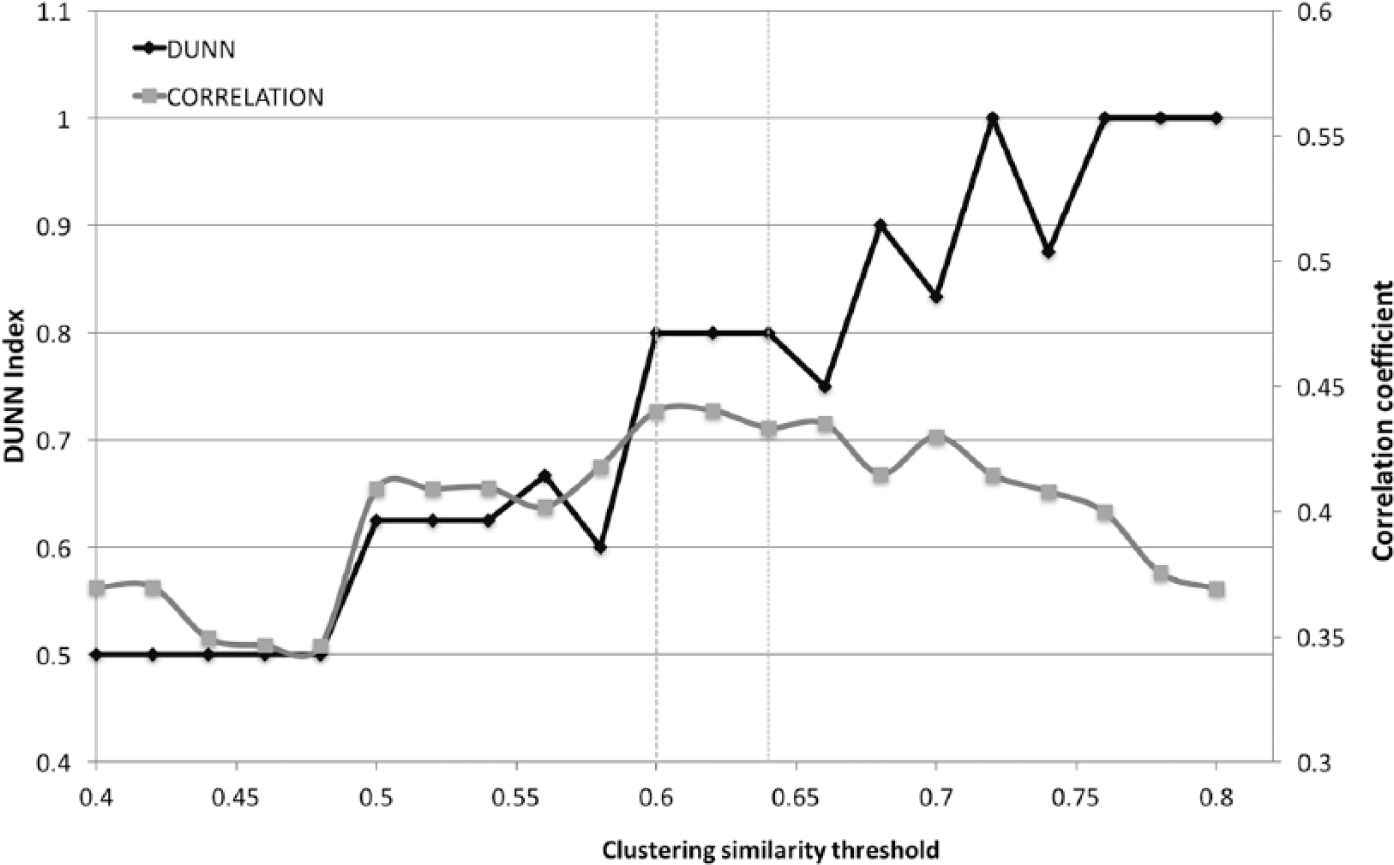
Dunn index and clustering coefficient against similarity.
All the collected variables were candidates for the clustering algorithm. Number of admissions was also included given the clinical relevance of the frequent exacerbation phenotype. 1
After applying factor analysis to exclude inter-correlated variables, 24 common variables (out of 40 candidate variables) were selected with 10 latent variables, p = 0.54 (H0 model with 10 latent variables). The relevant variables were as follows: age, ICD9-CM codes 496 and 490, congestive heart failure, cerebrovascular disease, myocardial infarction, diabetes mellitus (DM) with complications, chronic kidney disease (CKD), obesity, depression, dementia, severe liver disease, plegias, rheumatologic disease, atopy, diagnosis of cancer, prescription for anticholinergic bronchodilators, prescription for fluticasone–salmeterol, prescription for albuterol–ipratropium, prescription for non-cardio selective beta-blocker, prescription for salmeterol, bicarbonate level >30 mEq/L, weight loss and number of admissions ≥2 (Appendix 1).
Analyses were computed using STATA/SE 13.1 (StataCorp LP, College Station, TX, USA) and MATLAB with the statistical toolbox installed (MATLAB version 8.3.0.532 (R2014a), Natick, MA, USA: The MathWorks Inc., 2014).
Results
A total of 3144 patients met the inclusion criteria. Of these, 1436 (46%) were older than 65 years, 1636 (52%) were males and 1745 (55.5%) had the ICD9 code 496. The median Charlson score was 2 (interquartile range (IQR): 1–4) With the most frequent comorbidities being depression (36%), congestive heart failure (25%), obesity (19%), cancer (19%) and mild liver disease (18%) (Table 1).
Demographics and general descriptors.
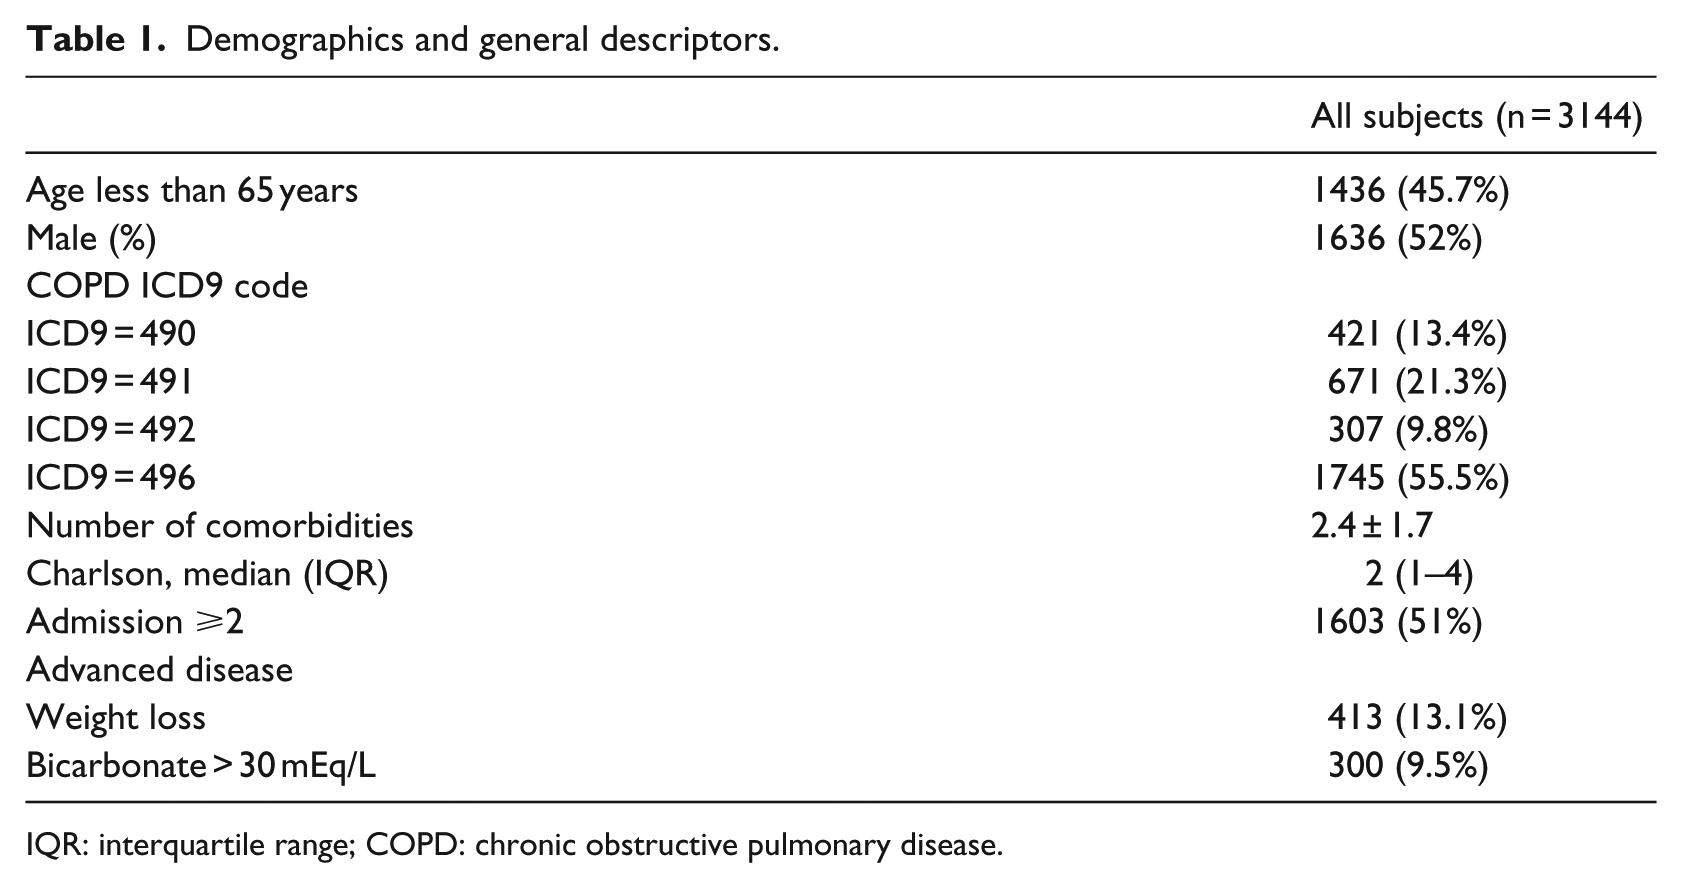
IQR: interquartile range; COPD: chronic obstructive pulmonary disease.
We obtained nine clusters with 189 patients remaining as outliers (Figure 2). The characteristics of each one of the clusters as compared to the rest are detailed below.
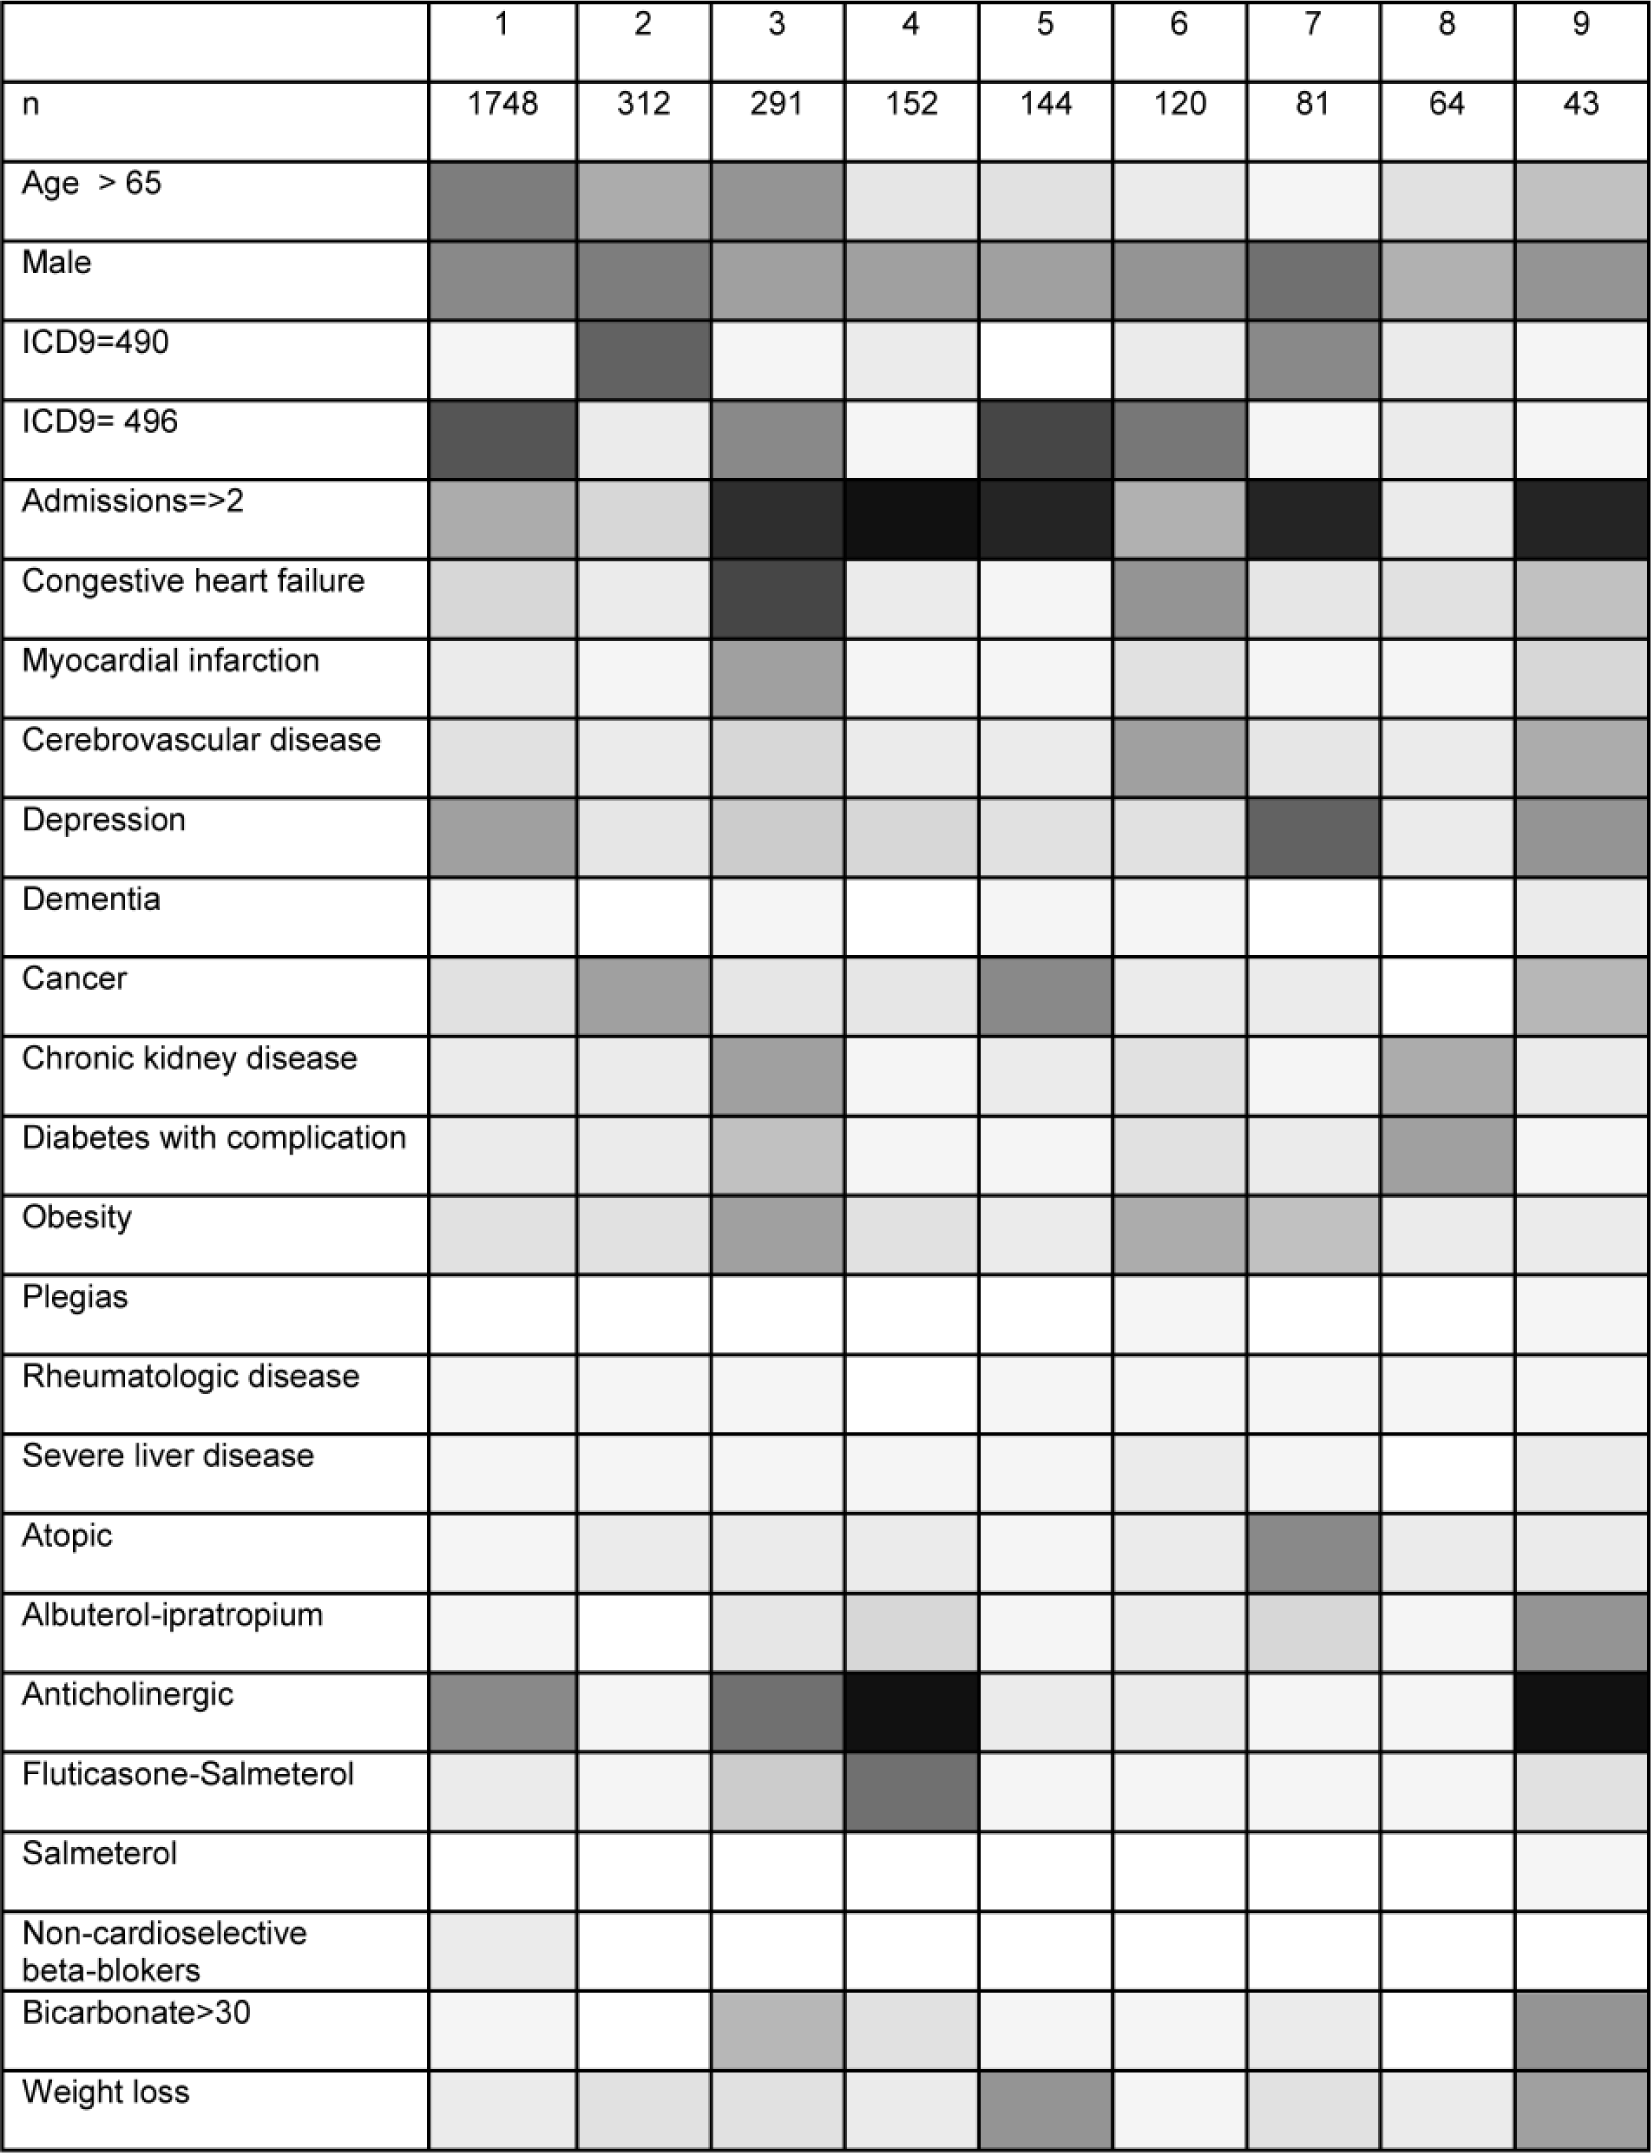
Grayscale heat map with the results of cluster analysis (white = 0%, black = 100%). Clusters are represented in the horizontal axis: 1: depression–COPD, 2: malignancy–COPD, 3: coronary artery disease–COPD, 4: young age–low comorbidity–high readmission–COPD, 5: advanced malignancy–COPD, 6: cerebrovascular disease–COPD, 7: atopy–COPD, 8: DM–CKD–COPD and 9: advanced disease–COPD.
The largest cluster, cluster 1 contains 1748 patients and is characterized by a large proportion of patients older than 65 years and by depression. The patients have relatively few comorbidities, without a clear pattern and a Charlson score of 2 (IQR: 1–3).
We found two “malignancy” clusters: cluster 2 with 312 patients, few comorbidities and low number of readmissions and cluster 5 with 144 patients, signs of advanced disease and frequent readmissions.
We also identified two “cardiovascular” clusters: cluster 3 with 291 patients with a significant proportion of patients older than 65 years and predominantly coronary artery disease and congestive heart failure and Cluster 6, respectively, with 120 patients, higher proportion of patients younger than 65 years and predominantly cerebrovascular disease.
The remaining clusters were cluster 4 with 152 patients, most of them younger than 65 years, with few comorbidities, the highest number of prescriptions for bronchodilators and also with frequent readmissions. Cluster 7 includes 81 patients, the majority younger than 65 years, with asthma/atopy and many readmissions. Cluster 8 has 64 patients, younger than 65 years, who suffer from CKD or diabetes and with few readmissions. Cluster 9 with 41 patients includes patients with a high prevalence of signs of advanced disease and frequent readmissions. A classification rule consisting of a series of decisions that replicates the clustering algorithm can be found in Appendix 1 and Tables 3 and 4.
Discussion
In this study, we showed that patients with a diagnosis of COPD admitted to our hospital can be divided into clinically relevant phenotypes. Based on readily available data and using cluster analysis methodology, we obtained nine phenotypes, with only 6 percent of the patients as outliers. We also derived a classification rule for use in future validation and clinical practice. Most of our phenotypes confirm few previously known phenotypes obtained using different methodologies (Figure 2, Table 5). Given our sample size and more inclusive criteria, we observed new phenotype categories not previously described that may further stratify the COPD patient population.
The development of this classification scheme for patients with COPD can be used to generate new phenotype-specific outcomes and interventions.
The first and largest cluster describes the COPD-depression phenotype. Due to similar symptoms, regular screening tools that differentiate depression in COPD have limited validity. 26 In pulmonary practices, the prevalence of depression in COPD patients is estimated at 40 percent, and this increases with the severity of ventilatory obstruction as measured by the forced expiratory volume in first second (FEV1). 27 The relationship between depression and COPD is complex, as depression can further impact the social isolation, mobility impairment and quality of life in COPD patients. There are data suggesting that COPD precedes depression. In a prospective cohort study, the relative risk for developing depression 2 years after a new diagnosis of COPD was estimated at 2.21 (95% confidence interval: 1.64–2.97). 28 It is also known that there is a primary association between depressive symptoms and smoking and that depression severely limits the effectiveness of any smoking cessation intervention. 28 Understanding the COPD, depression phenotype could help develop COPD-specific depression screening tools and evaluate the effectiveness of preventive and therapeutic strategies.
Very relevant from a clinical perspective are the COPD—cardiovascular disease phenotypes. One is dominated by cerebrovascular disease, while the other by coronary artery disease. Both phenotypes have different secondary prevention strategies and therapeutic needs making the distinction clinically relevant. 29 The strong association between COPD and cardiovascular disease has been observed using different methodologies. In the Lung Health Study, a prospective cohort, more than 30 percent of the deaths were related to cardiovascular disease. 4 In terms of chronology, members of our study group described trajectories of disease in a population wide data registry with 6.2 million individuals. They found that all the trajectories starting with a diagnosis of atherosclerosis were followed by the diagnosis of COPD supporting a pathophysiological link and a temporal relationship. 30 Five other studies using either only comorbidities or more complex data sets have each identified at least one cluster characterized by the presence of cardiovascular disease.6–8,10,11 This pattern has generated a great interest in discovering the underlying pathophysiology that leads to COPD after onset of atherosclerosis, and so far, the common link is attributed to inflammation.
Another phenotype previously described in the literature and confirmed in our cohort is the COPD–asthma overlap. Using a different set of variables, at least three studies that employed cluster analysis identified this phenotype.6,12,31 COPD–asthma phenotype is of special interest as it highlights a subpopulation of patients usually excluded from therapeutic clinical trials, which have a poor quality of life and consume a disproportionate amount of healthcare resources. 1
Our analysis also revealed five phenotypes, not previously described using cluster analysis, and we feel these phenotypes are very common and relevant in clinical practice. All of them highlight the disconnection between most COPD studies and the real-life COPD spectrum seen in hospital wards and outpatient clinics. One of the malignancy clusters incorporates patients with signs of more advanced disease (number 5), whereas cluster number 2 includes patients who rarely necessitate hospital readmission despite a diagnosis of cancer. The link between malignancy and COPD has been well established, expanding over lung cancers but also extra-pulmonary cancers.3,4 In the Danish health registry, the overall risk for cancer was elevated in COPD, independent of comorbidities suggesting a different pathogenesis than, for example, cardiovascular disease. 32 Regarding the biological basis for these malignancy phenotypes, it has been noted that smokers overexpress repair genes and oncogenes and underexpress tumor suppression genes. 33 Although the expression of repair genes returns to normal several years after smoking cessation, oncogenes and tumor suppression genes continue to be altered decades later. To what extent the differential expression of these genes is deranged may determine which individuals develop cancer versus other comorbidities. 34 From a therapeutic perspective, COPD patients with malignancies tend to receive limited treatment. Grouping them into a more homogeneous phenotype and access to care in integrated clinics may lead to better outcomes. This model of healthcare delivery has been successfully used in other pulmonary diseases such as cystic fibrosis. 35
A third phenotype of patients not previously reported in the literature is the chronic kidney disease–diabetes mellitus (CKD-DM)–COPD cluster. We note the low readmission rates of this phenotype. Interestingly, in previous studies, both CKD and DM have been associated with hospital readmissions in patients admitted with any diagnosis, but this does not hold true for COPD patients. 36 To which extent this characteristic is attributable to their model of care or to common underlying mechanism of disease is unknown. For example, DM targets the lung with reduction in carbon monoxide diffusion capacity, FEV1 and forced vital capacity (FVC) that show a dose response effect to fasting plasma glucose. 37 Furthermore, recently, a study reported improved asthma control in patients treated with thiazolidinediones. 38
Another new phenotype described in our cohort is the “advanced COPD phenotype,” represented by cluster 9. These patients who have more advanced disease based on the frequency of weight loss and elevated serum bicarbonate are also readmitted frequently. 19 One potential intervention would be initiation of end-of-life discussions especially if higher mortality is associated with this phenotype.
Finally, cluster number 4 can intuitively be labeled as “COPD Resistant to Treatment” or “COPD Non-Compliant.”39,40 Although these patients receive the highest number of prescriptions, they accrue very frequent readmissions. Since information on compliance was not available in our database, we were unable to differentiate between the two possible explanations.
Eight other studies have used similar clustering techniques to group COPD patients into phenotypes. They differ in the number and selection of individuals, the choice and number of variables and in the clustering techniques utilized. Choices at each of these levels can be expected to influence the results. This is reflected in Table 2 with each study describing phenotypes according to the variables selected for analysis.
Previous articles with >100 patients using cluster analysis and phenotypes as described by the authors.
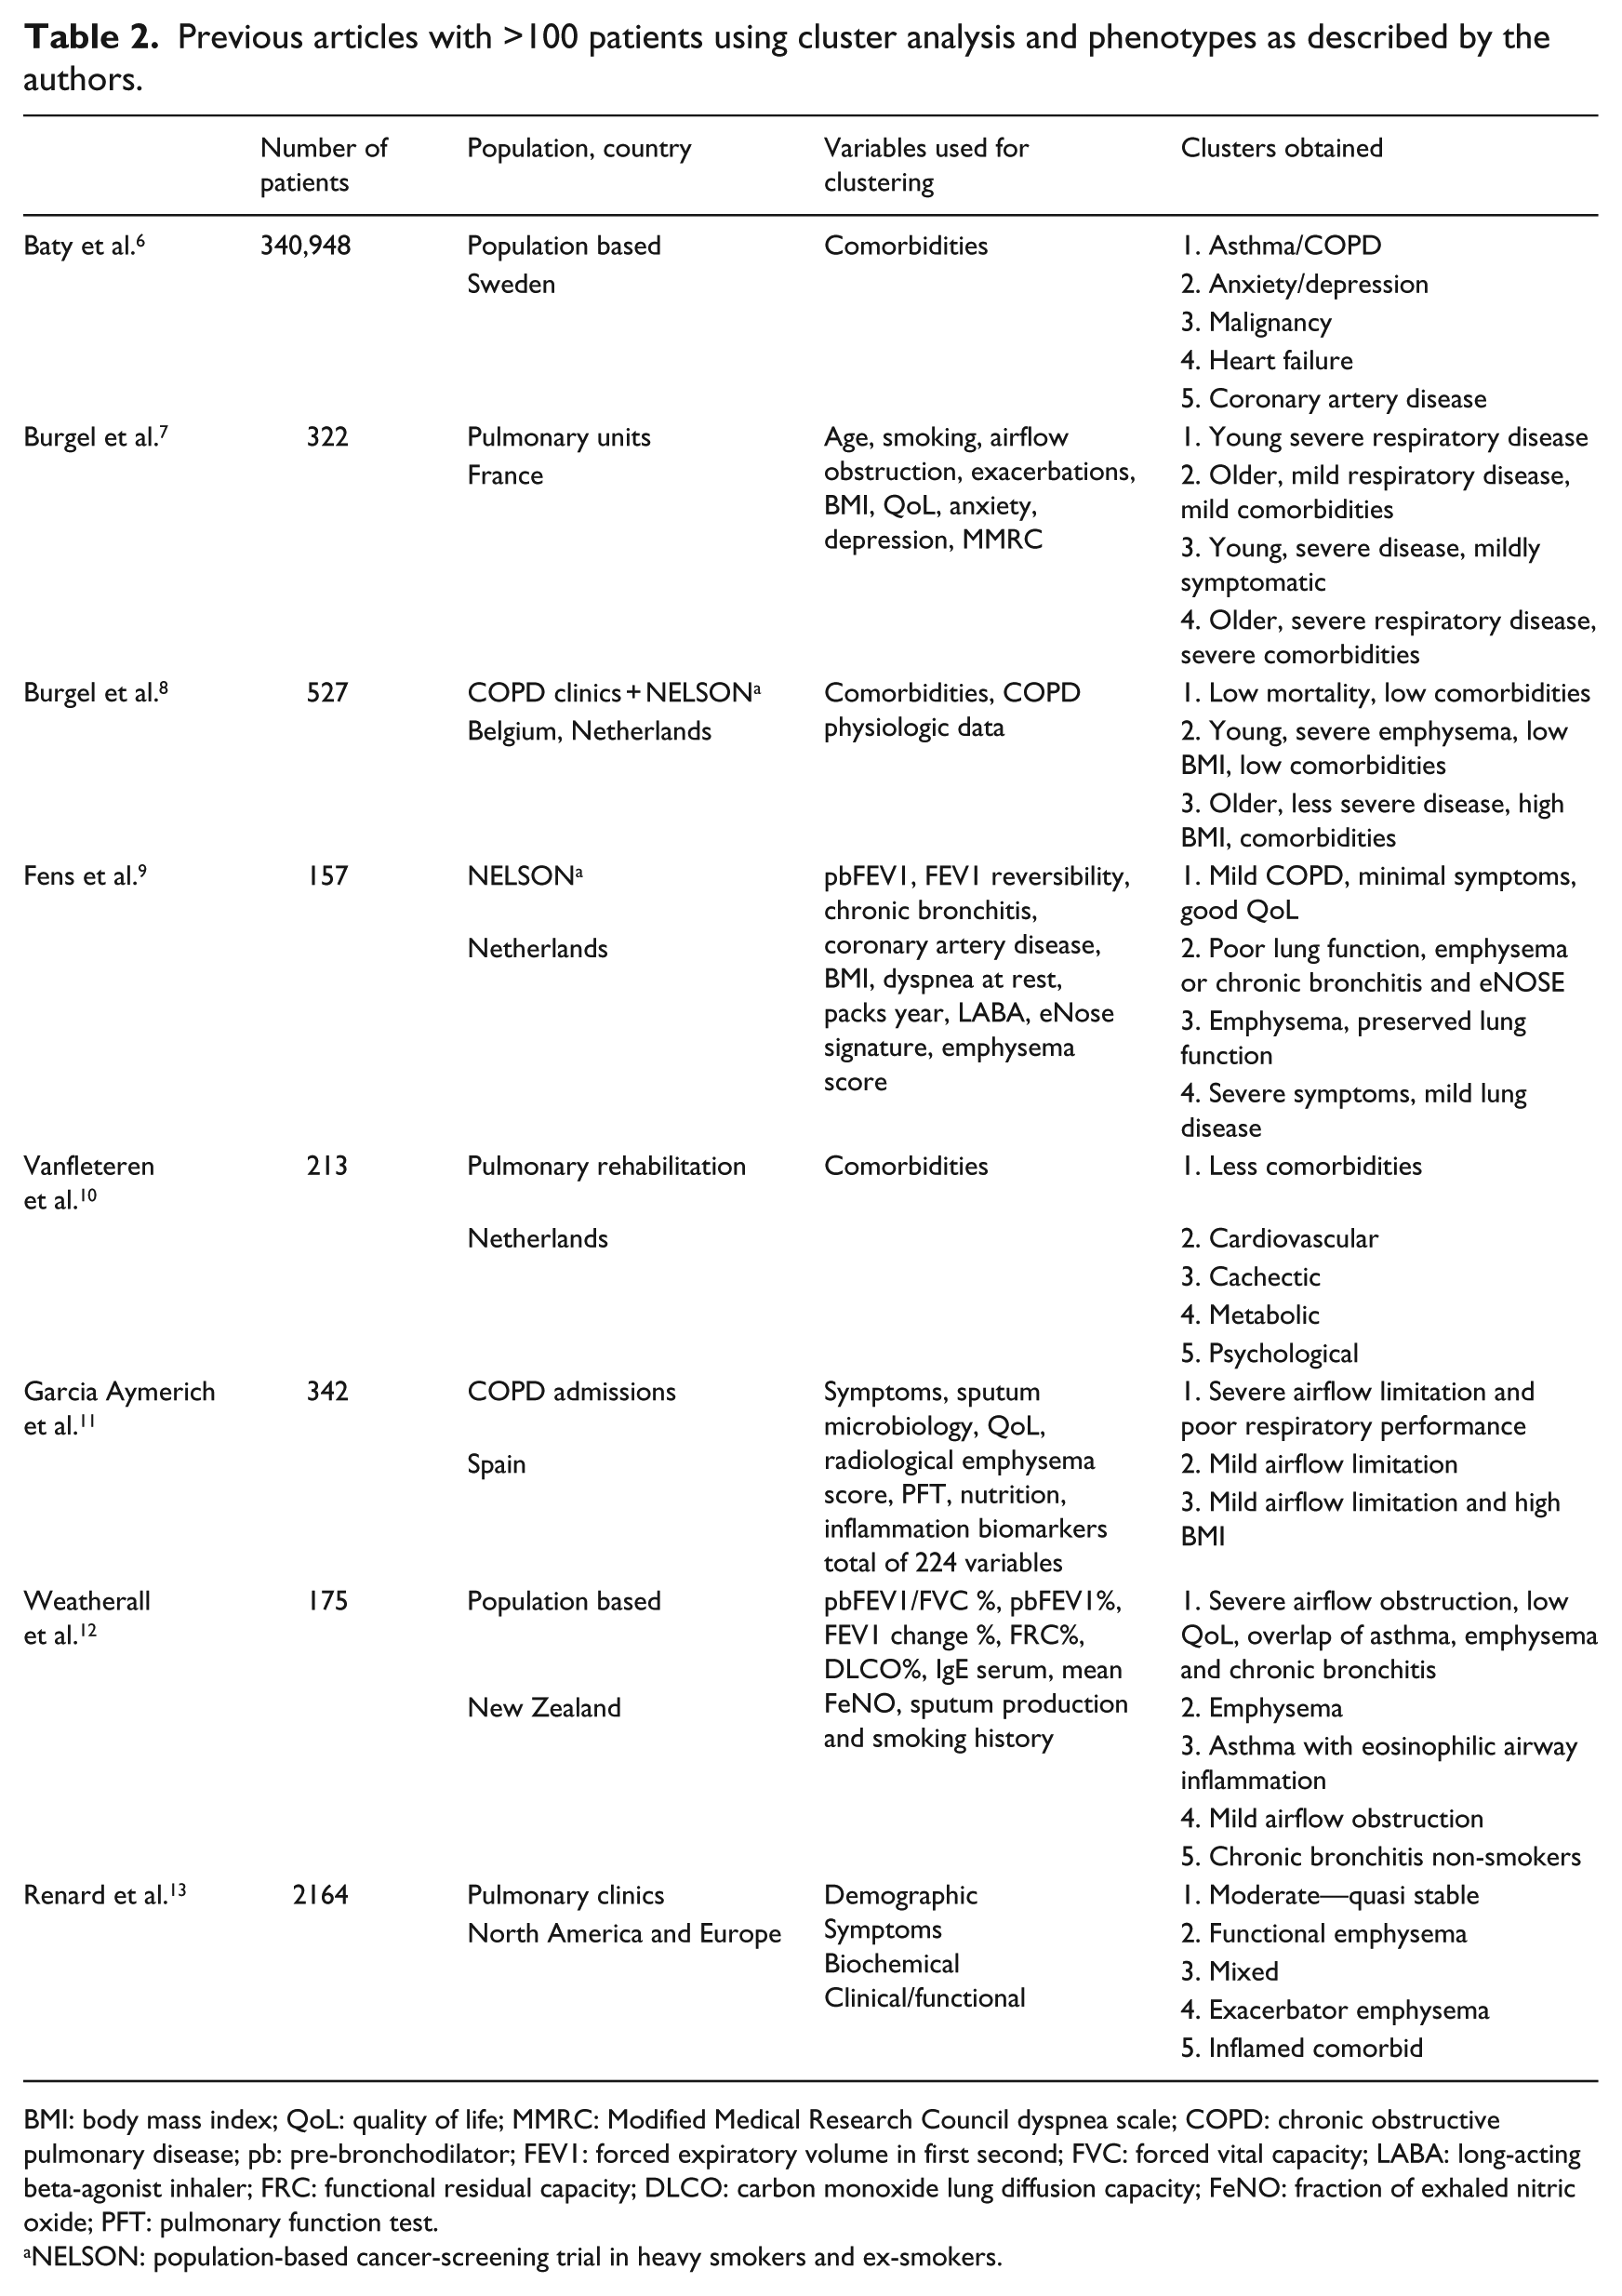
BMI: body mass index; QoL: quality of life; MMRC: Modified Medical Research Council dyspnea scale; COPD: chronic obstructive pulmonary disease; pb: pre-bronchodilator; FEV1: forced expiratory volume in first second; FVC: forced vital capacity; LABA: long-acting beta-agonist inhaler; FRC: functional residual capacity; DLCO: carbon monoxide lung diffusion capacity; FeNO: fraction of exhaled nitric oxide; PFT: pulmonary function test.
NELSON: population-based cancer-screening trial in heavy smokers and ex-smokers.
Clustering techniques are most valuable when the phenotypes obtained describe the etiology, pathogenesis or clinical characteristics of the patients. Studies clustering detailed physiologic data and biomarkers with clinical characteristics may be better suited to investigate the pathogenesis and etiology of the different phenotypes, for example, Fens et al., 9 chronic bronchitis and inflammatory eNose profile. Studies based on readily available data like ours6,10 can also generate hypotheses about pathogenesis as detailed above, but more importantly, they can describe phenotypes outside of the research setting. They can help organize care and generate clinical research with phenotype-specific interventions. 41 For example, psycho-social interventions for the “Non-Compliant” phenotype or palliative care options for the advanced disease phenotype.
Our results are similar to the studies that used only comorbidities for clustering.6,10 The larger number of clusters found in our study can be explained by its sample size, our inclusion criteria and the variable selection which also included severity of disease markers and medications. Baty et al. 6 described a malignancy cluster; we were able to detail further, describing two malignancy clusters, one with signs of advanced disease and frequent readmissions and one without.
Another pre-requisite to make phenotyping useful is providing the classification rules for use in future validation and clinical practice 42 (Appendix 1, Tables 3 and 4).
Previous cohort studies and industry-sponsored randomized controlled trials have had stringent enrollment criteria excluding many clinically relevant and common COPD subpopulations. One strength of our study was including all adult patients (>40 years) with a diagnosis of COPD. As stated above, these lax criteria have helped us to recognize a larger number of phenotypes than previous studies. This is also the largest US COPD population is analyzed with this methodology. 13
Another strength of our study is the use of the sphere exclusion method for clustering. It does not require a priori determination of the number of clusters, and using homogeneity measures to determine the optimal similarity threshold automatically (Figure 1) makes the clustering algorithm autonomous and minimizes the risk of bias.
Our study has several limitations. First, the proposed clusters rely on the available variables. 21 We lacked data on spirometry, 6-min walk test, mortality and quality of life questionnaires. In their absence, our ability to detect some clinically relevant phenotypes may have been limited; for example, the previously described upper lobe–predominant emphysema with poor exercise performance was not observed. 43 We also had to use alternative measures of severity of disease (sodium bicarbonate and weight loss), which may not apply to all the phenotypes. However, under normal clinical settings, such information is rarely available. In a recent report, only 32 percent of newly diagnosed COPD patients had undergone spirometry testing, 44 and thus, relying on these data to clinically classify patients beyond the pulmonary office is, as of today’s practice, of limited value. Furthermore, even in the absence of these variables, we were able to detect clinically relevant phenotypes with plausibly different underlying pathogenesis. Our methodology can only describe co-occurrence of diseases and not cause effect relationships.
Another limitation of the study is single center study design. People from New Mexico may have different distribution of risk factors than patients in other areas of the United States. They have a higher exposure to biomass fuels, and the Hispanic population has also been found to be particularly resistant to the development of this disease.45,46
The main impact of our study is the development of a classification scheme for patients with COPD that can be used to generate new phenotype-specific outcomes and interventions. While other studies have mainly focused on mortality and readmission rates, it is debatable whether these are the most or only relevant outcomes. For instance, two phenotypes can have the same mortality and hospitalization rate for very different reasons thus requiring different therapeutic approaches. Phenotype-specific outcomes such as time to myocardial infarction, depression recurrence or improved compliance along with mortality and readmission rates may offer an extra dimension to better differentiate between and within subpopulations of COPD patients.
Conclusion
Moving from generalized to stratified medicine, clustering studies are needed to both discover pathophysiology links and group patients with clinically similar phenotypes allowing for more personalized and integrated care. Our study confirms previous COPD phenotypes and adds new ones to better understand the interplay between COPD and comorbidities. The use of readily available data in defining our clusters makes this methodology appealing for validation and implementation at other centers.
Footnotes
Appendix 1
Declaration of conflicting interests
The author(s) declared no potential conflicts of interest with respect to the research, authorship and/or publication of this article.
Funding
The author(s) disclosed receipt of the following financial support for the research, authorship, and/or publication of this article: This study is supported by The University of New Mexico School of Medicine.