
Abstract
Whiteboards are a central tool at emergency departments. We investigate how the substitution of electronic for dry-erase whiteboards affects emergency department clinicians’ mental workload and distribution of their time. With the electronic whiteboard, physicians and nurses spend more of their time in the work areas where other clinicians are present and whiteboard information is permanently displayed, and less in the patient rooms. Main reasons for these changes appear to be that the electronic whiteboard facilitates better timeouts and handovers. Physicians and nurses are, however, in the patient rooms for longer periods at a time, suggesting a more focused patient contact. The physicians’ mental workload has increased during timeouts, whereas the nurses’ mental workload has decreased at the start of shifts when they form an overview of the emergency department. Finally, the secretaries, but neither physicians nor nurses, access whiteboard information on computers other than the permanent displays.
Keywords
Introduction
Emergency departments (EDs) receive large numbers of unscheduled, acute patients. The safe and competent treatment of these patients requires continual prioritization and reprioritization of the patients and of the allocation of clinicians to patients—to ensure that the most urgent patients are treated first and maintain the flow of patients through the ED.1,2 A central tool in managing the prioritization and flow of patients is the ED whiteboard,3–6 which provides selected information about the patients in the ED as well as those announced but not yet arrived. Presently, many EDs are in a process of replacing their dry-erase whiteboards with electronic whiteboards, which provide for distributing whiteboard information to multiple locations without repeated manual data entry, for extending the whiteboard with alarms and automatically updated fields, and for making the whiteboard a portal to other clinical information systems.4,7
In this study, we investigate the effect of electronic ED whiteboards on the time physicians and nurses spend with the patients versus with other clinicians and on the mental workload of the physicians and nurses. Our rationale for this focus is that opposite effects may be expected for both issues. On the one hand, distributed access to whiteboard information, including from patient rooms, provides for better knowledge among clinicians of when they can stay with their current patient and complete the patient record while with the patient and when they need to make themselves available for seeing a new patient as quickly as possible. This may enable clinicians to spend more time with the patients, a change that has been linked with improved treatment quality, 8 increased clinician satisfaction, 9 and increased patient satisfaction. 10 On the other hand, distributed access to whiteboards provides for improving the timeliness with which they are updated and, thereby, their importance to the communication and coordination among clinicians. 11 This may lead to spending more time with other clinicians because timeouts (during which the clinicians gather at the whiteboard to walk through the currently admitted patients to assess their condition and treatment) become more valuable and thereby longer. In addition, many clinicians gravitate toward the clinicians’ work areas to consult colleagues or make themselves available for consultation; 12 this tendency may be reinforced by improved access to information on the whiteboards in these work areas. Hertzum and Simonsen 12 report that nurses, but not physicians, spent more time with patients after the introduction of an electronic ED whiteboard, indicating possible differences across staff groups. Similarly, electronic ED whiteboards may be expected to have opposite effects on mental workload. Mental workload may decrease because electronic whiteboards have been found to improve clinicians’ overview, 6 improve communication, 11 and make work more efficient, 13 or mental workload may increase because electronic whiteboards have also been found to affect workflows negatively, 14 contain less information relevant to the coordination of patient treatment, 4 and make ED clinicians work more individually. 15 We aim to contribute to untangling these opposite expectations and mixed findings.
Our study takes place at a medium-sized hospital in Region Zealand, one of five health-care regions in Denmark. At this hospital, the ED clinicians’ distribution of their time was measured by tracking their location within the ED while dry-erase whiteboards were still in use and after electronic whiteboards had been in full-scale use for 4 months. Mental workload was measured during the same periods. The electronic whiteboard deployed at the ED is similar to dry-erase whiteboards in content and layout and thereby resembles those in previous studies of electronic ED whiteboards.3,4,6,12–15
Background
Our approach to understanding how ED whiteboards affect clinical work is sociotechnical, implying that the introduction of electronic ED whiteboards is a process of mutual adaptation of technology and organization.16–18 This process may involve that technology becomes a catalyst for organizational change, 19 that the organization shapes the technology, 20 or that social/organizational barriers block the adoption of a technology, 21 but, in general, the process involves a delicate balancing of organizational and technological means to derive benefit from the introduced technology. André et al. 22 find that attitudes, knowledge, and the role adjustments related to the disruption of established practices are critical to whether and how new technologies are adopted by clinicians. In this regard, electronic ED whiteboards probably benefit from their similarity to dry-erase whiteboards because this makes them appear an unintimidating extension of a well-liked artifact. 6 Nurses have, however, also been found to game whiteboards by erasing their name on the whiteboard without informing the coordinating nurse of their availability for a new task, effectively making themselves temporarily invisible. 23 This illustrates that the effects derived from whiteboards may not always relate to the treatment of the patients.
Several studies have investigated the introduction of the same technological system in multiple organizations and found that its effect differed across organizations.24,25 The difference in effect is not reducible to different rationales for introducing the system. For example, Aarts and Berg 24 find that the physicians in the two studied hospitals did not adopt the system, but whereas this led to abandonment of core system functionality in one hospital, it meant leaving the physicians out of the loop in the other hospital because the nurses took on the use of the system in place of the physicians. Orlikowski 20 argues that the effect of introducing a system emerges as the spontaneous result of local action and cannot be planned ahead as the realization of prespecified rationales. By this account, change is to a large extent produced by the improvisations that happen to get repeated over time and incorporated into practice.
Method
We adopted a method similar to that in a previous before/after study of the use of electronic whiteboards at another ED. 12 The present study was approved by the management of the ED and by the health-care region’s department for quality and development.
The ED
The ED saw 40–45,000 patients a year and had a total of 21 patient rooms, divided into a fast-track area for walk-in patients, two acute areas for admitted patients, and a long-term area where patients could be admitted up to 24 h. This study concerned the acute area reserved for the patients triaged at the two highest levels (i.e. the most severe cases). At the ED, this seven-bed area was known as Team 2, whereas the other acute area was Team 1. Team 2 was staffed with 2 senior physicians, 9 junior physicians, and 40 nurses. In addition, a pool of physicians from other departments was regularly called on to see ED patients and spent part of their shifts in the ED.
Figure 1 shows the floor plan of the ED, excluding the long-term area. The electronic whiteboards, indicated in the figure, were mounted on the wall in the two locations where the dry-erase whiteboard used to be. Whiteboard 2 was at the center of Team 2 in the hallway that connected this team’s patient rooms with a work area used by the clinicians for preparing to see patients and for writing patient records. This whiteboard permanently displayed the patients of Team 2. Whiteboard 1 was at the center of Team 1 in a work area used by the clinicians when preparing to see patients and writing patient records. All timeouts were held in front of this whiteboard, and during the timeouts it was used for displaying the patients of Team 1 as well as Team 2. Otherwise, Whiteboard 1 displayed the patients of Team 1. In addition to the whiteboard, the ED also used several other of the hospital’s information systems, including the electronic patient record, several systems for the results of laboratory tests, and a system for looking up treatment instructions.
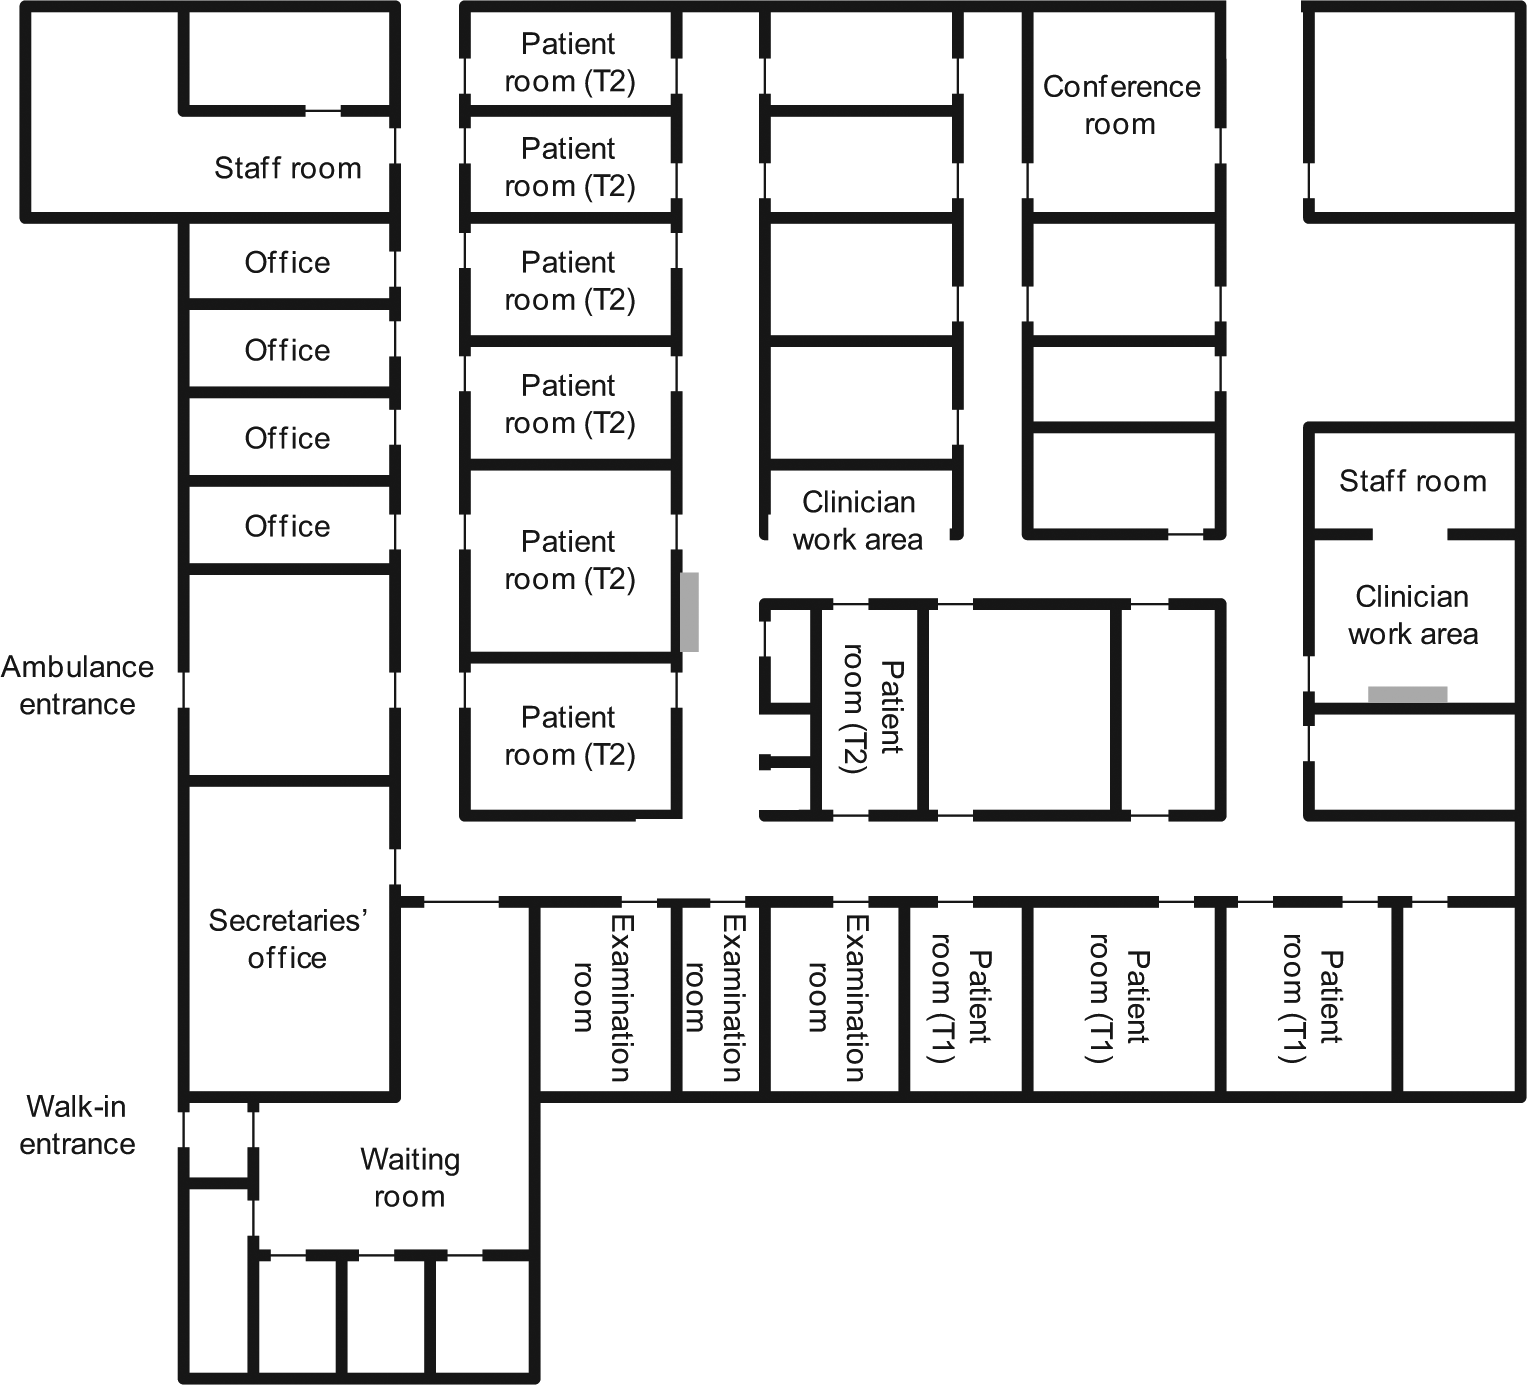
Floor plan of the fast-track and acute areas of the emergency department, with gray bars indicating the wall-mounted Whiteboards 1 and 2. The patient rooms are divided between Team 1 (T1) and Team 2 (T2). Unlabeled rooms are mainly for supplies.
For ease of reference, we refer to the study site simply as the ED, though our study specifically concerned Team 2.
The electronic whiteboard
The electronic whiteboard, developed by Imatis (www.imatis.com), gave one row of information for each patient, including information such as time of arrival, room, patient name, age, triage level, problem, attending physician, attending nurse, and next action. The same information was previously available on the dry-erase whiteboard, except that the information about problem and next action has become more detailed. On the electronic whiteboard, patient name and age were automatically retrieved from a central database. Otherwise, the whiteboard was not integrated with the hospital’s other information systems, and the remaining whiteboard information was therefore manually entered and updated by the clinicians, mainly by the coordinating nurse. The whiteboard information was permanently displayed on Whiteboards 1 and 2, which were pairs of wall-mounted, 52-inch touch screens (see Figure 2). Information on these whiteboards was entered via the touch screen interface or via the mouse and keyboard available below the screens. In addition, the electronic whiteboard could be accessed on any computer in the ED, including the computers in the patient rooms, hallways, and secretaries’ office.
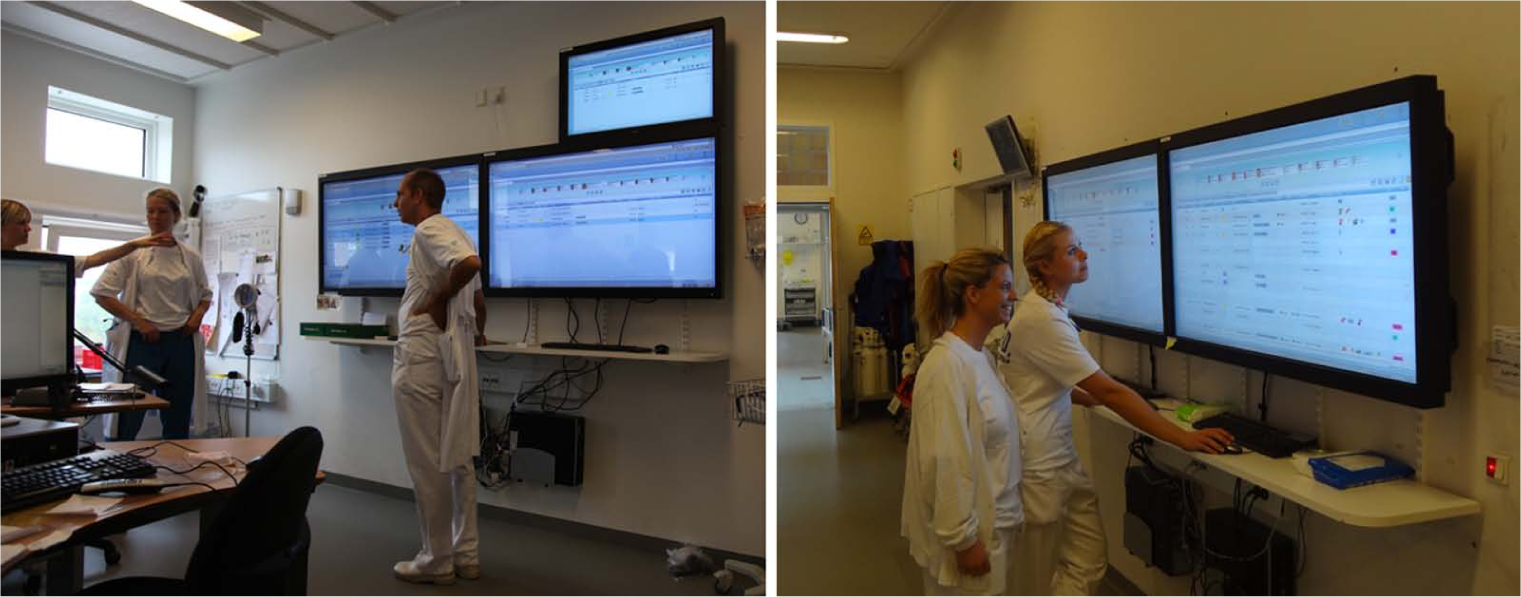
Whiteboard 1 (left) in the clinician work area of Team 1 and Whiteboard 2 (right) in the hallway that connected the patient rooms of Team 2 with its clinician work area.
When a patient was announced for arrival, preliminary patient information was entered on the whiteboard. Upon arrival, the patient was triaged by a nurse to determine the urgency of the patient’s complaint, and the patient was assigned a room and a nurse. This information was entered on the whiteboard, along with any tests ordered. A physician was also assigned to the patient but they often monitored the whiteboard to align their examination of the patient with the arrival of test results. All ED clinicians used the whiteboard to maintain an overview, keep track of their patients’ progress toward discharge, and help determine their next move.
Procedure and measurements
After obtaining approval for the study, we held a workshop with representatives of the physicians, nurses, secretaries, and management of the ED. At this workshop, the purpose of the measurements was discussed and details about their practical administration were refined. We also attended two of the meetings at which the clinicians prepared the introduction of the electronic whiteboard to listen in on their discussions and to ensure the alignment between their preparations and the measurements.
The study involved two measurement periods of 4 weeks. The first measurement period (March 2011) was before the electronic whiteboard was introduced, the second (September 2011) after it had been in use for 4 months. Based on our experiences from our study at another ED, 12 we considered 4 months sufficient for the use of the electronic whiteboard to stabilize. Prior to the measurements, all ED staff members were informed about the study by email. The physicians and nurses also received a description of the study on paper and an informed consent form concerning their participation in the measurements. During the first days of each measurement period, we were present at the physicians’ and nurses’ morning meetings to introduce the measurements and answer questions about the study. The measurements were the same during the two measurement periods and comprised the following.
The location of the physicians and nurses was tracked with an ultrasound positioning system from Sonitor (www.sonitor.com). Each physician and nurse who agreed to be tracked wore a tag that emitted a unique ultrasound signal every 20 s. To support the clinicians in always wearing their tag, it had a strip for attaching it to their staff key or another object they always carried. The clinicians initially got their tag from a box containing tags with blue and red strips. Physicians were requested to pick a tag with a blue strip, nurses to pick a tag with a red strip. Thus, for each tag we knew whether it was carried by a physician or a nurse, but it remained unknown which person carried which tag. Receivers for capturing the signals from the tags were set up in 13 different locations in the ED and calibrated so that the signal from a tag was only captured when the clinician with the tag was in the vicinity of the receiver. The receivers were in the seven patient rooms of Team 2, at Whiteboards 1 and 2, in the secretaries’ office, and in three places in the hallways. Outside of these locations, the clinicians’ whereabouts were not tracked. A total of 17 physicians consented to wear a tag during the before measurements and 16 during the after measurements. This corresponded to the 11 senior and junior physicians at the ED and 6 (before) and 5 (after) of the physicians from other departments attending ED patients on an on-call basis. Of the 40 nurses, 37 (93%) consented to wear a tag during the before measurements and 30 (75%) during the after measurements.
The use of the computers in the patient rooms of Team 2, the hallways, and the secretaries’ office (a total of 19 computers) was logged continuously by a tailor-made program. We focused solely on the use of these computers for running the electronic whiteboard. The logs contained no information about who used the computers.
Mental workload was rated by the physicians and nurses by means of the NASA task load index (TLX). 26 TLX consists of the six subscales: mental demand, physical demand, temporal demand, effort, performance, and frustration, each rated on a scale from “low” (0) to “high” (100) in increments of five, except performance for which the anchors are “good” (0) and “bad” (100). The physicians individually rated their mental workload at the daily timeouts at 10:45 and 15:00, during which they walked through and assessed the patients currently at the ED. The nurses rated their mental workload at the start of their shift, when they had arrived and individually needed to form an overview of the current state of the ED. We selected these two situations for the TLX measurements because they represented important points at which the physicians and nurses needed to ascertain their overview of the patients and depended on the whiteboard in obtaining and adjusting this overview. At the beginning of each measurement period, we introduced the physicians and nurses to TLX on their morning meetings, and we sometimes repeated the introduction for individual clinicians as part of our observations.
We observed work at the ED for about 75 h. The observations focused on the day shifts, were distributed across weekdays, and consisted of visits during which we observed work in the ED for 3–4 h at a time. The observations, which did not include the patient rooms, provided a background understanding of ED work and opportunities for exploring how the clinicians used the whiteboards. A specific focus of the observations was to look for work-practice changes associated with the introduction of the electronic whiteboard. Therefore, the observations were about evenly divided between the two 4-week measurement periods. We also conducted interviews with 12 clinicians (6 physicians, 4 nurses, and 2 secretaries) to get additional information about changes in work practices and the clinicians’ experience of the whiteboards. The interviews lasted 30–60 min and were conducted after the second measurement period. This meant that the interviews were informed by the observations and measurements as well as served to obtain explanations of the observations and measurements. The interviews were structured by the measured effects of the whiteboards on the work in the ED and by questions about the interviewees’ experience and explanation of these effects. Observations and interviews were documented in written notes, which were analyzed by identifying major and recurrent themes that complemented the measurements.
Finally, data about the number of admissions, their duration, and the age of patients were extracted from the electronic patient record for the 4 weeks of each measurement period. These data were used as control variables. While the number of admissions indicated patient volume, their duration related to the severity of complaints and patient age to the types of complaint. Collectively, the control variables provided evidence about the busyness of the ED and thereby about the amount of work to be handled by the clinicians.
Data preprocessing
Before the statistical analyses, the data from the tracking of the clinicians’ location and their use of the computers in the patient rooms, hallways, and secretaries’ office were preprocessed because such data are noisy.
For the tracking of the clinicians’ location, some of the signals emitted from the tags were lost. To include a day’s tracking of a clinician in our analysis, we required that the clinician’s tag had been tracked by a receiver at least 100 times. This excluded 20 percent of the tracked shifts, during which the clinicians were away from the central ED area for a large part of their shift. The remaining 1,028,957 trackings were included in our analysis. Some signals from the tags were lost even when the clinicians were in the vicinity of a receiver. To account for this, we allowed up to 2 min between consecutive trackings of a tag. This 2-min rule was applied for 79,076 (before) and 90,011 (after) of the trackings, corresponding to 16 percent. For an additional 5 percent of the trackings, there was more than 2 min between consecutive trackings. In these cases, we treated the first 2 min as time spent at the location and the remaining time as unaccounted for. Time unaccounted for included, for example, lunch, breaks, meetings, and work tasks away from the ED.
For the clinicians’ computer use, the active application, if any, was logged continuously. This provided exact information about when clinicians opened the whiteboard application; the end time had to be estimated because it cannot be assumed that clinicians always closed the whiteboard application when they stopped attending to it. We aimed to account for this in two ways. First, if the same window in the whiteboard application remained active for an unbroken period of more than 10 min followed by the onset of the screen saver, we assumed the whiteboard was unattended during the last 8 min of the period and discarded them. We chose 8 min as an approximation of the period of nonuse that triggered screen saver onset. Second, if a window still remained active for an unbroken period of more than 15 min, we recorded only the first 15 min as whiteboard use. The computer in one patient room was excluded from the analysis because it was replaced during the second measurement period, leaving the log incomplete.
Results
We analyzed the data using analysis of variance (ANOVA) with measurement period (before, after) as the independent variable. In all statistical analyses, significance was set at the level of 0.05. After analyzing the quantitative data, we account for our observations and interviews.
Control variables
The four areas of the ED received a total of 3435 and 3567 patients during the before and after measurements, respectively. Because the electronic patient record did not distinguish between the two acute areas, we estimated the number of patients in Team 2 (the focus of our study) by assuming it comprised the acute patients admitted for more than 3 h. For the 2276 patients satisfying this criterion, Table 1 shows the average number of admissions a day, the average length of stay for a patient, and the average patient age. There were significantly fewer admissions a day during the use of electronic whiteboards compared to before their introduction, F(1, 58) = 6.79, p = 0.01. For length of stay and patient age, we found no effect of measurement period, Fs(1, 2274) = 0.01 and 3.14, respectively (both ps > 0.08).
Control variables, N = 2276 patients.
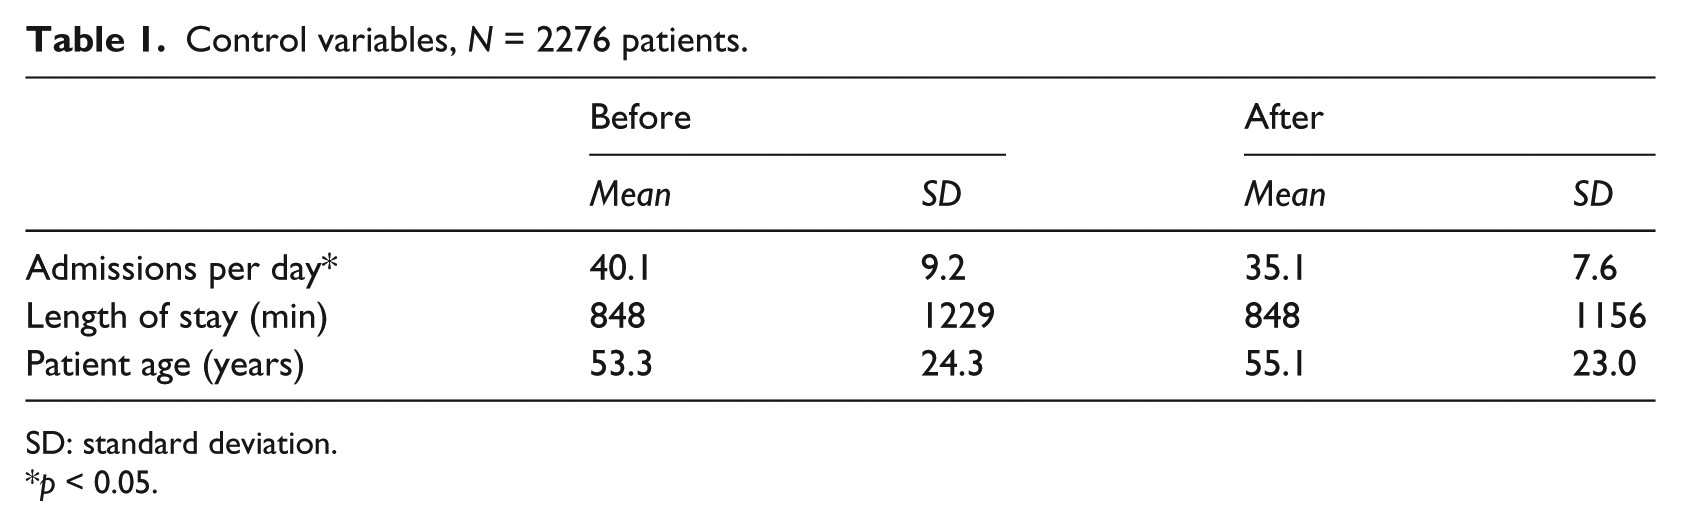
SD: standard deviation.
p < 0.05.
Distribution of time across locations
The physicians’ distribution of their time was tracked for 97 (before) and 87 (after) shifts (see Table 2). After the introduction of the electronic whiteboard, the physicians spent significantly less of their time in patient rooms, significantly more by Whiteboard 1, significantly less in the hallways, significantly more in the secretaries’ office, and significantly more in locations other than those tracked, Fs(1, 182) = 34.93, 13.88, 39.27, 7.85, and 10.67, respectively (all ps < 0.01). There was no difference from before to after the introduction of the electronic whiteboard for the percentage of time spent by Whiteboard 2, F(1, 182) = 0.40, p = 0.5. The average length of a physician shift was 8.49 h (standard deviation (SD) = 2.32 h), so the decrease in, for example, time spent in patient rooms amounted to 45 min and the increase in time spent by Whiteboard 1 to 51 min. The only significant difference with a negligible absolute effect size was the difference in time spent in the secretaries’ office.
Physicians’ distribution of their time (%), N = 184 shifts.
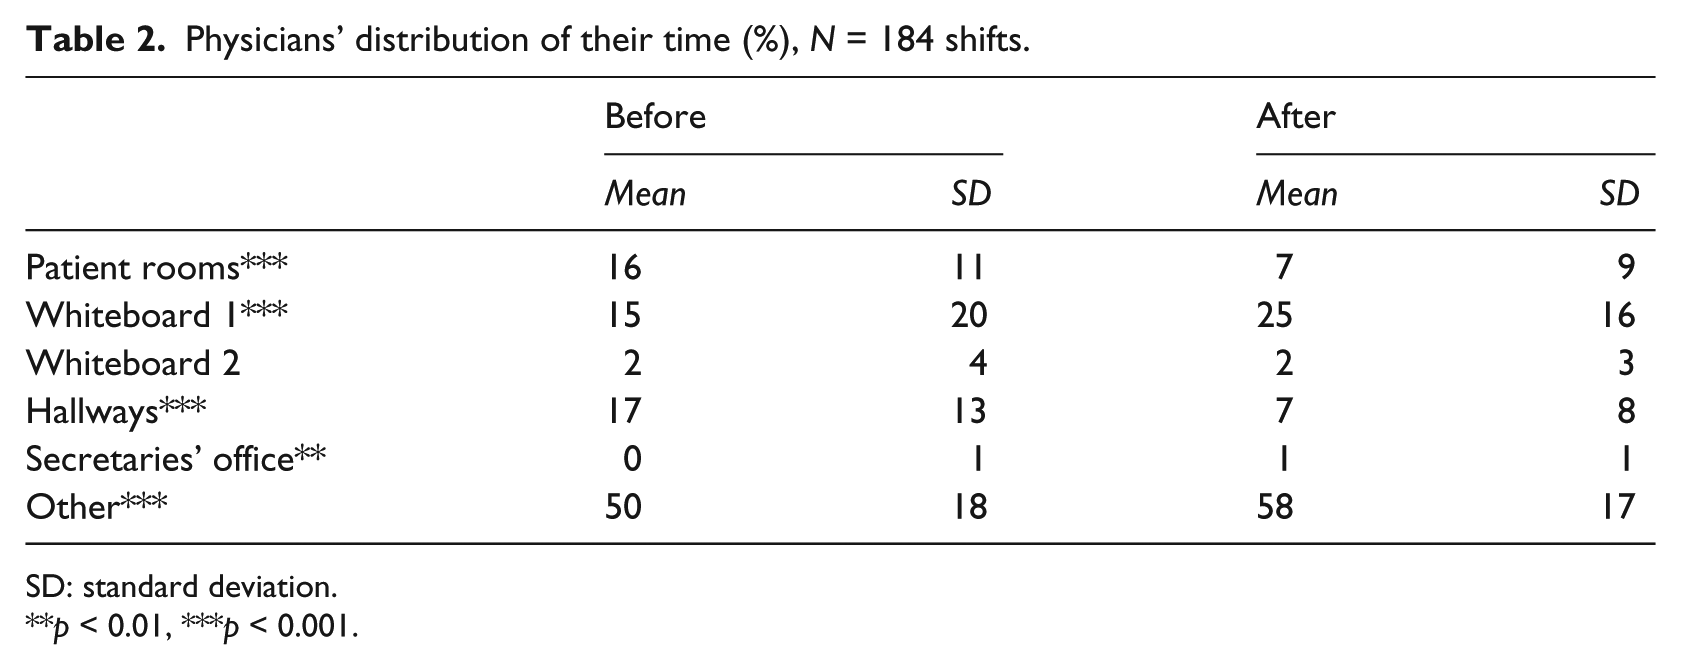
SD: standard deviation.
p < 0.01, ***p < 0.001.
While the physicians spent a smaller part of their shifts in patient rooms, they were in the patient rooms for significantly longer periods at a time after the introduction of the electronic whiteboard, F(1, 3207) = 29.77, p = 0.001. The average duration of the physicians’ stops in patient rooms increased by 47 percent (see Table 3). The physicians also stopped at Whiteboard 2 for significantly longer periods at a time after the introduction of the electronic whiteboard, F(1, 1309) = 44.37, p = 0.001, an increase of 43 percent. Conversely, their stops at Whiteboard 1 did not differ in length, F(1, 3139) = 0.03, p = 0.9, though they spent more of their time in this location. Across the tracked locations, the physicians spent an average of 215 s (before) and 254 s (after) at a location before they moved to another location, indicating a high level of mobility before as well as after the introduction of the electronic whiteboard.
Physicians’ length of stop (s), N = 184 shifts.
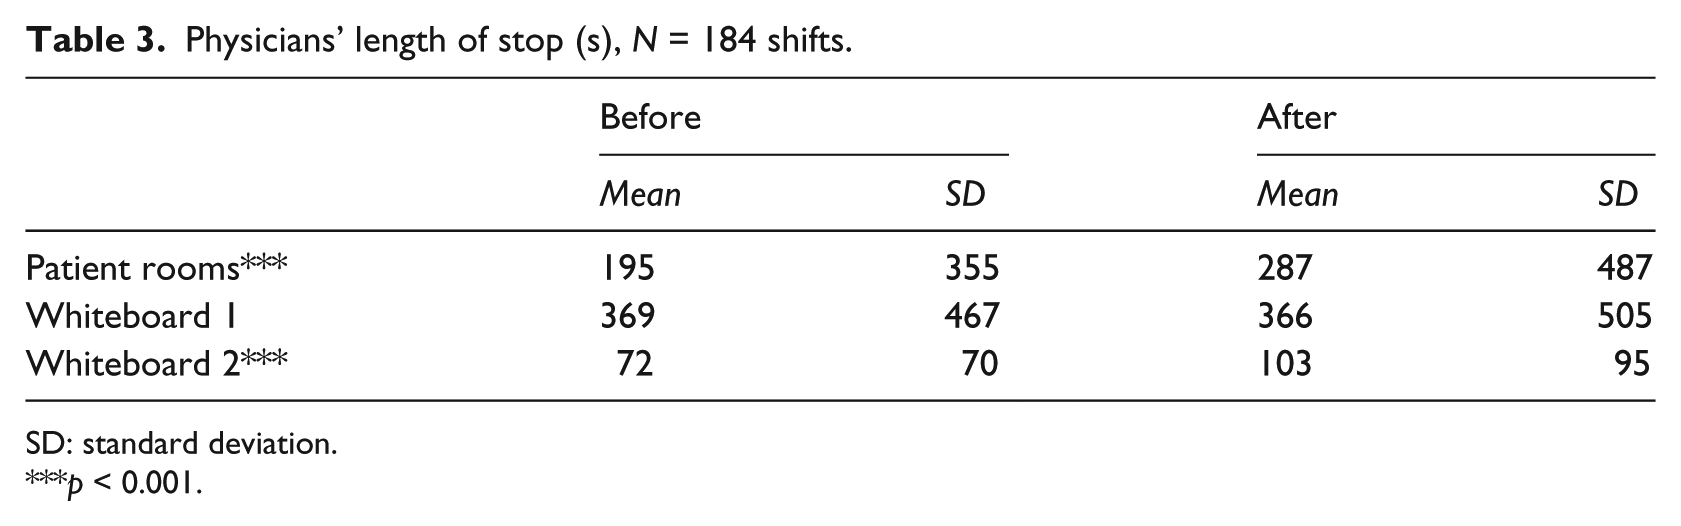
SD: standard deviation.
p < 0.001.
The nurses’ distribution of their time was tracked for 340 (before) and 264 (after) shifts (see Table 4). After the introduction of the electronic whiteboard, the nurses spent significantly less of their time in patient rooms, significantly more by Whiteboard 1, significantly more by Whiteboard 2, significantly less in the hallways, significantly more in the secretaries’ office, and significantly less in locations other than those tracked, Fs(1, 602) = 37.64, 5.80, 85.35, 7.62, 13.90, and 43.62, respectively (all ps < 0.05). The average length of a nurse shift was 8.21 h (SD = 3.79 h), so the decrease in time spent in patient rooms amounted to 43 min and the increase in time spent, for example, by Whiteboard 2 to 61 min.
Nurses’ distribution of their time (%), N = 604 shifts.
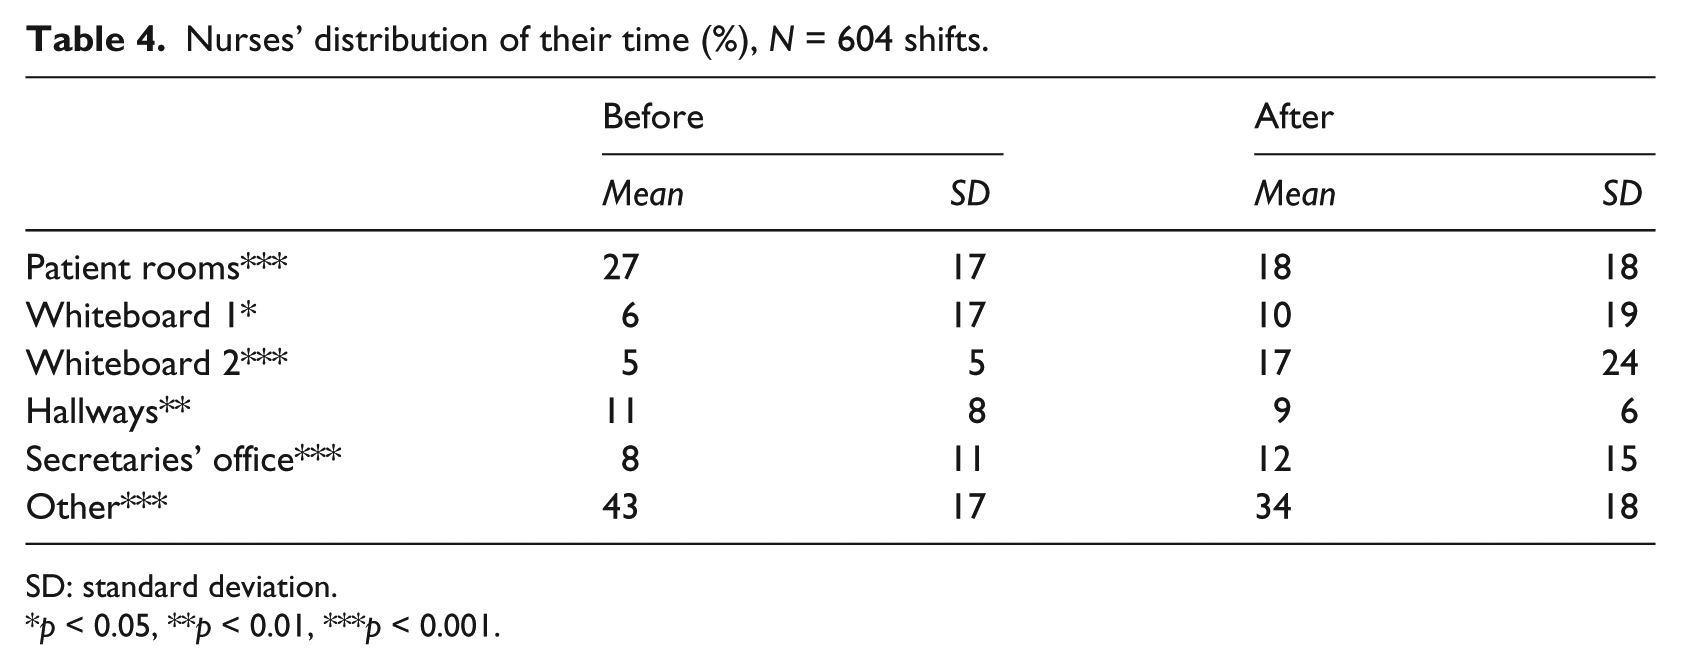
SD: standard deviation.
p < 0.05, **p < 0.01, ***p < 0.001.
Like the physicians, the nurses were in patient rooms for significantly longer periods at a time after the introduction of the electronic whiteboard, F(1, 27818) = 9.29, p = 0.002, an increase of 24 percent (see Table 5). The nurses also stopped at Whiteboard 2 for significantly longer periods at a time, F(1, 12553) = 73.89, p = 0.001, a drastic 343 percent increase. The nurses’ stops at Whiteboard 1 did not differ in length from before to after the introduction of the electronic whiteboard, F(1, 3854) = 0.72, p = 0.4. Across the tracked locations, the nurses spent an average of 130 s (before) and 204 s (after) at a location before they moved to another location and were thus even less stationary than the physicians.
Nurses’ length of stop (s), N = 604 shifts.
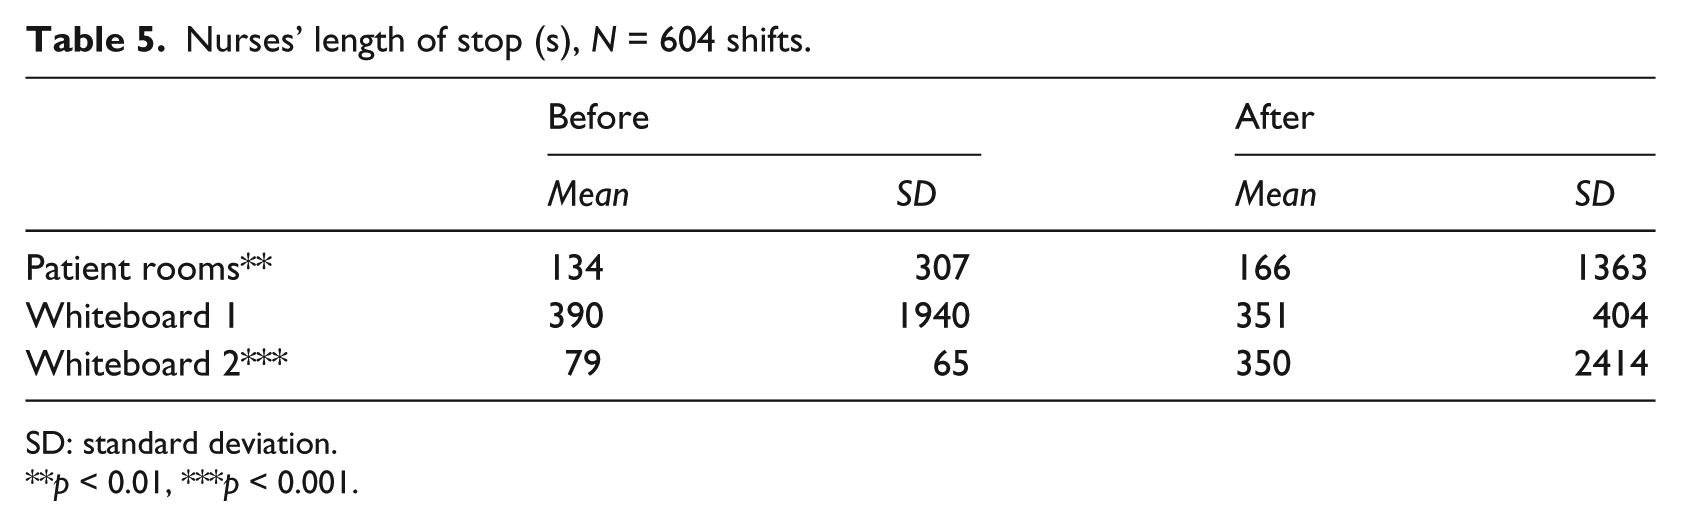
SD: standard deviation.
p < 0.01, ***p < 0.001.
Distributed use of the electronic whiteboard
In addition to the permanent presence of the whiteboard in terms of Whiteboards 1 and 2, the ED staff could access the electronic whiteboard from any computer in the ED. The electronic whiteboard was hardly ever used on the computers in the patient rooms and hallways. The average amount of use of the electronic whiteboard in a patient room was 0.02 min a day (SD = 0.13 min), which was not significantly different from the nonuse before its introduction, F(1, 278) = 2.01, p = 0.2. The use of the electronic whiteboard in the hallways amounted to an average of 0.19 min per computer per day (SD = 1.49 min), which merely approached a significant difference from nonuse, F(1, 446) = 3.54, p = 0.06. On the computers in the secretaries’ office, the electronic whiteboard was, in contrast, used an average of 31.13 min per computer per day (SD = 68.16 min). This amount of use significantly exceeded nonuse, F(1, 278) = 29.21, p = 0.001.
Mental workload
The physicians rated their mental workload at the timeouts. Table 6 shows the data, which comprised 50 (before) and 64 (after) TLX measurements. Using the number of tracked shifts (see section “Distribution of time across locations”) as a rough estimate of the physicians attending the two daily timeouts, the 114 TLX measurements corresponded to a response rate of 31 percent. The data must be interpreted with this modest response rate in mind. The physicians experienced a significant increase in overall mental workload from before to after the introduction of the electronic whiteboard, Wilks’ λ = 0.84, F(6, 107) = 3.30, p = 0.005. Analyzing the individual TLX subscales, we found significant increases from before to after the introduction of the electronic whiteboard for mental demand, temporal demand, performance, and frustration, Fs(1, 112) = 7.42, 11.62, 7.78, and 7.33, respectively (all ps < 0.01), but not for physical demand and effort, Fs(1, 112) = 1.60 and 2.79, respectively (both ps > 0.09).
Physicians’ mental workload at timeouts, N = 114 TLX measurements.
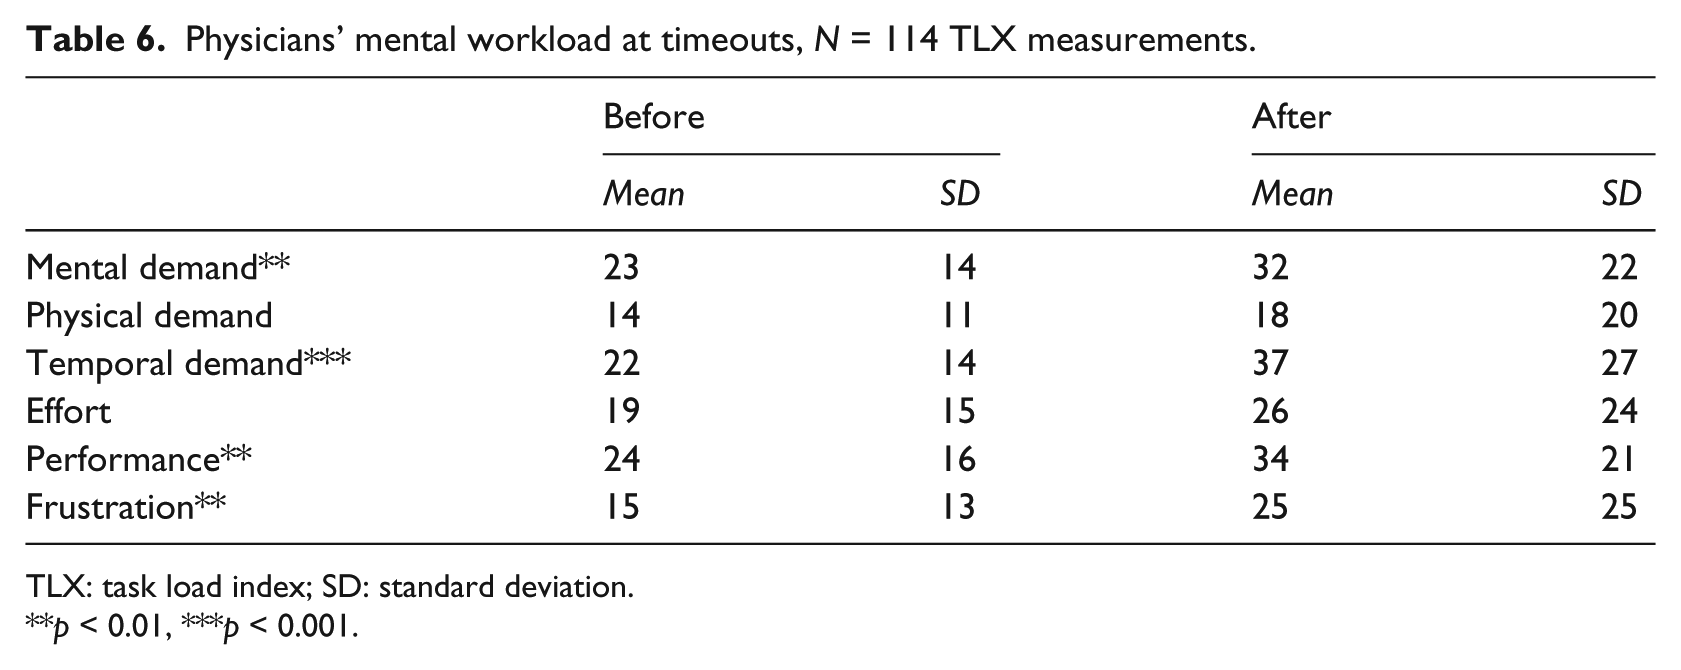
TLX: task load index; SD: standard deviation.
p < 0.01, ***p < 0.001.
The nurses rated their mental workload at the start of their shift, a daily work situation during which the nurses depended on the whiteboard in forming an overview of the current state of the ED. The data comprised 63 (before) and 46 (after) for a total of 109 TLX measurements (see Table 7). Using the number of tracked shifts as a rough estimate of the number of nursing shifts, the response rate was 18 percent. With a response rate this low, the data should be considered suggestive only. There was a significant decrease in overall mental workload from before to after the introduction of the electronic whiteboard, Wilks’ λ = 0.87, F(6, 102) = 2.52, p = 0.03. Analyzing the individual TLX subscales, we found a significant decrease from before to after the introduction of the electronic whiteboard for performance, F(1, 107) = 4.89, p = 0.03. Note that a lower performance rating indicates better performance. There were no differences in mental demand, physical demand, temporal demand, effort, and frustration, Fs(1, 107) = 1.62, 1.64, 2.43, 1.75, and 0.45, respectively (all ps > 0.1).
Nurses’ mental workload at the start of shifts, N = 109 TLX measurements.
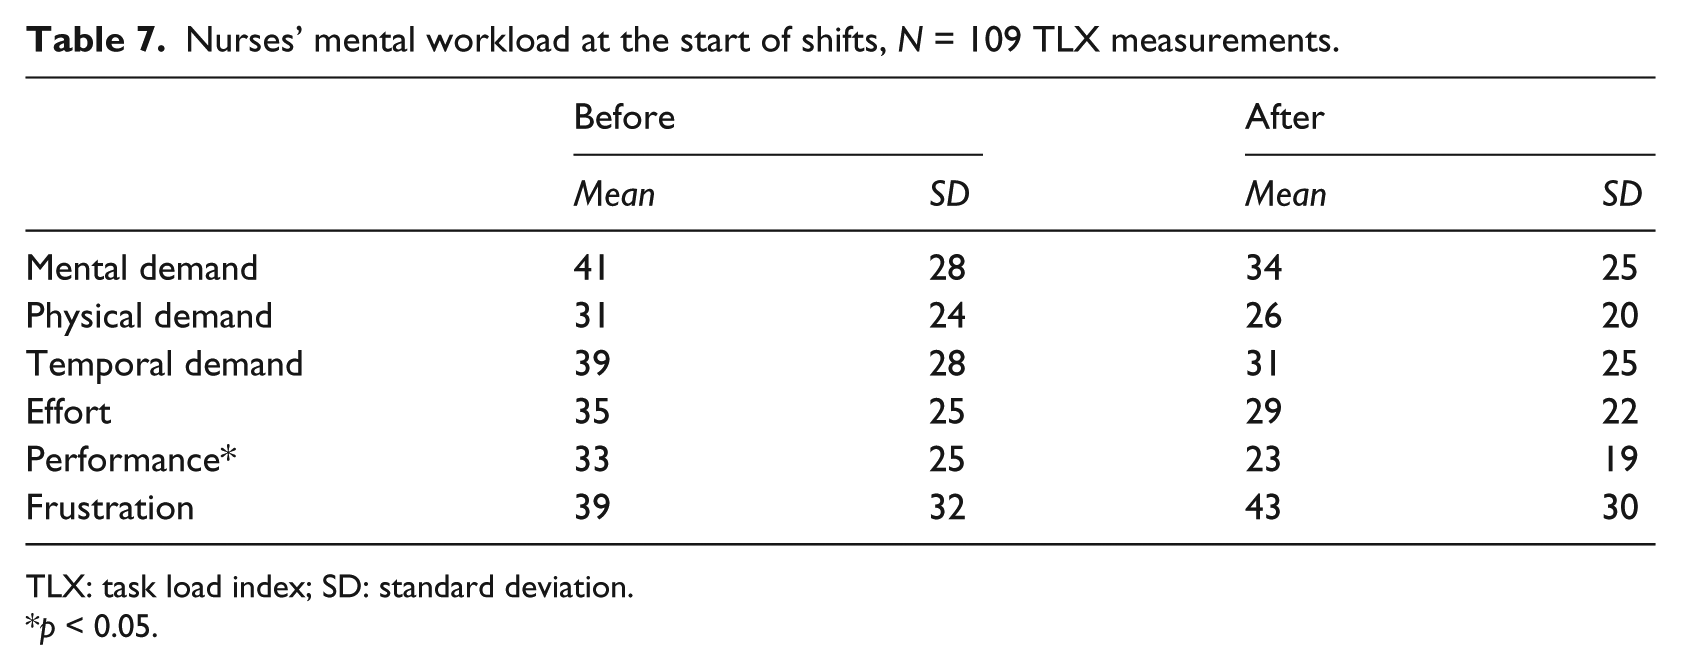
TLX: task load index; SD: standard deviation.
p < 0.05.
Work-practice changes
Our observations and interviews gave the overall impression of a busy workplace with a physical layout (see Figure 1) that often made it difficult to locate a specific clinician. Before the introduction of the electronic whiteboard, we observed what we experienced as some almost chaotic situations. On one occasion, the coordinating nurse entered the staff room and announced to the nurses who had just arrived for their shift that for the moment she had stopped updating Whiteboard 2 due to extreme busyness. In addition, the clinicians felt that their overview of the patients often suffered before the introduction of the electronic whiteboard because they did not have ready access to whiteboard information. This was, for example, a problem during timeouts. At the meetings preparing the introduction of the electronic whiteboard, the clinicians expressed a widespread need for better status and overview information, and after the introduction of the electronic whiteboard, they were generally satisfied with it and expressed that it had improved their overview of the patients. Our observations confirmed that the electronic whiteboard was widely used, and, especially, Whiteboard 1 with its associated work and staff areas (see Figure 1) had become a central meeting area for both physicians and nurses.
The specific changes in work practices differed for physicians, nurses, and secretaries. Before the introduction of the electronic whiteboard, the physicians in principle had a timeout by Whiteboard 1 at 10:45 and 15:00 but we observed that on many occasions these timeouts did not take place. The chief physician later confirmed that they had often experienced poorly updated whiteboards and many canceled timeouts. Rather than walking through the patients in a collective manner during timeouts at the whiteboard, physicians and nurses discussed individual patients when they met in the hallways or the patient rooms. After the introduction of the electronic whiteboard, observations and interviews showed that the physicians systematically met at Whiteboard 1 for timeouts at 10:45 and 15:00. During the timeouts, they walked through the patients on the basis of the information on Whiteboard 1, updated the whiteboard whenever the status of a patient or the allocation of resources had changed, and occasionally used Whiteboard 1 for looking up additional patient information in other electronic records. As one interviewed physician bluntly put it: “Now we are actually doing something. Earlier the timeouts were a blow in the air.” The physicians also introduced new timeouts at 7:45 and 16:45. At the former—just before the start of the day shift—special attention was paid to resource allocation and other issues concerning the management of the normally busy day shift. At the latter—by the end of the day shift—the physicians especially focused on which patients could be transferred to other departments to reduce the patient load at the ED, which was staffed with fewer clinicians during evening and night shifts.
After the introduction of the electronic whiteboard, the coordinating nurse started participating in the timeouts at 10:45 and 15:00 because they became an important element in the coordination of work at the ED. A further change adding to the time nurses spent in the clinician work area by Whiteboard 1 was that the nursing handover at 15:30, which lasted for about half an hour, moved to this area to have access to the whiteboard. Before the introduction of the electronic whiteboard, the nursing handover was held in a location that was recorded as “other” in our measurements. Along with the electronic whiteboard, the management of the ED introduced requirements for more detailed whiteboard information and for keeping the information current by updating the whiteboard as soon as new or changed information was available. These requirements meant that the nurses spent more time updating whiteboard information and that they had to visit the whiteboard more frequently. These interactions with the electronic whiteboard were predominantly performed at Whiteboards 1 and 2 and frequently led to dialogues between nurses and physicians about the patients, especially at Whiteboard 1.
Interviews with the secretaries clarified that after the introduction of the electronic whiteboard, they had started initiating new patients on the whiteboard. This task was previously performed by the coordinating nurse. The secretaries also used the electronic whiteboard, which they accessed on their computers in the secretaries’ office, to maintain an overview of the occupancy level of the ED and to keep track of patients’ progress toward discharge in order to know when their records had to be finalized. Before the introduction of the electronic whiteboard, the secretaries had to get such information orally from the clinicians or to walk over to the dry-erase whiteboards to see whether the information was available there. Finally, the secretaries used the electronic whiteboard to inform walk-in patients about waiting times and relatives about whether a patient had been transferred to another department.
Finally, two additional changes were of importance in relation to the electronic whiteboard. First, the ED turned fully to electronic patient records in the period between the before and after measurements when the records from a patient’s previous admissions became electronically available in August 2011. The fully electronic patient records provided quicker access to information about previous admissions compared to the former practice of requesting the paper version of old records. This meant that the physicians had more information readily available and could work more focused when at a computer, for example, in the clinician work area by Whiteboard 1. Conversely, less work could be done in locations not equipped with a computer, and a physician commented that in the absence of the paper version of old records, he now asked patients for information he previously looked up in the paper records while in the patient room. Second, our observations of the timeouts showed that the clinicians, even months after the introduction of the electronic whiteboard, often had a parallel discussion about how to configure the whiteboard and rearrange work to improve the use of the whiteboard. Through these discussions, the clinicians refined the whiteboard design and the associated work practices on the basis of their experiences from concretely using the whiteboard.
Discussion
The main results of this study are that with the electronic whiteboard (a) the physicians and nurses spend more of their time in the work areas by Whiteboards 1 and 2 and less in the patient rooms, (b) the physicians and nurses are in the patient rooms and by Whiteboard 2 for longer periods at a time, (c) the timeouts have become an effective means of coordinating work in the ED, and (d) the secretaries, but neither physicians nor nurses, make distributed use of the electronic whiteboard. In the following, we first discuss these main results and then compare this study with a similar study of the same electronic whiteboard at another ED. Finally, we propose how practitioners may manage sociotechnical change processes such as the introduction of electronic ED whiteboards and discuss limitations of our study.
Whiteboard effects and work-practice changes
With the electronic whiteboard, the clinicians spend 9 (both physicians and nurses) percentage points less of their time in the patient rooms and 10 (physicians) and 4 (nurses) percentage points more in the work area by Whiteboard 1. In addition, the nurses spend 12 percentage points more of their time in the work area by Whiteboard 2. Compared to previous studies, the percentage of time spent in the patient rooms appears low, especially for the physicians. For example, Yen et al. 27 find that resident physicians and nurses at a pediatric ED spend 35 and 26 percent of their time, respectively, in the examination room with the patient. Hollingsworth et al. 28 find that the same two staff groups at a general ED spend 33 and 31 percent, respectively, of their time on direct patient care. The percentages are, however, difficult to compare because neither Yen et al. nor Hollingsworth et al. provide information about the number of patients seen by the studied clinicians. We note that in our study, the 12 percent reduction in the number of patients admitted per day is much smaller than the 56 percent (physicians) and 33 percent (nurses) decrease in the time spent in patient rooms and thus cannot explain away this decrease. Rather, the decrease follows from the increase in time spent by Whiteboards 1 and 2, for which our observations and interviews provide concrete explanations. For the physicians, the main explanation of the increase in time spent by Whiteboard 1 is the timeouts, and for the nurses, it is the relocation of the nursing handover. Both these changes are tightly coupled to the electronic whiteboard, which facilitates better timeouts and handovers by providing more detailed and more current information. Our observations indicate that the explanation of why the nurses spend more of their time by Whiteboard 2 is partly that this whiteboard is used for performing many of the additional whiteboard updates made necessary by the managerial requirement for more detailed and current whiteboard information. Another likely explanation is that Whiteboard 2 has increasingly become where the nurses form an overview of the current state of the ED at the beginning of their shifts, whereas previously this activity was spread across a number of locations. The use of ED whiteboards for establishing an overview at the beginning of shifts has previously been emphasized by Wears et al. 15 but as a quality that dwindled with the transition from dry-erase to electronic whiteboards. Contrary to Wears et al., we find that the nurses have experienced a decrease in mental workload when they at the start of a new shift form an overview of the state of the ED.
On average, the clinicians are in the patient rooms for 287 s (physicians) and 166 s (nurses) at a time after the introduction of the electronic whiteboard, and they are at other locations for similarly short periods of time. This indicates high local mobility. With the electronic whiteboard, the clinicians are, however, in the patient rooms for 47 percent (physicians) and 24 percent (nurses) longer periods at a time, suggesting a more focused patient contact. The clinicians also stop at Whiteboard 2 for longer periods at a time. Our interviews suggest two explanations for these changes. First, the clinicians may have a more focused patient contact because they now have an improved overview of their patients and thereby can both prepare better before entering the patient room and devote their attention more fully to the patient while in the patient room. While the improved overview is in part provided by the electronic whiteboard, the better preparations are also a result of the fully electronic patient records, which make patient information from previous admissions readily accessible to physicians in preparing to see a patient. Second, the clinicians may spend longer periods of time at one location before moving to another because they are interrupted less by colleagues who seek advice to gain an overview of their patients. Previous work shows that physicians and nurses at EDs are interrupted as much as an average of 15 times an hour, with the higher interruption rates for senior clinicians and the lower rates for junior clinicians. 29 The result of interruptions is often that ED physicians fail to return to the interrupted task or, on returning, hasten task completion to compensate for the time “lost” in interruption.13,30 On this basis, we consider it a positive change that the clinicians spend prolonged periods at a time in the patient rooms.
The timeouts, which were previously often canceled, have after the introduction of the electronic whiteboard become an important coordinative activity, and the number of daily timeouts has increased from two to four. According to our interviews, the main explanation of this change in work practice is that the electronic whiteboard provides more detailed and more current information and that it can, occasionally, be used as an entry point to other electronic records with additional patient information. A supplementary explanation is that the dry-erase whiteboard in the clinician work area where the timeouts take place showed the patients of Team 1 only, whereas the electronic whiteboard (as regards the timeouts, Whiteboard 1) can show the patients of Team 1 as well as Team 2. This distribution of whiteboard information without the need of duplicate manual data entry is essential to keeping the whiteboard current and, thereby, to the timeouts. A further explanation, suggested by our observations, is that the electronic whiteboard provides shared information access for all physicians who attend a timeout. Previously, nearly all information about a patient would be in the head of individual physicians or in paper records, which could be shared with a single colleague but not easily with the group of colleagues at a timeout. The shared access to information on the electronic whiteboard has made it possible for more physicians to get an impression of the patients and contribute to the discussions at the timeouts. This explanation is consistent with Wong et al. 11 who find that the electronic “whiteboard has helped evolve morning rounds and discharge planning from an unstructured and unresolved process to one that drives discussion and increases transparency” (p. 243). The cost of the improved timeouts is that the physicians’ mental workload has increased during the timeouts. While this increase could be interpreted as negative, our interviews indicate that the physicians experience it as an inconsequential side effect of the improved timeouts.
Finally, the secretaries make distributed use of the electronic whiteboard by accessing it on the computers in their office. Unlike the physicians and nurses, the secretaries perform most of their work at their computer. This facilitates their distributed use of the electronic whiteboard because they are already in front of a computer, logged on, and can keep the whiteboard running in a background window or open it in a matter of seconds. In contrast, the physicians and nurses use Whiteboards 1 and 2 only and do not make use of the possibility of distributed access to whiteboard information from the computers in the patient rooms and hallways. The near-zero use of the whiteboard in the patient rooms corroborates that the clinicians do not experience the electronic whiteboard as an opportunity for spending more time in the patient rooms by, for example, moving some preparations for seeing a patient to the patient rooms.
Comparison with another ED
The electronic whiteboard has also been introduced at another ED and evaluated in a manner similar to this study. 12 The two EDs are in the same Danish health-care region, see approximately the same number of patients, and at the time of the evaluation, both EDs have 4 months of experience with the electronic whiteboard. Yet, the effects of the electronic whiteboard differ. The main outcomes at the other ED are that the nurses have moved from spending 17 to 28 percent of their time in the patient rooms and equally less at the control desk where the electronic whiteboard is permanently displayed; that the physicians spend an unchanged 20 percent of their time in the patient rooms after the introduction of the electronic whiteboard; and that the electronic whiteboard is accessed an average of 25 min a day from each patient room. We see three explanations for the different outcomes of introducing the same electronic whiteboard at the two EDs.
First, the other ED has one center, the control desk, at which the coordinating nurse is permanently present. Neither before nor after the introduction of the electronic whiteboard have the clinicians perceived a need for timeouts, rather the status of the patients is continuously communicated to the coordinating nurse and kept current on the whiteboard. The coordinating nurse is pivotal to the good overview experienced by the clinicians. In contrast, the clinicians at the ED in this study felt that their overview often suffered with the dry-erase whiteboard and they were struggling to make timeouts work. These clinicians, especially the junior ones, needed to establish an overview that could form a common ground for their work and have welcomed the possibility of effective timeouts, whereas the clinicians at the other ED already had a good overview and could, to some extent, use the electronic whiteboard to maintain this overview also when they were at a distance from the control desk.
Second, the physical layout of the other ED provides for a better overview because the ED is laid out with a central control desk from which two hallways lead to the patient rooms. From the control desk the clinicians, especially the coordinating nurse, can see who enters and leaves the patient rooms and thereby maintain a sense of where the clinicians are and how far the treatment of the patients has progressed. Conversely, the ED in this study is more of a maze with no location from which a clinician has a view of more than a fraction of the ED, thereby creating a need for other means of maintaining an overview. Another example of the impact of the physical layout of the ED in this study is that the secretaries, who are physically located at the periphery of the ED, frequently make distributed use of the electronic whiteboard.
Third, some clinicians at the other ED believe that spending more time in the patient rooms leads to improved treatment quality due to better contact with the patient and fewer interruptions. These clinicians’ belief contributes to an overall attitude according to which the better way of utilizing the possibilities afforded by the electronic whiteboard is to spend more time with the patients, even though the physicians as a group have not changed their behavior. In contrast, the clinicians at the ED in this study have not expressed a similar attitude but rather a widespread need for better status and overview information. Consistent with several previous studies of electronic ED whiteboards,3,11 these clinicians have been seeking a stronger shared understanding among the clinicians of the status of the patients and the state of the ED.
Implications for practice
This study has two implications regarding the sociotechnical introduction of electronic whiteboards at EDs.
First, the studied electronic whiteboard is relatively easy to configure and reconfigure to meet evolving local needs and, thereby, affords what Orlikowski 20 describes as a situated, improvisational change process. At the ED in this study, the clinicians refined their whiteboard and work practices along with their use of the whiteboard for real ED work. Lester et al. 19 recommend that such adaptation processes include, among others, a focus on compatibility with clinician needs, trial-ability, and high visibility. It is an important quality of the studied electronic whiteboard that it appears to be sufficiently simple and configurable to enable an adaptation process in accordance with these recommendations. In addition, we contend that a recurrent activity such as timeouts is important as a forum for discussions about the evolving use of a whiteboard.
Second, evaluations such as the before–after measurements reported in this study may be an instrument for working systematically with sociotechnical change processes such as the introduction of health-care information systems. We propose a process of iteratively specifying the effects desired from new systems, working to realize these effects, and measuring to what extent they have been achieved. 31 For ED whiteboards, effects may relate to the clinicians’ distribution of their time across locations, the quality of timeouts and other work practices that depend on the whiteboard, the clinicians’ mental workload in creating and maintaining an overview of their work, the effectiveness and efficiency of communication about patients, and effects related to the temporal flow of patients through the ED. Some effects can be measured using data from the whiteboards and other clinical systems, but many effects will require an infrastructure for collecting data specifically for the effects measurements. We emphasize the value of measuring effects during real use and of complementing measurements with observation and qualitative feedback to prompt reflection on emergent positive changes and possible negative side effects.
Limitations
The dynamic nature of the ED made it a challenging setting for before–after measurements. We accounted for some changes by, for example, choosing the periods for the measurements so that the junior physicians, who attended the ED for 6 months, had been equally long in the ED. But we acknowledge that confounding factors were present and must be remembered in interpreting our results. Four limitations are particularly important: First, there was some uncertainty in the location tracking of the clinicians due to lost signals from the tags. It should also be noted that the tracking only tells that the clinicians were in the vicinity of a receiver. When the clinicians, for example, were by Whiteboard 1, they were not attending exclusively to the whiteboard but also talking with colleagues and working at the computers in the room. Second, the response rates for the mental workload measurements were modest for the physicians and low for the nurses, probably due to busyness. While the mental workload results were corroborated by our interviews, they should be interpreted cautiously due to the response rates, which, in addition, were estimated. Third, our estimate of the number of patients in Team 2 was based on the assumption that the patients in Team 2 were the acute patients admitted to the ED for more than 3 h. The choice of 3 h as the threshold was somewhat arbitrary, thereby reducing the robustness of our control variables. Fourth, records from patients’ previous admissions became electronically available between the before and after measurements. This change was independent of the whiteboards but affected the ease with which physicians could access previous records while in the clinician work area and the patient rooms.
Conclusion
The physicians’ timeouts, which take place by one of the permanent whiteboard displays, have become more effective and more frequent 4 months after the introduction of an electronic ED whiteboard. Similarly, the nursing handovers have moved to the same location as the timeouts to benefit from the whiteboard. As a consequence, physicians and nurses spend more of their time in the clinician work areas where whiteboard information is permanently displayed, and they spend less of their time in the patient rooms. Physicians and nurses are, however, in the patient rooms for longer periods at a time. While the secretaries access the whiteboard from their computers in their office, the physicians and nurses predominantly access whiteboard information on the permanent displays.
The electronic whiteboard has also been introduced at another ED, with a different outcome. We contend that the different outcome is due to differences in the physical layout of the EDs, in the overview clinicians had prior to the introduction of the electronic whiteboard, and in the clinicians’ attitude about what type of work-practice changes to pursue. In the future, comparative studies are needed to investigate how differences between EDs modify the effects of electronic whiteboards on work practices. Finally, measurements such as those reported in this study may be an instrument for working systematically with attaining usage effects in sociotechnical change processes.
Footnotes
Acknowledgements
This study was part of the Clinical Overview Project, which was conducted in collaboration with Region Zealand and Imatis. The authors contributed equally to designing the study and conducting the empirical work. The first author (M.H.) analyzed the quantitative data and wrote the majority of the article. The second author (J.S.) analyzed the qualitative data and wrote parts of the article. Both authors critically read and discussed drafts of the article. Special thanks are due to the ED clinicians for being accommodating toward the requirements of the study in spite of their busy schedule.
Declaration of conflicting interests
The author(s) declared the following potential conflicts of interest with respect to the research, authorship, and/or publication of this article: The authors are neither financially, personally, nor otherwise related with Imatis and the health-care region, apart from the professional relations that have evolved in the course of the project. The funding sources have had no role in designing, carrying out, and writing about the study.
Funding
The author(s) disclosed receipt of the following financial support for the research, authorship, and/or publication of this article: This study was co-funded by Vækstforum Sjælland and Innovasjon Norge.