
Abstract
Prior to the 2012 London Olympic and Paralympic Games, new statistical methods had to be developed for the enhanced syndromic surveillance during the Games. Different methods were developed depending on whether or not historical data were available. Practical solutions were needed to cope with the required daily reporting and data quality issues. During the Games, nearly 4800 signals were tested on average each day, generating statistical alarms that were assessed to provide information on areas of potential public health concern and reassurance that no major adverse incident had occurred.
Highlights
Daily surveillance must take account of any differences in data structure between different days of the week. Where historical data were used to set baselines, care must be taken in excluding abnormal events. Expanding surveillance systems where the number of data providers increases over time, or irregular reporting by provider sites, may require specific methods for outbreak detection.
Introduction
Objective
During the 2012 Olympic and Paralympic Games, the Health Protection Agency (HPA) provided daily situation reports to highlight any potential threats to public health and the impact of any health-related incidents. Syndromic surveillance formed a key part of the daily report, and prior to the Games, its scope was enhanced; new data streams were introduced and new statistical methods introduced to detect abnormal patterns in health-care usage. A range of scenarios were developed covering the main potential incidents that would need to be detected, for instance a new strain of influenza arriving with international visitors or a localised food poisoning outbreak. 1
Background
Syndromic Surveillance is defined as the real-time (or near real-time) analysis of data to enable the early identification of potential public health threats, enabling effective public health action. 2 The HPA’s Real-Time Syndromic Surveillance Team (ReSST) provides a daily surveillance service as part of the HPA’s overall remit to protect public health. 3 In April 2013 the HPA, and ReSST became part of Public Health England (PHE).
ReSST monitors the activity of a range of syndromic indicators, for instance number of calls made to National Health Service (NHS) Direct relating to vomiting, or the number of people visiting general practitioners (GPs) with an influenza-like illness. Syndromic data were available for analysis much quicker than laboratory data and is more flexible in enabling syndromic indicators to be developed for new circumstances.
The first syndromic systems developed by ReSST used NHS Direct, a telephone helpline capturing phone calls across England and Wales, 4 and a GP system (HPA/QSurveillance) which captures relevant conditions from about one-third of patients registered with GPs in England. 5 These systems have been used for many years prior to the 2012 Games.
Two new national systems were created specifically to assist in surveillance during the Games but also to act as a legacy providing continued improved public health surveillance: an out-of-hours and unscheduled care GP system (GP out-of-hours and unscheduled care syndromic surveillance system (GPOOHSS)) 6 and an Emergency Department syndromic surveillance system (EDSSS). 7
International visitors attending the Games are less likely to use in-hours GPs’ services where patients are predominantly registered local residents. 7 The new system, GPOOHSS, utilises data collected by providers of unscheduled care, incorporating telephone advice, out-of-hours doctor consultations and walk-in centres, which patients can easily access without prior registration.
During the Games, Emergency Departments (EDs) may have also been used by visitors as an easily recognisable way of accessing health care.
Table 1 summarises the data available by system and their use during the Games.
Data available by system.
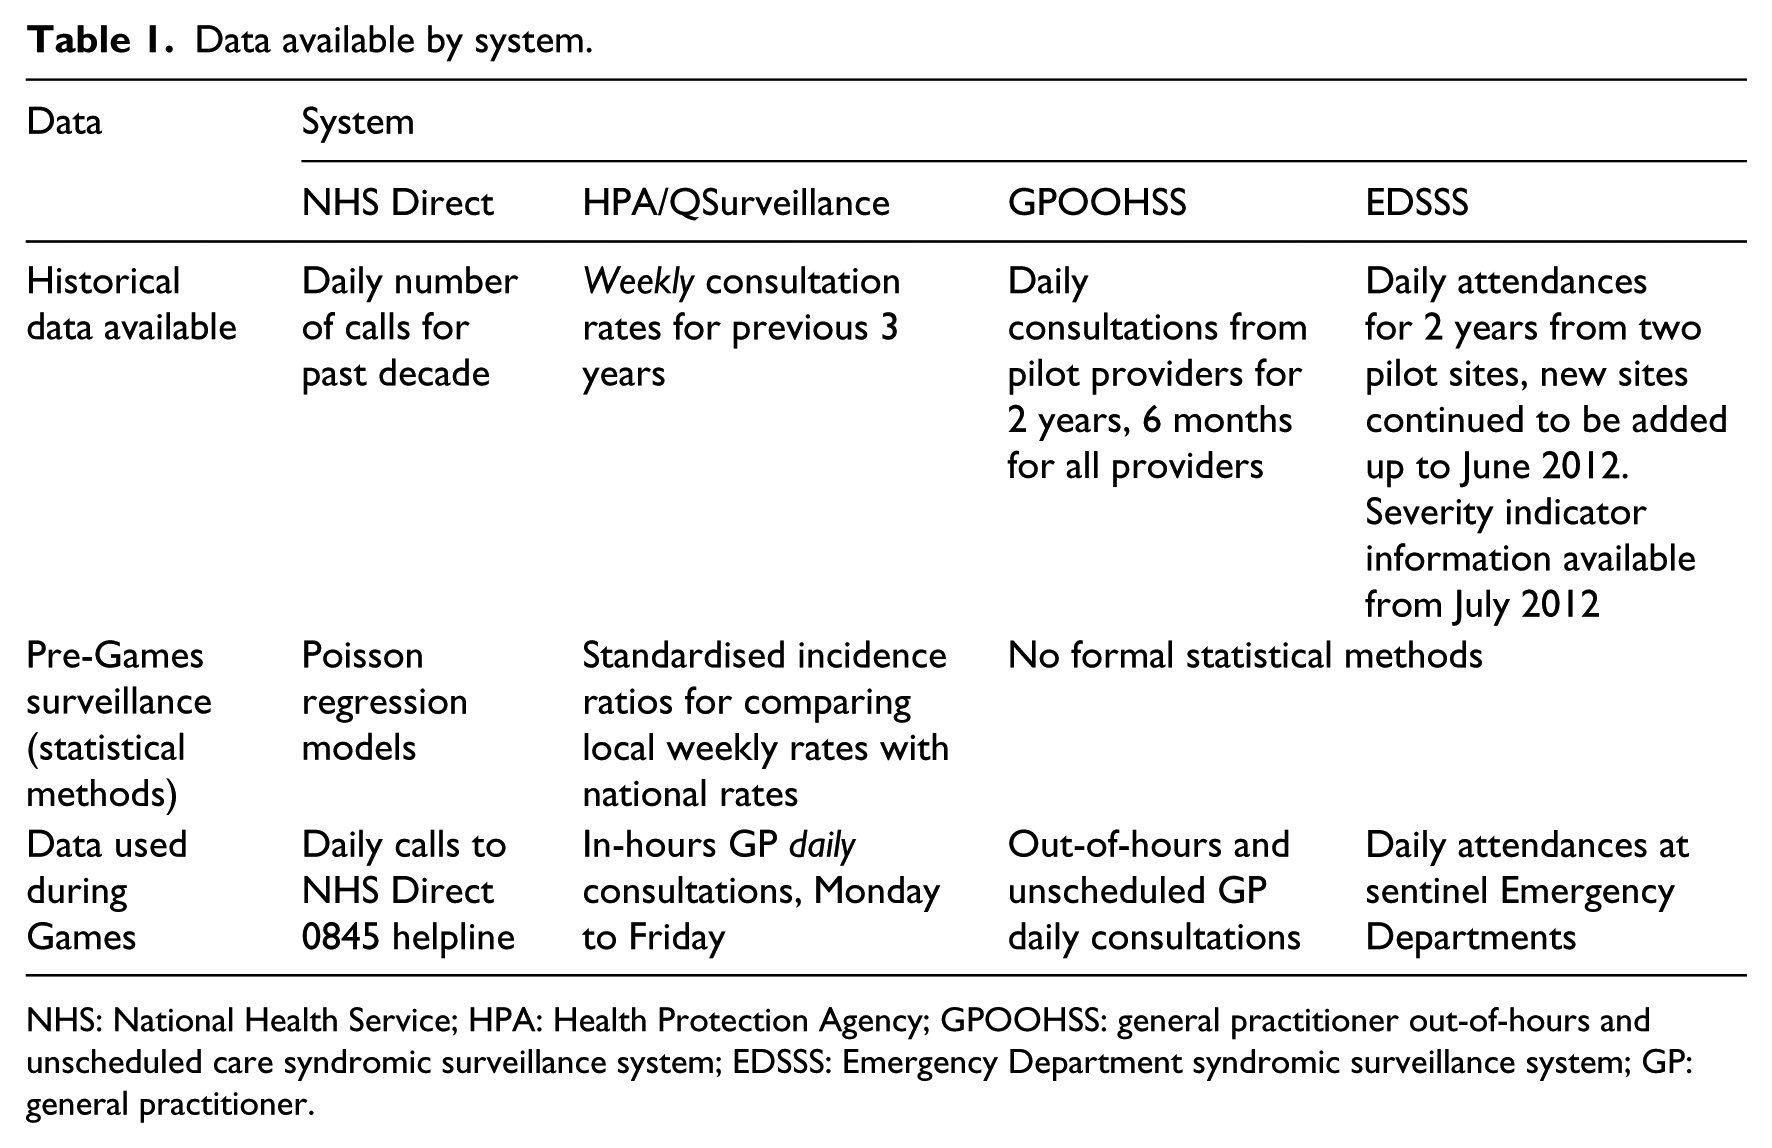
NHS: National Health Service; HPA: Health Protection Agency; GPOOHSS: general practitioner out-of-hours and unscheduled care syndromic surveillance system; EDSSS: Emergency Department syndromic surveillance system; GP: general practitioner.
Material and methods
Methods developed needed to be applied during the Games daily across a wide range of syndromic indicators and locations. Methods needed to take into account the specific data constraints and characteristics of the different systems as well as the public health surveillance requirements. The main data constraint was the availability of historic data (as shown in Table 1), while the biggest source of structural variation in the data was due to differences between weekdays and holidays.
During July 2013, more data were made available on the severity of patients’ conditions attending EDs, which enabled an extension of the surveillance system. Further refinements to the methods developed were introduced at the start of the Games period in response to an increased volume of GP in-hours respiratory consultations.
‘Signal’ data comprised either proportions or rates of consultations coded to syndromic indicators at a local, regional or national level. The statistical methods generated ‘alarms’ when a signal’s level was significantly higher than the expected baseline level. These alarms were investigated using a public health risk assessment process, involving input from a consultant epidemiologist and ReSST who issued ‘alerts’ when levels suggest a potential public health impact.
Method for systems with comparable historic data
The new method developed for the HPA/QSurveillance system was to create a baseline by comparing current activity with a 5-week rolling average from the previous 3 years, Stroup method; 8 for example, the baseline for week 30 2012 was the average of weeks 28–32 for 2009, 2010 and 2011. A 5-week rolling average provided a balance between too long a period introducing seasonal effects and too short a period having too few data points. Comparable historical data were only available for the previous 3 years; prior to November 2008, different geographical health service boundaries were used for local aggregation.
An upper threshold warning level for unusual activity was defined using a 99 per cent prediction level, that is, baseline + 2.33 × standard deviation (of baseline data) × square root of (1+1/N). N is the number of data points, usually 15 comprising 5 weeks data for each of the previous 3 years. The assumption of approximation to a normal distribution was not appropriate where absolute numbers were low, and so a minimum threshold was used where expected counts were below 3.
Consecutive weeks of data are not independent resulting in low thresholds due to occasionally very low values for the standard deviation of baseline data. A minimum value for the standard deviation was applied, using the square root of the mean.
Multiple testing problem
Separate baselines and thresholds were calculated for each syndromic indicator at each local and regional level and nationally, resulting in over 3500 GP in-hours signals to be checked daily. Due to the large number of signals, the Benjamini and Hochberg 9 method for multiple testing was used. (This method allows the user to set an acceptable upper limit for false positives while minimising the probability of missing a real increase, by ordering alarms according to their p-values.)
Greater importance was given to national and regional signals which are more likely to have a significant health impact and so a higher threshold was used when assessing local alarms.
Day-of-the-week effects
Without historical daily data, it was not possible to model the day-of-the-week effects for HPA/QSurveillance prior to the Games; GP consultation rates are traditionally higher on Mondays than on other days of the week. To enable daily reporting of statistical alarms, a rolling 7-day average of daily rates was compared to the historical weekly average; this method smoothed out day-of-the-week effects. Bank holiday effects were accounted for by rescaling weekly rates to allow for days of missed activity: Rates in current data and data used in constructing baselines were scaled up by multiplying by 5/4 during weeks with one bank holiday and 5/3 during weeks containing two bank holidays.
Smoothing baseline data
During the Summer of 2009, there was an unprecedented summer rise in respiratory indicators linked to the H1N1 influenza pandemic: This was very large and well delineated and so data from this period were excluded when creating baselines.
Early in the Games period, the HPA/QSurveillance system detected a slight rise in upper respiratory tract infections compared to previous years, which lead to a disproportionately large number of statistical alarms.
The exclusion of the pandemic data from the baselines had led to an artificial step change in the alarm thresholds resulting in many statistical alarms in July 2012 that were not the result of a significant increase in activity, but due to the decision about which weeks to include and exclude due to the pandemic. Further assessment, with epidemiological and clinical input, led to the conclusion that although levels were higher than the previous two summers, this was not unprecedented and was not of public health concern. It was decided that the alarm thresholds had been artificially reduced and so these were modified upwards.
An exponentially weighted average transformation was applied to the alarm threshold for respiratory indicators from 23 April 2012 onwards to smooth out the step changes and provide a threshold that more closely modelled usual seasonal activity. Figure 1 shows one of the alarm thresholds for respiratory illness; there is an artificial trough in the threshold during July and August corresponding to the period in which data were excluded from the baseline. The smoothing transformation was applied in mid-July resulting in a higher threshold that more accurately modelled the usual seasonal trend.
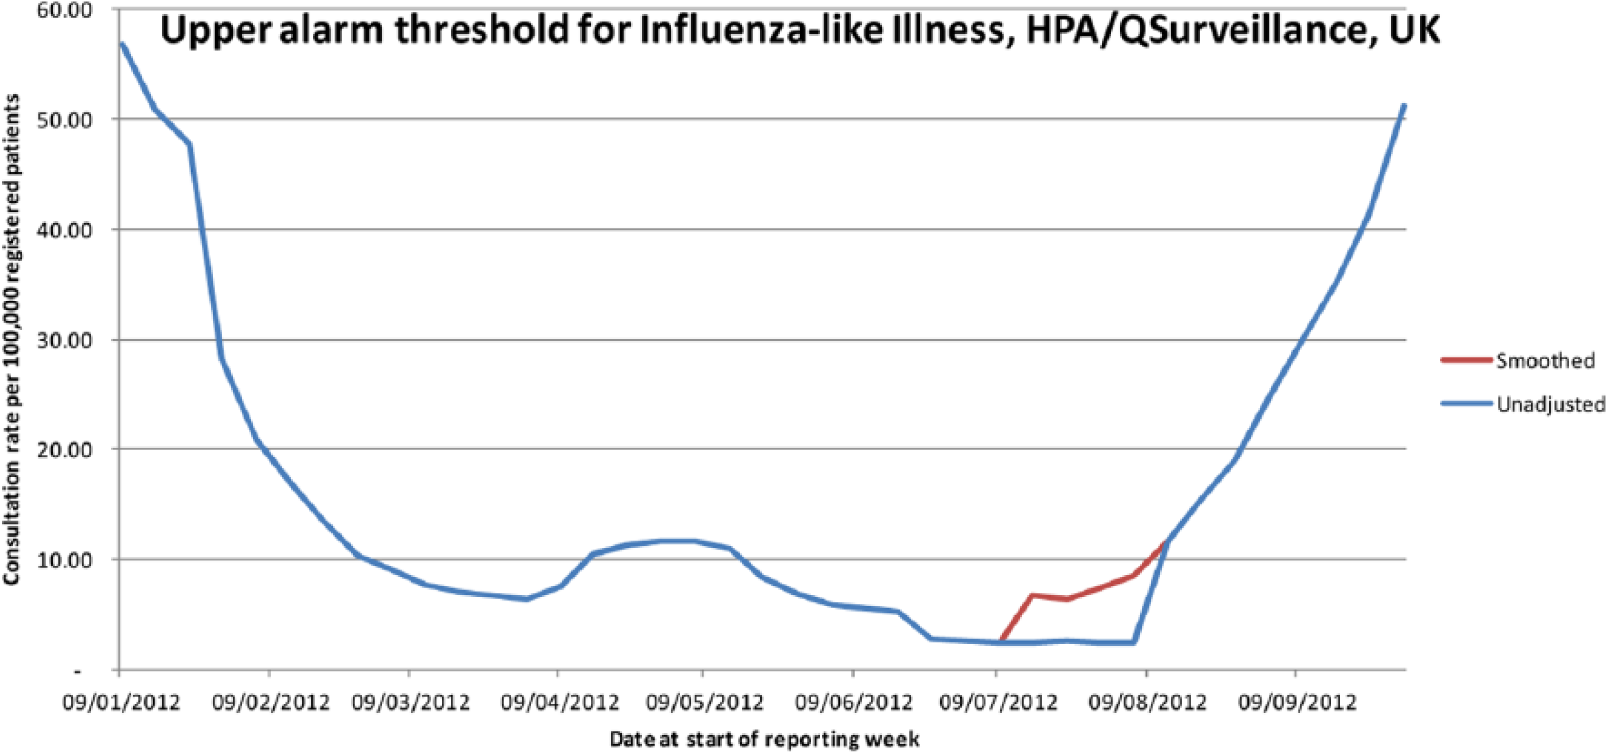
Smoothed alarm threshold for influenza-like illness under HPA/QSurveillance, 2012.
Method for systems without comparable historic data
Because the historical data from previous summers were not comparable, a Shewhart control chart approach 10 was used for the new systems, GPOOHSS and EDSSS, with a baseline based on the average of data in the previous 2 or 3 weeks. Restricting data to recent weeks also meant that seasonal effects did not need to be factored into the method.
To ensure baselines were comparable, any providers for whom data are not available on one or more days during the baseline period were excluded.
Day-of-the-week effects
As well as activity being much greater for the GPOOHSS at weekends, and on bank holidays when in-hours GP services were not available, the proportions coded to indicators varies greatly too. Figure 2 shows how daily percentages coded to acute respiratory infection are higher at weekends. Separate Shewhart control charts were generated for holidays and working days to allow for these differences.
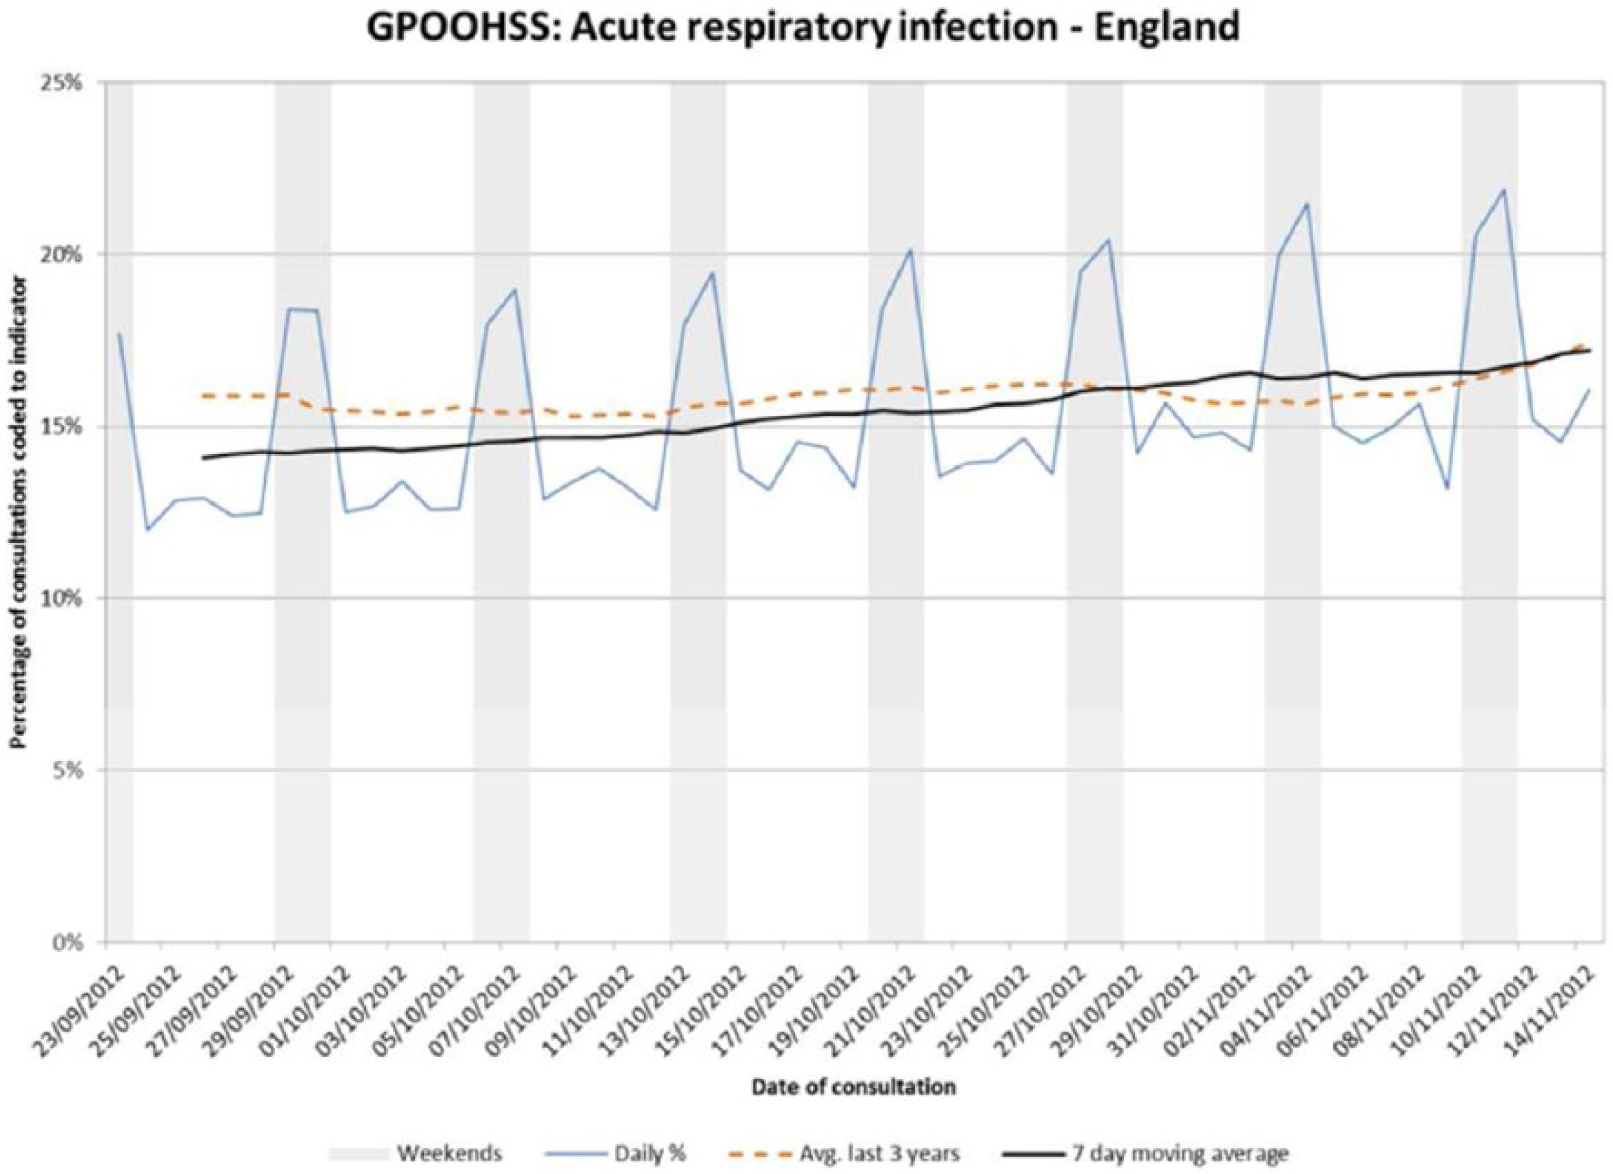
GPOOHSS daily percentages of acute respiratory infection.
All analyses were performed in STATA v12 (StataCorp. 2011. Stata Statistical Software: Release 12; College Station, TX, StataCorp LP).
Results
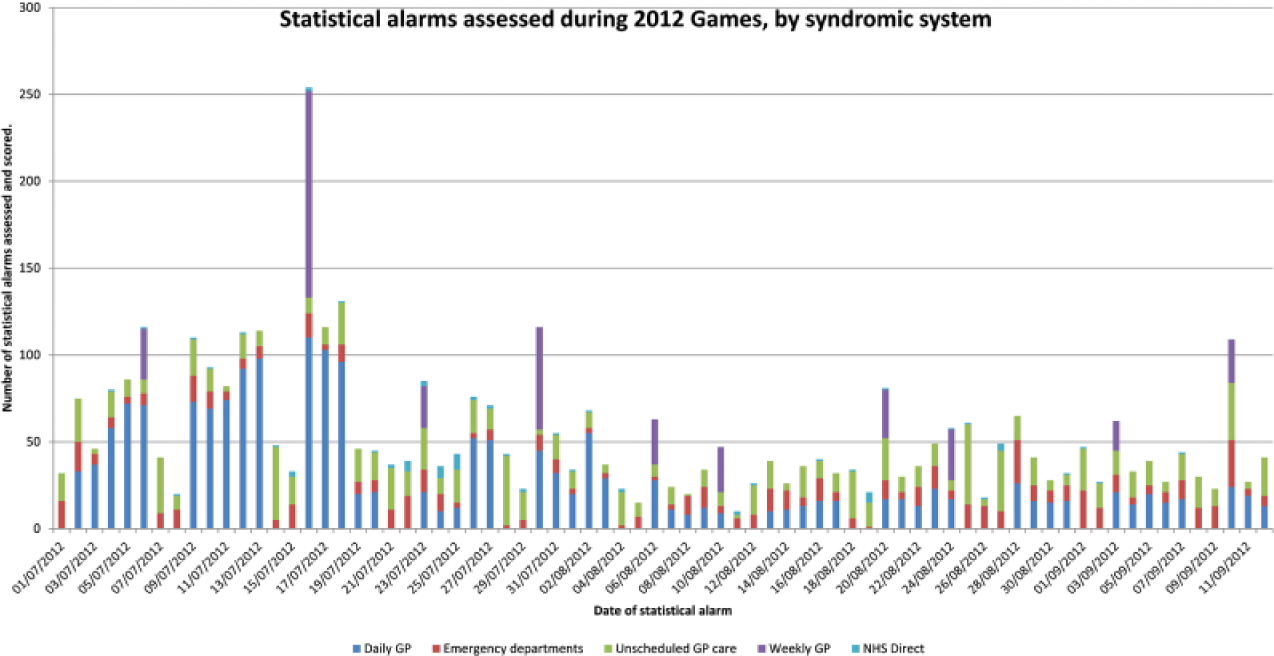
Alarm volume
During the 73 days from 2 July to 12 September 2012, 347,754 signals were tested generating 3946 statistical alarms, not including EDSSS severity signals.
Prior to the Games, it was estimated that the average number of statistical alarms generated and assessed each day would be 29 for the HPA/QSurveillance GP system, 7 for each of the EDSSS and GPOOHSS systems and less than 1 for NHS Direct. Two systems generated more alarms than expected; HPA/QSurveillance, where initially there were many more alarms due to the reasons discussed in section 4.1.1 and GPOOHSS, which generated on average 14.7 alarms a day. Table 2 shows the average number of alarms scored by system, including surveillance of weekly HPA/QSurveillance.
Number of alarms by system.
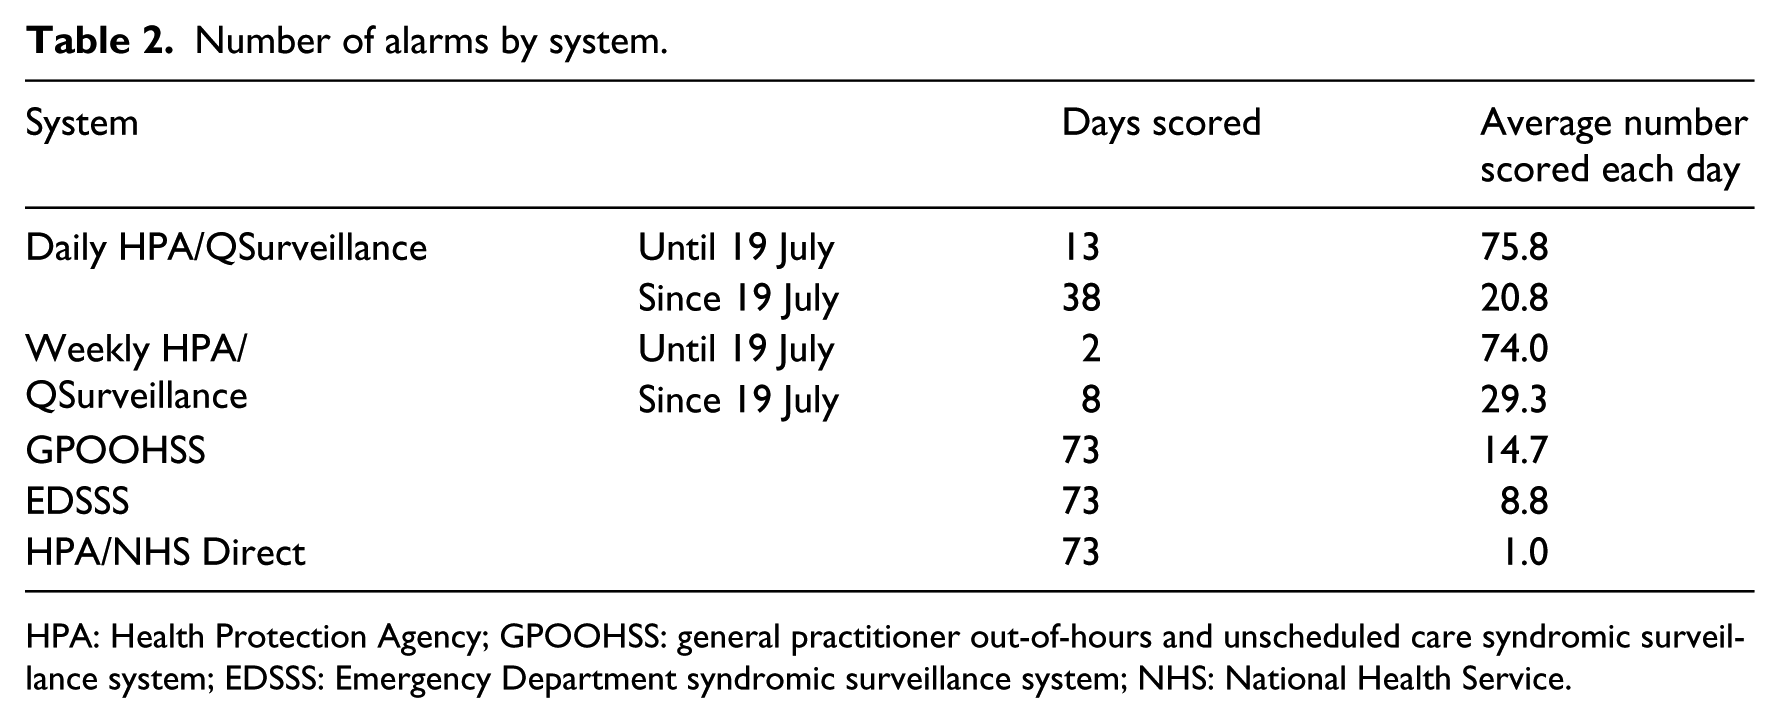
HPA: Health Protection Agency; GPOOHSS: general practitioner out-of-hours and unscheduled care syndromic surveillance system; EDSSS: Emergency Department syndromic surveillance system; NHS: National Health Service.
Public health incidents
Of the 3946 statistical alarms assessed, 207 were considered, after investigation including a risk assessment and evaluation by a consultant epidemiologist, to be of sufficient interest to be mentioned in daily reports. During the Games period, there were few incidents of public health concern and there were no major incidents. 11 Syndromic surveillance has a dual role in detecting/monitoring incidents as well as providing reassurance that no major incident has occurred. The ability to provide reassurance by reporting ‘nothing untoward found’ and being able to quantify what size of incident is detectable is a key function of syndromic surveillance. 1 Among the incidents detected by syndromic surveillance were:
Continuing high levels of pertussis (whooping cough),
An unexpected rise in asthma at the end of June,
Increased heat-related attendances following a brief period of hot weather in July.
There were some differences in the number of statistical alarms generated by different syndromes, other than those caused by verifiable increases in community illness. Some syndromes involve very small numbers which generate alarms less frequently.
The proportion of statistical alarms that resulted in the syndromic team advising other health professionals (‘alerts’) varied by system; in general, a far higher proportion came from the more established systems (Table 3).
Signals, alarms and alerts by system.
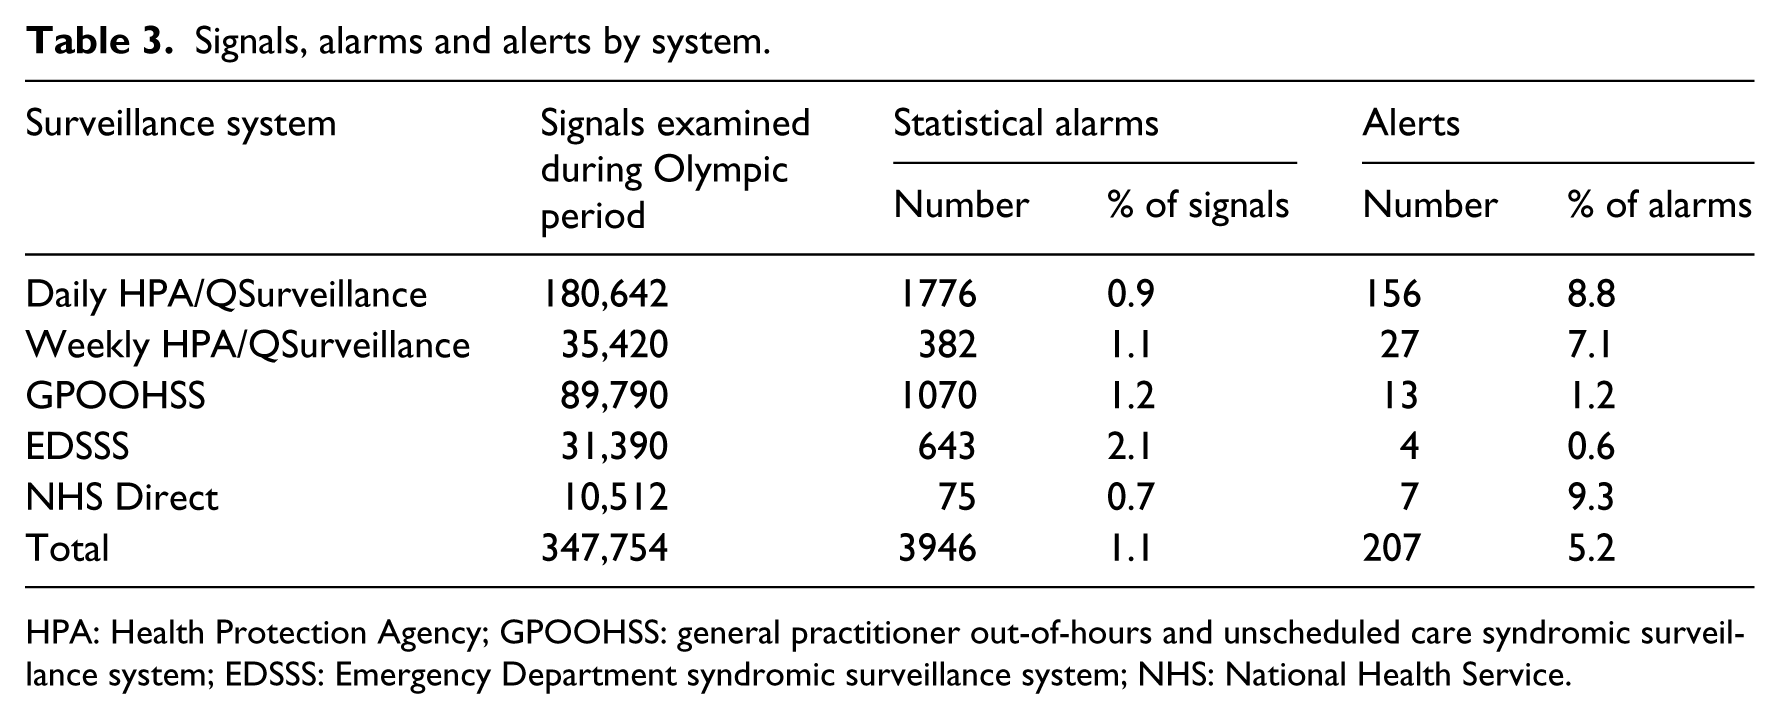
HPA: Health Protection Agency; GPOOHSS: general practitioner out-of-hours and unscheduled care syndromic surveillance system; EDSSS: Emergency Department syndromic surveillance system; NHS: National Health Service.
Local and regional reporting
The only significant differences in the number of alarms by region (using Pearson chi-square test) were for the daily HPA/QSurveillance system, where there were more alarms in South Central England and fewer in East Midlands and Yorkshire and the Humber than expected based on their populations. The two regions with the fewest alarms also had the poorest coverage, so low numbers may have led to proportionally fewer alarms.
At a local level, one Primary Care Trust (PCT) geographical area in Southern England stood out, having had 72 daily alarms via the HPA/QSurveillance system, twice as many as any other area. The reason for this outlier is unknown but may be due to a change in the GP practices contributing to the system in the PCT compared to previous years.
Day-of-the-week effects
Most systems were found to have a higher-than-average number of alarms on a Monday, although GPOOHSS had its highest number of alarms on a Saturday. Applying the ‘Kruskal–Wallis’ test 12 for ordinal data, both GPOOHSS and EDSSS exhibit evidence of significant differences between days of the week (p-values of 0.0014 and 0.0371, respectively), but none of the other systems were found to. Figure 3 shows the number of ‘alarms’ that were given a public health risk assessment (scored) by the team, by system and day of the week.
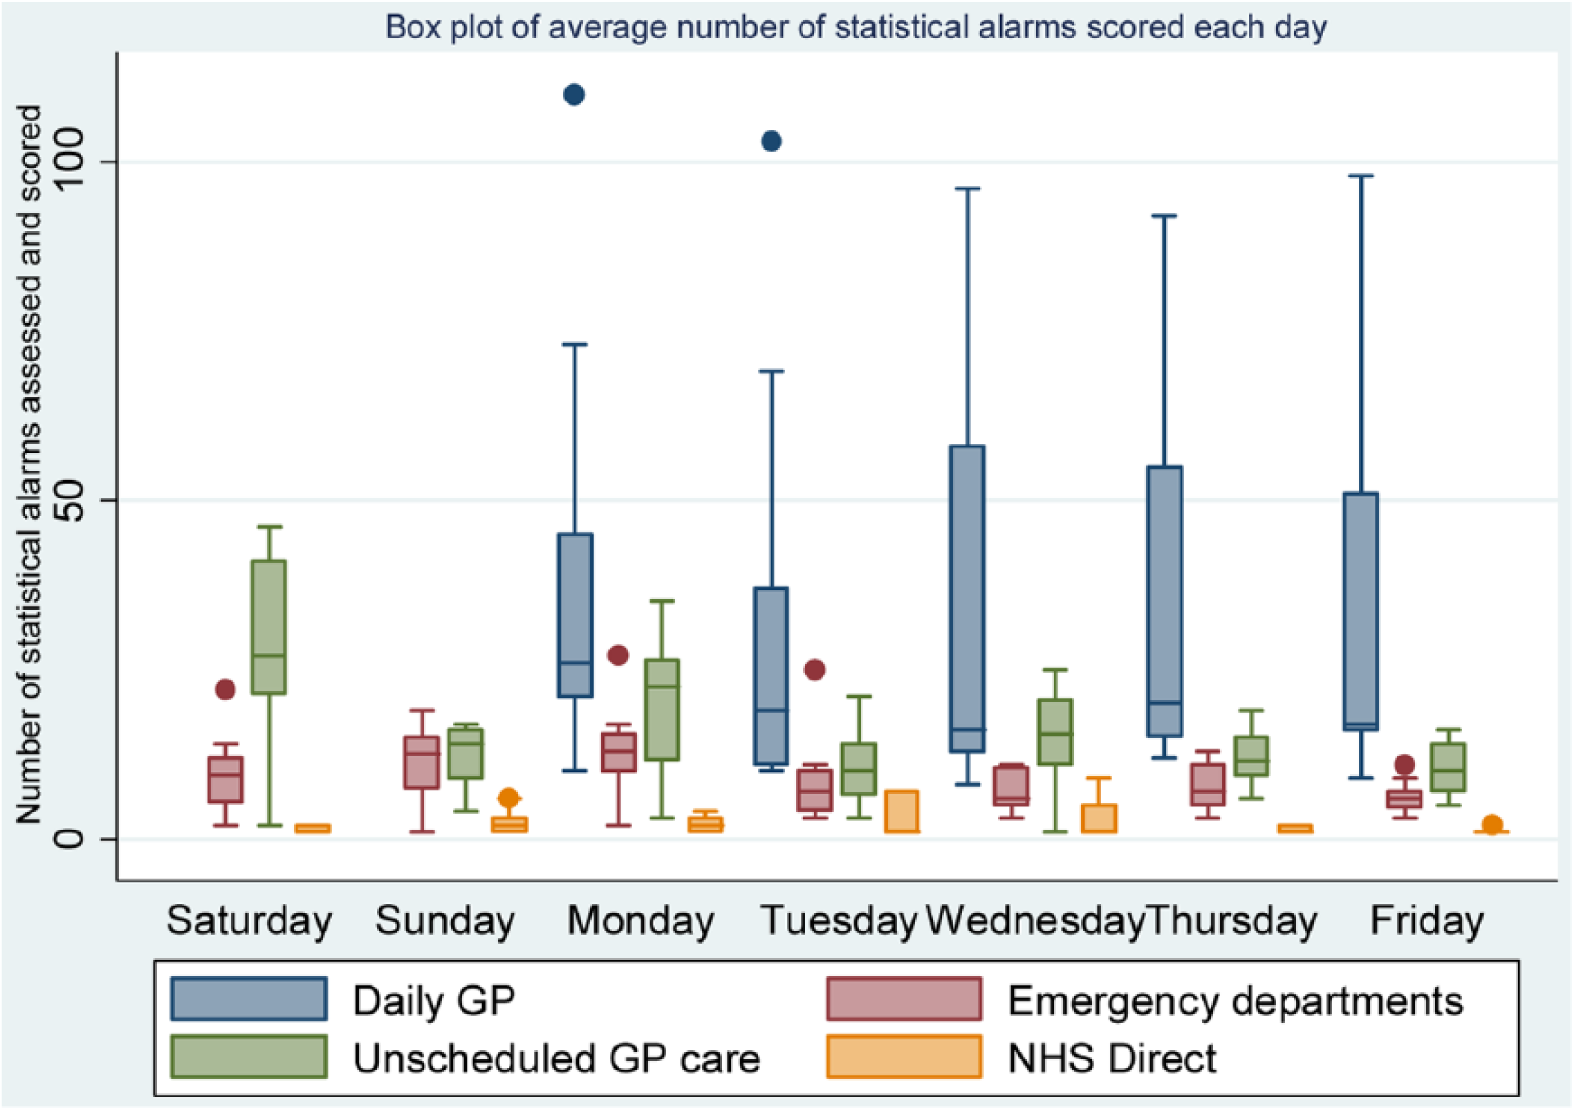
Box plot of alarms scored by syndromic system and day of the week.
The extra EDSSS alarms detected on Sundays and Mondays may have reflected extra activity seen on these days, whereas for GPOOHSS, weekend baselines were calculated separately, so the higher number of alarms on Saturdays and Mondays indicated Saturdays being busier than Sundays and Mondays being busier than other weekdays.
Discussion and lessons learnt
The different methods developed for the Games were found to produce statistical alarms at a consistent rate, averaging between 0.7 and 2.1 per cent of signals by system. Although no major public health incident occurred during the Games, alarms did correctly identify a number of increases in activity, which led to further investigation and discussion within HPA. The more established systems, which benefitted from using historical data in setting baselines, produced fewer false alarms.
During the Games, an increase in respiratory alarms for the GP system which was not accompanied by an unusual rise in activity led to a reassessment of the method used to exclude the pandemic influenza from the baseline data, resulting in a smoothed alarm threshold. The methods used were able to allow for differences between weekends and working day activity but there were still some significant differences in the number of alarms between days of the week, for example, between Mondays and other working days.
The methods developed for the Games represented a considerable increase in the volume of signals assessed daily; previously, local alarms were only assessed on a weekly basis for in-hours GP services, the Games legacy will include signals at a local level using data from EDs, NHS Direct telephone calls and GP consultations in and out of hours, all on a daily basis. Previous work does include surveillance of daily data 4 and local activity, 5 but not both, or on this scale, in the United Kingdom.
The main strengths of the methods developed were the ability to assess a very large number of signals on a daily basis, while coping with large differences in activity due to different practices on different days of the week and a growing number of sites providing data. As new sources of data become available and the number of signals grow, a more sophisticated process of prioritisation will be necessary to maintain effective surveillance.
A key limitation to this approach is the necessity of having a general approach across a wide range of syndromic indicators and locations, where the number of daily consultations coded to an indicator can vary widely from zero on most days (e.g. diplopia) to thousands per day (e.g. upper respiratory tract infection). When assessing false alarms, another key limitation is the ability to identify actual incidents, while laboratory-confirmed data can provide estimates for community incidence for some pathogens, this will not cover everything and it is possible that syndromic data are detecting real incidents that remain unconfirmed by any other source.
In future, robust methods will be developed that can be applied to all systems, which as well as making the application easier will simplify interpretation. There are different strengths and weaknesses in having methods that use either previous years’ or recent weeks’ data in setting baselines, and in future, both approaches will be applied to all systems. Historical methods can be applied to the newer EDSSS and GPOOHSS systems as more data accumulate.
Future development will also examine whether age-specific signals will provide better correlation with diseases caused by specific pathogens.
New methods will include full day-of-the-week effects not just treating working days and weekends separately as the current Shewhart methods were not found to have fully accounted for these differences.
The effectiveness of syndromic surveillance to monitor public health has been enhanced by the statistical methods developed for the Games in several respects:
Automated routines enable investigators to concentrate on investigating syndromes and locations where activity is unusually high, increasing the chance of detecting local incidents or smaller events that might by overlooked in manual surveillance.
Formal statistical tests, comparing with baseline data, improve the ability to identify whether increased activity is unusual and therefore potentially of public health concern, for example, a new emerging disease or unusually bad year for a seasonal disease-specific pathogen, like influenza or norovirus.
Statistical methods quantify the detection capabilities of syndromic surveillance. This was particularly important during the Games, when coupled with scenario planning; 1 it was possible to estimate what size of incident could be detected and how quickly detection would occur.
Conclusion
Statistical methods developed for syndromic surveillance during the Games were able to assess on average, nearly 4800 indicator signals per day, producing a manageable number of statistical alarms. The statistical methods enabled ReSST to prioritise their investigations, and combined with their epidemiological expertise, they were able to swiftly identify areas of potential public health concern and provide reassurance that no major adverse incident had occurred.
The methods proved to be robust, coping with large differences in public health usage on different days of the week, occasional changes in data availability and the influx of Games visitors, without generating large numbers of false alarms.
Systems were modified to improve syndromic surveillance as new data became available and adjusted to cope with unforeseen data issues without any break in the daily service provided.
The legacy of the Games will be improved surveillance, with a wider range of data sources and standardised robust methods and surveillance processes.
Footnotes
Acknowledgements
For the provision of routine surveillance data, we would like to thank the following: NHS Direct for the call data; Ascribe Ltd and L2S2 Ltd and staff within the respective NHS Trusts for ED data; out-of-hours/unscheduled care providers and Advanced Health & Care; and the University of Nottingham, EMIS and the EMIS practices for the QSurveillance data extraction. We would like to thank Sue Smith, Helen Hughes, Sally Harcourt, Paul Loveridge and Amardeep Bains for help with systems development, and Mike Catchpole, Brian McCloskey and Tina Endericks for help with specifying Olympic surveillance requirements and help with the development of the systems.
Declaration of conflicting interests
There are no conflicts of interests among the contributing authors.
Funding
This research received no specific grant from any funding agency in the public, commercial or not-for-profit sectors.