
Abstract
The most effective use of electronic medical records (EMRs) will result from wide-scale adoption and appropriate use of the technology—two factors that rely heavily on a system’s usability. We conducted a qualitative and quantitative usability assessment of an EMR developed specifically for treating the HIV/AIDS patient population. The purpose of this study was to inform developers on how to prioritize resources for their impending software rebuild initiative and to evaluate a dual methodology consisting of both quantitative and qualitative components. The results indicated that the methodology was valid, although there were some variations recommended for future usability assessments of EMRs. The study also underscored the need to assess usability based on user feedback and to employ multiple methods to elicit information; this research revealed many insights into the software that contradicted initial assumptions and also found that asking questions in multiple ways yielded more complete feedback.
Keywords
Introduction
In 2009 the USA passed the American Recovery and Reinvestment Act (ARRA), allocating $36 billion for healthcare information technology (HIT). More than half of that was earmarked to spur the adoption of electronic medical records (EMRs), 1 with the aims of removing financial barriers, improving patient outcomes and reducing costs of care delivery. However, to attain these goals, an EMR must effectively meet the needs of caregivers and support care processes without substantial workflow interruption. In other words, it must have a high level of usability. Evaluating EMR usability is vital to ensuring it performs as intended and for identifying areas for design improvement and development.
If implementation and design are not properly executed, there is a risk that EMRs will fail for one of two major reasons: EMRs will not be adopted at large or EMRs will be adopted but not properly utilized and will therefore be seen as a wasted investment. The first scenario is the status quo we face today. According to the Healthcare Information and Management Systems Society’s Electronic Health Record Usability Task Force, usability issues are a key reason cited for slower-than-expected EMR adoption rates in the USA. 2 The latter scenario is one fear for the future. If EMRs are implemented on a wide scale but not used appropriately or effectively, the large investment would realize too little return—both financially and clinically. Despite the need to understand EMR usability, few vendors conduct formal usability testing during design and development. 3
We conducted a qualitative study with some quantitative components to measure and improve the usability of an EMR developed specifically for treating the HIV/AIDS patient population. The object of our study was Lab Tracker, an EMR that was owned and operated by Ground Zero from 1993 until Virco Inc. acquired it in December 2009. Currently, it is used to varying degrees in HIV/AIDS specialty clinics across the USA, but the software will soon undergo a complete overhaul.
There were three main drivers behind the usability assessment of Lab Tracker. First, preliminary feedback from clinics indicated they were not using all of the system’s functionality. This seemed like a necessary point of exploration given that the HIV/AIDS population stands to gain tremendously from an investment in health information technology (HIT). In recent years, HIV has transitioned from an acute disease to a manageable, chronic disease, but still requires substantial attention and tracking of key health indicators by the physician and patient. The emphasis on biomarkers such as CD4 count and viral load make HIV/AIDS particularly suited to benefit from EMR usage, but this made understanding why sites were not using the system to its fullest extent even more confounding.
Second, an impending system rebuild meant that the software’s new owner needed to know where to focus resources. The company anticipated that users were satisfied with the system’s reporting capabilities and was planning to overhaul the graphics and interface. However, as the company found, without confirming their assumptions, developers risk wasting significant resources by altering parts of the system that users feel work well and ignoring the areas that users feel warrant a rebuild.
In addition, despite Lab Tracker’s origination as a tool for physicians to help patients understand and manage their care, it also has evolved as a useful reporting tool at the population level; the EMR aggregates data for government reporting requirements. This is a crucial component of what the HIT investment aims to achieve, as it is only through the analysis of these large-scale data sets that we can begin to identify areas to improve care delivery and quality and reduce costs. The usability assessment provided a crucial opportunity to review this system’s data aggregation capabilities.
Our assessment shed light on the real world usability of the EMR, provided clear directives for the comprehensive redesign and also yielded valuable lessons about the process of conducting a usability assessment itself. This article addresses all three issues.
Research methods
Sample selection
The study involved field research in a purposeful sample of five HIV clinics across five unique US cities. For maximum variation in our sample, we aimed to include at least one clinic from each of five levels of system usage: low, low-mid, mid, mid-high and high. In addition, we selected a wide-ranging sample in terms of location and size; our sample included a geographically diverse group of sites in California, Indiana, Maryland and New York with staff sizes of 2–30 and patient loads of 270–1100 (see Table 1 for site demographics). There were no specified exclusion criteria.
Site demographics
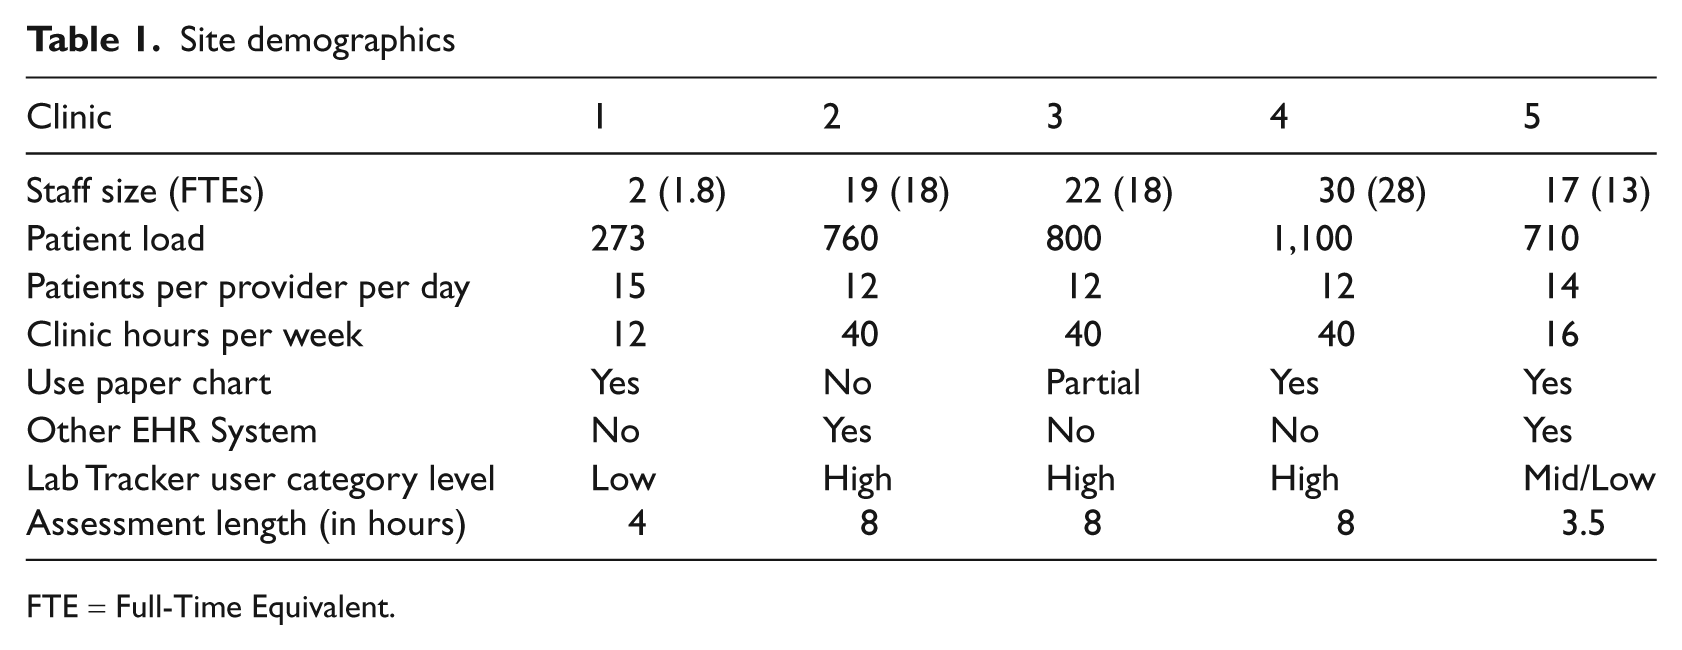
FTE = Full-Time Equivalent.
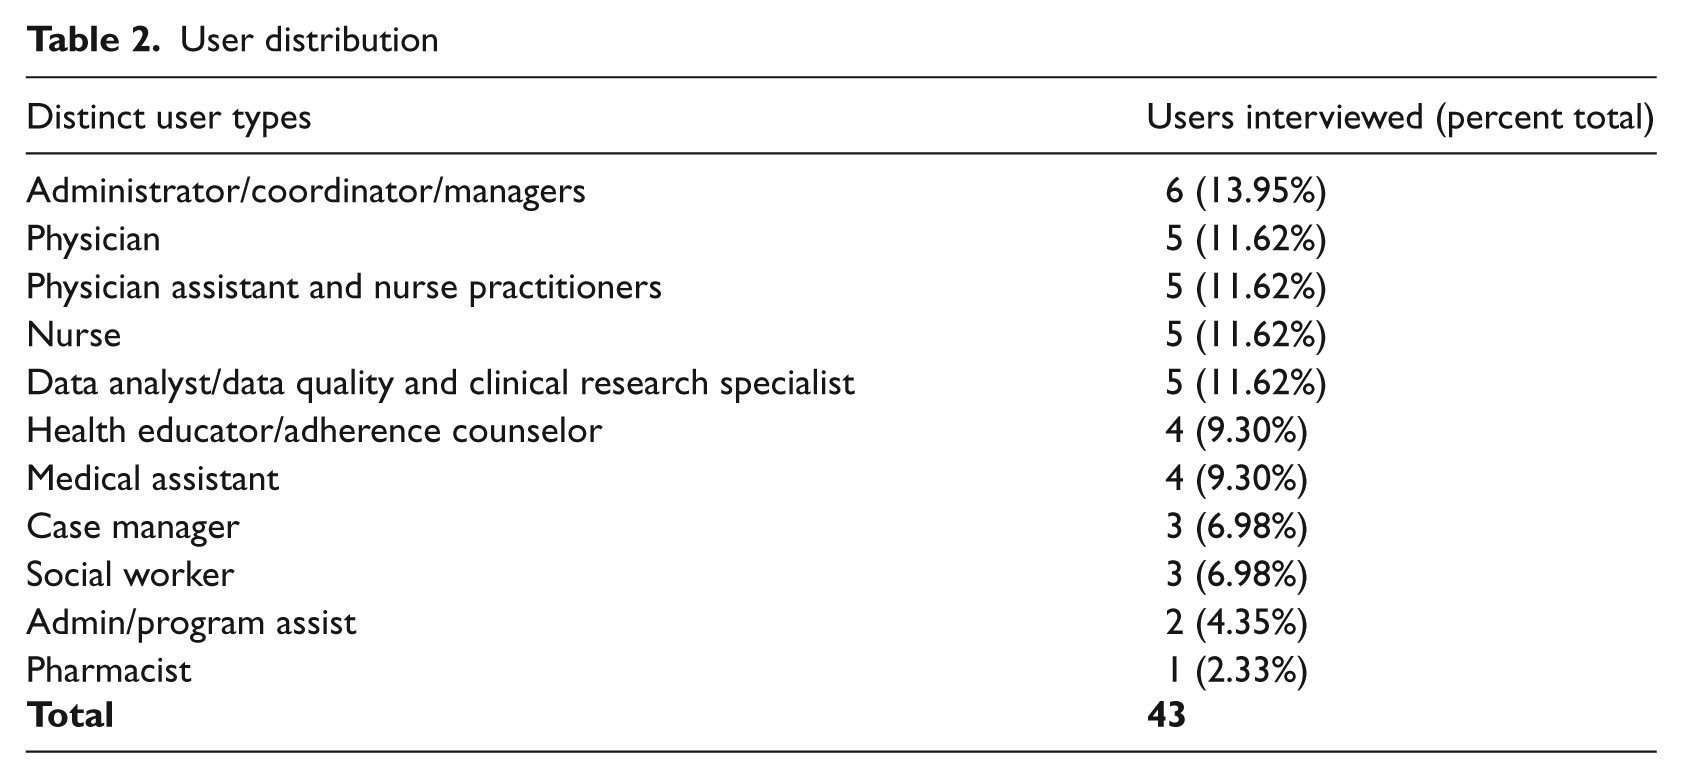
To achieve maximum variation among individual users, we selected a sample to include a range of profile types at each clinic. We defined user type by individual roles (e.g. physician, nurse, analyst, etc.). We aimed to interview five individuals in each user category, as this is the target sample size to uncover most important usability issues. 4 Overall, we conducted 43 interviews across staff categories; interview subjects had titles ranging from medical assistant to medical director. The only inclusion criterion for the interviewee was that he/she had to use the EMR system in some capacity, regardless of experience level (see Table 2 for a distribution of distinct user types).
User distribution
Evaluation tools
We developed a Usability Study Evaluation (USE) Tool to gauge the usability of the EMR in HIV outpatient settings. The main goal of the evaluation was to benchmark user experiences for the legacy system in order to inform decisions about the next generation of the software. It is widely understood that one of the best ways to create systems and products that meet users’ needs is to incorporate direct user feedback throughout the development lifecycle.5,6
The USE tool was a combination of existing and self-designed instruments, developed specifically with the usability recommendations of the Agency for Healthcare Research and Quality (AHRQ) in mind and tailored in light of the recently released meaningful use guidelines. With a mixed-method, between-subjects design, the tool incorporated a variety of channels to collect data: self-designed semi-structured in-depth interviews (IDIs), a written survey and an online questionnaire.
The IDIs involved a series of open-ended questions to facilitate discussion. For each user participant we asked six background questions (about the user’s role, historical experience with EMRs, usage level and purpose for using the EMR under study) and conducted an IDI of 11 questions about his/her feelings on the EMR (likes, dislikes, value-add to workflow, preferences, thoughts for redesign, etc.). For each site, one staff member was designated as site host—typically an administrator who managed the EMR or worked intimately with the reporting elements of the system. This site host participated in an extended IDI made up of an additional 17 questions designed by the authors, which yielded a description of the clinic as a whole and the clinic’s use of the EMR. It was semi-structured in nature to allow for flexibility, new and follow-up question generation, and freedom to vary the order or context in which questions were answered. A list of IDI questions can be found in Appendix A.
Next, all respondents were given a paper and pencil general software usability survey. We developed the evaluation tool to address eight pertinent categories of usability and design based on the Multiple Heuristics Evaluation Table (MHET) by Wheeler-Atkinson et al. 7 The eight categories are: software user interaction, learnability, cognition facilitation, user control and software flexibility, system-real world match, graphic design, navigation and editing, and consistency (although we merged navigation and editing with consistency). The tool included 57 statements that the user scored on a five-point Likert scale from ‘strongly disagree’ to ‘strongly agree’. We incorporated skip-outs for irrelevant statements based on system use and staff role. Some statements were adapted from the Certification Commission for Health Information Technology 8 and others were designed by the authors but based on the EMR-specific design principles outlined by AHRQ. 9 A list of questions can be found in Appendix B.
Finally, users in our sample were asked to complete an online general software usability questionnaire. We used the Computer System Usability Questionnaire, 10 which has 19 statements that the user must score on a seven-point Likert scale from ‘strongly disagree’ to ‘strongly agree’. This was given in addition to the pencil and paper general software usability survey because it could be completed independently and returned via email.
We aimed to concurrently perform a usability assessment using a think-aloud protocol of direct observation of real-world scenarios but, for many of the clinics, this was not feasible. Many clinicians feared that direct observations would not account for Health Insurance Portability and Accountability Act (HIPAA) privacy regulations. In contrast, the survey methodology worked best within the constraints of clinician time and workflow. We found that some approaches that are accepted in theory and the laboratory are not viable in practice and therefore focused on the other activities that were highly effective at obtaining clinician feedback in the field.
Analysis
The authors collected quantitative data from the written and online survey, organized it by site and tabulated and calculated the mean and standard deviation for each statement. Negatively worded questions were reverse coded to match positively worded questions so results could be aggregated. Survey statements with non-neutral (defined as a score other than a three on a five-point scale or a four on a seven-point scale) averages were reported as positive or negative aspects of the EMR.
Authors reviewed and organized qualitative data derived from extensive notes produced during all interviews. Notes were cleaned for irrelevant information, codified and analyzed for usability themes within and across sites.
Results
Interview subjects and their EMR usage
The users were all relatively experienced with the EMR at the time of the interview; the mean length of time using the system was 3.52 years, with a standard deviation of 2.45 years. Ninety-five percent of users interviewed reported using the EMR all day, every day. Many said it was the first program they initialized upon starting their workday. The majority were using the EMR for clinical data capture (92%) and retrieval (96%), whereas only 31 percent reported using the EMR for running aggregate data reports.
Clinician response
All five hosts filled out the questionnaire and 43 users completed the in-depth interview. All 43 received the written and online surveys, but only 34 users completed the written survey and 24 users completed the online survey. No users completed the think-aloud protocol.
Categories of usability and design
The concepts of usability were organized into manageable and measurable categories. We used Wheeler Atkinson et al.’s eight categories of usability and design, 7 but the categories’ designations are secondary to their ability to achieve the specific study aims. 9
Overall system usability
Overall, users felt satisfied with the ease of using the EMR system. On a 7-point scale, the average rating for overall satisfaction was 5.5 and simplicity of use was 5.58.
Furthermore, users indicated that the EMR was highly supportive of both their individual tasks (4.66 out of 5) and collaboration between individuals within the clinic (4.45 out of 5). This is indicative of the EMR’s ability to match with the real-world team environment of healthcare.
Software user interaction
Software user interaction refers to the design characteristics that directly support user-system interaction. To rate user perception of this function, we asked about the display’s intuitiveness, the system’s support for tasks performed by individuals and between individuals (i.e. shared tasks), and relevance of information displayed at proper times. We asked clinicians about how they integrated the system into their workflow. For instance, we collected data on whether or not the system was used during or after the physician-patient encounter and what specific functions were accessed at different points along the encounter. We calculated a mean score for all users across all sites (3.68 out of 5, with a standard deviation of 1.07). In addition, we calculated a score for each site. All sites scored positively with results ranging from 3.37 to 4.16 (see Table 3 for the usability scores of individual sites).
Usability scores
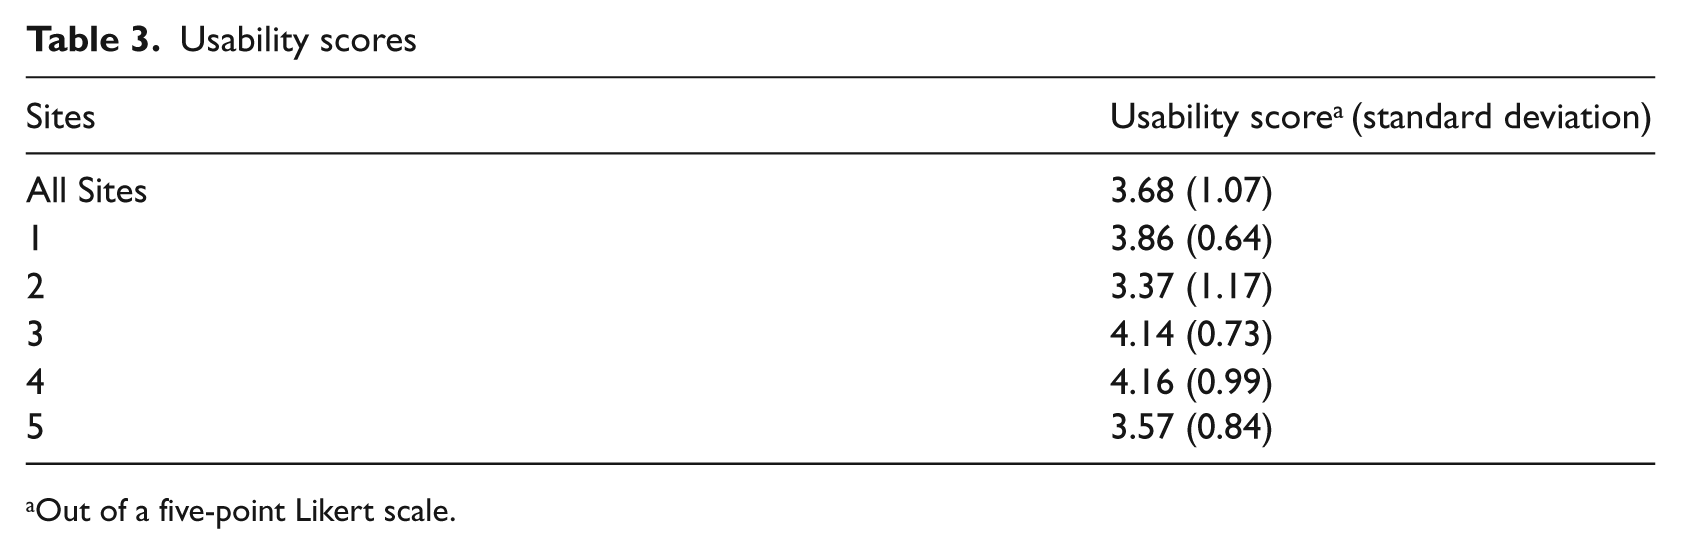
Out of a five-point Likert scale.
We also asked follow-up questions to understand reasoning behind certain decisions. For example, a physician’s failure to use the system during an encounter may be related to poor software-user interaction, such as difficulty locating needed information. Alternatively, it may be unrelated to the system itself and based on dislike for the placement of the computer in the exam room, for example.
Learnability
Learnability refers to the software’s ability to minimize the learning curve associated with use; it speaks to the system’s intuitiveness. This study asked about the resources required for training, ability to self-learn, rates of ‘quitting’ or avoiding the system because of difficulty and reliance on coworkers for help. Overall, users reported that it was easy to learn the system.
However, there was a discrepancy between the learnability results from the survey and questionnaire and the IDI results. Responses to the statement ‘It was easy to learn this system’ from the online questionnaire resulted in an overall positive average score (5.96 out of 7). Responses to the written survey questions on learnability were neutral-to-positive, but overall indicated that the system was easy to learn, did not require extensive training for everyday use and users rarely needed to ask for help.
However, IDIs shed light on the difference between learnability for data capture/retrieval and for running reports. On one hand, users reported having received little-to-no training on the system and were still able to use the system easily for data capture and retrieval. On the other hand, users reported that it was more difficult to learn how to run reports on aggregate patient data and, as a result, clinics had a designated data analyst responsible for this function.
Cognition facilitation
Cognition facilitation refers to the cognitive load experienced when using the system. Respondents rated how well the display enabled users to interpret information, gauging the organization of information to minimize bouncing back and forth between pages, the accuracy of field and section headings and the appropriate prioritization of data. Results indicated neutral-to-positive attitudes about the EMR’s cognitive facilitation. Most users did not think Lab Tracker was cluttered and could access relevant patient information. However, the IDIs indicated specific instances where the EMR did not align with the order in which users needed to accomplish tasks or did not display information appropriately.
User control and software flexibility
User control and software flexibility refer to the extent that users feel in control of the system and can tailor it to meet their needs. This study asked about the desire for additional free text space, the display’s adaptability to the individual patient and tailor ability. Results indicated neutral-to-negative attitudes about the EMR’s user control and software flexibility. IDIs revealed there is a difference in the level of flexibility desired from administrative users versus clinicians, because they have very different expectations for the system. Clinical users wanted more flexibility to alter fields and make other changes to meet their individual needs. However, users that manage and aggregate data sought tighter control over what other users could do with this system to minimize redundancies and support data integrity. More often, managers and administrators wanted to modify system functionality at the site level. For this reason, it is especially relevant to have a diversified sample of users.
System-real world match
System-real world match indicates whether the EMR accurately and logically represents care delivery in the real world. For instance, is the information presented to naturally align with the expectations and previous knowledge of the user? Is terminology appropriate and are icons consistent with user practices? Study results indicated neutral-to-positive attitudes about the metric. Users agreed that the terminology, units and icons were appropriate. Respondents especially appreciated the specificity with the HIV/AIDS specialty.
Graphic design
Graphic design refers to the color, layout, placement, readability and use of text, numbers and symbols, which all contribute to the user’s ability to accurately interpret and use the interface. Results from the survey and questionnaire indicated a positive attitude about graphic design, but users placed little-to-no emphasis on this category in the IDIs, indicating that it was not a concern.
Navigation, editing and consistency
Wheeler Atkinson et al. 7 separate navigation and editing from consistency. Navigation and editing refer to the system’s ability to support the user’s mental model and allow for easy reversal of actions. Consistency relates to uniformity across all screens and functions, which is important for reducing the effort required to navigate the system, locate necessary links and information, and interpret details. We combined these two categories because consistency is such a crucial and significant component of navigation that it cannot be separated. Specifically, we asked about efficiency of the click-through process, accuracy of field labels and consistency of navigational hierarchy. On average, users responded positively when asked whether the site was easy to navigate and overall results indicated a neutral to positive attitude about the editing and consistency. The complete breakdown of mean responses to survey statements by usability and design category can be found in Table 4.
Mean responses to survey statements by category
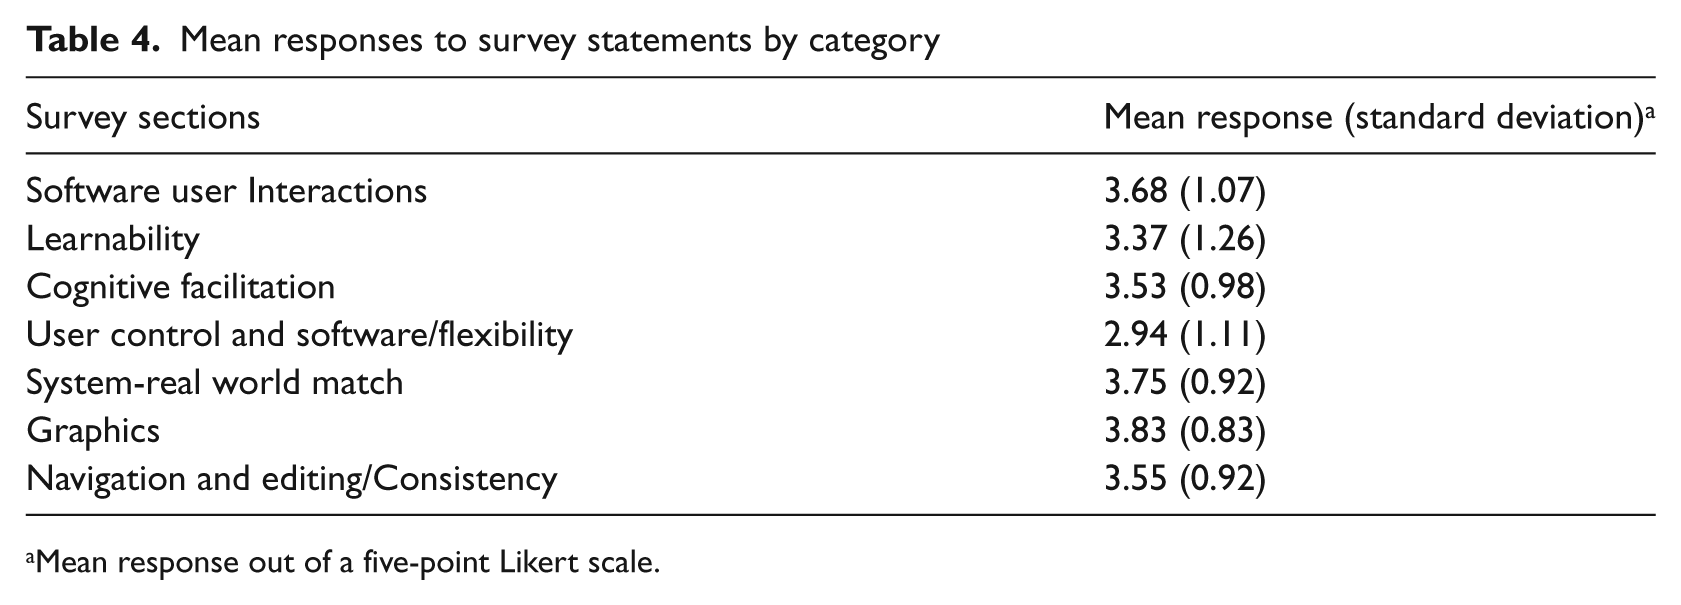
Mean response out of a five-point Likert scale.
Discussion
Usability assessment methodology
The results outlined above, although specific to the EMR under study and valued for its intrinsic interest, have provided some important lessons about the methodology of a usability assessment.
Quantitative data in conjunction with qualitative data
It is beneficial to leverage mixed methodologies that include complementary quantitative (e.g. surveys and questionnaires) and qualitative components (e.g. IDIs). IDI provides more detail and nuance than quantitative results. For example, when asked about learnability on the surveys, people responded favorably. However, we later realized from our discussions that they were answering the learnability questions based solely on what they do every day, disregarding what they failed to learn. So an individual who only uses the system for data capture and retrieval provided ratings based on those functions only, ignoring the idea that they do not run reports because of learnability issues.
Conversely, the quantitative data provides objective, numerical support for more subjective assessment of the IDIs. This reduces the risk that a few stronger opinions will dominate the analysis. In addition, qualitative data helps spawn new hypotheses and themes.
Directed questions versus open-ended questions
While open-ended questions are preferable to elicit a detailed conversation, in some portions of this study more directed questions may have been useful. For instance, when asked open-ended questions about negative experiences, users often had trouble distinguishing between operator errors, the clinic’s server or IT infrastructure issues and glitches with the EMR system itself—issues that were irrelevant to the design and structure of the EMR.
Additionally, when asked what they would like to see in future versions of the software, many users could not envision what they did not already know to exist. Those users who were more versed in EMR features were able to develop a list of innovative ideas, but from others we simply received nuanced answers about fixing current glitches.
Difficulty assessing ‘live’ conditions
We were unable to complete the walk-through ‘think aloud’ portion of the study for various reasons. First, many users were not comfortable with our exposure to live patient data, despite the fact that we were covered under a HIPAA business service agreement. Therefore, at some sites we did not operate with the EMR on screen and relied on user descriptions. For most sites, however, users demonstrated on dummy data to avoid exposure of personal health information. In some situations, users were able to walk through some simulated tasks with test cases using a think-aloud approach, but often they could not replicate certain glitches and issues with the software.
Second, it proved increasingly difficult to attempt a walk-through without being disruptive to the clinic or an annoyance to the patients. Thus, we had to learn about the integration of the EMR into workflow via conversations in a conference room after a brief clinic tour, instead of observing it first-hand.
Categories of usability and design
Overall, the categories of usability and design were effective, with one exception: user control and software flexibility. Results from the IDIs highlighted the need to emphasize the difference between software flexibility and user control. We treated this as one category and asked questions accordingly. However, distinct types of users understood this category differently. Administrative users, such as data analysts, wanted more control to limit clinical users’ ability to alter the structured fields and to set mandatory fields for users. Clinical users wanted more free space for notes to accompany structured fields.
The category should be divided. User control should refer to the system’s tailorability to meet specific user needs. Software flexibility should refer to the extent users feel it can be tailored to meet the organization’s needs as a whole. Part of the consideration when evaluating software flexibility should assess administrators’ ability to restrict user control.
The EMR: Lessons learned
A specialty EMR must work twice as hard as a more universal, comprehensive EMR. It must provide the full range of functionality, while offering the specialty service that is beyond the customization ability of its comprehensive counterparts. Similarly, it must be an indispensable reporting tool for grants and disease management. Along these lines, a specialty EMR must keep up-to-date with all the reporting requirements to ensure availability of the appropriate and necessary fields.
The in-depth interviews revealed several themes on improvements for future development that can be universally applicable to other disease-specific EMRs.
All users agreed that redundant data entry should be eliminated as much as possible. There was no preference as to whether or not this is done on the back end, by eliminating all repeat fields, or if the fields remain in duplicate but are linked to auto-fill when one field is completed. Similarly, they would like to see auto-filling as much as possible. For instance, if a user enters in a positive reading for a tuberculosis test then ‘latent TB’ should auto-populate as one of the diagnoses.
Clinicians wanted to see a clinical research support component of the EMR. An ideal scenario would allow a research coordinator to set parameters by which eligible potential study subjects are identified and then physicians are alerted to their eligibility status and can discuss the subject during a clinic visit.
In terms of reporting capabilities, clinicians would like to have an integrated tool that produces graphs or charts for some basic quality indicators in order to eliminate the need to export data to other programs. This would make queries and reports for basic measures more accessible to different users with various computer skill levels. Clinicians’ need for more robust reporting functionality is consistent with the findings across the industry. 11
Improvements in the reporting and querying capabilities boil down to the EMR’s ability to produce a denominator. For quality improvement purposes, users need to be able to extract a ratio from the data to determine how many patients should have received a particular service versus how many patients actually did, to highlight what hasn’t been done. The current version of the software produces reports about what clinicians have completed, but is less adept at reporting on what hasn’t been done, which is ultimately what is needed.
Finally, specialty-specific EMRs will not be operating in isolation for much longer as more institutions bring in electronic charting for their larger patient populations. As a result, facilitating interfaces with institution-wide software will be a key component to the usability of a specialty-specific EMR.
Limitations
There were a few limitations to our study. First, we used a purposeful sample somewhat based on clinics’ likely willingness to participate, which may have introduced selection bias. As a result, the users interviewed for this study may be more enthusiastic about the software than the average user.
Second, there were some communication difficulties. Each clinic presented a different environment with which the user expected the software to interact. As assessors, it was imperative for us to understand the complete workflow so that we could evaluate the use of the system within its surroundings. Users were not always clear in communicating the aspects surrounding the software that helped us grasp their exact intentions for using the system in a particular way.
Conclusion
The study showed that the EMR was user-friendly for most day-to-day tasks, such as data capture and retrieval, but needed significant improvement from the standpoint of extracting aggregate data and reporting—functions that are especially important because of the clinics’ reporting requirements for public health funding. In addition, there was a great need for substantial improvement in terms of interoperability with other IT systems, something that will be further complicated as more clinics continue to implement additional IT systems, as well as a trend that is likely generalizable to other specialty-specific records.
These outcomes were valuable because they contradicted the assumptions of the technology vendor going into this project, and may materially change the company’s development strategy. Prior to the study, the vendor was under the impression that the reporting capabilities of the system were in little need of upgrading and they planned to invest in overhauling the graphical user interface. The study showed that, in fact, the opposite was true. Users were pleased with the graphical user interface and identified only a small number of instances where graphic upgrades were needed to address minor workflow and cognitive load issues. However, the assessment revealed that the most important changes would come from updates to the system’s reporting capabilities. This revelation underscores the need to thoroughly examine usability and experience at the user level. Doing so enables the vendor to base business decisions on structured evaluation rather than assumptions, which ultimately lends credibility to investment decisions towards change. Additionally, usability assessments are beneficial for the users themselves because it will ensure that the system will be designed to fit their needs.
Footnotes
Appendix A
The following questions pertained to the clinic as a whole and were directed at our site host. They were asked once per site and designed to be open-ended to let the interviewee share as much information as possible.
We also asked for a copy of a sample hospital report that came from the system under study.
Questions addressed during one-on-one in-depth interviews with all users.
Appendix B
Each of the following statements was scored on a five-point Likert scale from “strongly disagree” (1) to “strongly agree” (5). There was also an option for “not applicable.” The binary yes/no questions were used to direct users to skip over certain statements that would not apply to their role.
If yes answer questions 15-20. If no skip to question 21.
During a physician-patient encounter…
Skip questions 21-22 and go directly to question 23.
The physician does not use the system during a patient-physician encounter…
Acknowledgements
The authors wish to acknowledge Annie Alley for her assistance in preparing the manuscript.
Funding
This study was supported by a grant from Virco Lab, Inc. Virco did not participate in the design, conduct or analysis of the assessment, nor were they involved in the approval of the manuscript for publication.