
Abstract
Interactive mapping and spatial analysis tools are under-utilized by health researchers and decision-makers as a result of scarce training materials, few examples demonstrating the successful use of geographic visualization, and poor mechanisms for sharing results generated by geovisualization. Here, we report on the development of the Geovisual EXplication(G-EX) Portal, a web-based application designed to connect researchers in geovisualization and related mapping sciences, to users who are working in public health and epidemiology. This paper focuses on the design and development of the G-EX Portal Learn module, a set of tools intended to disseminate learning artifacts. Initial design and development of the G-EX Portal has been guided by our past research on the use and usability of geovisualization in public health. As part of the iterative design and development process, we conducted a needs assessment survey with targeted end-users, which we report on here. The survey focused on users’ current learning habits, their preferred kind of learning artifacts and issues they may have with contributing learning artifacts to web portals. Survey results showed that users desire a diverse set of learning artifacts in terms of both formats and topics covered. Results also revealed a willingness of users to contribute both learning artifacts and personal information that would help other users to evaluate the credibility of the learning artifact source. We include a detailed description of the G-EX Portal Learn module and focus on modifications to the design of the Learn module as a result from feedback we received from our survey.
Keywords
Introduction
Here, we report on our efforts to design and develop a web-based dissemination environment called the GeovisualEXplication (G-EX) Portal to support learning about, and collaboration with, geovisualization and spatial analysis tools. Our target audience includes health researchers as well as policy-makers at local, state, national and international agencies who have relied, historically, on training manuals and in-person workshops/courses for learning new tools and techniques. Geographic visualization (‘geovisualization’) involves the interactive exploration of geographically-referenced information graphics in order to prompt visual thinking about complex geographic patterns and processes. 1 As a field of research and practice, it involves much more than the term ‘visualization’ may imply; specifically, core developments in geovisualization over the past two decades have focused on the integration of visual, statistical and computational methods to support knowledge creation with geographically-referenced data and information.2,3 In epidemiology, and related health analysis work, visual thinking (facilitated by visualization tools) can inform decision-making regarding the etiologic investigation of disease incidence, deployment of limited public health resources and adoption of public health policies. 4 Geovisualization allows researchers and decision-makers to ‘see’ behaviors and characteristics of geographic phenomena otherwise unseen, prompting discovery of patterns and relationships that were previously unknown.5–7
Geovisualization tools should positively augment health data analysis, but such tools are under-utilized in the health research community owing to lack of access to tool training, a lack of good examples that demonstrate the successful use of geovisualization (in journal publications or in other sources) and clumsy (or non-existent) mechanisms for collaborating with, and about, geovisualization tools and techniques. In addition, geovisualization tools and techniques often present barriers to immediate use as they can appear to be complex for new users and require some familiarity with geography, spatial statistics, visualization methods and cartography to use effectively.8,9 The G-EX Portal is designed to fill these needs by serving as a web-based outlet for the dissemination of, and collaboration around, geovisualization software, learning artifacts concerning this software, and analysis of artifacts collected from the application of this software.
Motivation and background
Motivation for the G-EX Portal: barriers to the use of geovisualization
Geovisualization tools supporting health research and decision-making are required to facilitate rapid and effective synthesis and interpretation of health information that is concurrently spatiotemporal, multivariate, multi-scalar and heterogeneous. As the amount, and complexity, of information grows so, too, does the difficulty of learning and using appropriate geovisualization tools and methods. The success of a software tool is often defined by the combination of its usability (i.e. the ease of using the interface, sometimes called interface transparency) and utility (i.e. usefulness of the interface for completing desired tasks).10,11
Increasing the usability and utility of geovisualization software can be achieved by improving the software, improving user knowledge, or both. Typically, the focus is on the software, either making iterative interface refinements aimed at achieving transparent usability (when tools are immediately usable without training), 12 or on enhancing utility through user task analysis to determine what the software needs to accomplish, followed by addition and refinement of features to support identified needs. However, as the complexity and robustness of software increases, usability and utility play out as competing forces. The usability-utility competition is commonly the case with geovisualization software, for health information analysis, where transparent usability is sacrificed in order to support complex tasks like spatiotemporal disease modeling, multivariate spatial analysis of possible risk factors and subsequent decision-making. 13 As a result, there is a need to balance ongoing usability/utility research with development of new methods focused on increasing user knowledge.
Tool usability not only depends on the quality of the tools, but also on the user’s skills (i.e. how experienced the users are with the methods that the tool enables); tool utility depends not just on the total functionality provided by the tools, but also on the user’s needs (i.e. what tasks the user must be able to complete with the system). Prior work has shown that if the user’s needs are great enough, they may be motivated to improve their skills by accessing adequate learning materials. 14 A key goal for the G-EX Portal is to collect learning materials about geovisualization software and disseminate these learning materials to health researchers and policy-makers in order to improve their skills which, in turn, promotes the successful use of geovisualization software by these researchers and decision-makers. Given the focus on Web 2.0 technologies (see the next section), this research specifically focuses upon collecting and disseminating learning artifacts, or externalizations that exist outside of a given piece of software and can therefore be shared and discussed independently of the tool. Therefore, we do not consider wizards or interactive help agents implemented within the software, although these are also important learning materials.
Skill sets can be specific to a particular technology (e.g. how to use interface controls; how to apply the tools to the user’s topic of study; how to configure the tools for the user’s dataset) or related to an entire knowledge domain (e.g. geography, spatial statistics, exploratory spatial data analysis, cartography).Once a user is able to improve their skills, they may then expand their set of needs due to increased awareness of the available potential methods applicable to their work. This expansion in user needs then initiates another round of training, producing a positive feedback loop of self-improvement through learning artifacts until expertise is attained. Throughout this process, the usability and utility of the software (as perceived by the individual user) are improved without altering any code.
Design influences: Web 2.0 developments for two-way dissemination of learning artifacts
Web 2.0 describes a transition from the Internet as a simple computer-to-computer transfer mechanism to the Internet as a platform atop which disparate data and services are interwoven in the form of highly customized applications and mash-ups that can support multi-way information exchange. 15 Web 2.0 technologies are characterized by a separation of form (i.e. the data being analyzed) from function (i.e. the interface for exploring this data); this allows users to contribute their own volunteered information to a repository and to explore the activity patterns and trends of the aggregated social community. 16 Conceptualized within a Web 2.0 framework, health researchers and practitioners should be able to interact with geovisualization experts developing the software, as well as the broader community of users applying these tools to epidemiology and public health. Thus, the dissemination of geovisualization software and associated learning artifacts should be viewed as a two-way process under Web 2.0, where developers and users push ideas and strategies back and forth, iteratively improving knowledge of both groups and promoting the positive feedback loop of user self-improvement described above. 17 Our effort to develop the G-EX Portal leverages two Web 2.0 developments that provide two-way dissemination: (1) the web portal; and, (2) e-Learning.
First, our approach borrows from a range of Web 2.0 web portal developments. A portal is a website that acts as the front door to a wide array of information sources. 18 Portals are different from the more basic web directories or search engines in that they combine heterogeneous data types and web services and present them in a single, consistent site. Although portals predate the coining of the term Web 2.0, they have evolved into powerful tools by leveraging Web 2.0 technologies. Examples of Web 2.0 portals for sharing multimedia include YouTube (http://www.youtube.com/) and Flickr (http://www.flickr.com/). Other Web 2.0 sites encourage users to build, share and discuss personalized collections of multimedia, such as del.icio.us (the social book marking service; http://delicious.com) and the scientific publication-focused Cite-U-Like (http://www.citeulike.org/). Web portals like these allow users to share and access a diverse range of content using tools that encourage exploration and often generate a closely-connected user community that collectively evaluates the portal content through discussions and rating systems. Therefore, Web 2.0 portals embody a web-based version of two-way dissemination that has influenced our work on the G-EX Portal.
Second, increases in Internet access and popularity have allowed educators to extend the classic model for learning to the digital environment through the development of e-Learning methods and technology. 19 E-learning platforms are often profile-based, allowing users to view resources specific to their courses and to communicate with their classmates in a manner similar to the interactions made possible on social networking sites like Facebook (http://www.facebook.com). E-Learning materials include ‘textbook’ components for education of domain knowledge, forums for group discussion and feedback, and multimedia tutorials demonstrating the application of tools and analysis methods. 20 Our work to design learning tools for the G-EX Portal primarily draws from e-Learning strategies for content dissemination and asynchronous user communication.
Introduction to the G-EX Portal
The G-EX Portal (http://www.geovista.psu.edu/G-EX/) is a proof-of-concept application developed at the Penn State Geographic Visualization Science, Technology, and Applications (GeoVISTA) Center in consultation with the Penn State Hershey Medical Center. 21 In general terms, the G-EX Portal is designed to connect researchers in geovisualization and related mapping sciences to researchers or policy-makers working in epidemiology and public health around the globe.
To meet this objective, the G-EX Portal has been designed to support three kinds of tasks. First, the G-EX Portal enables users to access free, open-source geovisualization software. This allows interested health researchers and policy-makers to quickly learn about new tools and their potential applications, improving access to, and application of, geovisualization tools and techniques in epidemiology and public health. Second, the G-EX Portal provides (and enables community contributions to) a set of learning artifacts (e.g. training manuals, annotated screenshots, video demonstrations, example data/problems) that are sufficient for the user community to understand not only how a tool works, but when and why it should be employed. Finally, the G-EX Portal acts as a system for collecting, organizing and interpreting analysis artifacts (datasets, maps, statistics, notes, or any other record of the analytical process) generated by distributed tool users during the application of these tools and techniques. Such open collaboration moves beyond production of bits of information and toward the construction of new knowledge for use in subsequent science and decision-making. Throughout, it is important to support the two-way process of iterative feedback between geovisualization and public health communities through the use of tools that support both sharing of artifacts and of ideas about tools and their application. This will ensure that developers are meeting user needs, that users are applying tools appropriately, and that analysis artifacts are interpreted correctly.
The G-EX Portal features four modules, three of which correspond to different stages in the health data analysis process. The Learn module (which is our specific focus in this paper) allows users to download software and learning artifacts so that they can acquire the tools, and associated skills, needed to begin analysis. The Collaborate module allows users to upload analysis artifacts of interest for further discussion with other users. The Review module supports the distribution and review of analytical reports. Finally, the Search module acts as the central portal for retrieving contributed artifacts (Figure 1) from all three of the task-oriented modules and is used for reference at all stages of analysis.
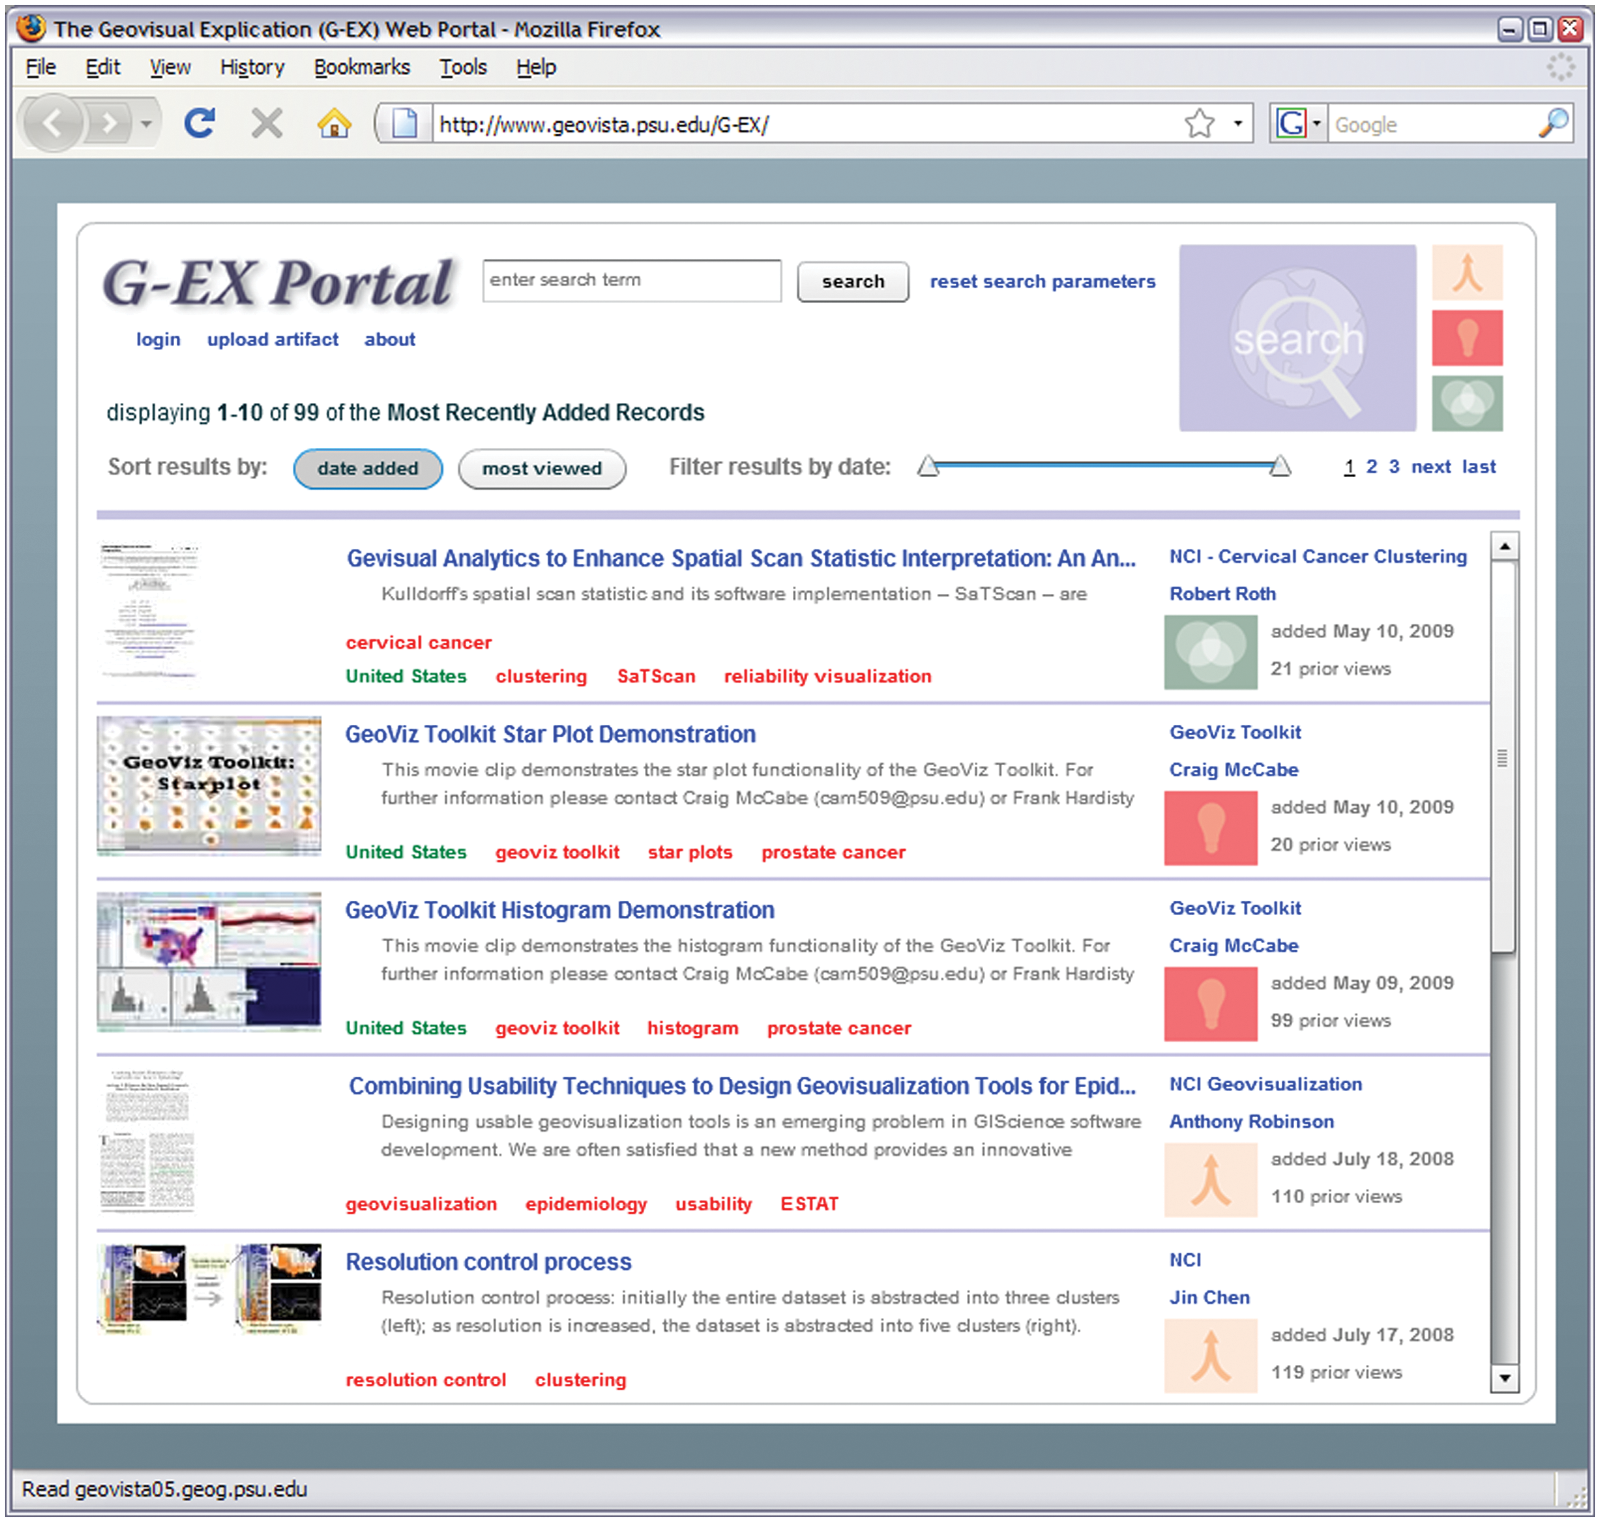
The G-EX Portal search results page (http://www.geovista.psu.edu/G-EX/).This module serves as the portal entrance for the site; the search box, with is persistent across all modules, ensures that the portal component is available at all times. Artifacts uploaded to the Learn module are indicated by a red light bulb icon
A Web 2.0 profile-based design is used across these modules. Users are able to log in, upload artifacts to the repository and view a summary of their activity on their individual profile. This produces a close coupling between contributions and contributors, similar to other collaborative sharing media sites. Each time an artifact is uploaded, an individual artifact page is generated, allowing other users to browse and download the contributed artifact. Other users can comment on artifacts, ask questions about an artifact, or view other artifacts contributed by a specific user. The G-EX Portal uses a Web 2.0 architecture composed of three primary components: (1) a front-end client built in Adobe Flex to handle the profile-based navigation;(2) a back-end database built in PostGreSQL to manage uploaded artifacts; and, (3) a Java web service intermediary to connect the two. More details on its implementation can be found inRoth et al. 22 If the G-EX Portal grows into a popular service, we will look to design our server technology to match systems like CiteSeerX, a digital library for scientific documents that serves over one million queries each day. 23
Methods: needs assessment survey to inform design and development of the G-EX Learn module
Methodologic approach
Our earliest designs were informed by informal feedback from colleagues, user studies we carried out previously related to multiple projects to develop tools supporting analysis of public health data,24–26 experiences participating in training workshops focused on exploratory spatial data analysis (ESDA) tools, and the development of a set of use scenarios and training videos (www.youtube.com/GeoVISTACenter). Drawing on the above, we implemented an initial working prototype for the G-EX portal. Here, we report on a structured needs assessment study carried out to shape the evolving design and development of the G-EX Learn module.
In healthcare, a needs assessment study describes the description of a local population across demographic, behavioral and medical factors to determine the current healthcare demand of the population, and to predict this demand into the future.27,28 While a needs assessment study has a different meaning when applied to the software engineering of health information systems, the goals are largely the same: the investigators are trying to understand the characteristics of a given population, to determine the needs of this population, and to identify which needs are not currently met by existing systems. 29 In the context of software engineering, the needs assessment process is closely tied with the description of the targeted end users’ work process. Because of this, the needs assessment study is often referred to as, or encapsulated within, a functional analysis study[30], 30 task analysis study, 31 requirements analysis study, 32 or work domain analysis study. 26
There are a variety of knowledge elicitation techniques that can be applied to complete a needs assessment study, including: surveys, focus groups, interviews and participant observation. 33 Surveys are efficient in both participant and investigator time and work well when the investigators start with sufficient background knowledge of the domain, and users to know which questions to ask. Based on our previous in-depth user studies focused on target user needs and practices related to geovisualization and spatial analysis methods for health data analysis, we were in a good position to develop an effective and efficient survey.
Specifically, we completed a web-delivered survey of likely end-users. The survey featured 12 questions designed to elicit feedback on current learning habits (Questions 1–4), preferred learning artifacts (Questions 5–8), and issues related to contributing learning artifacts to web portals (Questions 9–12). The survey questions are close-ended to generate information on specifically identified topics and are designed using a range of response formats, including ranked responses and the identification of multiple items of interest. 34 Question design focused on characterizing the full range of user expectations, rather than simply identifying single, ‘best’ answers. Our central goal was to obtain guidance for the design of the G-EX Learn module from representative potential users; this survey is part of iterative formative evaluation intended to broadly shape prototype development.
Email solicitations were sent to policy-makers and health researchers who are members of advisory boards, and conference committees related to health geographics in the USA. We also sent recruitment Emails to medical geography Email list servs. Twenty-one participants (6 females, 15 males) responded to the call for participation. Self-reported participant job occupations included epidemiologists, health policy specialists, geographers and research scientists. We asked participants to provide several keywords to describe their work; the top six responses were: epidemiology, mapping, statistics, health, analysis and geography. While the results of the needs assessment survey were used to inform design and development of the G-EX Portal Learn module directly (and our sample is focused on respondents from the USA), it is expected that the findings are applicable to other professional education projects targeted toward health researchers and decision-makers.
Results: learning needs of health researchers and decision-makers
Current learning habits
Our first goal of the needs assessment study was to characterize the current learning habits of our targeted end users. Survey responses (Figure 2) indicate that most participants spend less than 10 hours each month learning about new tools and methods for their work. For five participants, continuing education is required by their employer. Eight of the remaining participants indicated that while continuing education is not required, it is encouraged by their superiors.
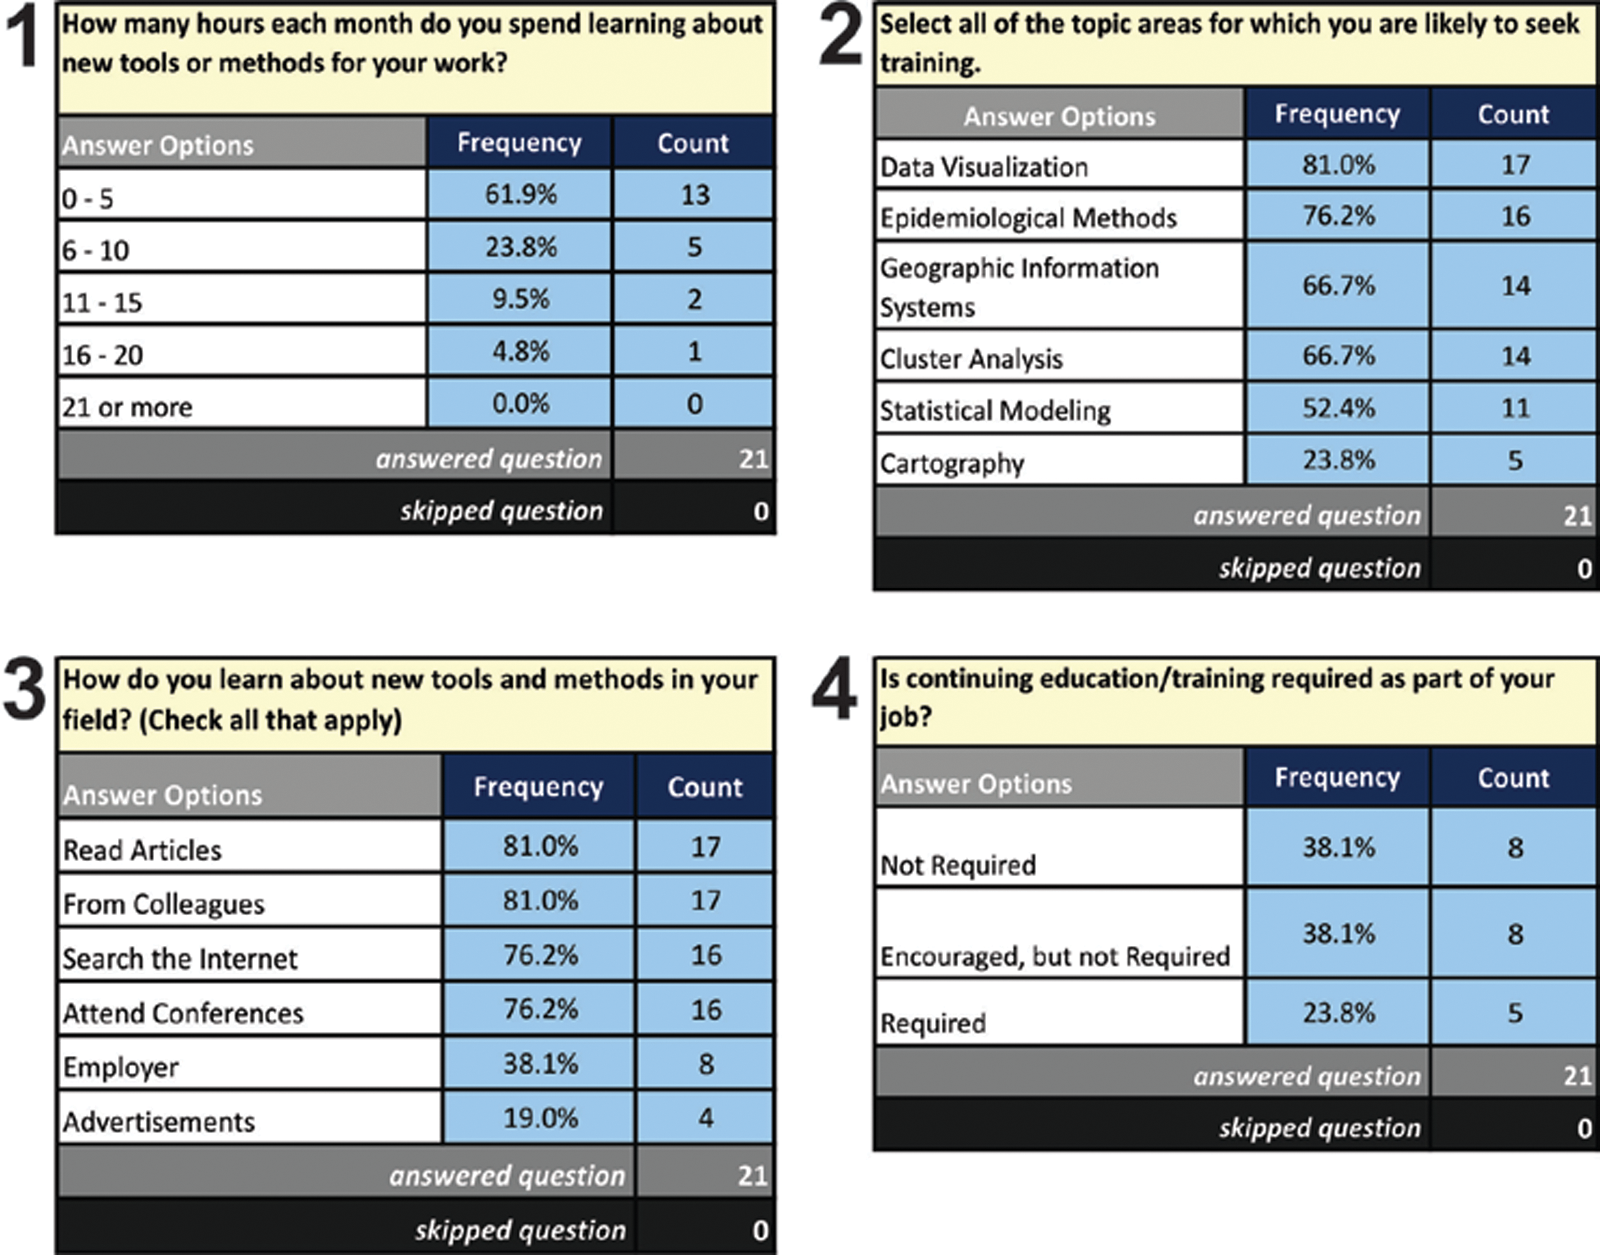
Results from the needs assessment survey concerning current learning habits
When asked to comment on the ways in which they currently learn about new tools and methods, participants stated that they most often search the Internet, read journal articles, attend conferences and ask colleagues. It is much less common to learn about new tools and methods from advertisements or employers.
These results suggest that the majority of participants are encouraged, or required, to pursue continuing education. In addition, most participants indicated that they devote time each month to learning specifically about tools and methods (from less than half a day to two days per month). Topics for which participants want training and the ways they currently go about obtaining it are both quite varied, but three-quarters use the Internet to obtain some of that training and more than 80% are interested in visualization training [with geographic information systems (GIS) and cluster analysis also high on the list)].
Important insights from these results for the G-EX portal are that the Internet is commonly used by health researchers and policy-makers to find learning artifacts. In addition, colleagues are more often a source for knowledge about new tools and methods than employers. This matches well with the focus of the G-EX Portal architecture on supporting community sharing of learning artifacts.
Preferred learning artifacts
The second component of the survey focused on the style of learning artifacts (Figure 3). We first asked about the way in which the learning artifacts are packaged and presented, rather than their content. While the participants were interested in a diversity of approaches to providing training materials, they indicated a preference for tutorials and indexed user guides over hands-on training. Interestingly, there was relatively strong support for both comprehensive tutorials and task-based tutorials, options that could be viewed as alternatives, particularly from an interface design perspective. Results indicate that these learning methods should be viewed as complementary, thus, inclusion of a comprehensive tutorial does not rule out the need for task-oriented tutorials.
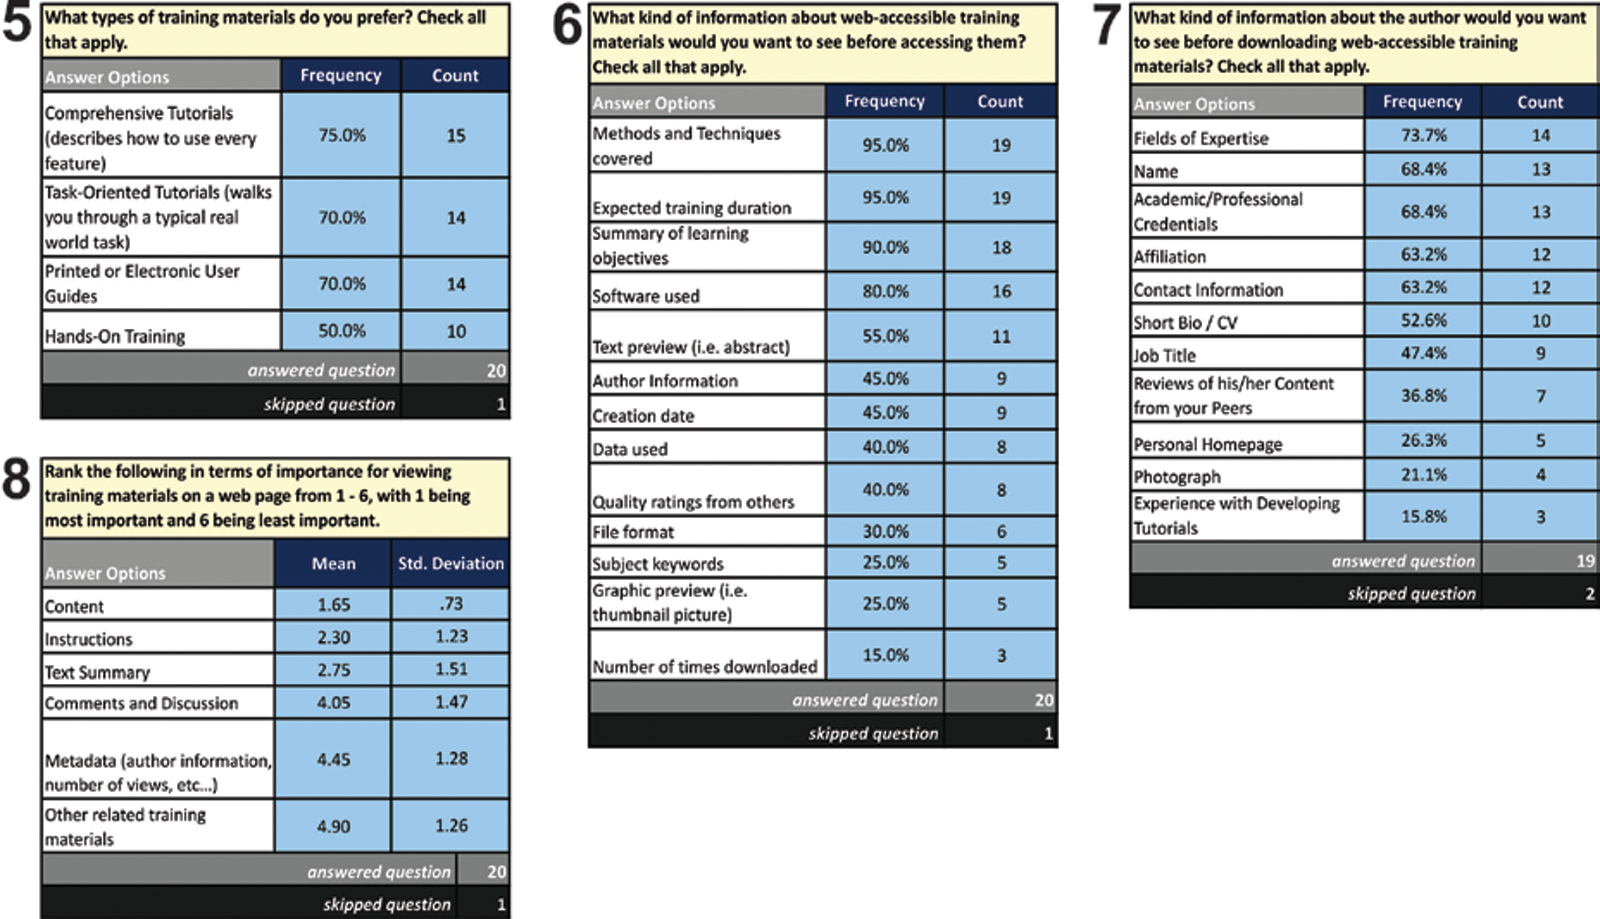
Results from the needs assessment survey concerning preferred learning artifacts
When we asked what information participants want before accessing training materials, information on the methods covered, the duration of the training activity, summary of learning objectives and the software used were among the most important items identified. It is worth noting that graphic summaries, keywords, and popularity information—typical components of Web 2.0 site content—were ranked as least important. These preferences may reflect the types of content commonly found in traditional off-line tutorials.
When asked specifically what information should be provided about learning material contributors, participants indicated interest in viewing the contributor’s areas of expertise, name, credentials and affiliation. Interestingly, prior experience developing learning artifacts was ranked last. This suggests that quality of learning artifacts will be judged by the credentials of authors (as is typical for scientific grant proposals and publications).
The follow-up to this question asked users to rank the importance of basic information about learning artifacts. Participants indicated that content, text instructions and a text summary were most important. The relative importance of a text summary is particularly interesting, as we assumed that video tutorials with instructional voice-overs would be a well-accepted form of learning artifact given their popularity in e-Learning; 20 it is unclear if this, again, reflects the types of content commonly found in traditional off-line tutorials. Metadata information and links to related materials were least important.
These results suggest that web-delivered tutorials and user guides are likely to be well-received by the targeted user community, provided that they focus on analytical content and provide basic information on authorship. It is particularly noteworthy that the features we would typically associate with Web 2.0 content (e.g. popularity measures, graphical previews, quality ratings) were ranked as least important.
Contributing learning artifacts
The final goal of the survey was to understand how health professionals felt about developing learning artifacts and then sharing these artifacts, along with their personal information, with a larger community (Figure 4). We started by asking participants to gauge their familiarity with popular social networking and media sharing sites that require users to disclose a similar amount of personal information. It is important to know which sites the targeted users frequently encounter so that our portal design invokes familiar Web 2.0 themes. Wikipedia was by far the most commonly used by the participants, suggesting that participants emphasized Websites that allow them to retrieve actionable information for individual use rather than Websites that facilitate direct communication with colleagues (although examples of the latter are used by a small group of participants). Only one participant reported use of del.icio.us and Twitter, and no participants reported use of CiteULike, despite listing research articles as a primary source of learning artifacts (Question 3).
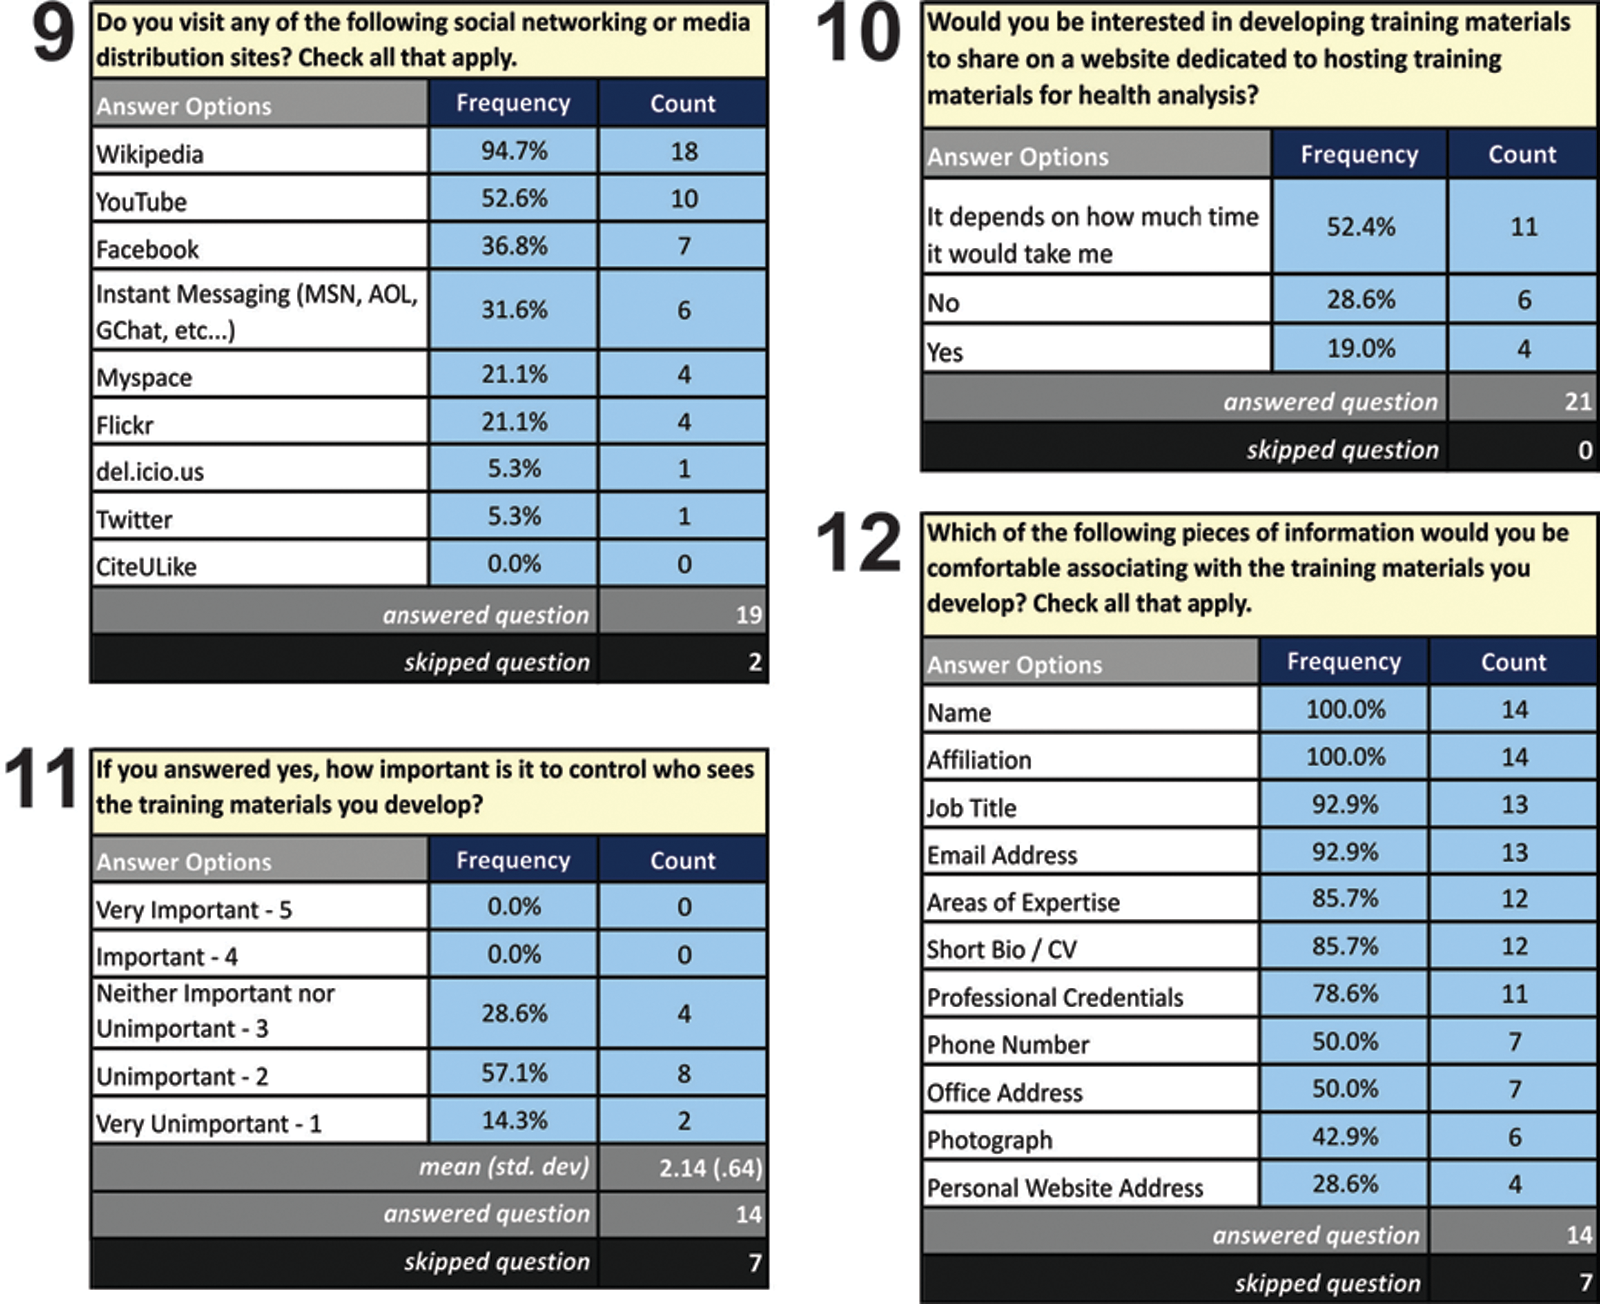
Results from the needs assessment survey concerning mechanisms for accessing and sharing learning artifacts. Response numbers for Questions 11 and 12 are smaller than for other questions because these questions were answered only by respondents who answered yes to Question 10
One goal in developing of a web portal for disseminating training materials for geographic visualization is to enable an engaged and sustainable user community. Ideally, the initial users of such a portal will eventually become contributors themselves. We asked participants if they would contribute training materials. Fifteen responded positively, eleven with the caveat that it depended on how much time it would take to contribute materials.
For those participants who responded positively to Question 10, we asked a question about the need to control who could access their training materials and which type of information they would be willing to share about themselves to associate with their contributions. Participants generally did not express a need to control who would see the materials they might develop. Participants also indicated that they were comfortable sharing basic information about themselves, with the notable exceptions of telephone numbers, office address, web addresses and photographs.
These results suggest that the targeted user community may be willing to contribute and share learning materials to a portal like G-EX. This suggests that small-scale crowd-sourcing could be a viable approach for developing a collection of learning artifacts. Most Web 2.0 sites exhibit a smaller, core user group of contributors, and a larger, peripheral user group of lurkers. That two-thirds of participants responded that they would contribute learning artifacts is encouraging. However, this finding indicates that further investigation is needed to determine how much preparation time is too long (e.g. people will upload a screenshot but will not contribute a twenty-page user manual) and to identify strategies for improving the efficiency of creating learning artifacts, such as allowing the direct export of screenshots/comments out of geovisualization tools and into the G-EX Portal.
Interestingly, participants also indicated that they were comfortable sharing basic information about themselves, such as their name, affiliation, job title, Email address and credentials. This largely alleviates the concern raised in Question 7, as it appears that most contributors would volunteer the personal information needed for users to identify learning artifacts of interest based on credibility. It is important to note that there were some pieces of information that half of more of the participants were not willing to provide, including a telephone number, office address and photograph.
Discussion: improving the G-EX Learn module
As a result of our needs assessment survey, we have adapted and extended our initial conceptual design of the G-EX Learn module (and its implementation) in multiple substantive ways. In the following, we describe key features of the module and its improvement as guided by the needs assessment survey results. This discussion is organized around four larger themes: (1) design of the individual artifacts page; (2) creation of a large set of visualization learning artifacts with which to seed the Learn module; (3) design and development of personal homepages for artifact contributors; and, (4) design of a workflow interface for task-oriented tutorials.
Artifacts page
Following selection of a learning artifact of interest through the Search module (Figure 1), the user is sent to the individual artifacts page of the Learn module (Figure 5). The conceptual design of the individual artifact page includes four components: (1) an artifact viewer displaying the learning content, which can load any file format supported by a web browser; (2) a metadata viewer for displaying key information about the learning artifact; (3) a discussion area that allows users to comment on and ask questions about the learning artifact, included to support the two-way dissemination of knowledge described in Section 2; and, (4) a preview viewer of other related learning artifacts available through the G-EX Portal Learn module. In the original design, each of these components was given roughly the same amount of screen space.
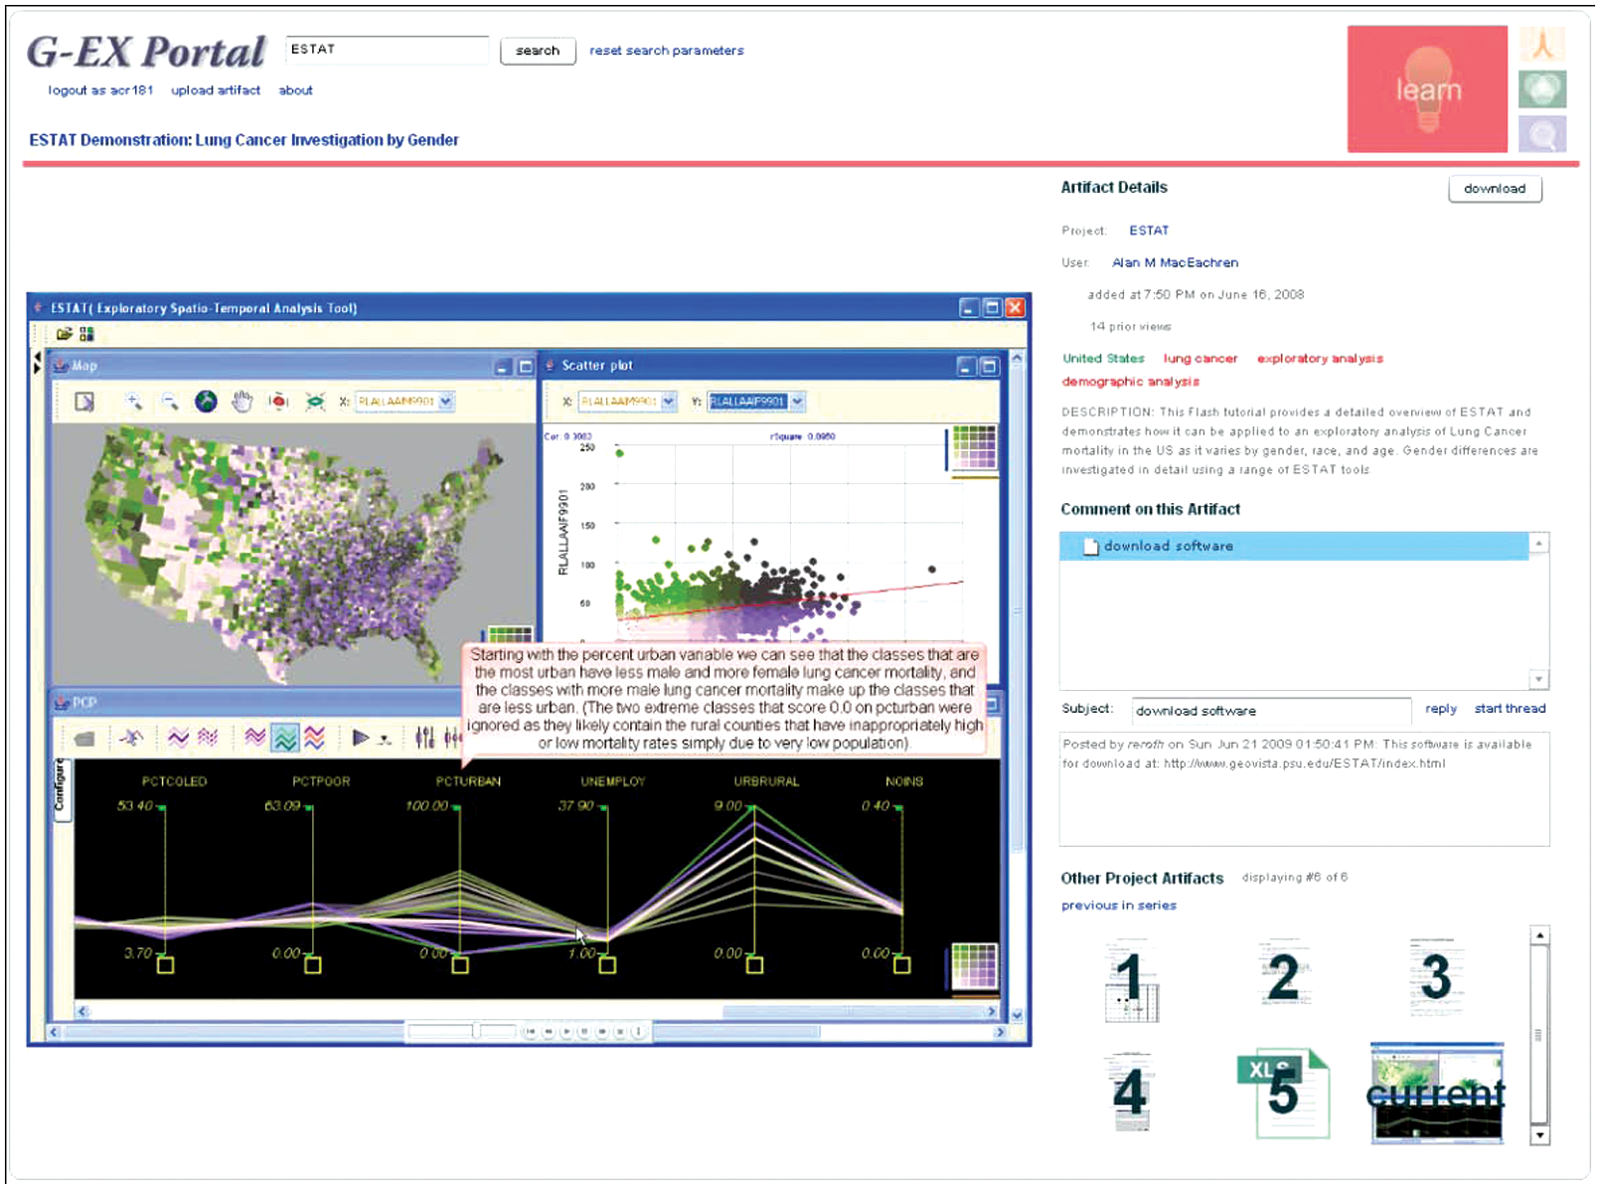
The modified artifacts page for the G-EX Learn module. The artifact viewer is now given the majority of the screen real estate, with the metadata viewer, discussion area and preview viewer stacked in a confined space along the right side of the application
Although we maintained these four components in the revised Learn module, we modified the layout of these components according to their relative importance identified in the needs assessment (particularly Question 8). Participants responded overwhelmingly that the most important information to include on the page was the content. To compensate for this, the artifact viewer component is now given the majority of the screen real estate, with the remaining three components stacked vertically along the right edge (Figure 5). Further, this stack has a fixed width, allowing the artifact viewer to expand both horizontally and vertically according to the user’s screen resolution. The stacking order was also determined by the survey responses, with the text-based content (instruction, summaries and metadata) located on the top of the stack, then the discussion area and, finally, the preview viewer of related items. The footprint for the latter two items was reduced significantly given the low rankings in the survey. It is important to note the panel including the textual summary and instructions (ranked highest in importance, outside of the content itself) is allowed to expand in size on high resolution screens, while the preview viewer (ranked lowest) becomes hidden on low resolution screens, requiring the user to scroll the stack to view it.
Visualization of learning artifacts
The needs assessment survey identified a clear interest among health researchers and policymakers in learning artifacts concerning data visualization (Question 2). In response, we have created a set of learning artifacts, particularly video-based artifacts, with which to seed the G-EX Portal Learn module. Thus far, we have produced learning artifacts for the following GeoVISTA geovisualization software: the Visual Inquiry Toolkit, 35 the Exploratory Spatio-Temporal Analysis Toolkit (ESTAT), 9 GeoVISTA CrimeViz, 36 the GeoViz Toolkit, 37 GeoVISTA Studio, 38 Health GeoJunction, 39 and the Pennsylvania Cancer Atlas. 25
We also completed redesign of the individual pages for each artifact to better match the most commonly visited Web 2.0 sites in our survey results. Each learning artifact page is now composed of four interactive components (Figure 5). On the left, there is an artifact viewer for the learning artifact itself. Other than expansion of supported file formats, this remained unchanged from the pre-survey Learn module. At the top-right, there is a description of the learning artifact and other metadata deemed important by the survey responses. Clicking on any colored metadata text (blue for user/project information, green for geographic tags and red for content tags) performs a search on that metadata variable, supporting exploration of related learning artifacts. A discussion area is included at the middle-right, allowing users to comment on and ask questions about the learning artifact. This is a new addition to the Learn module that follows our focus on supporting two-way dissemination. Finally, at the bottom-right, there is a list of related learning artifacts available within G-EX. This provides context for users on their current position in a multi-step tutorial sequence. This feature also allows G-EX content to be linked together to correspond to a typical analytical workflow.
In addition to new artifact tools, we have begun work on a user profile page that takes into account survey responses that provided specific guidance with respect to what types of personal information users want to see about and share with others.
Example application of the G-EX Learn module
Based on survey responses, we expect that the primary application of the Learn module will be to provide interactive training materials for users to learn about new geovisualization tools for health data analysis. Here we illustrate a typical use case of the G-EX Learn module through a scenario that presents a typical potential user, a cancer epidemiologist who works at a state public health agency. In the scenario, the user has heard about new tools for geographic visualization and is interested in obtaining and learning about open source tools.
To begin, the user enters the Learn module via the G-EX start page. Once there, it is possible to search for materials by keyword and to interactively narrow results using a temporal filter. Using the keyword clustering, the user asks the G-EX Portal to return artifacts with that tag. The results include two video tutorials on how to use the GeoViz Toolkit. In our example, the user is interested in the first result: a video tutorial on how to use star plot mapping tools in the GeoViz Toolkit to analyze space-time patterns in prostate cancer mortality. Clicking on that result loads a detailed artifact page which hosts the video, describes its contents and provides tools for downloading and discussing the tutorial.
From the artifact page, a user can then either search for additional materials using the search bar at the top of the interface or click on keywords and usernames associated with the artifact to branch off and browse related materials, including those that have been explicitly linked as part of an analytical workflow.
In designing the set of visualization artifacts, we have been cognizant of the time constraints reported by the participants (Question 1), as the majority of participants spend 10 or fewer hours a month on continued education. Rather than providing a small set of lengthy and comprehensive video tutorials, we have divided the content into a larger set of very short videos that only describe a single software feature. These shorter learning artifacts can then be linked together into a logical grouping using the preview viewer of the artifacts page (described above), the contributors personal homepage (described below), or the workflow interface (also described below).
Personal homepage for contributors
The needs assessment survey identified the desire by potential system users, to access information about the contributor of a learning artifact in order to assess its quality (Questions 6 and7), and the willingness of contributors to offer such information (Question 12).In response to this feedback, we implemented a simple personal homepage feature that organizes all contributed learning artifacts from a single user and allows this user to post a professional affiliation and other information about themselves (Figure 6). Similar to the common social networking applications listed in Question 9, the Learn module homepage allows contributors to provide information about their position and affiliation, background/experience (by providing a link to a short biography or curriculum vitae), their contact information (mailing address, Email address, telephone number) and a personal image.
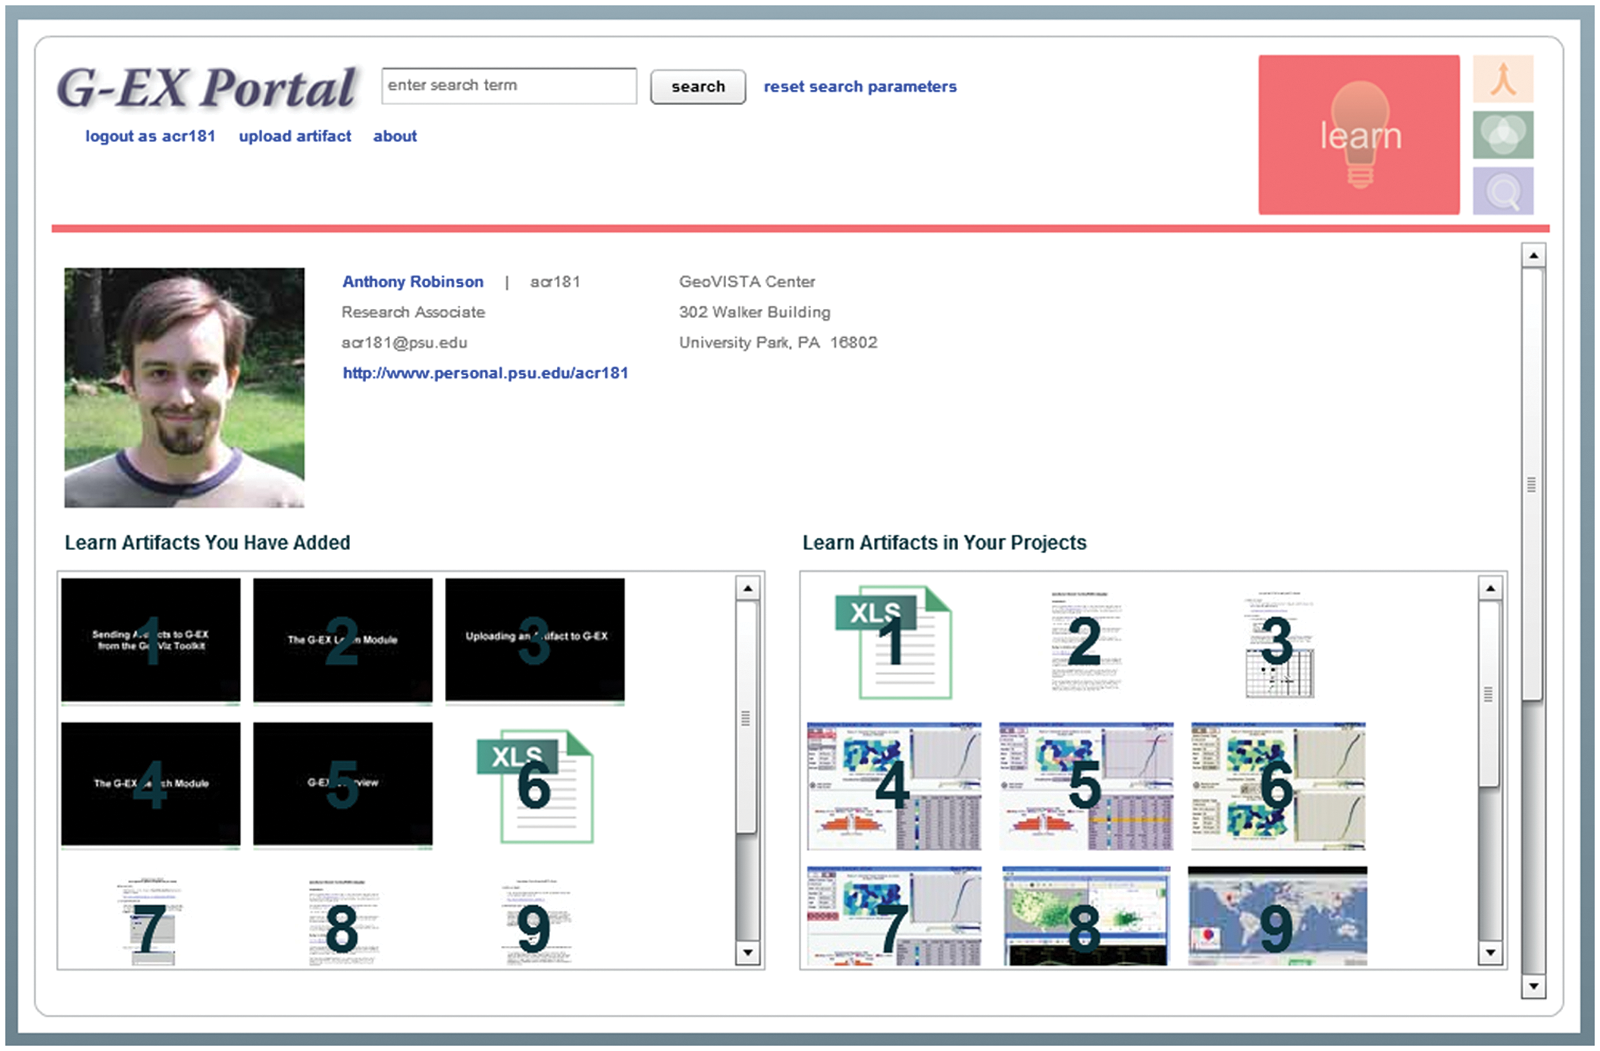
The Learn module homepage. The Learn module homepage organizes the learning artifacts contributed by a single individual. Following the lead of popular social networking software, contributors are able to provide background and contact information. In turn, this information assists other users in identifying credible sources when searching through the repository of learning artifacts
Users of the G-EX Portal seeking learning artifacts can evaluate the credentials of contributors and then browse the learn artifacts contributed by individuals they deem credible. Download frequency statistics and user-contributed quality ratings can also be used to support community moderation to help high-quality content rise to the top. In the G-EX Portal, The only information that is required for contributing a learning artifact is the user’s name and affiliation: the two pieces of information that 100% of participants in the needs assessment survey indicated they were comfortable providing; other details are optional. We are keeping all learning artifacts and Learn module homepages open to the public, as no participant indicated that access control of the learning artifacts was necessary (Question 11); this is likely because of the fact that learning artifacts are generally created with the purpose of broad dissemination in mind, meaning contributors would likely invite, and even expect, public viewing.
Workflow interface for organizing learning artifacts
Another finding from the needs assessment study was that participants had a nearly equal interest in acquiring task-oriented tutorials than they did in more comprehensive tutorials and user guides explaining an entire system (Question 5). The support for the latter type of learning artifact suggests that health researchers and decision-makers are interested in seeing how other professionals in their domain are using geovisualization and related tools within problem domains similar to their own. As we created visualization learning artifacts (described above), we found that it was difficult to encapsulate all of the background and technical information necessary for a task-oriented tutorial within a single learning artifact; this issue was accentuated by the requirement to keep individual learning artifacts short (Question 1) and by the complexity of the studied phenomenon (e.g. disease and related risk factors).To walk users through a real-world application of geovisualization tool applied to health data analysis, we decided to provide an alternative interface in the Learn module that allows users to sequence short, focused task-oriented learning artifacts into a workflow, or a prototypical work process that is conditioned by the outcomes of each individual task in the process. 22
Based on our experiences, we envision a new workflow interface as part of the G-EX Learn module; an initial conceptual design is provided in Figure 7. The workflow interface has three primary interactive components: (1) a central whiteboard for constructing and annotating the workflows; (2) a wiki allowing users to ask questions about the overall workflow and its connections at the bottom-left; and, (3) a listing of all individual learning artifacts comprising the workflow at the bottom-right. Contributors will be able to construct a workflow using their own uploaded learning artifacts as well as those uploaded by others.
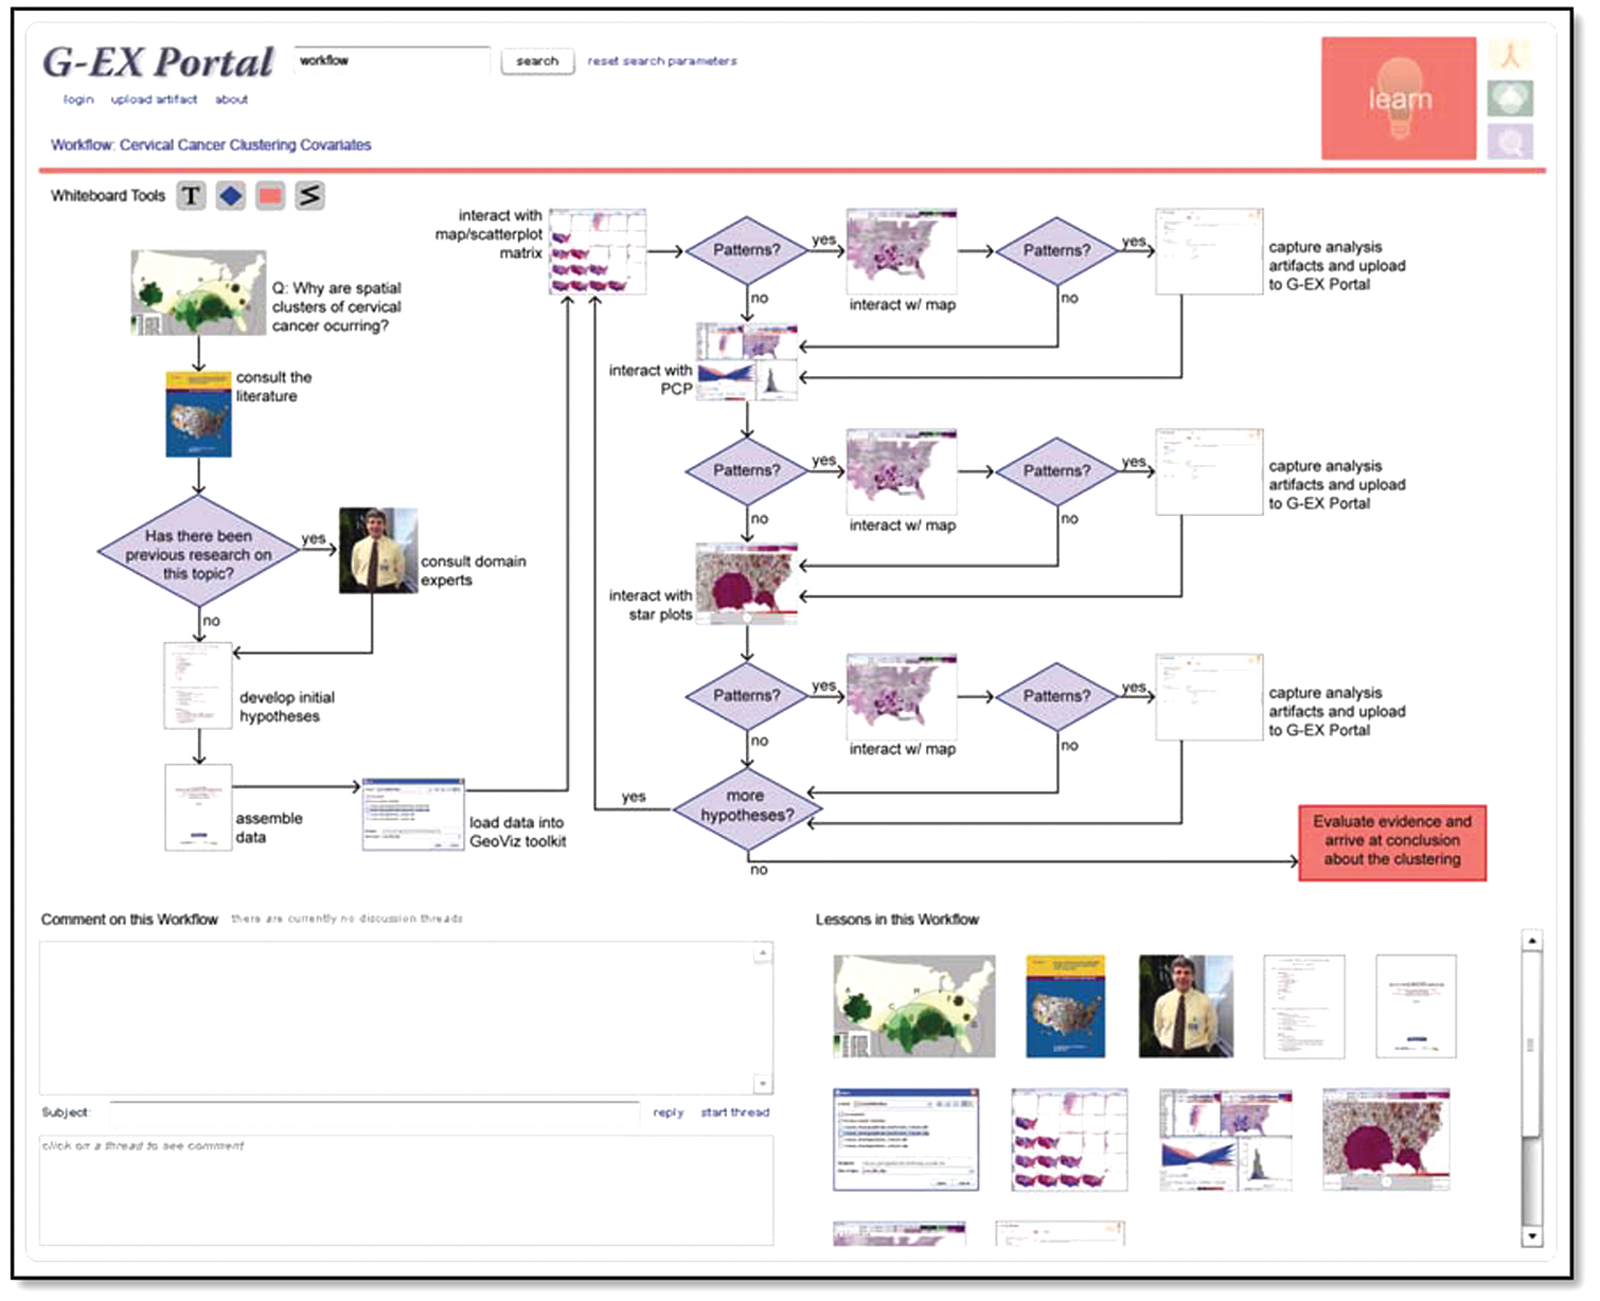
A mockup of the workflow interface for the G-EX Portal Learn module
In this design, users of the constructed workflow will receive a general impression about the type, number and scale of analysis steps in the workflow upon entry to the individual workflow page. Users will then be able to select their current position in the workflow; it is expected that in many cases users will be working on their own research problem while proceeding through the learning workflow. Clicking on a learning artifact icon will navigate them to the associated individual learn artifact page where they can access the learning artifact, apply the technique in their own project and then return to the workflow page to determine how to proceed in the workflow given the results.
Conclusion
In this article, we have presented a new web portal designed to help health researchers and policy makers learn about new geographic visualization tools and analysis methods. The G-EX Portal is intended to support a community of visualization developers and end-users in which end users can provide input to design of tools that meet needs and the entire community can support one another in learning to use tools and apply them effectively to a wide range of domains.
Our focus was specifically on the development of the G-EX Learn module in support of community development and sharing of learning artifacts for geovisualization and spatial analysis methods, and tools applied to public health. As input to design of the learning module for the G-EX Portal, we conducted a needs assessment survey with likely users. The results of this survey indicate that users want a diverse set of learning artifacts that focus more on analysis methods and learning objectives than on popularity rankings or the ability to link outward to related items. Additionally, users want to see authorship information that would help other users to evaluate the credibility of the learning materials. Finally, users responded positively to the notion of contributing materials themselves, provided that the tools for doing so are easy enough to use. Our goal is to support easy contribution through mechanisms integrated within our geovisualization software that can easily export screenshots, videos and data, and upload the results directly to the portal.
We have used the results of our survey to improve the design of the G-EX Learn module and its prototype implementation. A beta version of the G-EX Portal Learn module is available for public use and comment at: www.geovista.psu.edu/G-EX/. As part of our overall user-centered design process, focused on increasing the usability and utility of the system, we anticipate future rounds of evaluation and revision for both the G-EX Portal broadly and the Learn module specifically.
The G-EX Portal is an experiment in the application of Web 2.0 methods and technologies to support communities of researchers and policy-makers to learn about the potential of geovisualization, spatial analysis and related methods and tools to support public health research and policy decisions. Since we started this research, there have been dramatic advances in social media technologies and growing interest in their use within professional communities as tools to leverage distributed expertise, enable development of shared data and tool repositories, and many other activities. We envision leveraging these advances within the G-EX Portal framework to help advance the practice of geographic analysis for public health.
Footnotes
Acknowledgements
This research was supported by grant CA95949 from the National Cancer Institute, U.S. National Institutes of Health.