
Abstract
Background and aims:
To provide a register-based analysis of the incidence, anatomical distribution, and associated operative care of all burn injuries treated in specialist care in Finland.
Methods:
This is a register-based epidemiological study covering the entire population of Finland from 2011 to 2015. Our data include all burn patients registered in the Care Register for Health Care. We used the International Classification of Diseases, 10th Revision code for burn injuries and the Nordic Medico-Statistical Committee Classifications of Surgical Procedures for procedure codes. We calculated the mean crude and adjusted (to European Standard Population 2013) incidence rates of burns as cases per 100,000 person-years assuming Poisson distribution of cases for calculating 95% confidence intervals.
Results:
The study included 16,575 patients with burn injuries (male 63%). The mean standardized annual incidence rate per 100,000 person-years of any burn injury during the study period was 60.8 (95% CI 59.9–61.7). The corresponding values were 76.3 (95% CI 74.9–77.8) and 45.2 (95% CI 44.1–46.3) for male and female. Among patients admitted for ⩾2 days, the incidence rate per 100,000 was 10.9 (male 15.5 and female 6.5). The mean (SD) age was 32 (23) years. Hand injuries were the most common burns. The most frequently operated regions were the upper limb injuries. A total of 8.8% of patients were admitted for ⩾2 days, with a mean inpatient time of 12 (SD 29) days for females and 11 (19) days for. No male patient had inpatient time > 100 days.
Conclusions:
Male patients had more burn injuries and were admitted to specialist care more often than females. Hand and wrist injuries were common but rarely operated. Limb and torso injuries were operated on most often. Females had a longer mean length of stay (LOS) than males in the age group 11–30 years. The reasons for this is unknown.
Introduction
Burn incidence and prevalence have decreased in recent decades in high-income countries.1–4 Brusselaers and colleagues 1 analyzed European burn studies and reported an annual incidence of hospitalized, severe burns of 0.2–2.9/10,000. The worldwide age-standardized incidence of burn injuries has decreased in recent decades, although the number of new cases of burn injuries has increased. Gross domestic product (GDP), healthcare consumption per capita, and population educational level affect the incidence and severity of burns in a given country.4,5
Working-aged males with a flame or scald injury and children with scald injuries are considered typical burn patients. Most burn injuries occur at home and the hand is the most commonly injured body part.1,2 Among the elderly population, the proportion of female patients is relatively high. 6
The incidence of burn injuries has decreased in Scandinavia in recent decades.7–9 The trend is similar in Finland. The annual incidence of hospitalized burn injuries has decreased since the 1970s from 42 to 17 per 100,000. Finland’s first epidemiological burn study was published in 1977. 10 This was followed by two other studies, the latter of which had a nationwide patient sample from 1980 to 2010.11,12
Currently, burn care in developed countries is centralized. Burn care of the most severe burn injuries is performed in highly specialized burn units that provide tertiary-level burn care. 13 Until 2016, there were two specialized burn units in Finland. Since 2016, the Helsinki Burn Center (National Burn Center, NBC) has been Finland’s only tertiary-level burn unit serving the whole country. Our study period covers the time after the earlier Finnish epidemiological burn studies until the beginning of fully centralized burn care in one national unit in Finland.
In this study, we analyzed the trends of burn injuries in Finland from 2011 to 2015. We focused on the incidence, operations, and hospitalization of burn injuries. We combined the anatomical distribution of burn injuries with operative care linked to specific injuries.
Methods
Registry data
This is a register-based epidemiological study covering the whole population of Finland in 2011–2015. Our data include all burn patients admitted for specialist care and all associated inpatient periods at specialist care units; these patients were therefore registered in the Care Register for Health Care. The register does not include patients who had all care in primary healthcare units. Individuals were identified with unique ID codes that were given at birth or immigration. These numbers were unchanged during the person’s lifetime. These ID codes can be linked to various national registries. Patient identification was based on these codes.
Data were obtained from the Care Register for Health Care, which is governed by the Finnish Institute for Health and Welfare (THL). THL is an institute that serves research and expert work. The grounds for maintaining the register are based on Finnish legislation.
Patients diagnosed with burns were identified based on the International Classification of Diseases, 10th Revision (ICD-10) codes for burn injuries (T20–T32.9). If the patient was assigned the same diagnosis code several times, only the first burn diagnosis was included to avoid multiplying the results (incident cases). We identified patients with operations due to diagnosed burn injuries with surgical procedures using the Nordic Medico-Statistical Committee (NOMESCO) classifications of Surgical Procedures (NCSP) for procedure codes (from group QA*** to QW***) (Table 1). Operations were grouped according to anatomical site. Each operation in our study was linked with a burn injury (ICD-10 coding). We also collected information on patient age at diagnosis, gender, date of diagnosis, and city of residence.
NOMESCO codes.
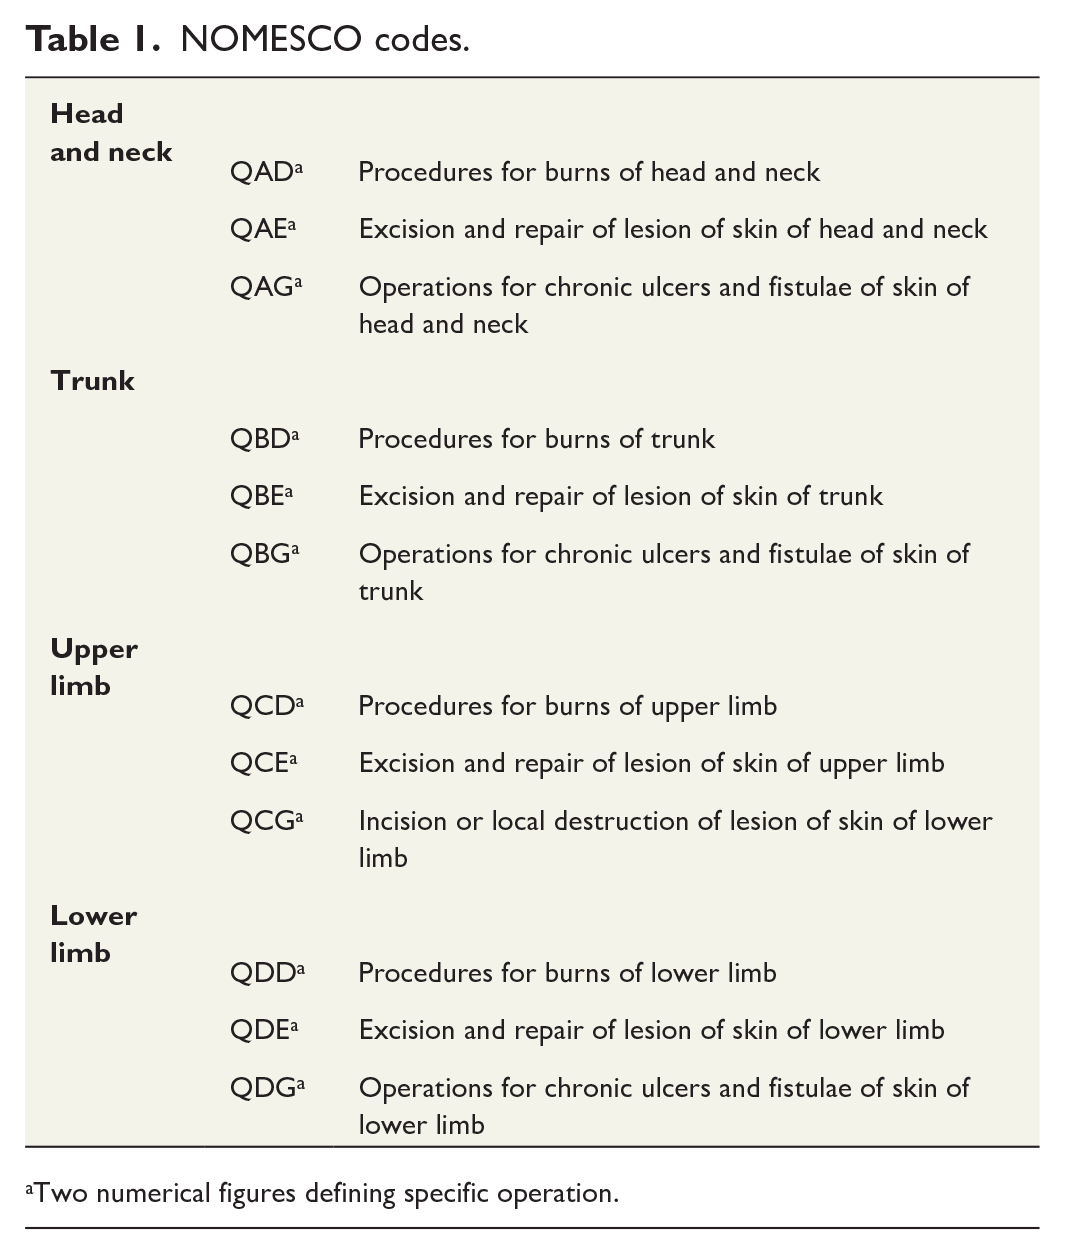
Two numerical figures defining specific operation.
Data were grouped according to purpose during the analysis; each patient was included once for demographic variables. Separate ICD-10 codes were included for anatomical incidence (i.e. the same patient may have had multiple hits). Patients who had ⩾2 inpatient days were considered to have been admitted in deeper analysis.
Finnish health care organization
In Finland, healthcare organizations include three levels: primary, secondary, and tertiary. Two of the latter are also defined as specialized healthcare including both inpatient and outpatient care. During our study period, the hospital districts in Finland were established by municipalities. These hospital districts provided secondary healthcare through central hospitals, while five university hospitals are responsible for highly specialized tertiary-level medical care.
Statistical analysis
We calculated the mean crude and adjusted incidence rates of burns as cases per 100,000 person-years by dividing the number of new cases in each age group by the population of that age group in Finland between 2011 and 2015. We assumed a Poisson distribution of cases for calculating 95% confidence intervals (CIs). Rates were calculated for the entire population and in age groups of 10-year intervals up to 80 years of age, stratified by gender and separately for different anatomical sites. Finally, we calculated the proportion of operatively treated patients and coverage operations.
The study was registered at Helsinki University. The Research Ethics Committee of Helsinki University originally approved the study in 2016, and permission was updated in 2020 (8/2020, no. 1190/2016). Patients of the sample were anonymized during the data collection process. No patients were contacted during the study and no concents from patients were not needed.
Results
From 2011 to 2015 in Finland, 16,575 patients with burn injuries were identified in the Care Register for Health Care. Of these patients, 63% were male. The mean standardized annual incidence rate per 100,000 person-years of any burn injury during the study period was 60.8 (95% CI 59.9–61.7). The corresponding values were 76.3 (95% CI 74.9–77.8) and 45.2 (95% CI 44.1–46.3) for male and female, respectively. Among patients admitted for ⩾2 days, the incidence rate per 100,000 was 10.9 (male 15.5 and female 6.5). Mean (SD) age of all patients was 32 (23) years. Mean (SD) age was 50 (27) years among patients admitted for ⩾2 days. The distribution of age groups by gender is shown in Figure 1. In total, 25% of male patients and 30% of female patients with burn injuries were aged 0–10 years; this was the largest age group of burn patients. Detailed data on the incidence of burn injuries across age groups are shown in Table 2.
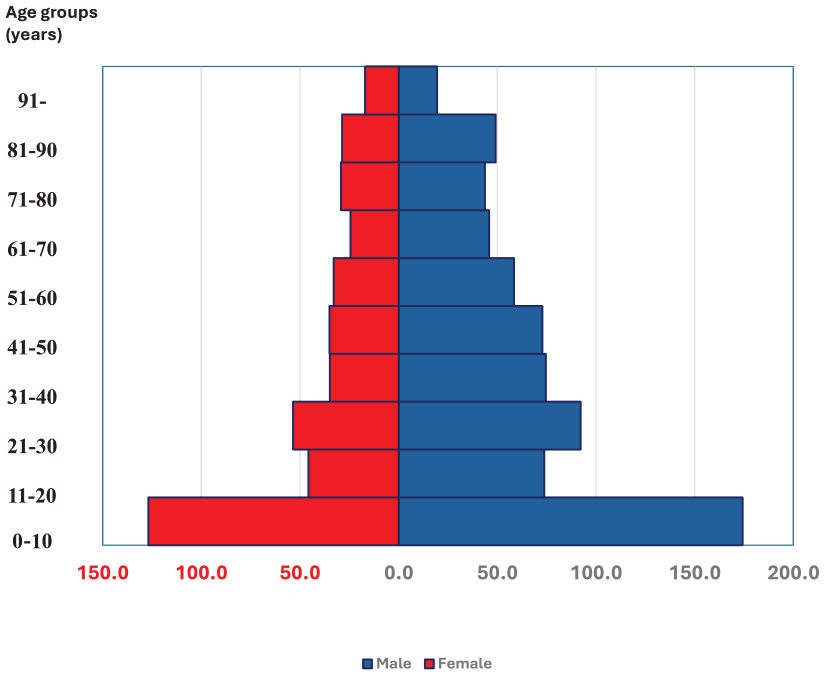
Standardized incidence of burn injuries by age groups and gender.
Age and admissions.
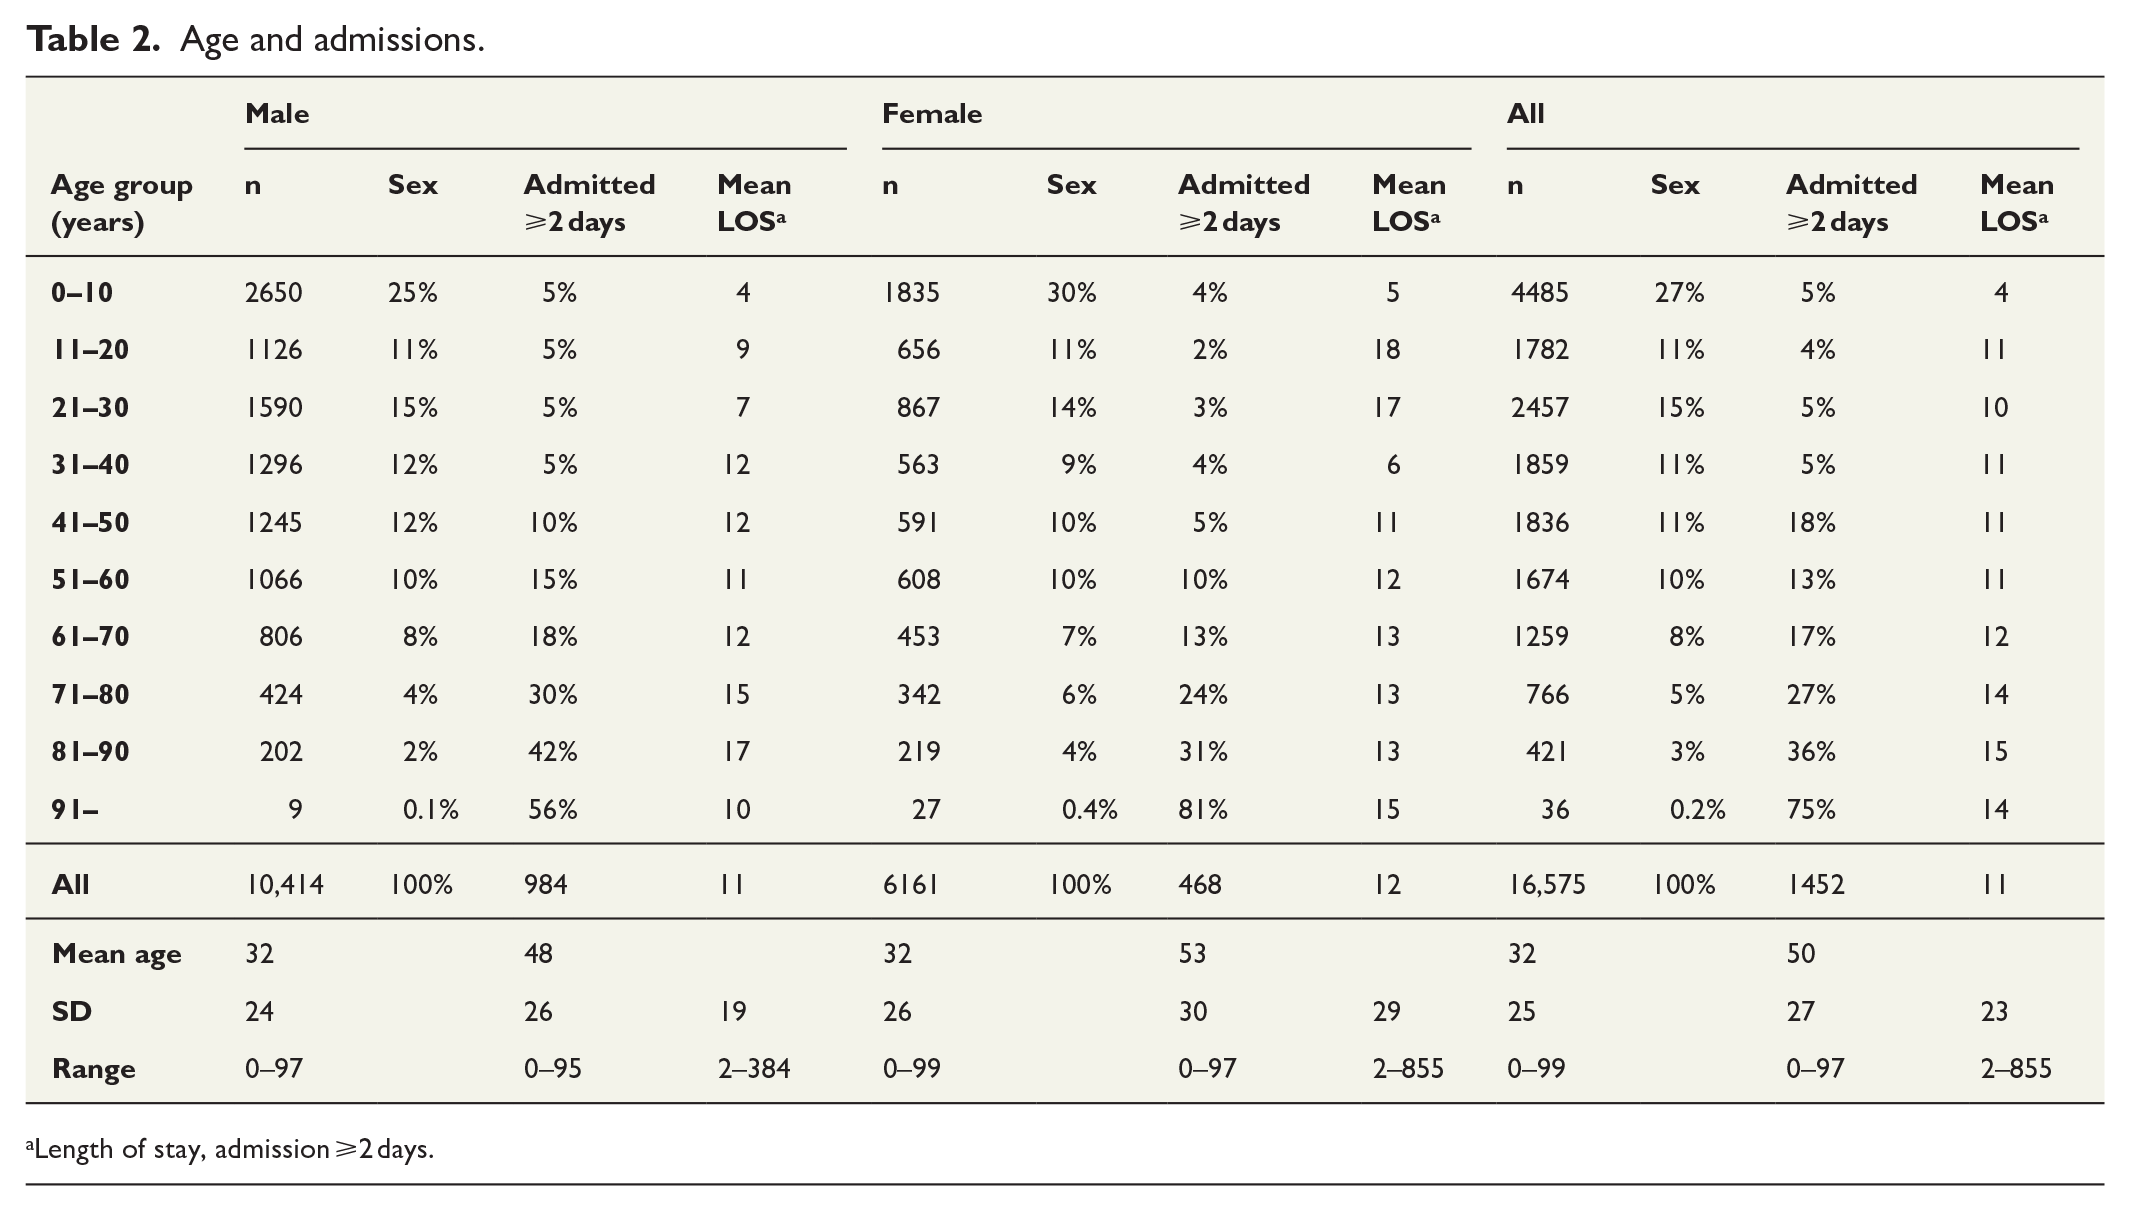
Length of stay, admission ⩾2 days.
During the study period, 28% of the Finnish population occupied five major cities of Finland; 24% of burn injuries were registered in these cities.
The total number of operations in the entire population was 3081 (male 2116 and female 965). Respectively, among those with LOS ⩾2 days, the total number of operations was 1482 (male 1058, female 424). Those with admission < 2 days include also dressing changes provided in a day surgery format, ER procedures and dressing changes. The hand and wrist were the most commonly injured body parts for both male and female patients (Figure 2). Among female, upper limb and head- and neck injuries had the highest proportions of operations and among male, respectively, upper- and lower-limb injuries. For female admitted ⩾2 days, foot injuries (54%) were most frequently operated. For male admitted ⩾2 days, over 50% of foot and lower-limb injuries were operated on (Table 3, Appendix tables).
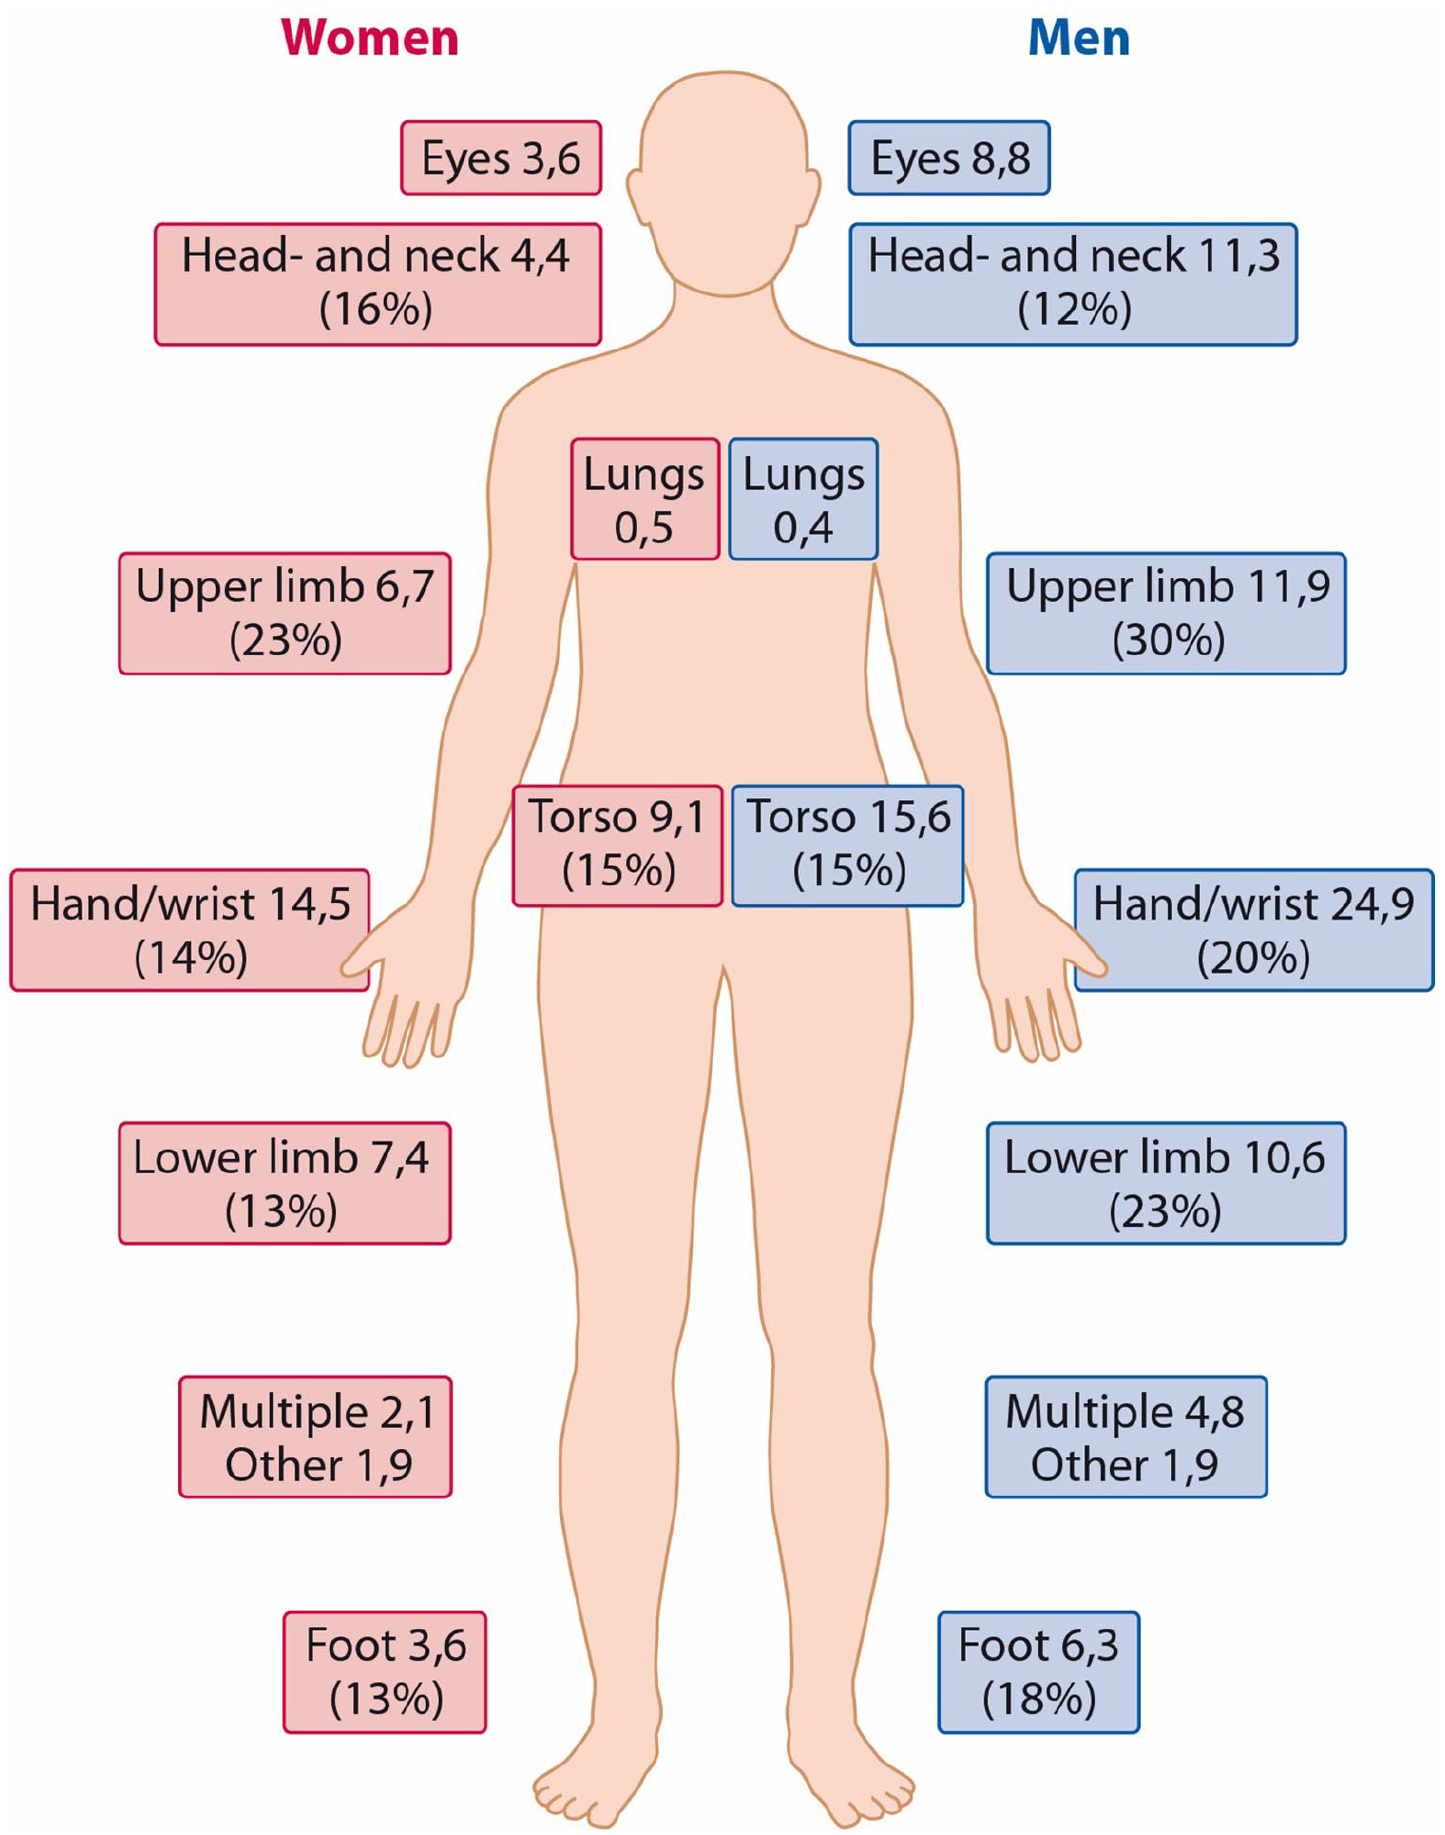
Anatomical incidence of burn injuries and proportion of operations (%).
Standardized incidence of burn injuries with admission ⩾2 days.
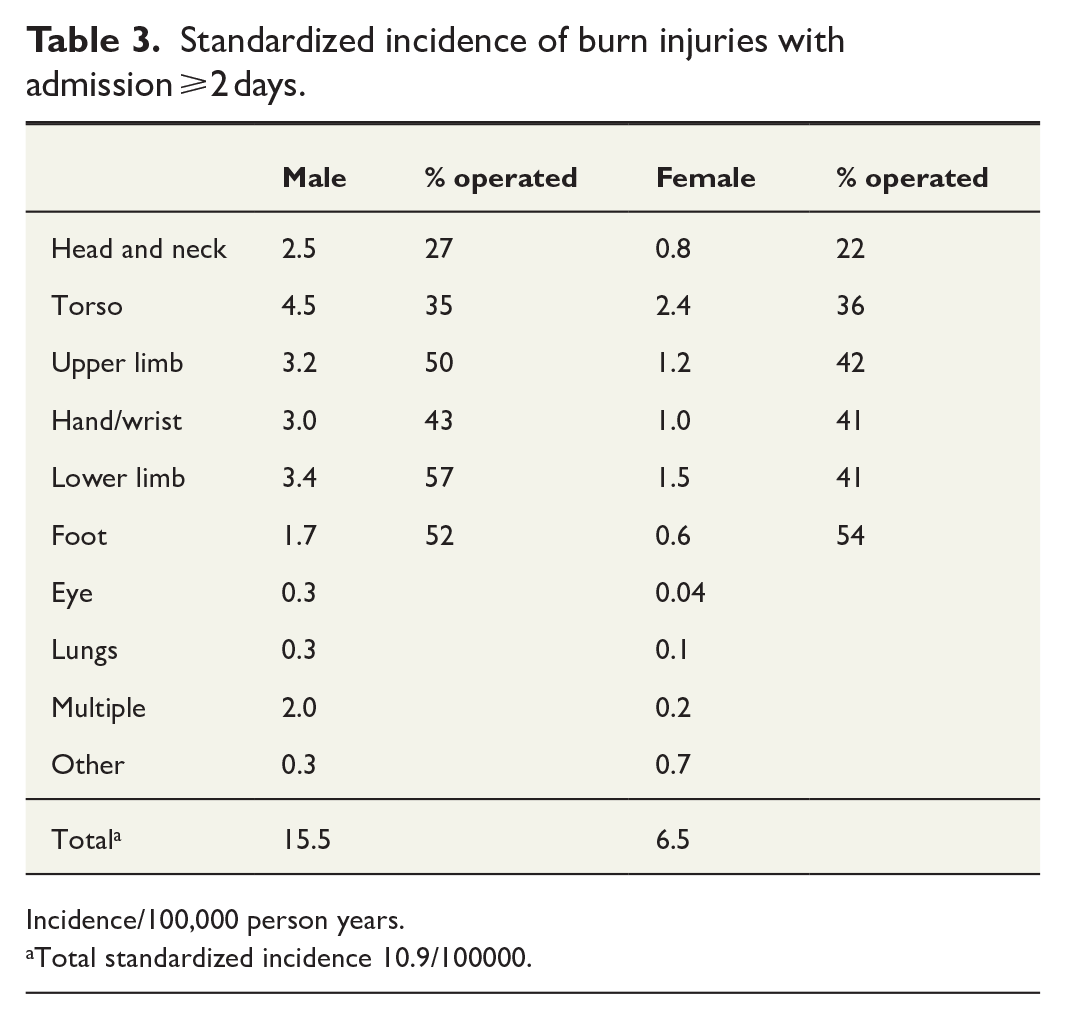
Incidence/100,000 person years.
Total standardized incidence 10.9/100000.
Altogether, 8.8% of patients were admitted for ⩾2 days (n = 1452). Of these, the mean (SD) inpatient time was 12 (29) days for female and 11 (19) days for male. Female patients aged 11–30 years had longer hospital length of stay (LOS) than male patients of the same age (mean [SD] LOS of female 18 [76] days; male 8 [10] days). Details by age and gender are shown in Figure 3. University hospitals (tertiary-level hospitals including burn units) treated 38% of burn patients admitted for ⩾2 days.
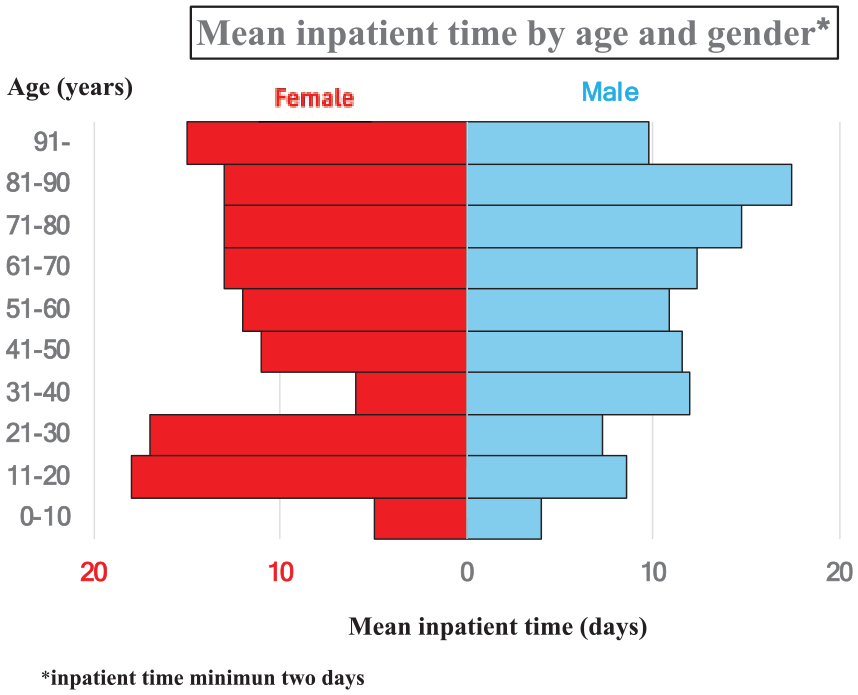
Mean inpatient time by age and gender.
Discussion
This was an epidemiological study of all burn patients treated in specialized care in Finland from 2011 to 2015. The material included 16,575 burn patients from any care level. We combined the anatomical distribution of injuries with information on operative care. This approach has not been used in prior Finnish burn studies and is also rare internationally.
Male had the most burn injuries (63%). Patients aged <10 years were at the highest risk of burn injury, followed by male patients aged 21–30 years. Injuries to the hand occurred most often but were rarely operated on. Instead, almost 20% of patients with lower limb and foot injuries had operative treatment. Altogether, 38% of patients had tertiary-level care provided by university hospitals. This includes patients who were treated in either of the two burn units. Inpatient care was less common among females than males, but the mean inpatient time of females was longer than that of male patients (12 vs 11 days).
Age and gender
Generally, our results regarding age and gender distribution are similar to those of previous studies. Interestingly, our data showed a slightly greater proportion of young girls among females than the corresponding proportion of boys among males. In our data, 6161 females had burn injuries, of which 1835 were among girls aged 0–10 years (30%). Similarly, males had 10,414 burn injuries, of which 2650 were among young boys 0–10 years (25%). The proportion of children among both genders was very similar, but boys had 140% more injuries than girls. This relationship increased to 170% when all cases were of males and females were included. It seems that females tend to get burn injuries in their childhood and less often later in life than males, who seem to be more vulnerable to burn injuries throughout their lives. It is possible that males have more high-risk behavior and maybe work-related risks from a young age and throughout their lifetime. 14
Using the same register covering the period from 1980 to 2010, Tanttula et al. 12 revealed that the mean annual incidence of hospitalized burn patients decreased from 30 to 17 per 100,000. They included all patients with hospital admission; we included all burn patients who were treated in specialist care but not necessarily hospitalized. This explains the difference in results between these studies. The previous study showed that the highest incidence of injuries occurred among boys below <10 years old. After the childhood, the incidence rate of burn injuries dropped among males and females but was lower among females throughout their entire lifetime. 12 We had the same finding in this study. A Dutch survey by van Zoonen and colleagues 15 focused on burn patients in primary healthcare. Boys had a higher prevalence of burn injuries than girls, but, interestingly, they observed that children aged 5–14 years were rarely treated in primary healthcare.
Inpatient time
Inpatient time reflects the severity of burn injuries; total body surface area (TBSA) correlates with inpatient time. However, many medical and social variables also affect inpatient time. We defined admission to inpatient care with a minimum inpatient time of ⩾2 days. This definition was used for deeper analysis. By this definition, we ensured that those included in the analysis required hospital care due to a burn injury and not due to secondary reasons. We also wanted to exclude day surgery patients who are defined with LOS 1 day in the Care Register for Health Care.
In our data, mean (SD) inpatient time of patients admitted for ⩾2 days was 11 (23) days; the corresponding values were 12 (29) days and 11 (19) days for females and males, respectively. Excluding the highest age groups (aged > 91 years), male patients had inpatient care more often than females. Males and females had similar LOS in the age group 0–10 years. In contrast, females in age groups 11–20 years and 21–30 years had longer inpatient times than males in the corresponding age groups.
Females aged 11–30 years had fewer burn injuries (1629 cases) than males (2848 cases) but had longer hospital LOS than males (mean [SD] females, 18 [76] days; males, 8 [10] days). The median LOS of genders is more similar between genders (females, 5 days; males, 4 days). Females had the longest inpatient times; 6.8% of female patients had LOS > 30 days (males 3.5%) and no male patient had LOS > 100 days. The register data do not explain why young female patients had longer LOS, but we assume that they had the most severe burn injuries in this age group.
Although some previous studies have also revealed female burn patients having fewer but more severe injuries than male patients, the reasons for these observation were not discussed. A systematic review by Brusselaers and colleagues 1 focused on studies on severe burn injuries in Europe. They had conflicting results, with shorter and longer inpatient periods for females in different centers. TBSA and inhalation injury were associated with longer inpatient time. Similarly, Williams and colleagues 16 observed that females had greater 60-day cumulative burn mortality even though only 27% of admissions were for female patients. In their study, the admitted females were older than the admitted males. 16 However, female patients in primary care have been observed in a Dutch study to have a higher proportion of appointments than male patients. 15
According to our study, 7% of females with burns were operated on in the age group 11–20% and 10% in the age group 21–30 years. This finding calls into question if young female patients really had more severe burns or if there were other factors that explain the longer hospital stay than male patients at the same age. Although Joestl et al. 17 revealed that females had a longer inpatient time after polytrauma, the injuries were similar between genders. Females were older than males in that study. 17 Females and males have different pain responses and thresholds due to numerous factors, including genetic, hormonal, and behavioral factors.18,19 Gender-biased pain behavior is also recognized. 20 As burn injuries are painful, it is possible that gender differences in pain behavior affect the longer admission time of young female patients with acute burn injuries.
Incidence of injuries
In our study, the mean standardized annual incidence of burn injury was 60.8/100,000 (95% CI 59.9–61.7) over the study period. Among those patients who were admitted for ⩾2 days, the incidence of burn injuries was 10.9/100,000. This result differs from the previous result of 17/100,000 in the Finnish population by Tanttula et al. 12 The previous study included only patients with any hospital admission and only the primary diagnosis. They also found that both male and female most frequently had hand injuries based on the primary diagnosis. 12 For anatomical incidence, we included all existing burn diagnoses with definition of anatomical site. In our sample, hand injuries had the greatest incidence, which is similar to the results of Tanttula et al. Hand injuries were less common among patients with LOS ⩾2 days.
Operative care
According to the European Burns Association guidelines for burn care, 21 injuries on the hand, face, or eyes are most often evaluated in secondary- and tertiary-level hospitals. In contrast, injuries of the torso or limbs are treated in primary care units unless the TBSA > 5% or the injury is evaluated immediately as a full-thickness injury. Only minor cases that do not heal within 2 weeks are referred to secondary or tertiary-level care units. In these patients, who are referred to secondary or tertiary care after conservative care in primary health care unit, the burn injuries are deeper, and the proportion of operations among these patients is higher in secondary and tertiary centers compared with more superficial face and hand injuries. However, injuries in special anatomical areas are more often referred to specialized care and have a higher incidence in our sample.
Our data include all patients with burn injuries who visited specialist care at least once. The data do not contain data on patients not referred to specialized care. We do not know the number of minor injuries treated entirely at the primary care level. These injuries did not need operative care. The data can be assumed very accurate on those patients, whose LOS was 2 days or longer.
Strengths
The Care Register for Health Care registry is a nationwide patient registry that has been validated as an accurate data source. 22 As the registry information must include ICD-10 diagnosis, the registry includes almost all burn patients with either admission or outpatient care in secondary or tertiary healthcare units. The Finnish personal ID system allows us to identify individuals and follow them in different healthcare units. Due to this, we were also able to combine diagnosis and operative care at the individual level.
Limitations
Registry information is always limited as it includes only collected information. The Care Register for Health Care also does not include patients who were treated exclusively in primary healthcare units. Our data may be biased due to this and include more severe burn injuries, which are more likely to be operated on. It is also worth to notice that Sund 22 did not include burn injuries while validating The Care Register for Health Care. We can still assume that the sensitivity for burn injuries follows the general trend, with other traumas being good. 22 Another limitation is that burn injuries are difficult to code in the ICD-10 system. Similarly, we were not able to use TBSA as this has not been systematically reported. In principle, the same injury can be coded either with anatomical burn diagnosis, with TBSA burn diagnosis, with a diagnosis defining the depth of the injury, or with some general burn injury diagnosis.
Conclusion
In Finland, the total standardized incidence of burn injuries in specialized care and the incidence of more severe burn injuries demanding hospital admission two or more days differentiate strongly. Children below 10 years old and working-aged males had the highest incidence of burn injuries. Gender differences were lighter within the youngest and oldest age groups. Male patients had longer LOS than female patients. Among all patients, hand- and wrist injuries were most common. Instead, among those with LOS ⩾2 days, lower limb- and torso injuries occurred most often. Notably, young females in the age group 11–30 years had fewer burn injuries (male 2848 cases vs female 1629 cases) but had longer inpatient times than males (mean inpatient time females 18 days vs males 8 days); median time was more similar (females 5, males 4 days).
As expected, surgical treatment is more common among those with more severe injuries. Professionals in primary care units have a high responsibility of recognizing those burn patients who should be referred to secondary or tertiary level units. Fluent and easy-access consultations, including also telemedicine, should still be developed. As children aged < 10 years have the most burn injuries, more family-focused prevention guidance is still needed.
In the future, more detailed studies combining register data and patient records are needed as pure register data never provide the full picture of injury. The greater LOS among females in specialized healthcare also warrants study.
Burn injuries are registered by primary care professionals, ER doctors, and those working systematically with burn injuries. Coding of burn injuries by ICD-10 codes has wide quality variations. To improve quality of register data in national registers, mandatory inclusion of both anatomical code and TBSA code should be developed.
Footnotes
Appendix
Incidence of injuries with admission ⩾2 days.
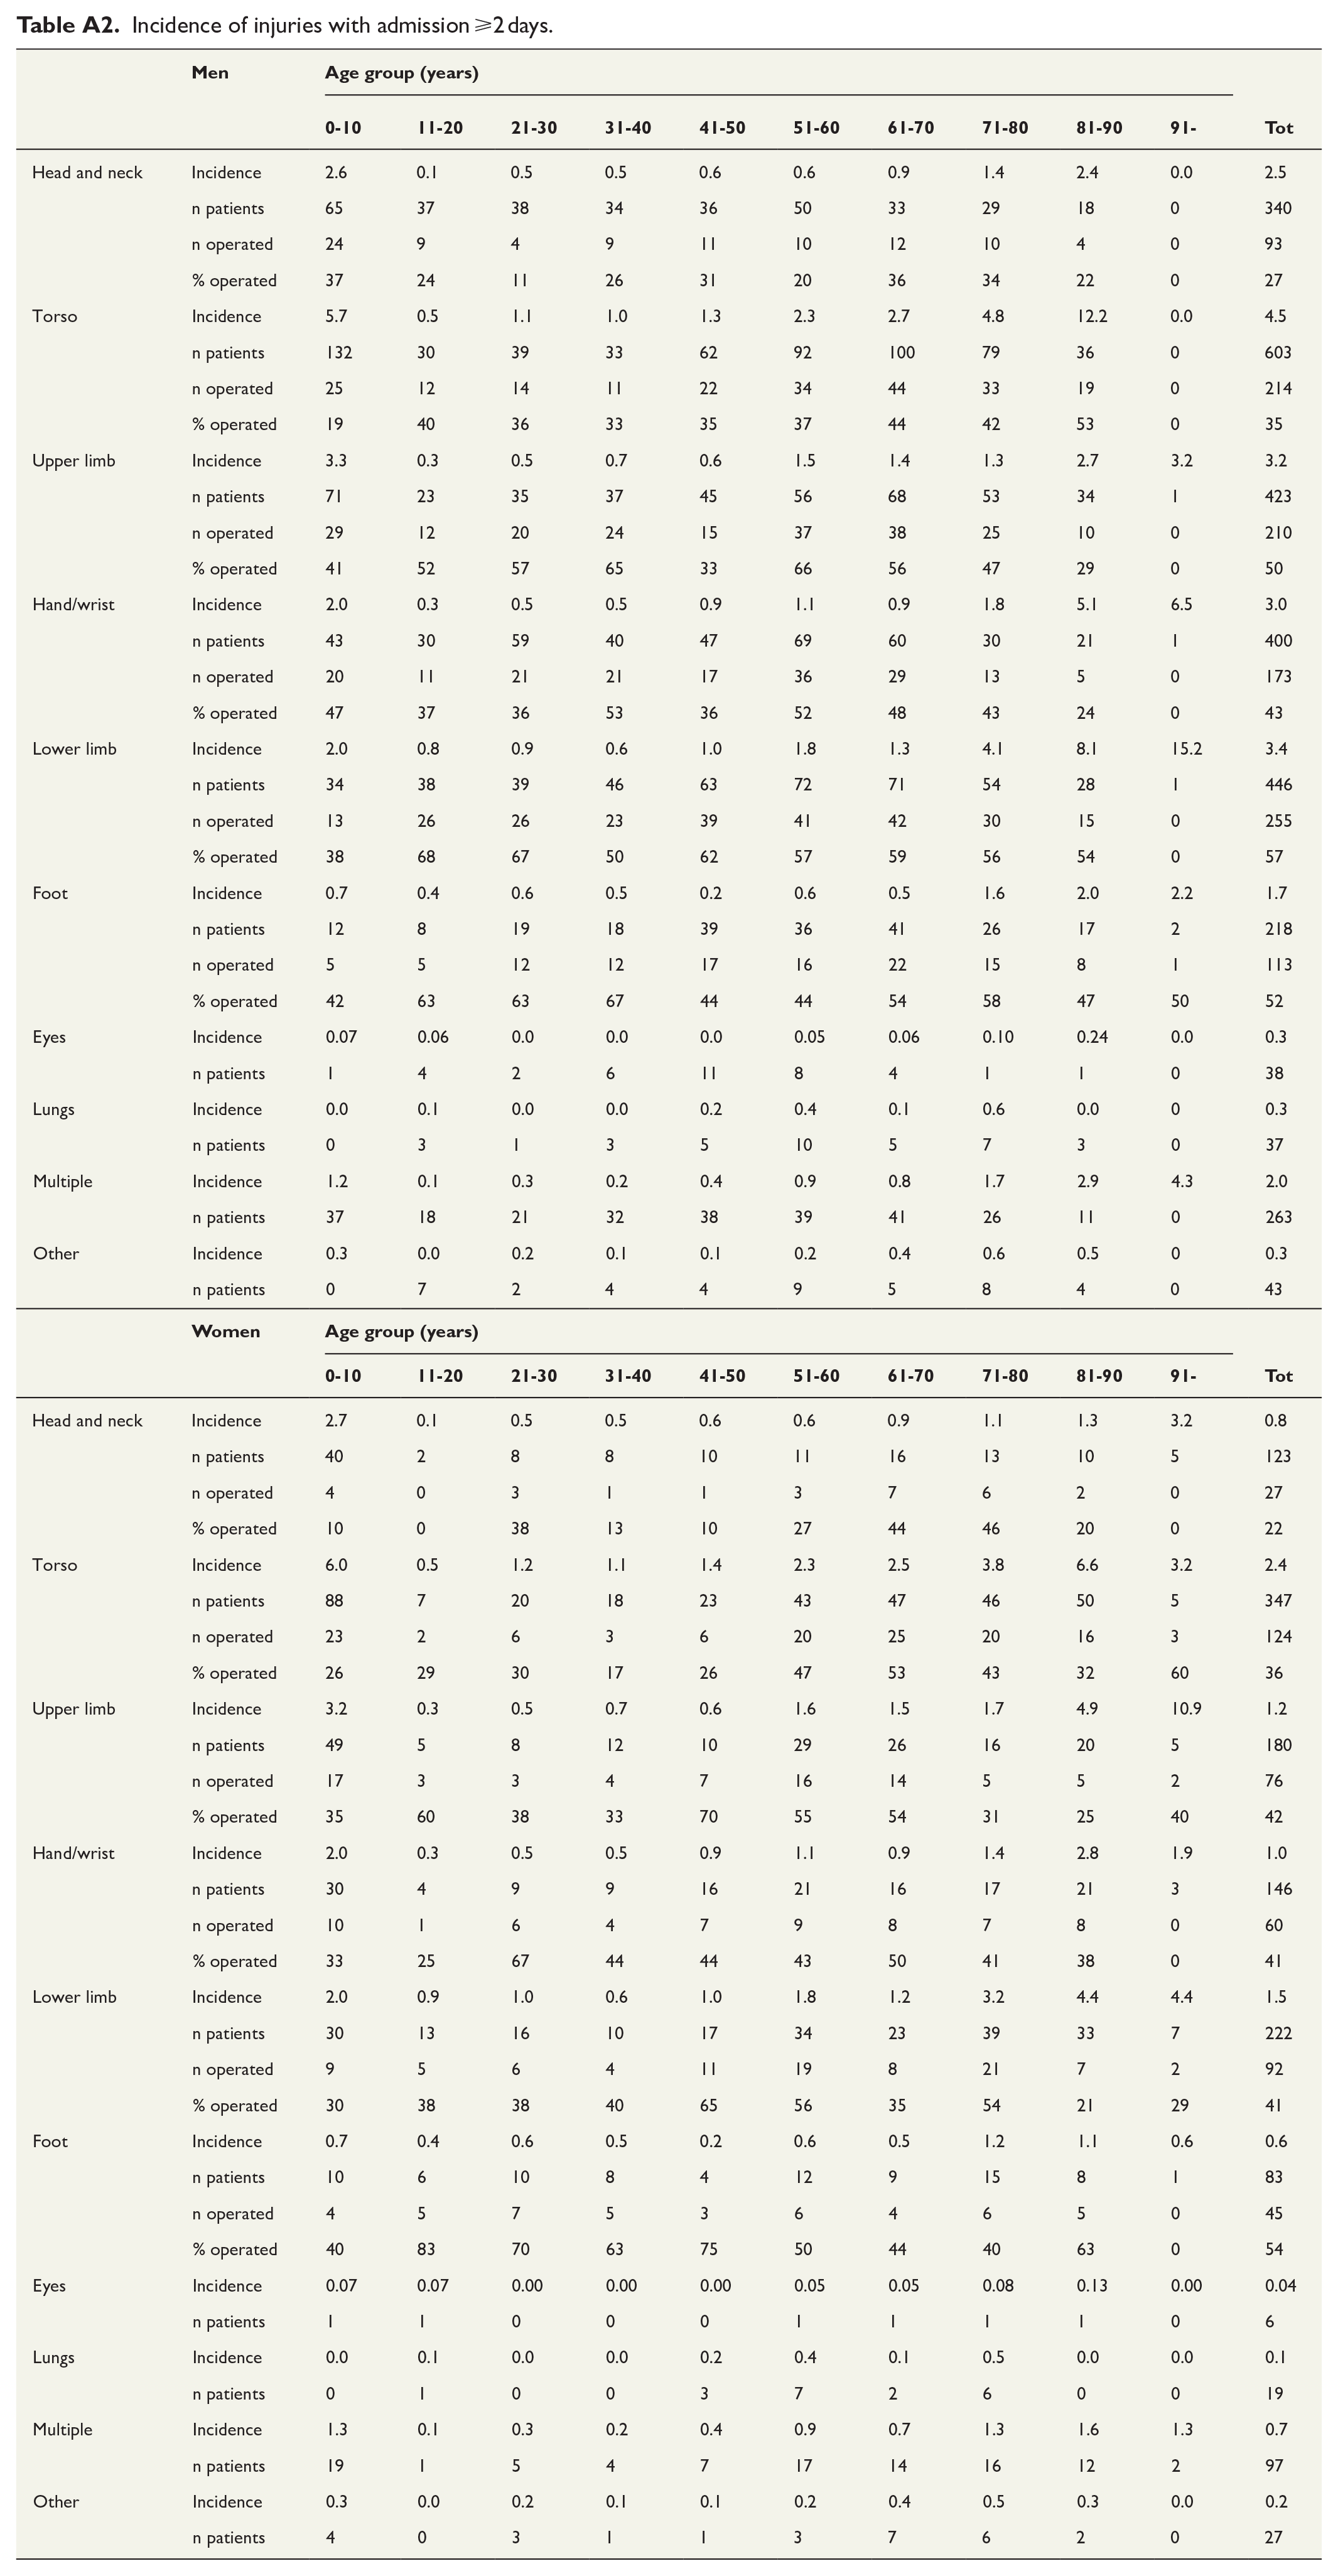
| Men | Age group (years) | |||||||||||
|---|---|---|---|---|---|---|---|---|---|---|---|---|
| 0-10 | 11-20 | 21-30 | 31-40 | 41-50 | 51-60 | 61-70 | 71-80 | 81-90 | 91- | Tot | ||
| Head and neck | Incidence | 2.6 | 0.1 | 0.5 | 0.5 | 0.6 | 0.6 | 0.9 | 1.4 | 2.4 | 0.0 | 2.5 |
| n patients | 65 | 37 | 38 | 34 | 36 | 50 | 33 | 29 | 18 | 0 | 340 | |
| n operated | 24 | 9 | 4 | 9 | 11 | 10 | 12 | 10 | 4 | 0 | 93 | |
| % operated | 37 | 24 | 11 | 26 | 31 | 20 | 36 | 34 | 22 | 0 | 27 | |
| Torso | Incidence | 5.7 | 0.5 | 1.1 | 1.0 | 1.3 | 2.3 | 2.7 | 4.8 | 12.2 | 0.0 | 4.5 |
| n patients | 132 | 30 | 39 | 33 | 62 | 92 | 100 | 79 | 36 | 0 | 603 | |
| n operated | 25 | 12 | 14 | 11 | 22 | 34 | 44 | 33 | 19 | 0 | 214 | |
| % operated | 19 | 40 | 36 | 33 | 35 | 37 | 44 | 42 | 53 | 0 | 35 | |
| Upper limb | Incidence | 3.3 | 0.3 | 0.5 | 0.7 | 0.6 | 1.5 | 1.4 | 1.3 | 2.7 | 3.2 | 3.2 |
| n patients | 71 | 23 | 35 | 37 | 45 | 56 | 68 | 53 | 34 | 1 | 423 | |
| n operated | 29 | 12 | 20 | 24 | 15 | 37 | 38 | 25 | 10 | 0 | 210 | |
| % operated | 41 | 52 | 57 | 65 | 33 | 66 | 56 | 47 | 29 | 0 | 50 | |
| Hand/wrist | Incidence | 2.0 | 0.3 | 0.5 | 0.5 | 0.9 | 1.1 | 0.9 | 1.8 | 5.1 | 6.5 | 3.0 |
| n patients | 43 | 30 | 59 | 40 | 47 | 69 | 60 | 30 | 21 | 1 | 400 | |
| n operated | 20 | 11 | 21 | 21 | 17 | 36 | 29 | 13 | 5 | 0 | 173 | |
| % operated | 47 | 37 | 36 | 53 | 36 | 52 | 48 | 43 | 24 | 0 | 43 | |
| Lower limb | Incidence | 2.0 | 0.8 | 0.9 | 0.6 | 1.0 | 1.8 | 1.3 | 4.1 | 8.1 | 15.2 | 3.4 |
| n patients | 34 | 38 | 39 | 46 | 63 | 72 | 71 | 54 | 28 | 1 | 446 | |
| n operated | 13 | 26 | 26 | 23 | 39 | 41 | 42 | 30 | 15 | 0 | 255 | |
| % operated | 38 | 68 | 67 | 50 | 62 | 57 | 59 | 56 | 54 | 0 | 57 | |
| Foot | Incidence | 0.7 | 0.4 | 0.6 | 0.5 | 0.2 | 0.6 | 0.5 | 1.6 | 2.0 | 2.2 | 1.7 |
| n patients | 12 | 8 | 19 | 18 | 39 | 36 | 41 | 26 | 17 | 2 | 218 | |
| n operated | 5 | 5 | 12 | 12 | 17 | 16 | 22 | 15 | 8 | 1 | 113 | |
| % operated | 42 | 63 | 63 | 67 | 44 | 44 | 54 | 58 | 47 | 50 | 52 | |
| Eyes | Incidence | 0.07 | 0.06 | 0.0 | 0.0 | 0.0 | 0.05 | 0.06 | 0.10 | 0.24 | 0.0 | 0.3 |
| n patients | 1 | 4 | 2 | 6 | 11 | 8 | 4 | 1 | 1 | 0 | 38 | |
| Lungs | Incidence | 0.0 | 0.1 | 0.0 | 0.0 | 0.2 | 0.4 | 0.1 | 0.6 | 0.0 | 0 | 0.3 |
| n patients | 0 | 3 | 1 | 3 | 5 | 10 | 5 | 7 | 3 | 0 | 37 | |
| Multiple | Incidence | 1.2 | 0.1 | 0.3 | 0.2 | 0.4 | 0.9 | 0.8 | 1.7 | 2.9 | 4.3 | 2.0 |
| n patients | 37 | 18 | 21 | 32 | 38 | 39 | 41 | 26 | 11 | 0 | 263 | |
| Other | Incidence | 0.3 | 0.0 | 0.2 | 0.1 | 0.1 | 0.2 | 0.4 | 0.6 | 0.5 | 0 | 0.3 |
| n patients | 0 | 7 | 2 | 4 | 4 | 9 | 5 | 8 | 4 | 0 | 43 | |
| Women | Age group (years) | |||||||||||
|---|---|---|---|---|---|---|---|---|---|---|---|---|
| 0-10 | 11-20 | 21-30 | 31-40 | 41-50 | 51-60 | 61-70 | 71-80 | 81-90 | 91- | Tot | ||
| Head and neck | Incidence | 2.7 | 0.1 | 0.5 | 0.5 | 0.6 | 0.6 | 0.9 | 1.1 | 1.3 | 3.2 | 0.8 |
| n patients | 40 | 2 | 8 | 8 | 10 | 11 | 16 | 13 | 10 | 5 | 123 | |
| n operated | 4 | 0 | 3 | 1 | 1 | 3 | 7 | 6 | 2 | 0 | 27 | |
| % operated | 10 | 0 | 38 | 13 | 10 | 27 | 44 | 46 | 20 | 0 | 22 | |
| Torso | Incidence | 6.0 | 0.5 | 1.2 | 1.1 | 1.4 | 2.3 | 2.5 | 3.8 | 6.6 | 3.2 | 2.4 |
| n patients | 88 | 7 | 20 | 18 | 23 | 43 | 47 | 46 | 50 | 5 | 347 | |
| n operated | 23 | 2 | 6 | 3 | 6 | 20 | 25 | 20 | 16 | 3 | 124 | |
| % operated | 26 | 29 | 30 | 17 | 26 | 47 | 53 | 43 | 32 | 60 | 36 | |
| Upper limb | Incidence | 3.2 | 0.3 | 0.5 | 0.7 | 0.6 | 1.6 | 1.5 | 1.7 | 4.9 | 10.9 | 1.2 |
| n patients | 49 | 5 | 8 | 12 | 10 | 29 | 26 | 16 | 20 | 5 | 180 | |
| n operated | 17 | 3 | 3 | 4 | 7 | 16 | 14 | 5 | 5 | 2 | 76 | |
| % operated | 35 | 60 | 38 | 33 | 70 | 55 | 54 | 31 | 25 | 40 | 42 | |
| Hand/wrist | Incidence | 2.0 | 0.3 | 0.5 | 0.5 | 0.9 | 1.1 | 0.9 | 1.4 | 2.8 | 1.9 | 1.0 |
| n patients | 30 | 4 | 9 | 9 | 16 | 21 | 16 | 17 | 21 | 3 | 146 | |
| n operated | 10 | 1 | 6 | 4 | 7 | 9 | 8 | 7 | 8 | 0 | 60 | |
| % operated | 33 | 25 | 67 | 44 | 44 | 43 | 50 | 41 | 38 | 0 | 41 | |
| Lower limb | Incidence | 2.0 | 0.9 | 1.0 | 0.6 | 1.0 | 1.8 | 1.2 | 3.2 | 4.4 | 4.4 | 1.5 |
| n patients | 30 | 13 | 16 | 10 | 17 | 34 | 23 | 39 | 33 | 7 | 222 | |
| n operated | 9 | 5 | 6 | 4 | 11 | 19 | 8 | 21 | 7 | 2 | 92 | |
| % operated | 30 | 38 | 38 | 40 | 65 | 56 | 35 | 54 | 21 | 29 | 41 | |
| Foot | Incidence | 0.7 | 0.4 | 0.6 | 0.5 | 0.2 | 0.6 | 0.5 | 1.2 | 1.1 | 0.6 | 0.6 |
| n patients | 10 | 6 | 10 | 8 | 4 | 12 | 9 | 15 | 8 | 1 | 83 | |
| n operated | 4 | 5 | 7 | 5 | 3 | 6 | 4 | 6 | 5 | 0 | 45 | |
| % operated | 40 | 83 | 70 | 63 | 75 | 50 | 44 | 40 | 63 | 0 | 54 | |
| Eyes | Incidence | 0.07 | 0.07 | 0.00 | 0.00 | 0.00 | 0.05 | 0.05 | 0.08 | 0.13 | 0.00 | 0.04 |
| n patients | 1 | 1 | 0 | 0 | 0 | 1 | 1 | 1 | 1 | 0 | 6 | |
| Lungs | Incidence | 0.0 | 0.1 | 0.0 | 0.0 | 0.2 | 0.4 | 0.1 | 0.5 | 0.0 | 0.0 | 0.1 |
| n patients | 0 | 1 | 0 | 0 | 3 | 7 | 2 | 6 | 0 | 0 | 19 | |
| Multiple | Incidence | 1.3 | 0.1 | 0.3 | 0.2 | 0.4 | 0.9 | 0.7 | 1.3 | 1.6 | 1.3 | 0.7 |
| n patients | 19 | 1 | 5 | 4 | 7 | 17 | 14 | 16 | 12 | 2 | 97 | |
| Other | Incidence | 0.3 | 0.0 | 0.2 | 0.1 | 0.1 | 0.2 | 0.4 | 0.5 | 0.3 | 0.0 | 0.2 |
| n patients | 4 | 0 | 3 | 1 | 1 | 3 | 7 | 6 | 2 | 0 | 27 | |
Author contributions
L.P. has collected the data and done the main data handling. L.P. has written the raw version of the article and designed the original versions of the tables and figures. J.V. has focused on the output of tables and figures. J.V. has also worked with a text and focused on good English performance. R.P. and H.K. have assisted during the writing process and focused on fluency of the text. S.H. has worked as a senior author focusing on statistical analysis with R software and has also assisted with a writing process with a special focus on statistics.
Declaration of conflicting interests
The author(s) declared no potential conflicts of interest with respect to the research, authorship, and/or publication of this article.
Funding
The author(s) received no financial support for the research, authorship, and/or publication of this article.