
Abstract
Alcohol is classified as a depressant drug or sedative hypnotic agent, potentially addictive, poisonous and with powerful toxic properties (Heather, 2001a). It tends to have one of the highest continuation rates (the proportion of first-time users who then maintain its use) of any documented psychoactive substance (Kendall & Hammen, 1995). Among other psychotropic substances, alcohol has been indicated as the most harmful recreational substance, whether abused or not, available to the public (Nutt et al., 2010).
People give a multitude of reasons for drinking (e.g., socialising) and the way they drink (e.g., moderately, sporadically) (Canham et al., 2021; Emiliussen et al., 2017; Haarni & Hautamäki, 2010; Immonen et al., 2011; Kuntsche et al., 2014; Kuntsche et al., 2005). In most cultures where alcohol is available, users seem strongly motivated to consume alcohol for its hedonic effect, derived, essentially, from the intoxicating nature of the substance (Heather et al., 2001; Peele & Brodsky, 2000), and this powerful motivation may be perceived either as harmless or harmful for different persons and for different reasons (Edgar et al., 2016; Haarni & Hautamäki, 2010; Ward et al., 2011). Alcohol use, overall, is a harmful behaviour regardless of the perceptions of its effects (Heather, 2001a; Moss, 2013; Vaillant, 1995).
The focus on older alcohol consumers and their drinking motives is important because alcohol consumption even at low doses places older persons at higher risk for incurring drinking-related problems relative to younger drinkers due, inter alia, to biological and cognitive vulnerabilities extant in the aging person (e.g., compromised health and/or psychomotor skills) (Anderson & Scafato, 2010). As is often underscored, alcohol-linked deterioration of physical and mental health, especially in older people, is a highly relevant individual and societal threat (Anderson & Scafato, 2010; Behrendt et al., 2021; Bye & Moan, 2020; Emiliussen et al., 2017; Hallgren et al., 2010; Sorock et al., 2006). To enhance our understanding of drinking behaviour among older adults, alcohol consumption must also be understood in terms of the personal context (e.g., psychological health) or situation in which drinking occurs (Carpenter & Hasin, 1998). Whether a person is likely to experience alcohol-related issues, either medical or non-medical, seems to be contingent not only on how often or how much alcohol people consume, but even more prominently on why people drink (e.g., in reaction to negative life events or to cope with negative emotions) (Brennan & Moos, 1997; Gilson et al., 2013). This latter issue has been largely ignored in Norwegian population surveys of older adults, where such an approach might possibly have offered novel methods to reduce or prevent the development of alcohol-related problems from occurring in later stages of life.
Background
Possible explanations of why some alcohol consumers may develop drinking problems while others do not have been suggested by several theoretical perspectives. These include both genetically inherited dispositions to addiction or dependence, and social learning based approaches to understanding drinking behaviour (personal histories of learning to drink, being in a social environment that provides opportunities to drink, and paradigms of physiological reinforcement) (Akers et al., 1989; Bandura, 1986; Heather et al., 2001). Overall, the evidence demonstrates that both personal (biology, psychological functioning) and environmental (e.g., availability of alcohol, social norms for drinking) factors in interplay contribute to the development of different patterns of drinking and of subsequent alcohol-related problems (Akers et al., 1989; Dare et al., 2020; Heather et al., 2001; Moos et al., 2004; Moos, Schutte, et al., 2010; Vaillant, 1995).
Drinking motivation
Among a number of possible theoretical approaches to alcohol consumption and problem drinking noted above, one which does deserve attention is that which emphasises the role of various drinking motives in understanding drinking behaviour (Cooper et al., 1992; Cox & Klinger, 1988). Drinking motivation is influenced by personal (e.g., biology, attitudes towards alcohol, drinking experiences) and environmental factors (e.g., socially accepted norms for drinking, cultural influences) (Cox & Klinger, 1988). Drinking motives encompass internal and external triggers or needs for alcohol use, and as a psychological function they serve emotion regulation through positive or negative reinforcement by means of alcohol (Cox & Klinger, 1988).
Based on data from samples of both adolescents and young adults, several types of drinking motivations have been identified from the development and revisions of the motivational model of alcohol consumption represented by the Drinking Motives Questionnaires (DMQ) (Cooper, 1994; Cooper et al., 1992; Grant et al., 2007; see Kuntsche et al., 2005, for review). Although with some variations in the number of dimensions (and their subtypes), drinking motivations common to all models have been differentiated as: internally generated coping motivation – involving negative reinforcement through avoidance or reduction of negative affect; externally triggered social motivation – social relatedness; and internally generated enhancement motivation – which involves positive reinforcement through facilitating or intensifying positive emotions (Cooper et al., 1992; Cox & Klinger, 1988). Carpenter and Hasin (1998) also indicated the importance of considering the intensity of self-reported drinking motivation on drinking behaviour, and in the context of alcohol-related problems. For instance, having a stronger coping motive (drinking to relieve anxiety, perhaps) has been found to be a risk factor associated with clinically diagnosed alcohol use disorders (Beseler et al., 2008; Carpenter & Hasin, 1999). Notably, a higher intensity coping motivation does not always relate to high levels of alcohol consumption (Hussong et al., 2005; Ralston et al., 2013). For example, individuals with anxiety symptoms may consume alcohol at low levels, but experience more averse alcohol-related consequences (Dennhardt & Murphy, 2011).
Drinking motivations are regarded as the most proximal predictors of both the amount and frequency of drinking, and of alcohol-related problems (Cooper et al., 1992; Cooper et al., 1995; Kuntsche et al., 2007; Kuntsche et al., 2010). In addition, in comparison to other drinking behaviour indices, drinking motives appear to out-perform both drinking amount and/or frequency (Brennan & Moos, 1997; Cooper et al., 1992; Cooper et al., 1995; Ertl et al., 2018; Gilson et al., 2013), and alcohol expectancies (Cronin, 1997; Kuntsche et al., 2007; Kuntsche et al., 2010; Neighbors et al., 2007) in the prediction of drinking behaviour and alcohol-related problems.
Possibly due to the fact that alcohol consumption by and large is initiated in early adulthood or sooner (DeWit et al., 2000; Pergamit et al., 2001), the wealth of research focused on understanding alcohol behaviour and problematic drinking based on drinking motivations has come from adolescent samples (e.g., high-school students) and young adults (e.g., college students) (Colder, 2001; Cox et al., 2006; Kuntsche et al., 2014; Kuntsche et al., 2006; Lau-Barraco et al., 2016; Mackinnon et al., 2017; Nehlin & Öster, 2019; Sjödin et al., 2021). A few studies investigating drinking motives in adults have also been reported (Beseler et al., 2008; Cooper et al., 1995; Crutzen & Kuntsche, 2013; Crutzen et al., 2013; Kaysen et al., 2007). Collectively, these studies indicate that a range of drinking motives underlie different alcohol behaviours, and therefore provide evidence of the heterogeneity of alcohol consumers based on their motivations to drink.
Drinking motivation: Affect regulation
Drinking motives have been noted to be essential in understanding alcohol behaviour (Cooper, 1994; Cooper et al., 1995); however, comparatively few studies have investigated drinking motives in older adults, and more specifically within context of alcohol-related consequences. These studies indicated that reliance on alcohol to avoid or alleviate unpleasant emotions (e.g., elicited by painful medical condition) occurs in some older adults (Immonen et al., 2011) and particularly those experiencing drinking problems (Brennan & SooHoo, 2013; Gilson et al., 2013; Gilson et al., 2017; Johnson, 2000; Moos, Schutte, et al., 2010).
One Australian study validating the Drinking Motives Questionnaire in a sample of older people (Gilson et al., 2013) reported that the most frequently endorsed motive for alcohol consumption was social motivation (for example, making social gatherings more enjoyable) followed by enhancement of positive feelings, and finally as a coping strategy (drinking to forget worries, for example). Only drinking as a coping strategy had a strong and direct association with drinking problems assessed by the Drinking Problem Index (DPI) (independent of the amount of alcohol consumed). In a more recent study, Gilson et al. (2017) further investigated this issue, and observed that specific aspects of coping motives were associated with drinking consequences as measured using the DPI. In this study, increases in drinking to relax, to manage physical health problems, and to feel more self-confident significantly raised the odds of reporting drinking problems (odd ratios: 2.2, 3.0 and 3.5 respectively). These motives for consuming alcohol effectively distinguished problem from problem-free drinking among older adults. In the same study, drinking to relax, to feel more confident, and to cheer oneself up (items within the “coping motives” dimension of the DMQ) were most frequently reported both by those with and without drinking problems. Another investigation from the US found that reliance on alcohol to manage distress, including to relieve anxiety, pain, and depression, was a strong predictor of late-life drinking problems (as assessed by the DPI) within a 20-year follow-up period (Moos, Schutte, et al., 2010).
The current study
This study highlights emotion regulation based drinking motives and explores their relative contributions in delineating profiles of older alcohol consumers self-reporting both non-problem and problem drinking assessed using the DPI scale (Finney et al., 1991). The DPI has a multi-focal approach to identifying and specifying drinking problems, and therefore this study is able to offer an enhanced insight into the most frequently experienced drinking problems within delineated cluster(s) including problem drinkers. In addition, due to the now identified salient role of gender in alcohol behaviour, and as indicated in previous research reporting associations between physical and mental health status and vulnerability for drinking consequences experienced by older adults, the inclusion of these personal characteristics in group profiles is hoped to enrich the results of the present study, and hence complement existing knowledge on alcohol use in older age groups. Here, then, we aim to: (1) explore the profiles of problem and non-problem drinkers based on their affective motivated drinking, and their relevance to gender and health status, and (2) identify the nature of problems most frequently experienced by problem drinkers.
Method
Participants
Participants in this cross-sectional investigation took part in a larger research project on quality of life among Norwegian older adults. For the main study, a postal questionnaire was mailed to a random sample of 6,000 men and women aged 62 and above taken from an eligible target population of 57,972 and randomly drawn by a commercial agency from the National Population Registry of community residents in central Norway (Sør-Trøndelag (S-T) county). The only eligibility criterion for participation in the study was a minimum age of 62 years. This is because the Norwegian pension system enables its citizens under certain terms to retire from the workforce at age 62. Thus, age 62, which for some can reflect retirement status, marks (albeit only arbitrarily) the transition from middle to older age, and was therefore set as the lowest boundary for eligibility to participate. There were no exclusion criteria, although potential respondents had to be able to read Norwegian to complete the questionnaire.
The main survey: Target population versus participants
In the present dataset, compared to the whole population in S-T county, men were over-represented. Based on official population statistics for the census year 2015 (Statistics Norway, 2015) for the target population, the gender distribution was 46% men and 54% women. In the survey response sample (n = 1,910), 52% were men and 48% were women aged between 62 and 99 years. In terms of age distribution and educational attainment, there were no obvious dissimilarities between the study sample and the target population.
The current study sample: Selection process
This study investigated profiles of alcohol consumers, and therefore lifelong abstainers (n = 149), former drinkers who reported they had not consumed any alcohol in the year prior to the time of data collection (n = 71), and those who did not provide information on drinking status (n = 9) were excluded from the dataset. The inclusion criteria also required that respondents provided information on the Drinking Problem Index (DPI) (n = 1,646) and answered a set of questions on drinking motives. From a total of 1,910 potential participants, 1,641 met these criteria. Due to lack of information on gender, 15 participants were removed from the dataset. The final analytical sample therefore included 1,626 respondents. The flowchart on sample selection is presented in Figure 1.
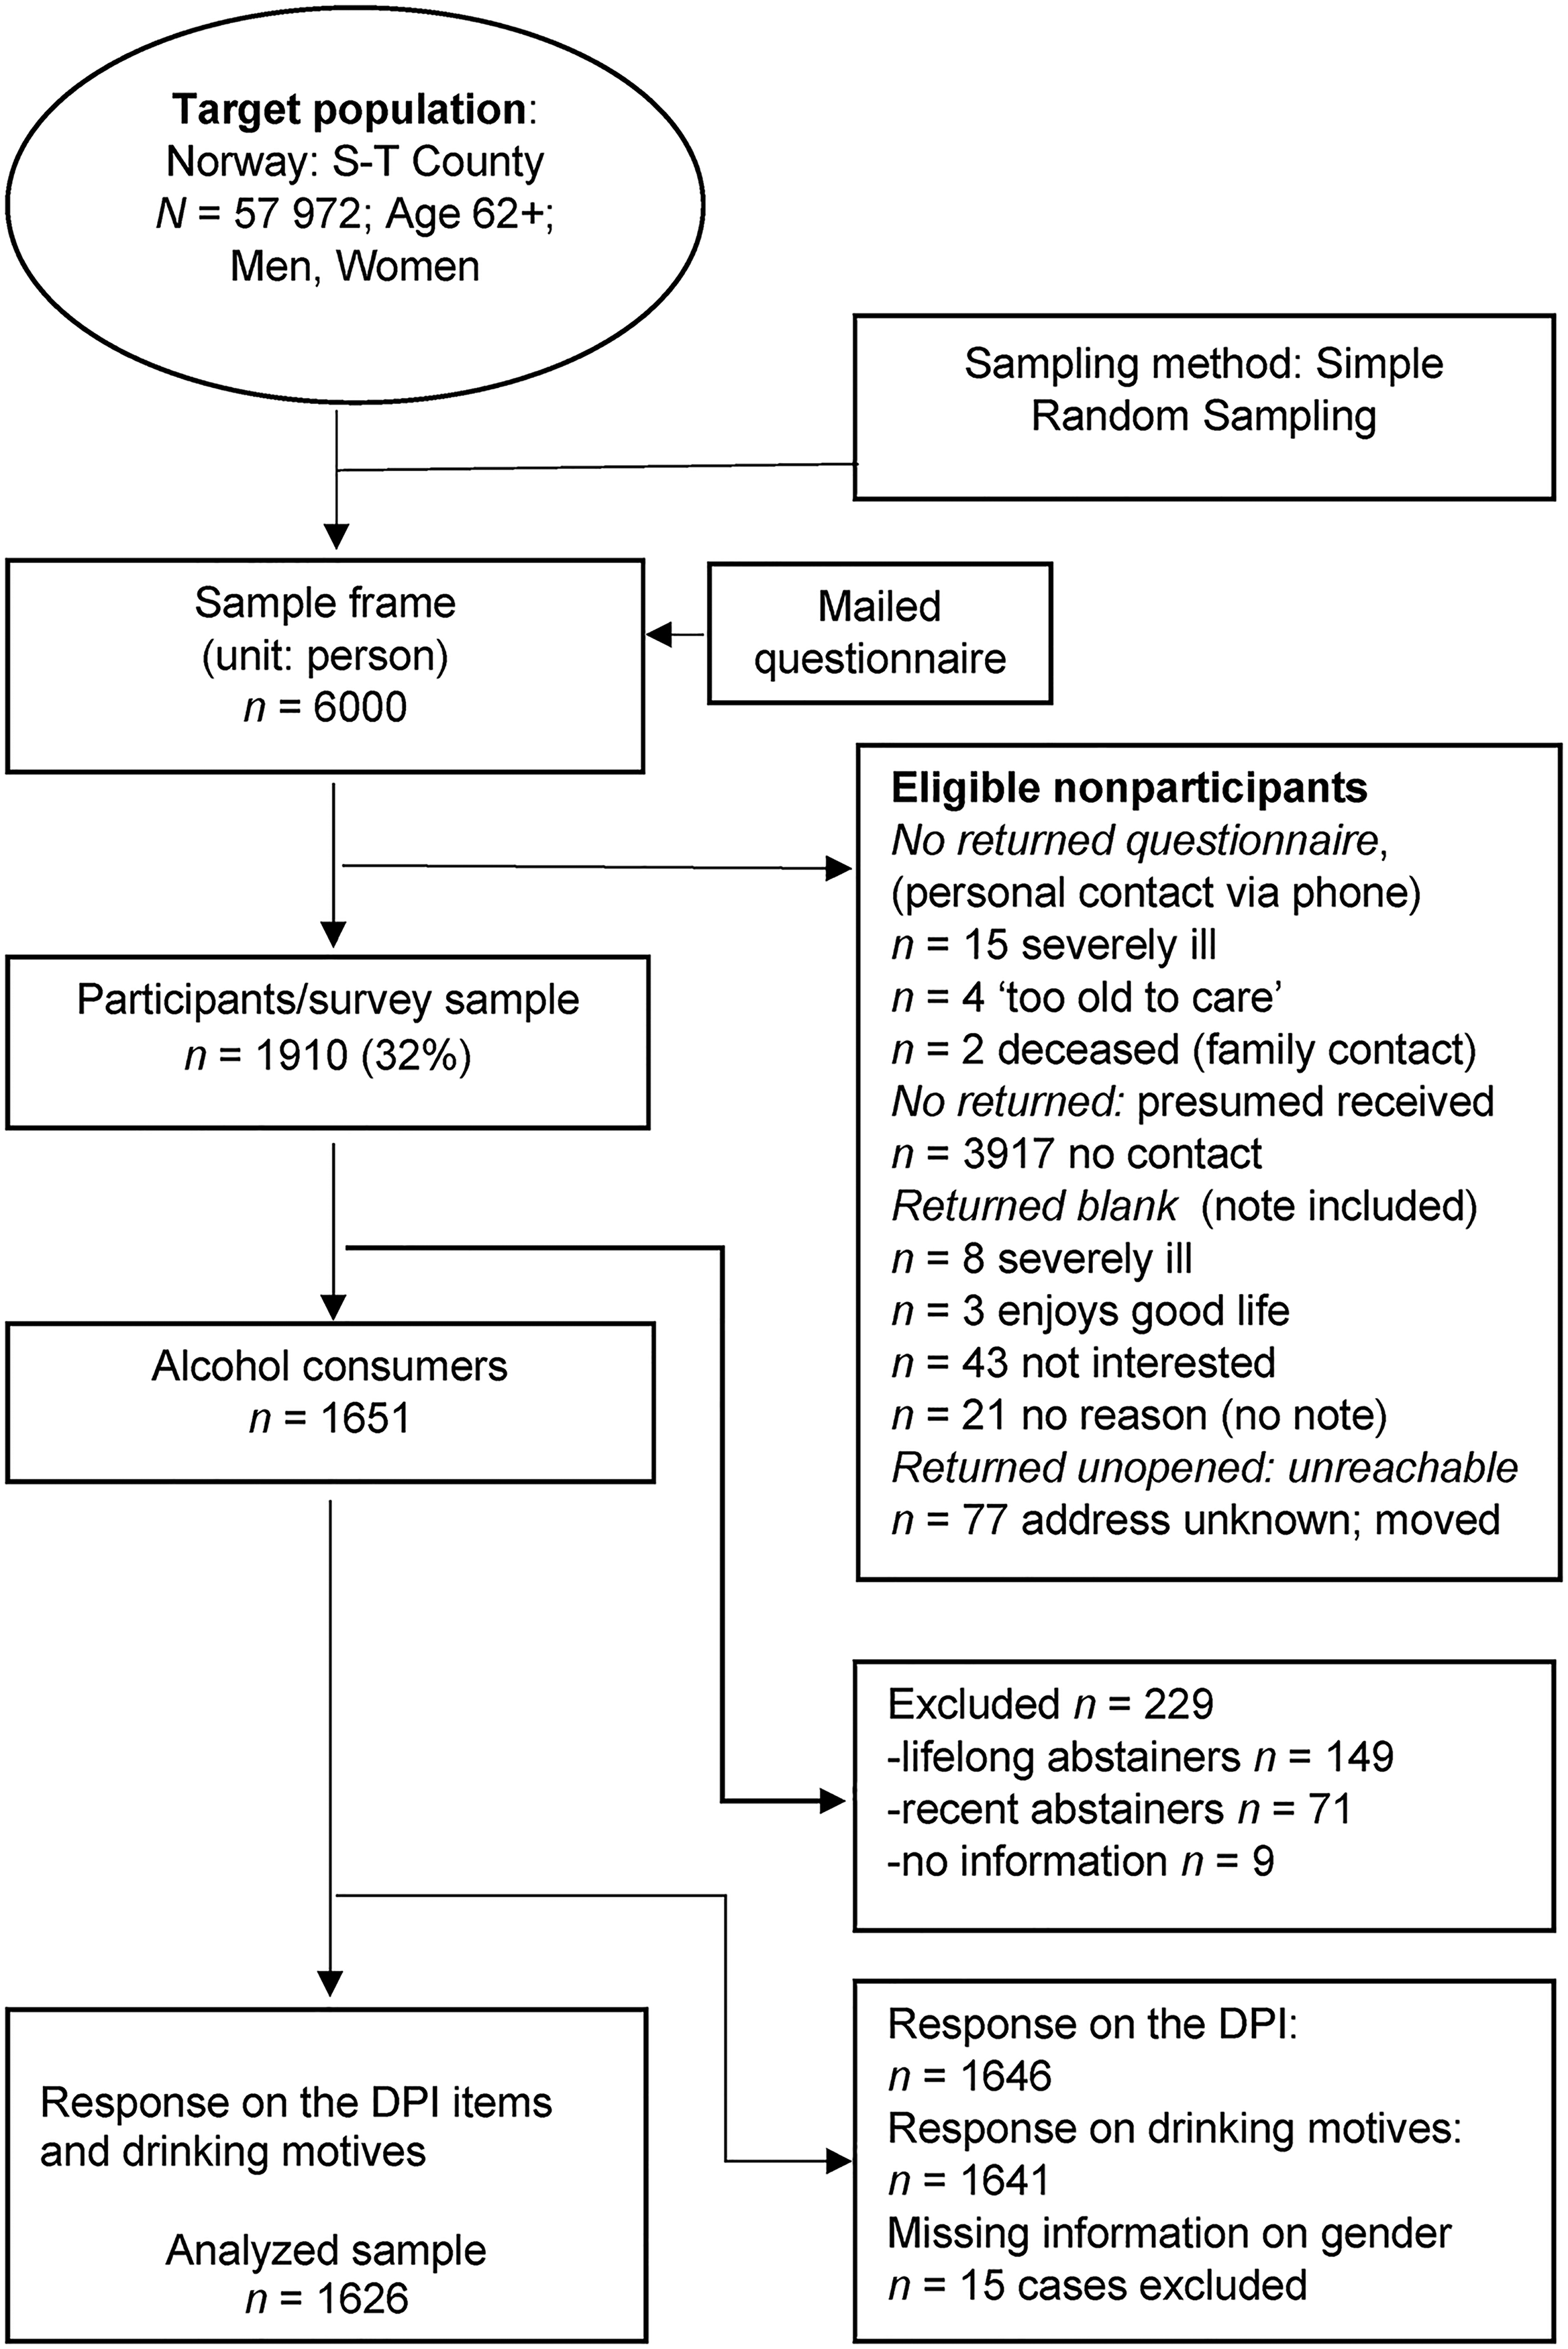
Flow chart of the sample selection process.
Procedure
Data were gathered in mid-2015. An invitation letter to take part in the study which accompanied the questionnaires assured strict anonymity of responses, and potential respondents were informed that they were free to ignore any question(s) they wished without the need for explanation. Unreturned questionnaires could not, however, be connected to any personally identifiable information, and so no reminder letter could be sent to non-respondents. Returned and completed questionnaires indicated informed consent (“silent consent”) to participate in the study. Responses with usable information (> 51% answers) to survey items were received from 1,910 (32%) respondents of the sample frame.
All parts of this study were in accordance with the ethical standards of both the university ethics committee and the Norwegian Regional Committee of Medical Research and Health Research Ethics (permission number 2015/214), and with the 1964 Helsinki declaration, and its amendments or comparable ethical standards (World Medical Association, 2013).
Measures
Drinking motives
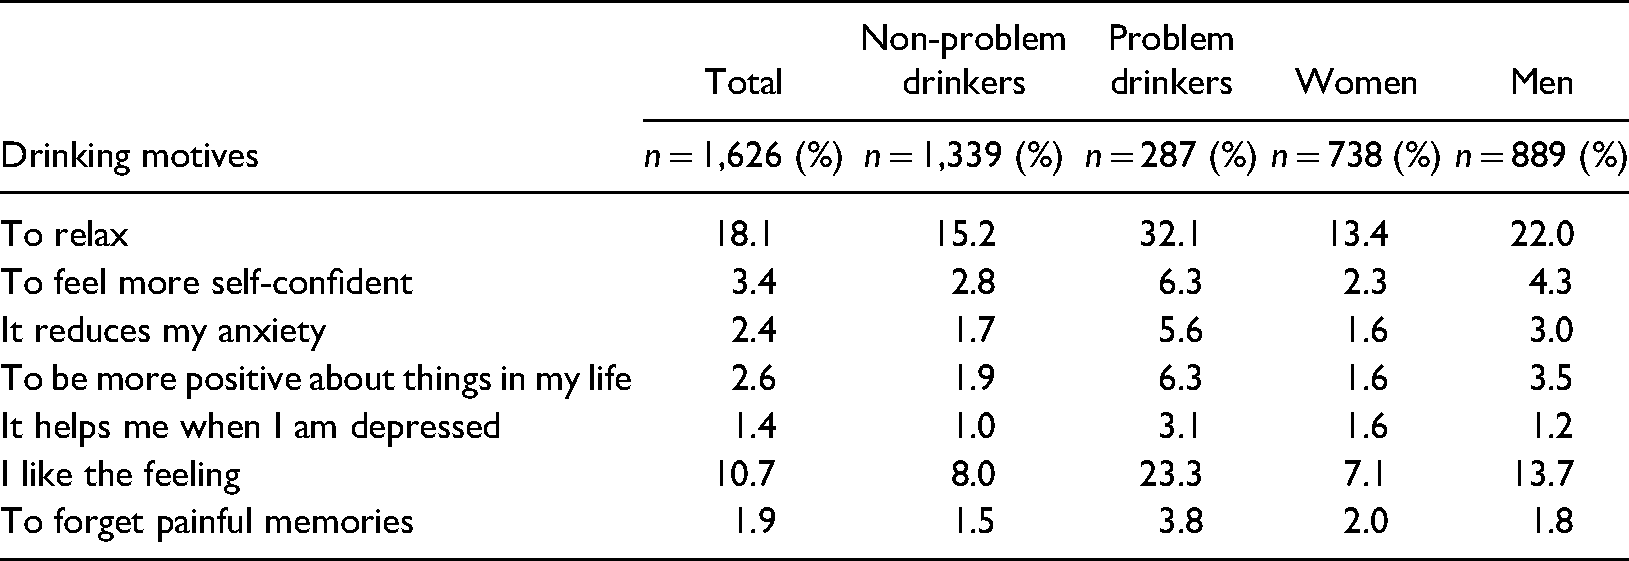
The assessment of drinking motives covered individual items conceptually reflecting those emerging from factor analyses as “coping” motives and “enhancement” motives which have been included in motivational models of alcohol consumption (Cooper et al., 1992; Grant et al., 2007). The items included in this study were considered to provide sufficient information to meet the study objective. The questions on drinking motivations were translated into Norwegian following guidelines for international research by the World Health Organization (WHO) (1998). The seven items representing drinking motives are listed in Table 1. Participants were asked to indicate the level of agreement with the motive of their alcohol use in a variety of situations. Seven Likert-type items representing drinking motives were measured using a six-point scale: 1 = completely disagree, 2 = disagree, 3 = somewhat disagree (negative ambivalent), 4 = somewhat agree (positive ambivalent), 5 = agree, and 6 = completely agree. For descriptive purposes, the scale was dichotomised into 0 = no (negative and ambivalent statements: merged scores 1 to 4) and 1 = yes (positive statements: merged scores 5 and 6).
Drinking motives by non-problem and problem drinkers, and gender.
Drinking Problem Index (DPI)
Alcohol-related problems were assessed with the 15-item shortened version of the Drinking Problem Index (DPI) (originally 17-items; Finney et al., 1991), a non-diagnostic scale designed for use with a general population of older adults. The scale was translated according to the guidelines for international research (WHO, 1998). The DPI covers functional (e.g., self-care neglect), psychological (e.g., confusion) and interpersonal (e.g., family complaints) problems attributed to alcohol. In our survey, two DPI items “(to) get high” and “(to) forget worries” were not included due to their low predictive power of problem drinking reported by Finney et al. (1991). In addition, the English wording of the item “get high” could not be meaningfully translated into an equivalent Norwegian expression without a risk of offending older persons, and hence possibly risk a lower participation rate in the main survey. Moreover, due to omission of the two items in the survey we were unable to statistically test the strengths of association between them and drinking motives items, and hence detect whether a methodological problem might arise such as affecting the results derived from cluster analysis.
The frequency of indicated alcohol-related problems experienced in the past year prior to data collection was scored on a five-point Likert scale for each of the 15 items: 0 = never, 1 = once or twice, 2 = occasionally, 3 = fairly often, and 4 = often. The sum of the endorsed frequencies of all drinking problems, whether experienced or not, forms the total score. In the 15-item version the potential score range was 0 to 60 (maximum score of 4 for all 15 items). Following scoring guidelines provided by Finney et al. (1991), a DPI score 0–1 defined non-problem drinkers (hereafter nPD), and the DPI score ≥ 2 (a minimum of two endorsed questions with a value of 1 point each, irrespective of the nature and frequency of encountered problems) defined problem drinkers (hereafter PD). In this study, the scores were dichotomised, where the absence of PD (DPI score 0 or 1) was coded 0 = no and the presence of PD (DPI score was ≥ 2) coded 1 = yes, thus representing a single value for any of the possible scores between 2 and 60. For descriptive purposes, responses were dichotomised into ‘None/Present’. None corresponded to 0 (i.e., never) and Present = 1 based on four merged categories 1 = once or twice, 2 = occasionally, 3 = fairly often, and 4 = often. The DPI items are listed in Table 2, which describes the frequency of reported PD in the total sample, by gender, and cluster membership.
Drinking problems by gender and cluster membership.
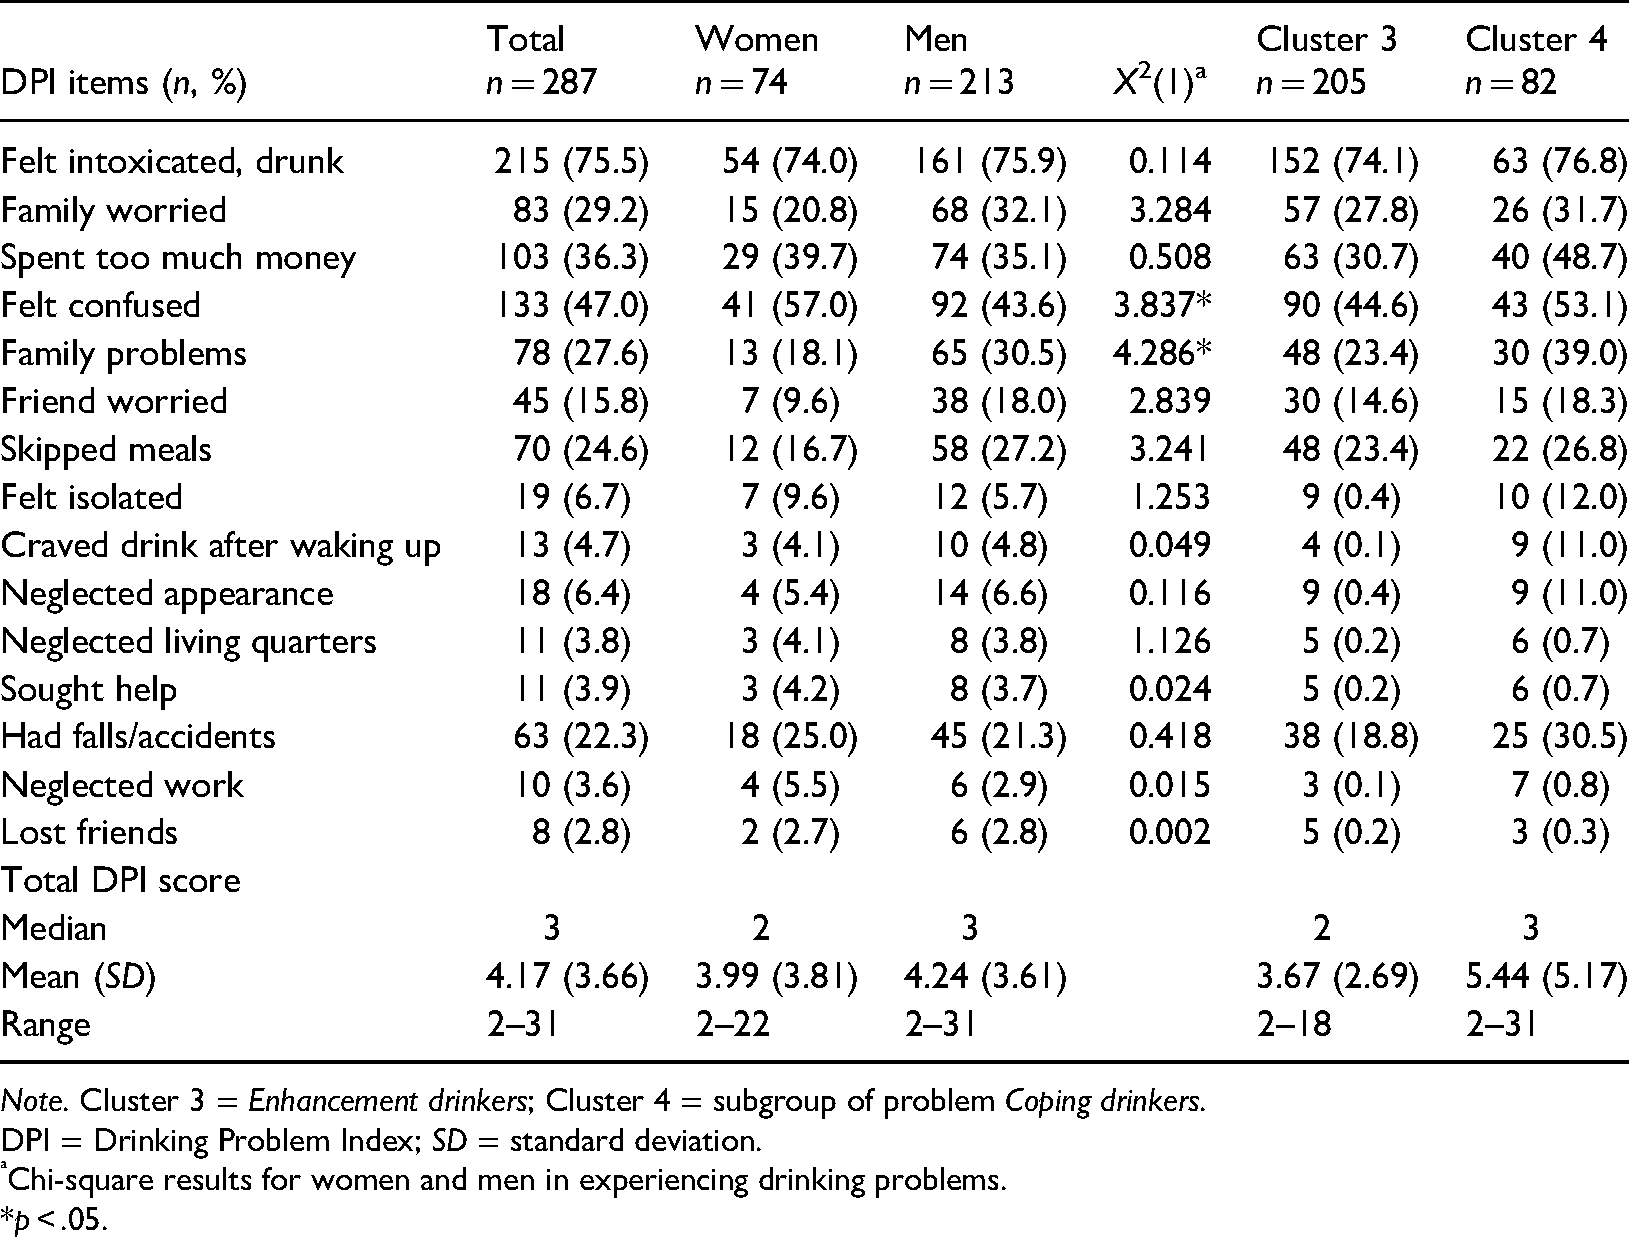
Note. Cluster 3 = Enhancement drinkers; Cluster 4 = subgroup of problem Coping drinkers.
DPI = Drinking Problem Index; SD = standard deviation.
Chi-square results for women and men in experiencing drinking problems.
*p < .05.
The psychometric properties of the DPI among older adults have been investigated in studies using middle-aged and older adults (Bamberger et al., 2006; Finney et al., 1991; Gilson et al., 2017; Kopera-Frye et al., 1999). Overall, these studies have documented high internal consistency (alphas ranging from .80 to .94), good score performance (item-total score correlations = .71) and satisfactory construct and predictive validity. For the present sample, the internal consistency of the DPI 15-item scale was quite satisfactory (α = .85).
Sex/gender, mental health, physical health
In addition to gender, which has been found highly relevant to drinking behaviour and consequences of drinking (Homila & Raitasalo, 2005), physical and mental health have also been frequently indicated as important personal contexts within which drinking occurs, especially in older adults (Center for Substance Abuse Treatment, 1998). In cluster analysis, sex/gender, mental health, and physical health served as three evaluation variables. A short note on this specific methodological feature will be provided below in the subsection “Two-step cluster analysis”.
Sex/gender was coded as 1 = women and 2 = men. Physical health and mental health were assessed using two selected dimensions of Physical Health and Psychological Health of the Norwegian version of the World Health Organization Quality of Life-BREF (WHOQOL-BREF) scale (WHO, 1998). For the Physical Health (PHYS – 7 items) and Psychological Health (PSY – 6 items) domains, ratings were made on five-point Likert scales (from 1 = very dissatisfied to 5 = very satisfied) with reference to the last two weeks. A higher score indicates higher quality of life (QoL) on these dimensions. The data handling was conducted according to the WHO protocol (WHO, 1998). In this study, the raw scores for PHYS and PSY dimensions were transformed into the value ranges based on quartiles with equal percentiles: Q1 = lowest, Q2 = low–medium, Q3 = medium–high, and Q4 = high.
The psychometric properties of the WHOQOL-BREF among older adults (60 years and older) have been internationally investigated in several Western and non-Western countries (Carrasco et al., 2011; Chachamovich et al., 2007; Hawthorne et al., 2006; Hwang et al., 2003; Kalfoss et al., 2008; Suárez et al., 2018; Von Steinbüchel et al., 2006) with satisfactory results. In the Norwegian normative study by Kalfoss et al. (2008), and in our study as well, the internal consistency coefficients (Cronbach's α) for the WHOQOL-BREF in the PSY and PHYS domains were the same at .87 and .82 respectively. The domains and facets of the WHOQOL-BREF are listed in Appendix A.
Missing data handling: Drinking motives
In the sample of 1,646 alcohol consumers who provided information on drinking status, 93 participants had drinking motives items missing, ranging from 7.7% to 100%. Five respondents who had missing values on all items were removed from the dataset. Little's Missing Completely at Random (MCAR) test was significant (p < .05; χ2 = 522.074; df = 330) indicating that data were not missing at random. In that case, following recommendation by Hair et al. (2015), and Schafer and Graham (2002), missing data for the remaining 88 cases were replaced by estimate values using the EM (Expectation-Maximisation) approach which finds maximum likelihood estimates of parameters (e.g., means, standard deviations). This operation provided a sample for two-cluster analysis of n = 1,641 with complete data on the drinking motives items. However, as noted above, due to the removal of 15 respondents with missing information on gender, the analytical sample was reduced to 1,626 cases with complete information on input variables.
Data analysis
In this study, all described analyses were run in SPSS version 25. Frequencies of the self-reported nature of experienced drinking problems assessed using the DPI scale were examined by univariate analysis. Comparisons between groups were conducted using the Chi-square statistic test with p < .05. Given the objective of cluster analysis, statistically significant differences were expected between clusters.
Two-step cluster analysis
An exploratory two-step cluster classification method was used to identify homogenous groups based on seven continuous variables (drinking motives), and one categorical variable (the DPI score). This analytical method was selected for two main reasons. First, it is suitable for large datasets to be efficiently analysed (above 1,000 observations) (Norusis, 2011). Second, it has the ability to simultaneously handle categorical and continuous variables which are automatically transformed based on the log-likelihood distance measure (Tkaczynski, 2017). Noted as a major hallmark of two-step cluster analysis, this procedure ensures that no single variable dominates the cluster solution (Chiu et al., 2001; Tkaczynski, 2017). It also enables use of an automated cluster selection where the clustering algorithm finds a statistically optimal number of clusters based on, for instance, Schwarz's Bayesian Information Criterion (BIC). That is, BIC estimates the relative quality of each cluster in relation to each other cluster within a cluster collection. The lower the BIC value, the better the model describes the data. However, the best cluster solution indicated by BIC can be over-ridden by the user when considering the practical meaning of identified groups (Hair et al., 2015). One additional function in the two-step cluster allows the final cluster solution to be evaluated in one step by variables of interest. That is, an “evaluation” or descriptive variable(s) will not have any impact on cluster formation, but will provide additional information in the interpretation and profiling stage of delineated segments.
Outliers
The cluster structure is sensitive to outliers (respondents with atypical profiles compared to more typical respondent profiles) which may make the derived clusters unrepresentative of the actual population structure (Hair et al., 2015). The two-step cluster algorithm is designed to detect and, if necessary, to handle the problem of outliers (treating all of them as a separate cluster) (Chiu et al., 2001).
Quality of the cluster structure.
Identification process of parsimonious cluster solution
In the first step, the analysis was run with eight variables using the default option with an auto-determined maximum number of 15 clusters. Based on the BIC estimates a two-cluster automatically generated solution was identified as one that would statistically best represent the data structure, assuming no outliers (a solution with cases with extreme scores regarded as “valid outliers”). The graphic depiction of the BIC change is presented in Figure 2. For the purposes of our study, a two-cluster solution would not be sufficiently informative because it did not result in segments that satisfactorily characterised non-problem drinkers or problem drinkers in terms of practical utility (e.g., high group heterogeneity in scores distribution along the scale). According to the scree-plot, the first marked change (elbow bend) in BIC values occurred at a three-cluster solution. However, the slope decreased more steeply (albeit with a less sharp bend) at the adjacent point between the four and five cluster structure, after which BIC values changed only slightly onwards as indicated in the flattening line on the scree-plot. The point at which the slope markedly changes (a relatively sharp bend in the line creating an elbow) identifies an appropriate number of clusters determined by the algorithm (Norusis, 2011). Two analyses run with fixed three-cluster and four-cluster solutions resulted in Silhouette Ranking Measure (S) (internal validity index) of cohesion within and between the clusters (S = 0.3) for both solutions, and indicated successful clustering (S threshold above + .25) (Wendler & Gröttrup, 2016). After a thorough inspection of both clusters’ characteristics, the three-cluster model had a relatively low level of homogeneity, particularly within one cluster shared by nPDs and PDs. Overall, the most meaningful four-cluster model which allowed for creating conceptually useful labels represented adequate information in meeting the study objective and was therefore chosen to describe the data.
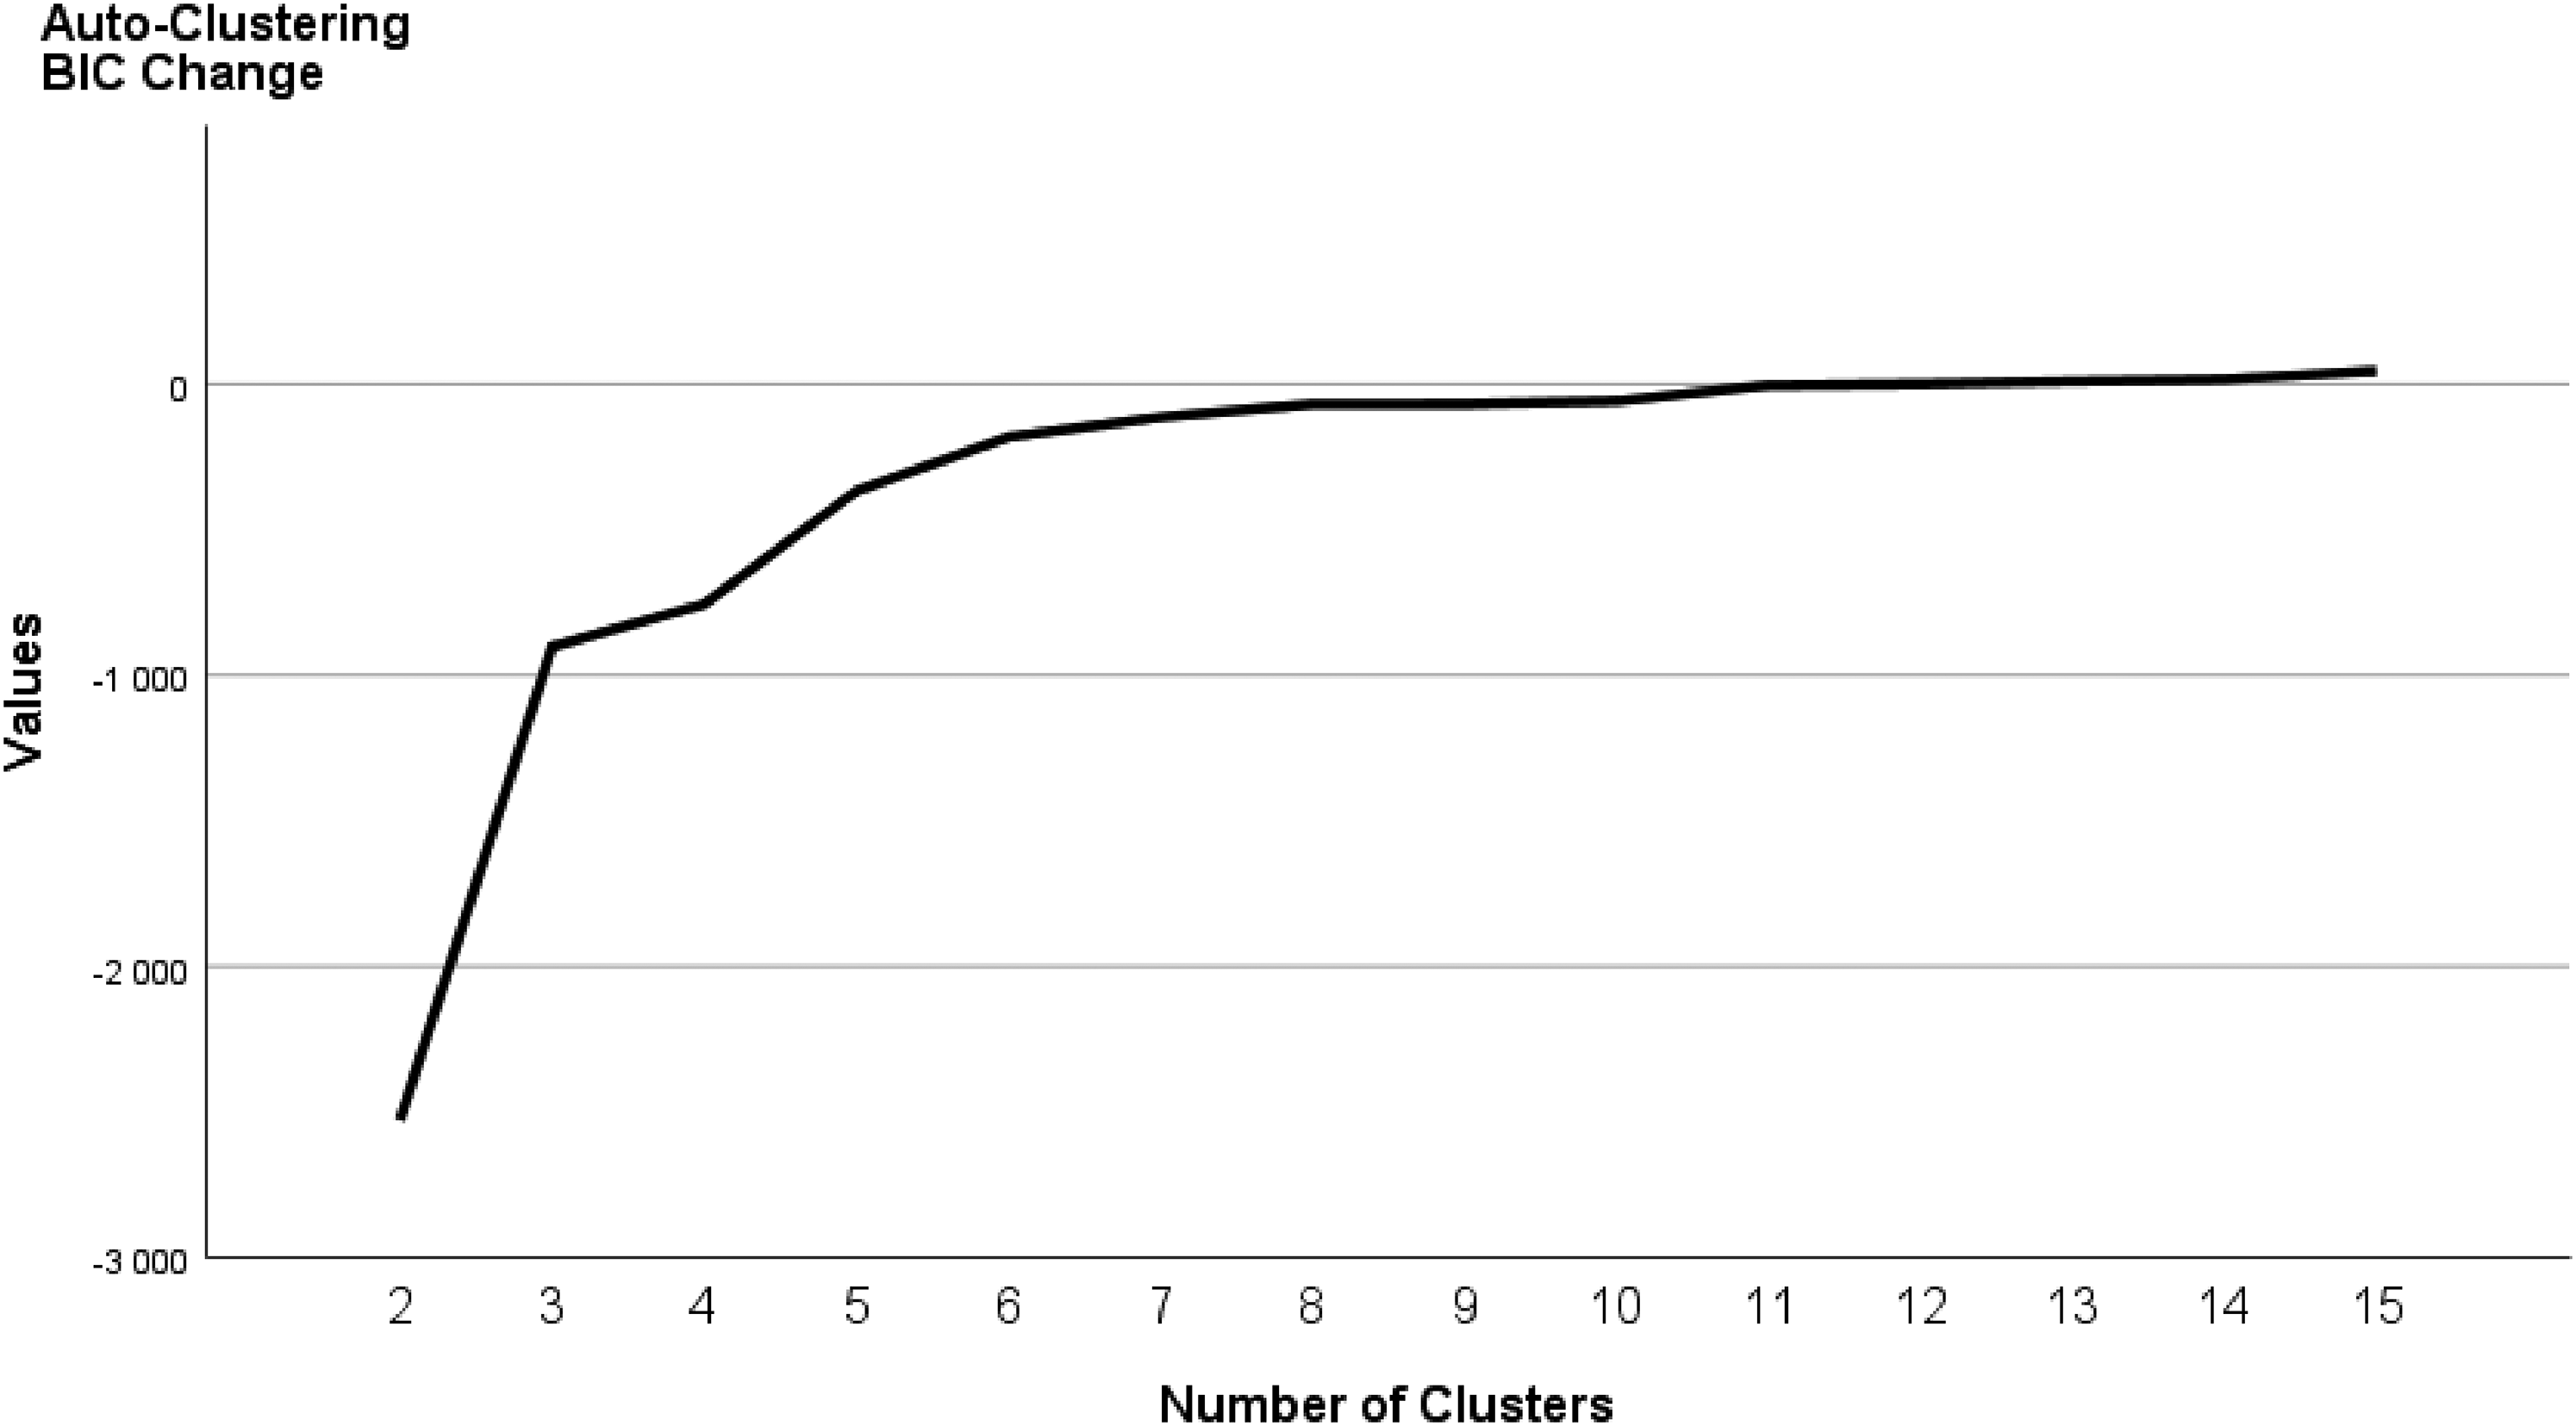
Graph of Schwarz's Bayesian Information Criterion (BIC) change from the previous clusters.
Cluster validation
With regard to “predictor” importance (e.g., sufficiently differentiating respondents on the scale across clusters), the items with values between .08 and 1 shown in the SPSS model viewer are considered as extremely important for clustering purposes (Tkaczynski, 2017). For instance, a “predictor” variable with an importance value of 1 compared to a “predictor” variable with an importance value of .8 most likely, but not necessarily, increases the model accuracy (e.g., PDs correctly assigned to the clusters) (Norusis, 2011). Among eight variables the three most prominent and equally important (importance at 1) in discriminating all groups were the variables “helps me when I feel depressed”, “helps me to be more positive about things in my life”, and “it reduces my anxiety” (i.e., items with the lowest score variability). The two lowest ranked items, “I like the feeling” and “to relax”, had the highest variable dispersion across the clusters. Table 3 reports the distribution of classification and evaluation variables for each cluster affiliation. The list presenting the overall importance of variables contributing to the four-cluster structure and their rank across and within each of four clusters is shown in Table 4.
Classification variables, item overall importance, cluster means, and standard deviations (SD).
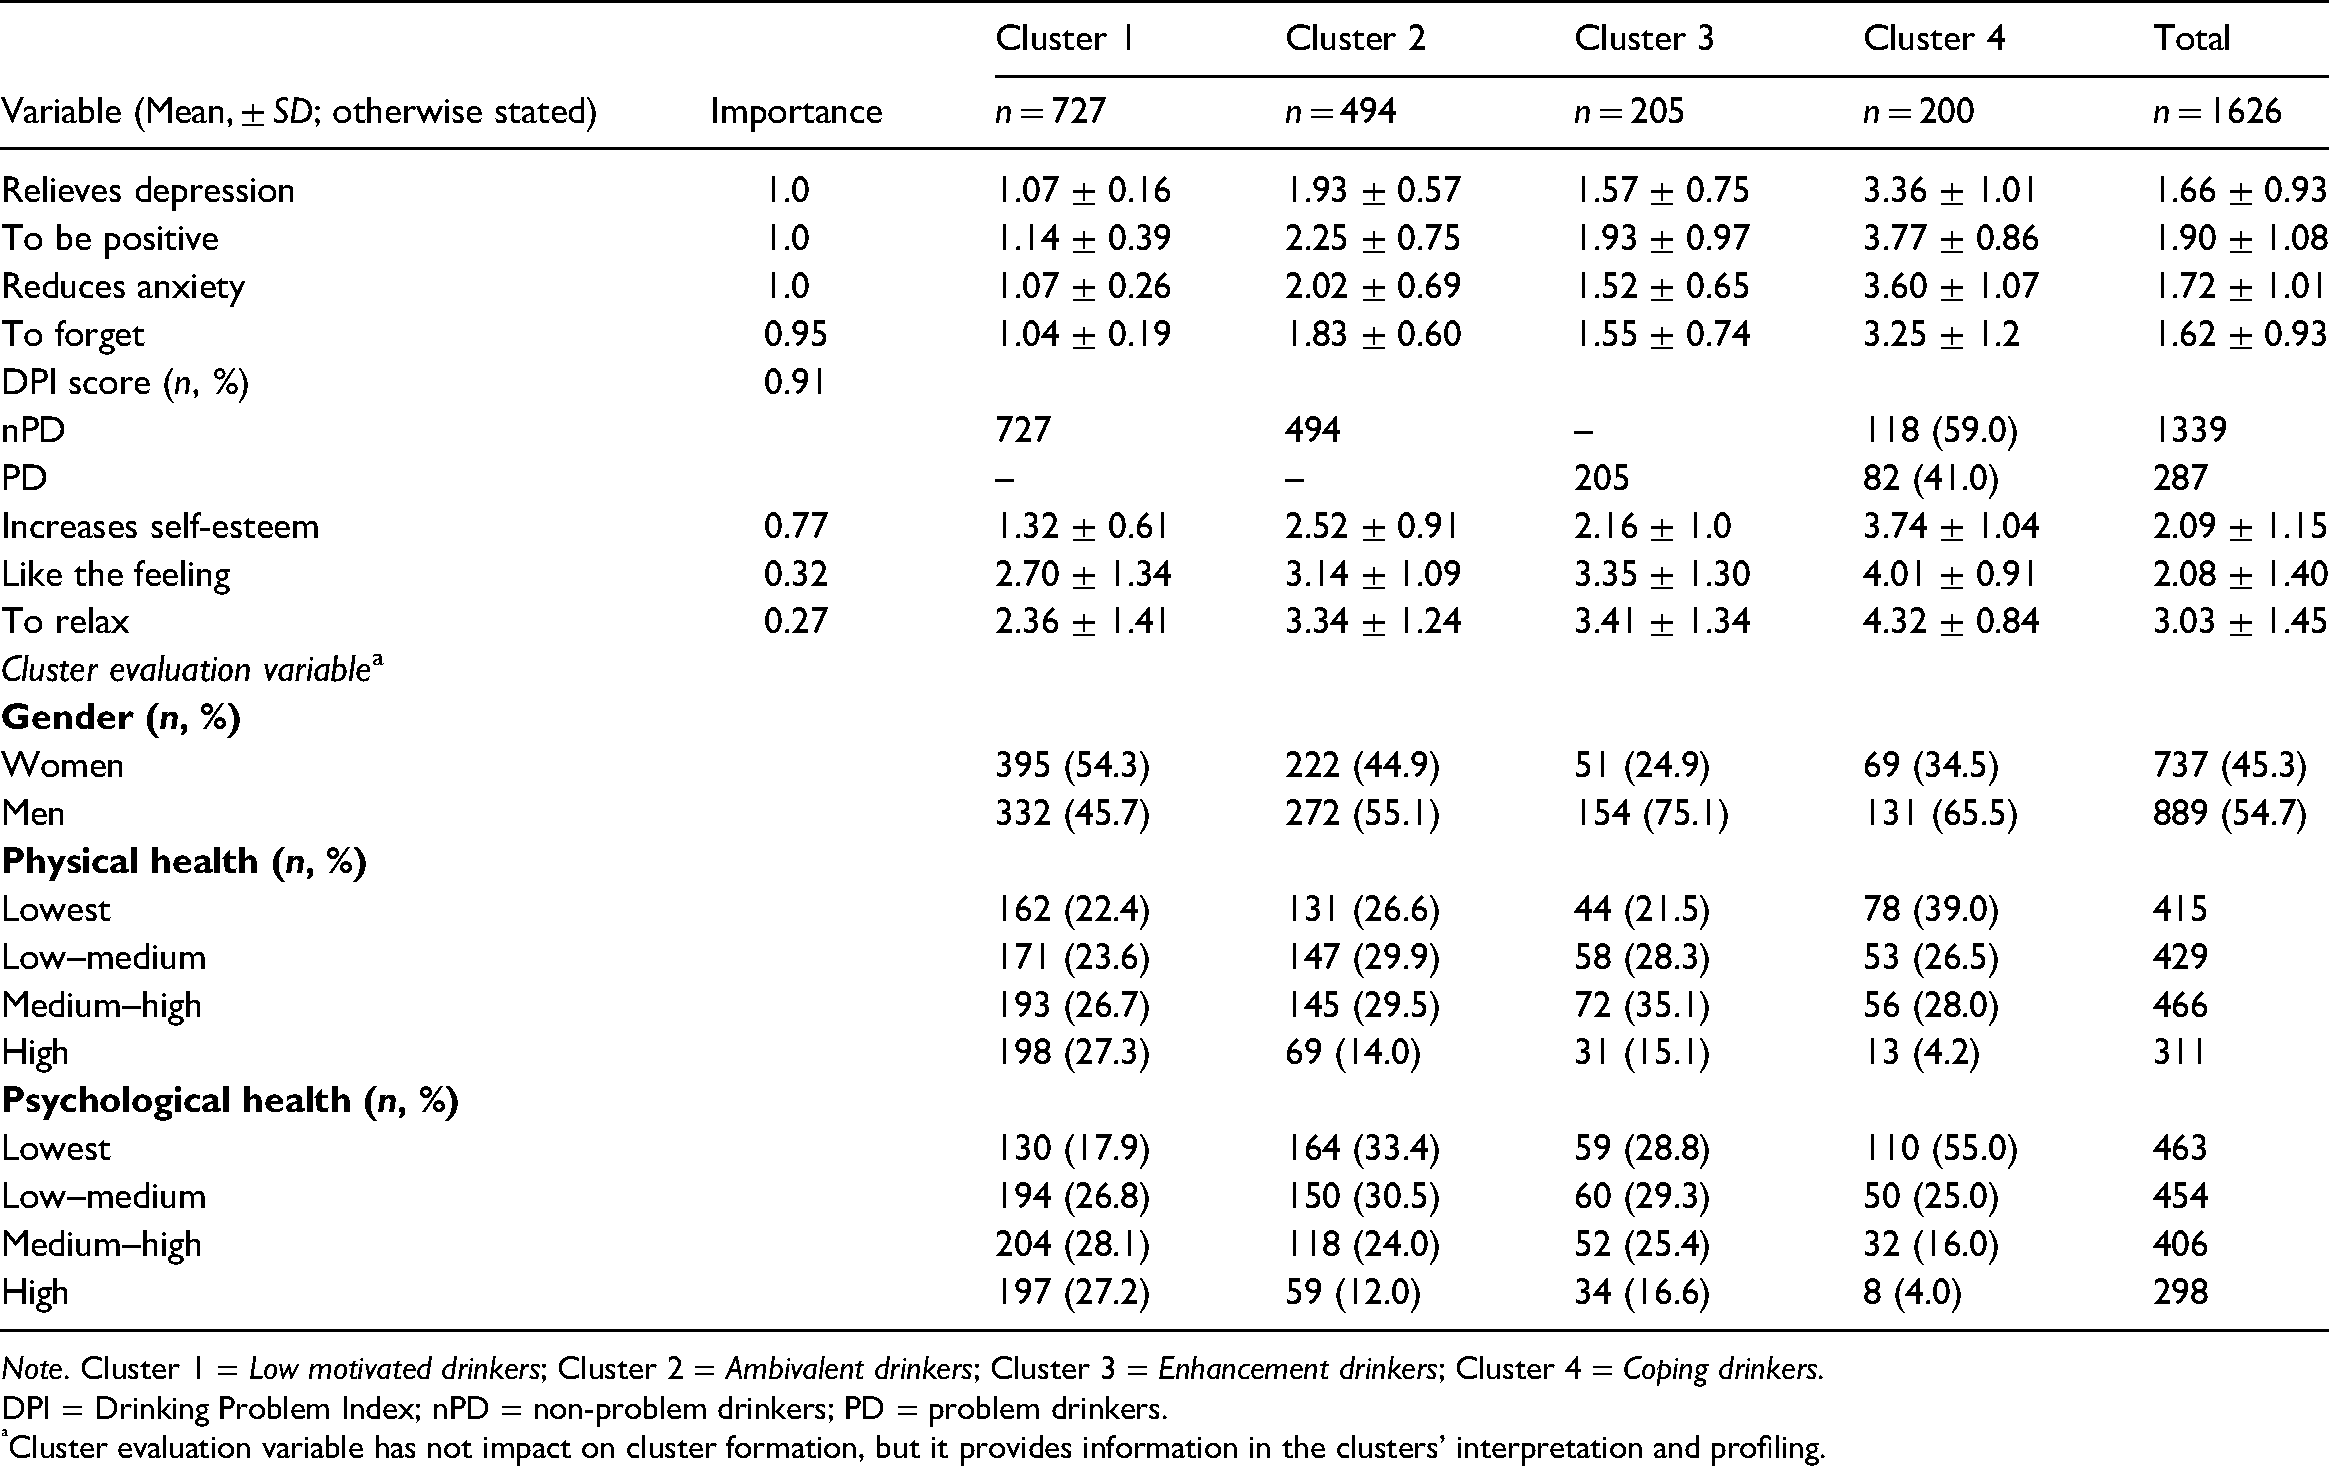
Note. Cluster 1 = Low motivated drinkers; Cluster 2 = Ambivalent drinkers; Cluster 3 = Enhancement drinkers; Cluster 4 = Coping drinkers.
DPI = Drinking Problem Index; nPD = non-problem drinkers; PD = problem drinkers.
Cluster evaluation variable has not impact on cluster formation, but it provides information in the clusters’ interpretation and profiling.
Classification variables with overall rank for combined clusters and rank within clusters.
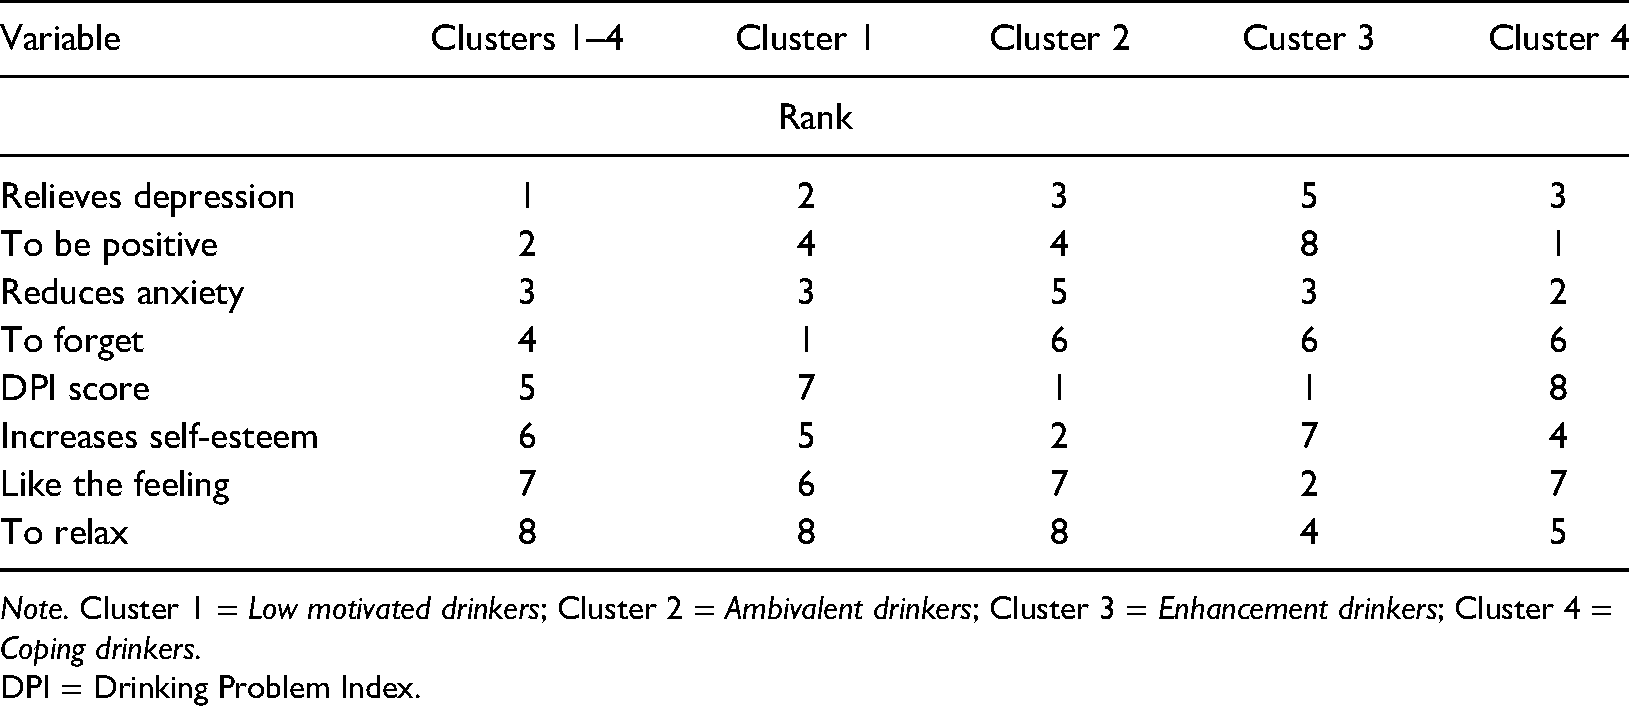
Note. Cluster 1 = Low motivated drinkers; Cluster 2 = Ambivalent drinkers; Cluster 3 = Enhancement drinkers; Cluster 4 = Coping drinkers.
DPI = Drinking Problem Index.
Cluster stability
The stability of the cluster was re-examined on the whole sample with sorted cases in a randomly different order, with the same number of clusters chosen as “optimal” in the initial analysis (Hair et al., 2015; Norusis, 2011). A very stable solution would be attained with less than 10% of observations being assigned to a different cluster. The re-examined four-cluster solution with randomly reordered cases showed cluster sizes with less than 10% of observations being assigned to a different cluster, indicating a very stable solution. The size of each cluster based on the validation sample was as follows: cluster 1 included 39.4% of all non-problem drinkers (original cluster 1 Low motivated drinkers: 44.7%); cluster 2 had 33.1% of all non-problem drinkers (original cluster 2 Ambivalent drinkers: 30.4%); cluster 3 consisted of 16.2% problem and non-problem drinkers (original cluster 4 Coping drinkers: 12.3%); and cluster 4 included 11.3% of all problem drinkers (original cluster 3 Enhancement drinkers: 12.3%).
Results
Descriptive statistics
In the sample (n = 1,626) there were 737 (45.3%) women and 889 (54.7%) men aged between 62 and 95 years. Among participants, 17.7% (n = 287) reported PD (25.8% of these being women) and their DPI scores ranged from 2 to 31. Of these PDs, almost 50% had a DPI score of 2. On average, respondents reported three drinking problems. The most frequently reported drinking problems were of psychological (intoxication, confusion) and financial (spend too much money) natures. These were followed in descending order by family concern, family problems, skipped meals, and falls/accidents. Relatively more women than men reported confusion (a statistically significant result) and falls/accidents due to drinking. Another statistically significant gender difference was related to experiencing family problems, and these were more commonly reported by men than women (Table 2). The descriptive results from additional analysis of the frequency of the nature of drinking problems within clusters including PDs are reported below in the subsection “Profiles of the clusters”. The most frequently endorsed drinking motives by all respondents were “to relax” and “I like the feeling”. Table 1, as referred to above, demonstrates the endorsement of drinking motives in nPDs and PDs, and by gender.
Profiles of the clusters
Cluster labelling and profiling
The criteria for labelling and profiling of the four clusters by was based on a multi-approach inspection of centroid values and score distributions on the scale as shown in Table 3, and within cluster item rank (variable importance) (as shown in Table 4), alongside information provided in a graphical display of relative cell distributions per variable within each cluster. In the interest of space, the latter is presented in Appendix B. Notably, due to the highest variable dispersion across all clusters, “drinking to relax” had the lowest contribution (albeit not unimportant) to cluster formation. Stated differently, the highest endorsement of “drinking to relax” followed by “like the feeling” (of alcohol) was found in all groups of alcohol consumers, although predominantly in PDs and in men. This result was reflected in descriptive statistics presented in Table 1. According to χ2 tests (p < .05) on associations between three evaluation variables, these being gender, physical health, and psychological health, and a four-cluster variate (drinking motives and the DPI score), the effect of gender on cluster variate was: χ2 (3, n = 1,626), p < .0001, phi = .20; of physical health: χ2 (3, n = 1,621), p < .0001, phi = .22; of psychological health: χ2 (9, n = 1,621), p < .0001, phi = .31. According to Cohen (1988), a criteria effect size (phi) of .10 is small, .30 is medium, and .50 is large.
Four clusters were labelled as follows: Cluster 1: Low motivated drinkers; Cluster 2: Ambivalent drinkers; Cluster 3: Enhancement drinkers, and Cluster 4: Coping drinkers.
Low motivated drinkers (n = 727) was the largest group of all alcohol consumers, represented by non-problem drinking women (54.3%) and men. Their consumption of alcohol was moderately motivated only by enjoying the feeling of alcohol. The hallmark of this cluster was its highly homogenous profile, especially related to low mean scores (and item dispersion) on all motives linked to negative reinforcement. This group included at approximately equal rates, individuals with low to high satisfaction with their physical and mental health (irrespective of gender, see Appendix C), although with a slight dominance of those reporting good health.
Ambivalent drinkers (n = 494) was the second largest cluster of non-problem drinkers (and all drinkers) who included more men (55.1%) than women. For this group, increasing self-esteem and to be positive about life (i.e., highest scores with lowest variability) were the most salient drinking motives as opposed to, for example, relatively unimportant drinking to relieve depression or to forget painful memories. Compared to Low motivated drinkers, the cluster was characterised by slightly poorer physical health and much poorer psychological functioning, particularly evidenced in an almost two-fold greater difference in reporting dissatisfaction with mental health. The physical health status was not significantly differentiated by gender, but mental health was (Appendix C).
Enhancement drinkers (n = 205) represented the largest group of problem drinkers, with men (75.1%) outnumbering women three-fold. In this group, the most relevant motive for drinking was to enjoy the feeling of alcohol. Notably, similarly to Low motivated drinkers, this group consistently disagreed with consuming alcohol to alleviate any negative emotions. The majority of members in this cluster reported above average satisfactory physical health. Within the group, there were slightly more individuals reporting below average satisfaction with mental health. Overall, their psychological functioning was somewhat better as compared to Ambivalent drinkers but not Low motivated drinkers. There were no significant gender differences in satisfaction level with health (Appendix C).
Coping drinkers (n = 200) included non-problem (59%) and problematic drinking women and men. In stark contrast to the other three groups, in this cluster individuals were inclined to use alcohol for any reason. However, the most important drinking motives were to be positive about life, to reduce anxiety, and to relieve depression. This cluster was dominated by men (65.5%), and by those least satisfied with physical and mental health functioning compared to all other clusters. Report of satisfactory health was rare (4%). In the group there were no significant differences in physical health status between women and men. On the other hand, although there were more men across all categories of mental health status, they outnumbered women almost at a five-fold greater rate regarding poor psychological functioning (18% women vs. 82% men) (Appendix C).
The nature of alcohol-related problems among problem drinkers
Enhancement drinkers and Coping drinkers reported on average (median) two and three drinking-related problems respectively. Compared to Enhancement drinkers the DPI score range for Coping drinkers was higher (2 to 18 vs. 2 to 31). In descending order, spending too much money, falls/accidents, family problems, and felt confused were particularly more frequently experienced in Coping drinkers than in Enhancement drinkers. Overall, problem drinking women reported fewer drinking problems than men did (Median: 2 vs. 3; DPI score range: 2 to 22 vs. 2 to 31) (Table 2).
Discussion
This study had the primary aim of identifying subgroups of older alcohol consumers with and without alcohol-related problems according to their affect-related drinking motives in combination with the DPI score. Based on comparatively unique patterns of needs for emotion regulation by means of alcohol, four mutually exclusive groups of alcohol consumers were identified. The four-cluster solution provided adequate data fit. The four cluster-delineated groups comprised two groups represented by non-problem drinkers, one group represented by problem drinkers, and one mixed group included both non-problem and problem drinkers. For ease of communication, we will discuss our findings in terms of arbitrarily divided groups labelled as “Non-problem drinkers” and “Problem drinkers, and at high risk problem drinkers”. The former group consists of Low motivated drinkers and Ambivalent drinkers, and the latter comprises Enhancement drinkers and Coping drinkers.
Non-problem drinkers
Although non-problematic drinking was a common characteristic of Low motivated drinkers and Ambivalent drinkers, there were both broad similarities and noticeable differences in the patterns behind their drinking motivation and health status. Both groups were slightly inclined to consume alcohol to enjoy the feeling derived from it and for relaxation, though these motives were similarly of low relevance to their drinking. In stark contrast to Low motivated drinkers, Ambivalent drinkers were predominantly in (very) poor physical and mental health, in this respect most resembling Coping drinkers. The personal circumstances of Ambivalent drinkers linked to health-related losses, may have possibly exerted some role in drinking motivations being somewhat oriented towards using alcohol to feel more self-confident. Previous studies have demonstrated that with increasing age, compromised health mostly relating to physical abilities may weaken self-esteem in some persons (Baker & Gringart, 2009; Ron, 2007; Tavares et al., 2016), particularly those who lack resources to compensate for health-related losses (Collins & Smyer, 2005). Along the same lines, in the broad corpus of research on self-esteem among older populations, it has been observed that a weakening of self-esteem (or self-worth) was associated with a low quality of life, social isolation and viewing life in negative terms (e.g., life losing its meaning), and with the risk for anxiety or depression (Hunter et al., 1981–1982; Markus & Herzog, 1992; Ron, 2007; Tavares et al., 2016). In view of these findings, and of our results, poor health in Ambivalent drinkers could, inter alia, serve as a precursor to strengthening the motivation to drink in order to induce self-confidence, in turn placing a person at risk of developing problematic drinking, and further endangering an already compromised health status. For example, older adults who consumed alcohol especially to increase their self-esteem were more likely to experience drinking problems (assessed using the DPI) (Gilson et al., 2017).
Problem drinkers, and at high risk problem drinkers
The vast majority of problematic drinking men and women were found in the Enhancement drinkers group. Consuming alcohol related to the positive reinforcement of the pleasant effects of alcohol was particularly appealing for this group. Notably, using alcohol as a coping device in response to depression or anxiety was irrelevant for Enhancement drinkers. However, relatively good physical health (irrespective of gender) seemed to be insufficient in “protecting” Enhancement drinkers from experiencing alcohol-related problems. Previous research has indicated that enhancement drinkers in general tend to consume more alcohol than, for example, coping drinkers (Kuntsche et al., 2005; Merrill et al., 2014; Öster et al., 2017; Sjödin et al., 2021). This drinking practice has also been observed in older adults who are relatively physically healthy (Brennan, Schutte, Moos, & Moos, 2011; Laberge et al., 2021). Unfortunately, we do not have information on rates or volumes of drinking, and therefore we are unable to show whether such measures are relevant for Enhancement drinkers.
An intriguing group of Coping drinkers included both non-problem and problem drinkers. In comparison to the other three groups, Coping drinkers distinguished themselves through their relatively strong affirmation of using alcohol to cope with psychological distress related to depression and anxiety, and, most prominently, to counteract a pessimistic outlook on life. Compared to other groups, this elevated tendency to seek relief from negative emotions by drinking alcohol seemed to occur in the presence of poorer mental and physical health. Another noteworthy finding (statistically significant) is that within the whole group, compromised mental functioning was twice as prevalent in men than in women. The fact that poor physical health did not statistically differentiate men and women may point towards a possibility of men's rather women's greater mental vulnerability or emotional reactivity to health burden. The results from several studies (Brennan & Moos, 1996; Brennan, Schutte, Moos, & Moos, 2011; Brennan, Schutte, SooHoo, & Moos, 2011) may provide some credibility to such an explanation. Nonetheless, the intensity of drinking to cope was equally high in women and men. The consumption of alcohol to enjoy the feeling was highly irrelevant for this group. Although Coping drinkers also included non-problem drinkers, it is not likely that this is the result of a poor cluster solution, because cluster validation analysis has suggested otherwise. A plausible explanation is that non-problem drinkers were alcohol consumers in the process of developing drinking problems (at high risk problem drinkers), former problem drinkers, or former problem drinkers at risk of relapse. The research evidence based on longitudinal studies on drinking trajectories in the context of poor mental health point in this direction (Brennan, Schutte, Moos, & Moos, 2011; Schutte et al., 2009; Schutte et al., 2001; Schutte et al., 2006). That is, drinking in order to cope appears to have a potent function in the development, continuation, and relapse of drinking problems, especially when a person with a tendency to experience strong affect lacks alternatives to alcohol to cope with stressors, or uses avoidance or escape coping strategies in the acceptance of, or the escape from, negative thoughts and emotions (Schutte et al., 2009; Schutte et al., 2001; Schutte et al., 2006). In contrast to relatively pure enhancement-motivated drinking, coping-based drinking occurred in combination with moderately relevant enhancement-based alcohol use. This finding is in line with previous observations in alcohol-dependent individuals (Ertl et al., 2018).
In sum, in the presence of low satisfaction with physical and mental health, the regulation of negative emotions through alcohol characterised both non-problem and problem drinkers. However, in support of Carpenter and Hasin (1999), it was the intensity or weight of the specific coping motives relevant to a drinker which placed them either within the non-problem drinking group (i.e., Ambivalent drinker: low-risk problem drinker) or within the problem drinking group (i.e., at high risk and current problem drinker). In Norway, irrespective of gender, the typical older consumer of alcohol appeared to be a low motivated non-problem drinker who was marginally inclined to drink to enhance positive emotion. On average, in comparison to other alcohol consumers, this drinker was most satisfied with their physical and mental health.
Regarding coping and enhancement-motivated drinking, our results both corresponded to, and diverged from, those reported in previous studies. Similar to our study, across various populations, drinking alcohol to cope has been found to be associated with diverse measures of problematic drinking, including the DPI scale (Ertl et al., 2018; Gilson et al., 2013; Gilson et al., 2017; Grant et al., 2007; Kuntsche et al., 2005; Moos, Brennan, et al., 2010; Moos, Schutte, et al., 2010; Nehlin & Öster, 2019; Öster et al., 2017; Schijven et al., 2019), some type of psychological affliction (Beseler et al., 2008; Carpenter & Hasin, 1998; Ertl et al., 2018; Lau-Barraco et al., 2016; Miller et al., 2014; Simons et al., 2005), or painful medical condition (Moos, Brennan, et al., 2010). We found two discrepancies between our results and those reported in Gilson et al. (2017), where items such as drinking to gain self-confidence and to cope with physical pain increased the odds of being a problem drinker. In our study, however, consuming alcohol to be more self-confident better characterised non-problem Ambivalent drinkers in relatively poor overall health than problem drinkers in comparatively worse health, within the Coping drinkers category. Gilson et al. (2017) also reported that neither drinking to cope specifically with depression nor scores on a depression scale predicted problem drinking in an Australian community sample of older adults. The authors did not provide a possible explanation of this interesting finding. However, we suspect that this result may possibly be due to rather biased sample characteristics (e.g., self-selection).
Our results have shown that both Enhancement and Coping drinkers are vulnerable to experiencing social and physical health problems. However, in the presence of more severely compromised health, Coping drinkers appeared to incur more alcohol-related problems, and did so more frequently than Enhancement drinkers (e.g., falls or injuries due to drinking). It is possible that consumption of alcohol might in this situation worsen the already poor health of problem drinkers, and/or raise drinking problems in the presence of health burden as has been indicated in longitudinal studies on drinking trajectories (Moos, Brennan, et al., 2010).
In the current sample, Coping drinkers were not separated by coping-anxiety and coping-depression scores into respective coping subtypes indicated within a framework of drinking motivation model put forward by Grant et al. (2007). This discrepancy may be an indication of an interrelation between anxiety and depression in our sample. Although we did not measure depression and anxiety symptoms in the present study, the possible presence of indicated coping motives seemed to indirectly corroborate previous research showing that, despite being qualitatively or clinically different, depression and anxiety commonly co-occur (Eysenck & Fajkowska, 2018; Kalin, 2020). On the other hand, the intensity of endorsement on single items related to the enhancement motive for alcohol consumption seemed to be powerful enough to distinguish a subgroup of problem drinkers. In this respect, Enhancement drinkers resemble those in Ertl et al. (2018) study, which reported that clear-cut enhancement problem drinkers had only a minor orientation towards drinking to cope with negative affect. In contrast to our findings, enhancement motives in younger populations seemed to be unrelated to problem drinking when controlling for age, sex, quantity and/or frequency of drinking (Kassel et al., 2000).
Strengths and limitations
We believe that a major strength of this study derives from a novel approach to data analyses, allowing us to unravel the heterogeneity of older alcohol consumers in terms of their distinctive profiles, and based on drinking motives combined with (non-)problem drinking status. Moreover, we were able to demonstrate that (predominantly) in the presence of the variable of health status, but also in relation to gender, information on drinking motives of alcohol consumers has the potential to increase our understanding of an older person's alcohol use behaviour, and may possibly detect high-risk situations for incurring alcohol-related problems (e.g., whether positive drinking experiences outweigh deleterious ones). Another clear strength is that the sample size was large, and therefore able to easily accommodate the data analyses we employed.
One shortcoming of this study pertains to the relatively low participation rate. It should be noted, however, since it may affect the generalisability of the results beyond the present study. The response rate at 32% may indicate non-respondent bias, possibly linked to poor functional health status or lack of interest in the study topic. In addition, the alcohol-related contents of the questionnaire itself could have affected the less-than-ideal response rate (Groves & Peytcheva, 2008). For instance, Finnish alcohol researchers noted that older people who consume alcohol at high levels are more likely to refrain from participation in alcohol-related studies (Haarni & Hautamäki, 2010). However, Galea and Tracy (2007) found “little evidence for substantial bias as a result of non-participation” (p. 647). Overall, the clusters were strongly conceptually supported by the available published evidence, and thus satisfactorily validated. Therefore, we are confident that the groupings we found and described are meaningful and relevant to the older population of Norwegian alcohol consumers. In addition, the outlined shortcoming of this study may be counteracted in part by a large sample size and the random selection of the initial sample, which is unusual in most available published studies of older populations (Hawthorne et al., 2006). Finally, future investigations may use scales with broader coverage of drinking motive items than those used in our study. However, we believe that the present work represents a positive step forward in dealing with the complex heterogeneity of alcohol consumers.
Conclusions and future directions
This study offers tentative evidence for potentially identifiable heterogeneity in older Norwegian alcohol consumers with and without the experience of alcohol-related harms. Our study detected several differences in motivations to drink between groups of individuals who develop various alcohol-related problems in later life and those who do not. The study also demonstrates that information on health status combined with the intensity of particular drinking motivations in identified subgroups may be an important indicator of existing alcohol-related problems or of future risk probabilities for developing drinking problems in vulnerable groups. Further research is, however, recommended, involving prospective designs, employing a person-centred classification approach with the focus on drinking motivations linked to alcohol-related consequences and health status. Such studies might also include an examination of other factors relevant to alcohol behaviour in older adults, for example, level of boredom, drinking context, psychosocial circumstances, health burden (e.g., pain) (Emiliussen et al., 2017; Immonen et al., 2011; Moos, Schutte, et al., 2010). Clear information on specific groups of alcohol consumers in the population could be seen as a further step in identifying alcohol-focused health care provision to reduce problematic alcohol use or to prevent alcohol-related problems from developing. At the very least, an opportunistic intervention within general health care settings based on the findings reported here may assist in the reduction of problematic alcohol use (Heather, 2001b; Nilsen et al., 2008). In particular, strengthening or encouraging drinking motivation related to non-problem drinking may be appropriate for Low motivated drinkers, whereas additionally, weakening coping motivations through low intensity interventions for non-problem Ambivalent drinkers may be more suitable to prevent the transition to problem drinking.
The potential for problems deriving from alcohol use in older adults is now beyond dispute. Information such as that presented in the current study may allow better targeting of interventions to address this problem. With life expectancies increasing in many developed nations such as Norway, the burden that this places on health care resources cannot be ignored. But neither can our obligation to effectively look after those who, because of old age, are vulnerable to all manner of emerging health issues. But evidence-based clinical practice in this area is crucial to the success of care in later life and must therefore be encouraged and facilitated by future research.
Footnotes
Declaration of conflicting interests
The authors declared no potential conflicts of interest with respect to the research, authorship, and/or publication of this article.
Funding
The authors received no financial support for the research, authorship and/or publication of this article.