
Abstract
Aims:
Both survey and healthcare register data struggle as data sources to capture the phenomenon of alcohol problems. We study a large group of people for whom survey data and two types of register data are available, and examine the overlaps of similar or related measures in the different data sources to learn about potential weaknesses in each. We also examine how register-based data on the prevalence of alcohol problems change depending on which register data are used.
Design:
We use data from the Regional Health and Wellbeing Study (ATH) of the adult Finnish population collected in 2013 and 2014 (n = 69,441), individually linked with data on two national healthcare registers (Care Register for Health Care; Register of Primary Health Care visits) for the survey year and previous year.
Results:
The prevalence of substance-abuse-related healthcare was almost two-fold if data on outpatient primary care visits were included in addition to hospitalisations. Forty-six per cent of the survey respondents self-reporting substance-abuse-related healthcare service use were identified in the registers, and 22% of all respondents with such service use according to registers reported this in the survey. Records of substance-abuse-related healthcare service use, controlled for self-reported alcohol use and self-reported substance-abuse-related service use, were found more often for men, the middle-aged, people with basic education only, and the non-employed.
Conclusions:
The results are suggestive of underreporting in both data sources. There is an evident need to develop recording practices in the healthcare registers regarding substance use disorders.
Data on alcohol problems are needed for monitoring as well as for planning and evaluating policy and prevention activities and services. Main data sources for this are surveys on the one hand (Midanik et al., 2007; Room, 2000) and various harm indicators from routinely collected administrative registers, such as medical or death records, on the other hand (Bell et al., 2017; Kendler et al., 2016; Tai & Mclellan, 2012; Whitlam et al., 2016). They are best treated as complementary sources of data, but more information is needed about how the phenomenon of alcohol problems as measured using one data source is mirrored when measured using the other. This will lead to more informed choices on which data source would suit which purpose.
The upside of surveys is that they are conducted as a random sample of the entire population, so in principle the results should be easily generalised to the population. A central problem of surveys is that self-reports grossly underestimate alcohol use (Gmel & Rehm, 2004), and most likely also alcohol problems, either due to greater non-response among the heaviest drinkers (Kopra et al., 2018) or because those who respond underestimate their drinking on purpose or because memory deficits (Gmel & Rehm, 2004; Stockwell et al., 2008). Another, growing problem is the falling response rates which make researchers look for other sources of data. Yet another problem in surveys is that, typically, they are relatively small for capturing a sufficient number of people with alcohol problems, which often means that the types of problems measured are relatively benign or measure risky behaviour (e.g., heavy drinking) rather than actual problems. In some discussions, various registers and other big data sources have been seen to have potential to replace surveys.
In countries with good-quality register data, measures of alcohol problems based on health registers or patient records may be available (Evans et al., 2008; Tai & Mclellan, 2012). The upside in this type of data is that respondent biases such as selective non-response, concealment or memory deficits do not come into play. The downsides include that the data only indirectly depict problem prevalence, as the measure really is about service use. Correspondingly, the data are not a random sample of the whole population, but describe the service-using part of the population. Also, the information readily available may be relatively narrow, e.g., based on diagnoses only. Furthermore, even if medical records avoid respondent biases, comparable biases may be created via other mechanisms related to healthcare processes, which may cause problems in data completeness or in data correctness (Varmdal et al., 2016). Whether a person who should have a given diagnosis will be found in that register with that diagnosis depends on factors such as whether medical attention has been sought, on access to services as well as on diagnostic and recording practices of the service centre and the person filling in the paperwork (Agniel et al., 2018; Bell et al., 2013; Evans et al., 2008; Otete et al., 2015). Missing data and underreporting can be caused by, e.g., differences in registration practices due to unclear instructions (Homer & Hirsch, 2006; Hripcsak & Albers, 2013). There may also be differences between jurisdictions or population subgroups in the extent to which medical records cover alcohol-related diagnoses or other measurements of interest (Agniel et al., 2018; Mäki et al., 2017). Recording practices may also be affected by, e.g., avoidance of stigmatising labels, which may affect different socioeconomic groups differently. Some evidence exists that an alcohol-related diagnosis is coded only after the problem has reached an advanced state (Rautiainen et al., 2018). Any further information on the coverage of alcohol-related problems and factors related to that coverage would be welcome for people planning to use the register data for research or monitoring purposes.
Previous research by Room (1977) and Storbjörk and Room (2008) used the term “two worlds of alcohol problems” to summarise their finding that alcohol problems and problem drinkers look very different when examined on the basis of respondents in surveys or on the basis of clinical populations. Individuals in clinical settings were older, more marginalised, reported more severe alcohol problems, and reported more previous treatment episodes. The difference in the results is due, on the one hand, to differences in the populations: even if the clinical population is a part of the same general population from which the survey sample is drawn, it includes also those heaviest drinkers who choose not to respond to surveys. A second reason for the difference lies in differences in what is measured: even if the same people were examined, the expectation would be that measures of alcohol problems based on healthcare registers describe a more severe end of the spectrum of alcohol problems than what can be measured in surveys.
When health registers and medical records are used for research purposes, alcohol-related problems are operationalised most often on the basis of (ICD) diagnoses. However, these data sources may include a lot of other data than merely the diagnosis. In the Finnish national healthcare registers, in addition to hospitalisation periods and their diagnoses, outpatient visits in primary healthcare are also included, with various codes recorded regarding the reason for the visit as categorised according to the International Classification of Primary Care (ICPC2 codes), and procedures and interventions in outpatient primary healthcare (so called SPAT codes), which could indicate, for example, that the procedure carried out during the visit was detoxification or substance-abuse-related guidance.
The extent to which these codes actually include data which is informative about alcohol problems has not been systematically examined. Bell et al. (2013) used electronic health records (also the embedded texts) to identify drug and alcohol misuse among psychiatric in-patients and found the approach useful. But they also found that the documentation was unsystematic and the healthcare staff was reluctant to diagnose substance misuse problems. Beyond the alcohol field, data in health registers have been compared to data obtained from surveys for measuring high cholesterol, hypertension, diabetes and obesity (Paalanen et al., 2018; Tolonen et al., 2014). It was found that for high cholesterol and hypertension the gold standard was health examination surveys, with some underestimation in medical records and more underestimation in self-report surveys, while for diabetes the reporting was self-reported more accurately.
In the current study, our general aim is to compare surveys and healthcare registers as sources of data on alcohol problems using data on the same group of people for whom both types of data are available: how do the measures of problem drinking available in surveys, i.e., heavy drinking and self-reported substance-abuse-related healthcare service use, relate to those available in registers, i.e., to recorded substance-abuse-related service use in various settings and for various reasons? When we examine the same group of respondents, we can exclude the part of the variation in the comparison that derives from differences between populations, and hence we are able to better compare the measures available in both. This is an explorative exercise with no gold standard available to provide the “right answers”. The underlying aim is to serve, first, the people who are responsible for developing the quality and coverage of healthcare records, second, the survey researchers who are interested in questions of underestimation in their surveys, and third, people who consider whether survey data or register data would serve the monitoring or research purposes they have in mind – we aim to provide them with some further understanding about what these choices might imply with respect to what aspects of alcohol problems their alternative data sources and the measures available in them may capture.
In practice, we examine a large group of general population survey respondents for whom we can individually link data from national healthcare registers on inpatient and outpatient healthcare service use. We take as our first task to make a within-register comparison of how the prevalence of substance-abuse-related service use changes if diagnosis-based hospital discharge register data are extended to primary healthcare register data and their different measures. Second, in order to examine these data from the point of view of quality and coverage of the register data, we take the respondents who themselves report that they have used substance-abuse-related healthcare services and check for which proportion such records can be found in the register. Third, we take as a starting point those people who have various different substance-abuse-related records in the healthcare register, and we examine the survey-based measures of heavy drinking and self-reported substance-abuse-related healthcare service use of these groups. This description of self-reported drinking behaviour in a group of people who have experienced relatively severe alcohol-related harm should provide interesting information to survey researchers, which may be informative of the performance of the surveys and their various measures. Lastly, in order to provide more information for those who aim to develop the coverage and quality of healthcare registers, we expand on the second point in order to shed more light on the question of which factors may affect the recording of substance-abuse-related healthcare services. Above, socioeconomic status was mentioned as one such possible factor, and gender and age can be hypothesised to matter as well, and quite naturally also heavy drinking. We fit a regression model where we control for self-reported substance-abuse-related healthcare service use in order to try to tease out the independent contributions of these other factors to the likelihood of being able to find a record of a person’s use of substance-abuse-related healthcare services in the healthcare register.
Methods
Context: The Finnish treatment system
In Finland, municipalities are responsible for organising the treatment of substance abuse problems. However, the current Finnish addiction treatment system is fragmented and service organisation varies notably across regions. Traditionally substance-abuse-related problems have been treated in social care services, but the recent trend is to shift treatment towards general healthcare services. Thus, substance-abuse-related problems are treated in primary care health centres, specialised addiction services, specialised care settings, social services, and to some extent in private healthcare services. National health registers capture services provided in healthcare services and in some regions also the use of specialised addiction services.
Data sources
The first data source used was the Regional Health and Wellbeing Study (“ATH survey”) for 2013 (49,865 respondents) and 2014 (19,576 respondents), collected using a postal questionnaire. Subjects were from eight simple random samples of Finnish residents aged 20+ years, with a two-fold selection probability for people aged 75+, identified from population records every three months. When using weights, the whole data is representative of the general population aged 20+ years. The response rate each year was 53%, and altogether the data included 69,441 respondents out of an original sample of 150,000 (Murto et al., 2017).
Second, data on ATH-survey respondents’ use of healthcare services was linked to the survey data using unique identification codes given to all Finnish residents. Healthcare data were collected from the HILMO Hospital Discharge Register (HDR; Finnish Institute for Health and Welfare, THL, 2019a) and avoHILMO Primary Care Register (PCR; Finnish Institute for Health and Welfare, THL, 2019b) for the survey response year and for the previous year. For example, if the study participant responded to the ATH survey in 2013, their register data were included for the years 2012 and 2013. The linkage was carried out by authorised register data managers of THL.
Ethical considerations
Respondents were informed about the register linkage, and the ethical committee of the Finnish Institute for Health and Welfare approved the research plan of the ATH survey. The data were pseudonymised before it was passed on to researchers.
Measures
Demographic data were obtained from the ATH survey and included age, gender and employment status. The alcohol use measures available in the survey were AUDIT-C score (the first three questions of the AUDIT measure on frequency, typical amount, and frequency of drinking six or more drinks at a time; Babor et al., 2001), and alcohol use in the past seven days. We used as measures of heavy drinking: (1) AUDIT-C score according to Finnish recommendations (5+ for working-aged women, 6+ for working-aged men and 4+ for people aged 65+; Alkoholiongelmaisen hoito 2015), (2) seven-day alcohol consumption exceeding Finnish high-risk limits for long-term use, i.e., 23 drinks a week for men and 14 drinks for women (Suomalaisen Lääkäriseura Duodecimin ja Päihdelääketieteen yhdistyksen asettama työryhmä, 2015), and (3) positive responses to the question “Have you been asked to cut down?”.
Self-reported substance-abuse-related healthcare service use was measured using the question “Have you used the following services for substance-abuse-related problems during the last 12 months?” A list of 10 alternatives followed, of which we use here the six that should also be found in the register (health centre, mental health or psychiatric outpatient clinic, psychiatric hospital, other hospital, detoxification centre, and other treatment service; we did not include in the combined measure visits in occupational healthcare, student healthcare, A-clinics, and private clinics, which are not covered by the registers). It should be noted that the time periods covered by this question and the health register do not have a one-to-one match. The health records cover two years that should completely include the 12-month period asked about in the survey; that is, if service use is self-reported for the past 12 months, time-wise this should also be found in the register. But the other way round this is not necessarily so, as a healthcare visit found in the register that covers two years would not always be expected to be reported when asked about a 12-month period (this mismatch cannot be solved by taking only one of the two years, as the surveys were carried out throughout the year).
Data collected from the HDR and PCR included many types of information that can be taken to indicate an underlying problem related to alcohol or substance use. We included alcohol-specific codes when possible, but also more general substance-abuse-specific codes were included if the substance in question was not specified. The following data were extracted: International Statistical Classification of Diseases (ICD-10) codes for alcohol-related diagnoses (https://www.who.int/classifications/icd/en/). A diagnosis can only be given by a physician, but it can be used thereafter by nurses, too. ICD-10 codes are used both in hospitals and in primary care. Alcohol-related ICD-10 codes were defined as in official statistics and included: E244, E512, E52, F100–F109, G312, G4051, G621, G721, I426, K292, K70, K852, K860, O354, P043, Q860, R780, T51, X45, Z502, Z714 or Z721. International Classification of Primary Care (ICPC2) codes, which are used in primary care by physicians and, especially, by nurses, as a classification of patient data for primary care or general practice. It “allows classification of the patient’s reason for encounter, the problems/diagnosis managed, interventions, and the ordering of these data in an episode of care structure” (https://www.who.int/classifications/icd/adaptations/icpc2/en). ICPC2 codes P15 or P16 (short-term and long-term alcohol misuse, respectively) were included. Finnish classification of SPAT codes describes procedures and interventions carried out in outpatient primary healthcare (https://thl.fi/en/web/thlfi-en/statistics/information-on-statistics/quality-descriptions/primary-health-care). Substance-abuse-related SPAT codes included 1309 (substance-abuse-related guidance), 1344 (guidance related to services on substance abuse), 1227 (outpatient rehabilitation from substance abuse), 1247 (outpatient detoxification), 1274 (brief intervention for addictive symptoms). In addition to the alcohol-related codes, contacts to primary care level substance abuse services (“form of service” code: T73) were also counted, as in these services the previously mentioned codes are not always used. Whether at least one visit to any healthcare services had occurred.
All respondents who had at least one visit fulfilling the criteria in any of the categories (i) through (iv) were considered to have a record of using substance-abuse-related healthcare services.
Statistical methods
Survey data and register data were compared using simple two-way cross-tabulations. Weights were calculated using sex, age, region, marital status, education and language group in order to restore the population representation of the sample. Numbers of respondents were given as unweighted when the purpose was to inform the reader about the sample size available in the analysis and about statistical power, while percentages and ns were calculated using weights when the purpose of presenting them was that they would be informative about the situation in the population. The independent effect of different predictive factors was assessed using logistic regression models, with “having at least one substance-abuse-related healthcare visit” as the dependent variable. The results are given as odds ratios. All analyses were carried out using survey procedures in SAS (proc surveyfreq, proc surveylogistic), which take into account the strata of the eight samples and the weights.
Results
Characteristics of the cohort
Among the survey respondents, the proportion of men was 42.7% or 48.0% when weighted (Table 1). The weighted proportions of respondents with AUDIT-C scores indicating elevated or high risk were 16% and 11%, respectively, and the proportion exceeding risky drinking limits in the previous week was 5.6%. Twelve per cent had been asked to cut down. Beyond the table it can be noted that the mean age of the group was 50.7 years.
Characteristics of respondents; respondents in 2013 and 2014 and their linked register data for the same and the previous year.
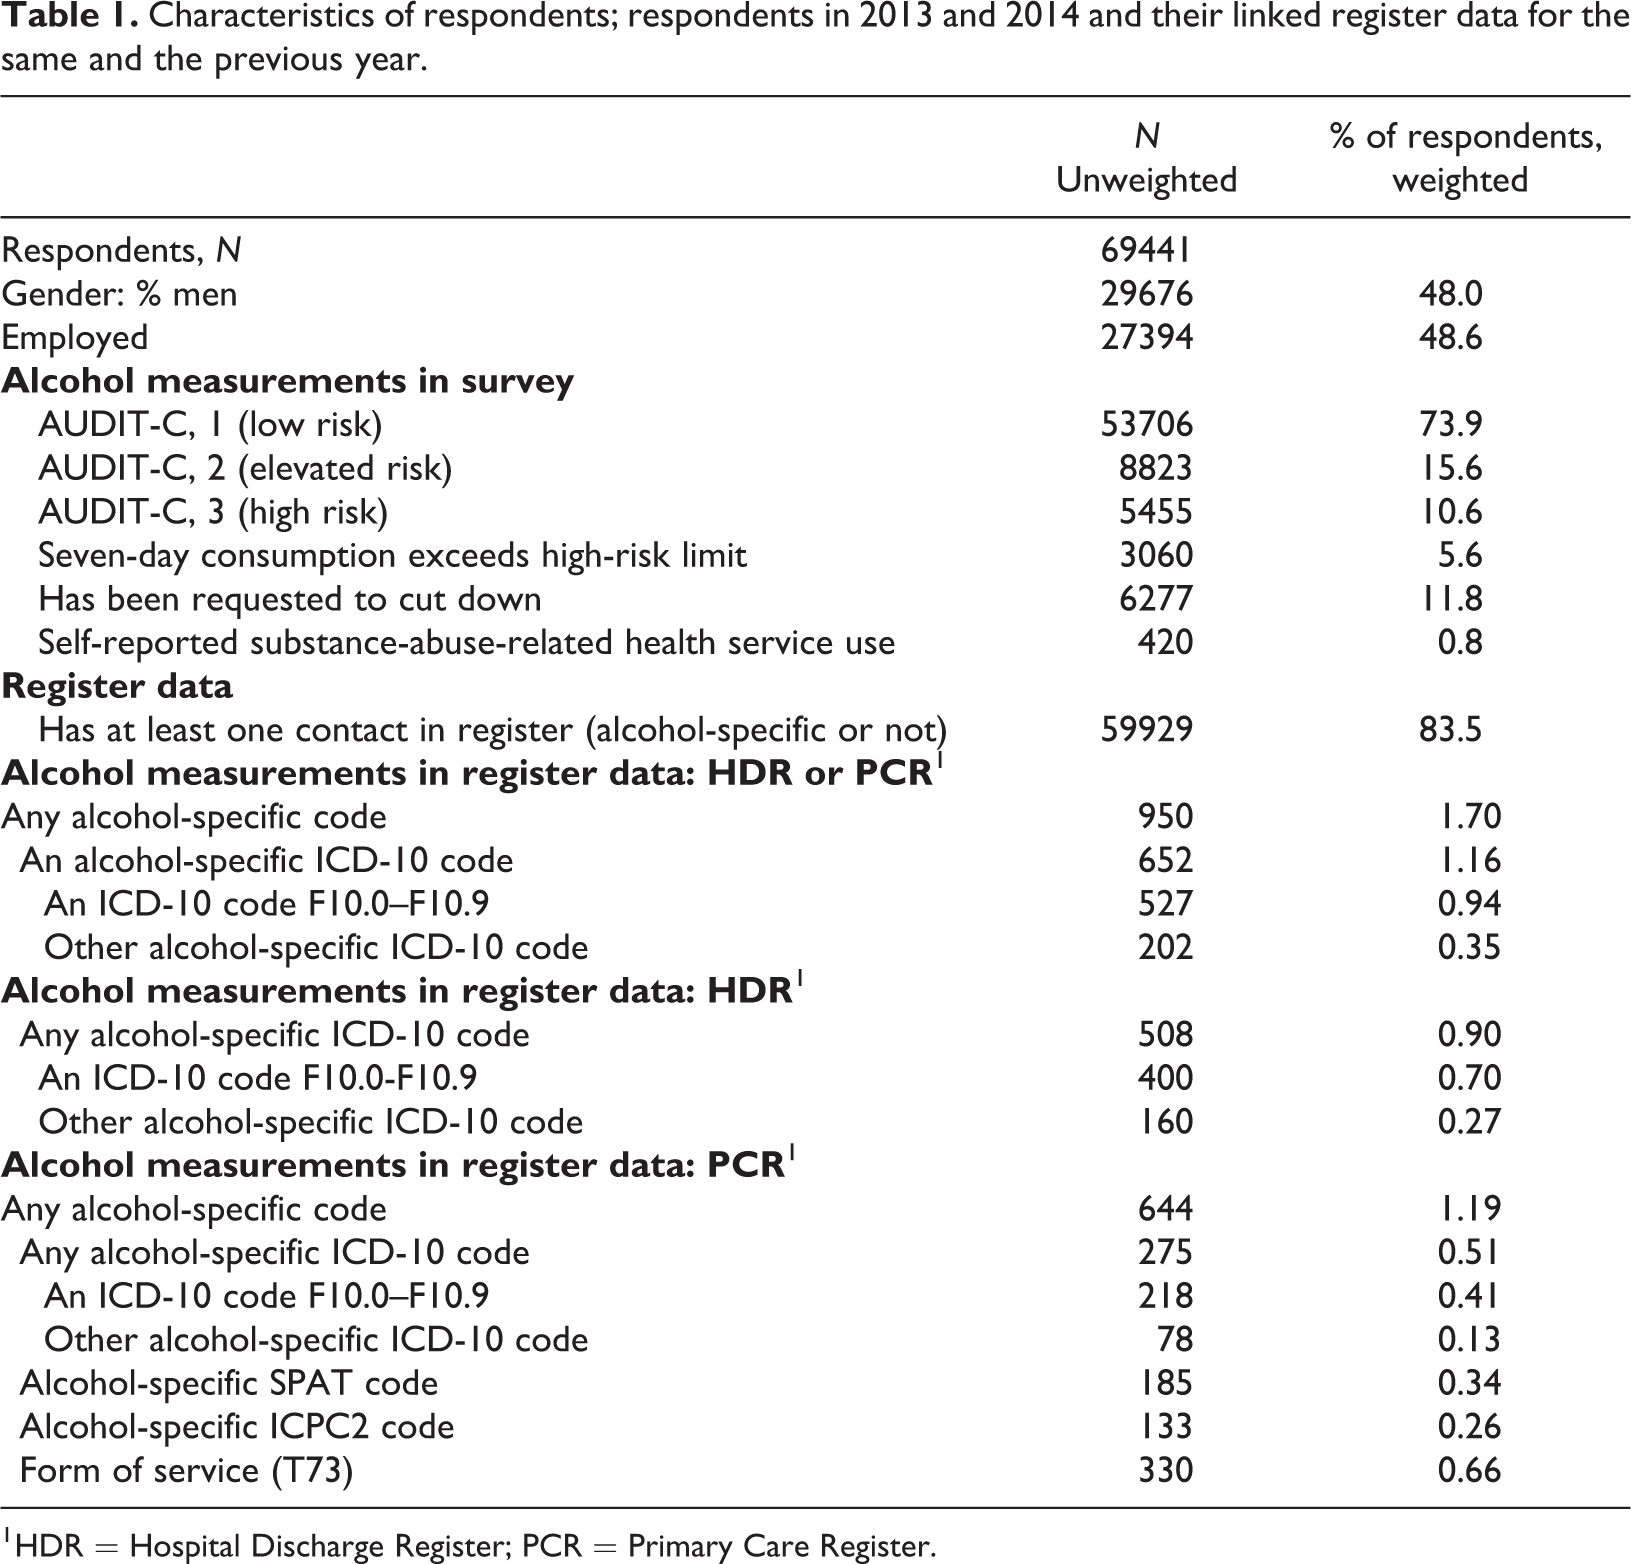
1 HDR = Hospital Discharge Register; PCR = Primary Care Register.
Prevalence of various measures
The majority (83.5%) of the survey respondents had used some healthcare services in the same or previous year, but only 1.7% of the respondents had any record of alcohol-related service use (in HDR or PCR: ICD-10, SPAT or ICPC2 codes or substance abuse service use T73). If data had been available only for hospitalisations (HDR), the prevalence would have been 0.9% instead of 1.7%, i.e., the prevalence was almost double what it would have been using only hospitalisation data. Looking at both registers but restricting data to using ICD codes only would have yielded a prevalence of 1.2%, i.e., missing almost one-third of the cases. On the basis of the primary care register only (PCR), the proportion of respondents with alcohol-related visits was 1.2%; however, if this outpatient data had been restricted to using ICD-10 codes only, then the proportion would have been only 0.5% and more than half of the cases would have been missed.
The typical survey-based measures of risky use were much more prevalent: AUDIT-C indicated high risk for 10.6% and elevated risk for another 15.6%; for 5.6% past-seven-day alcohol use exceeded high-risk limits; and 11.8% had been asked to cut down their drinking. In contrast, only 0.8% self-reported substance-abuse-related healthcare service use in the past 12 months, which was lower than the prevalence based on registers (for a two-year period).
Alcohol-related codes in registers among survey-based heavy drinkers
In Table 2, we take as a point of departure the respondents who state they have used services due to alcohol problems and examine the proportion in this group for whom a substance-abuse-related healthcare service visit can be found in the healthcare registers. For comparison, the equivalent proportion is also shown for the rest of the respondents (compare the columns in Table 2). The time period covered by the register extends beyond the time period reported in the survey, which can cause over-coverage in the register. This analysis represents a kind of quality check of the register data if it is assumed that positive self-reports are true.
Proportion of respondents who have any alcohol-specific code in healthcare registers (%) given their self-report of using health services for substance-abuse-related problems.
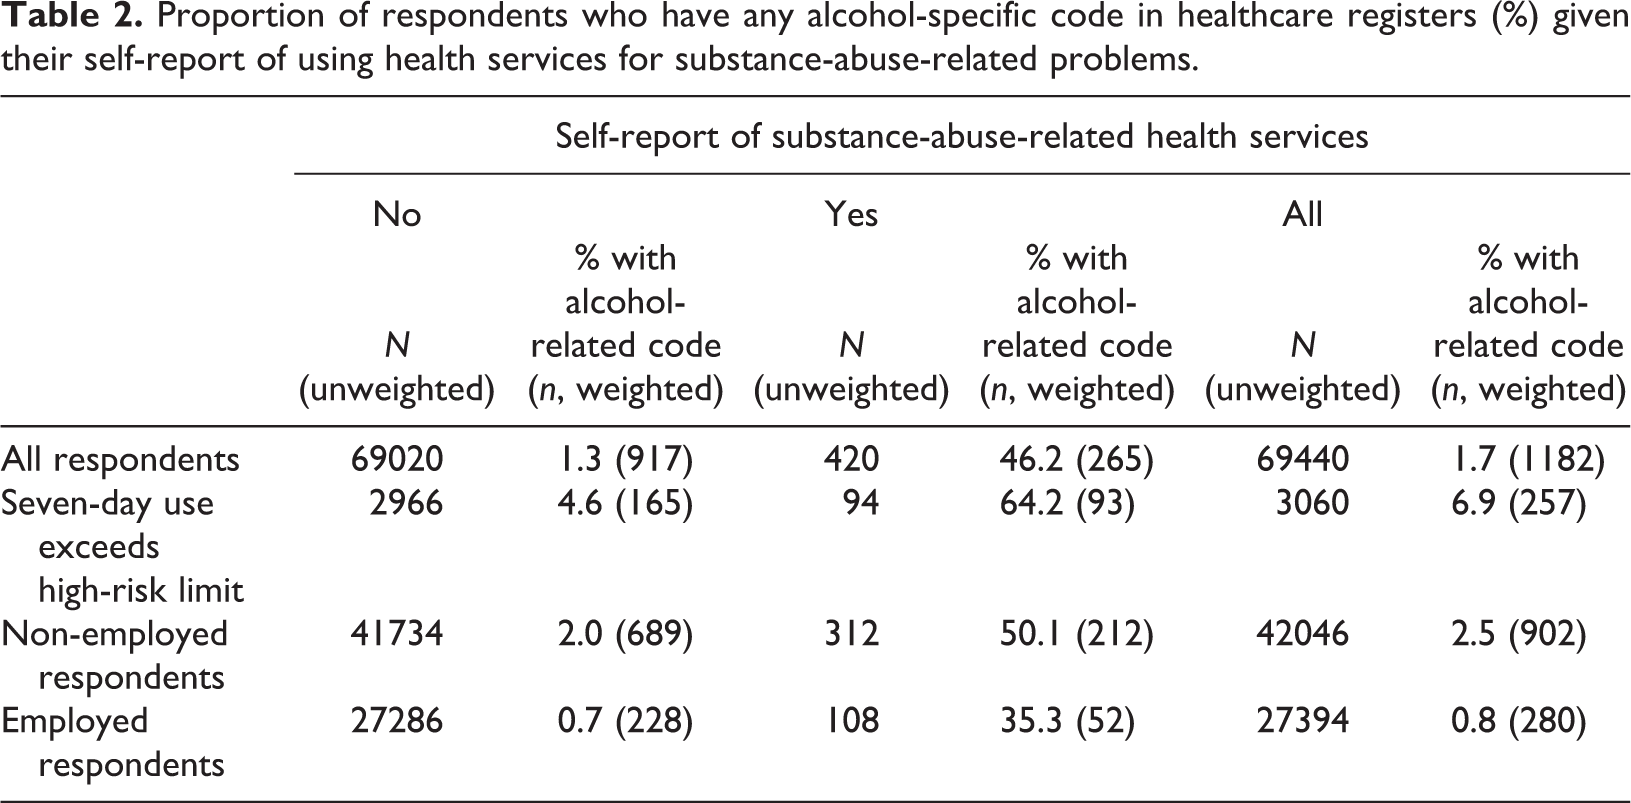
There were 572 (weighted n, or 420 un-weighted) survey respondents who had reported in the survey having used the kind of healthcare services for substance-abuse-related problems which should in principle be included in the register, or 0.8% of all respondents (Table 1: “self-reported substance abuse”). Notably, only 46.2% or 265 of the 572 had records of substance-abuse-related service use in the healthcare registers (Table 2). This proportion is also illustrated in Figure 1 (in blue). Of the survey respondents who lacked an alcohol-specific code in the registers despite reporting using healthcare services for substance abuse problems, 91% had some contact with healthcare services (i.e., a slightly higher proportion than in the whole population according to Table 1), and thus could in principal have been identified also through registers. Among the respondents who said they had not used services for alcohol problems, only 1.3% had a record of substance-abuse-related service use, though this small percentage amounts to a relatively high absolute number (Table 2: 917 compared to the 265 among those self-reporting substance-abuse-related service use).
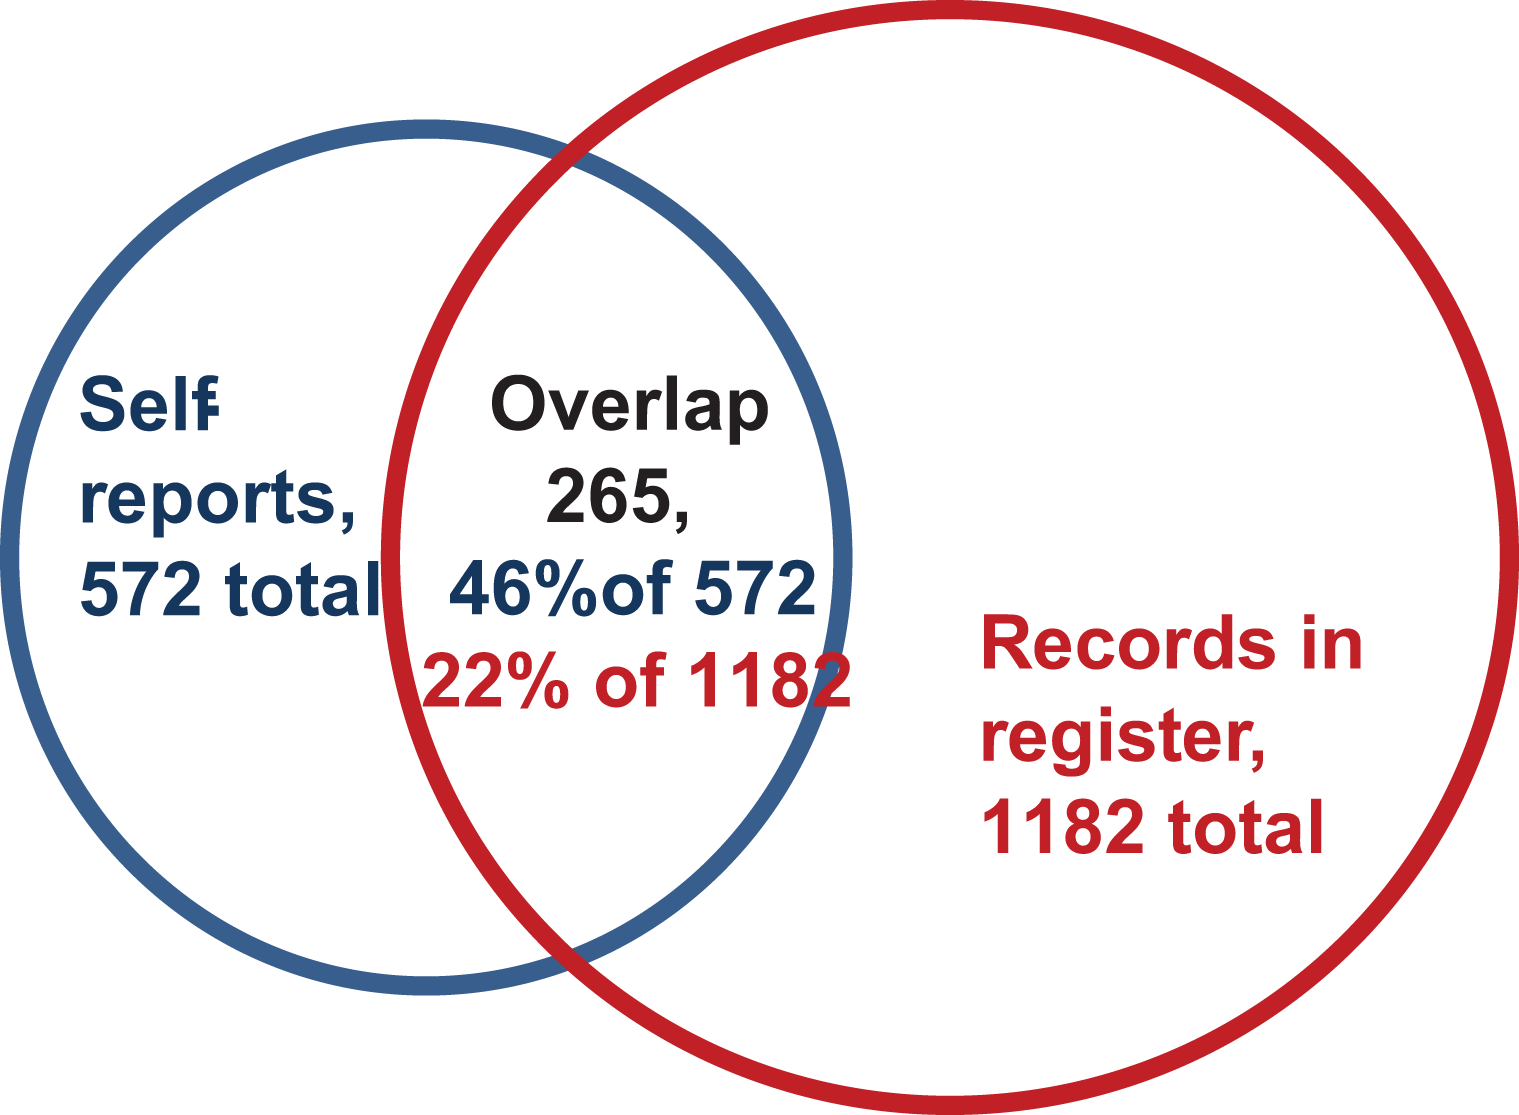
A Venn diagram of the overlap between self-reported substance-abuse-related service use (in preceding 12 months) and register-based substance-abuse-related service use (in the year of response and the preceding year). Weighted numbers and proportions.
For the majority of the population, the question of alcohol-related service use is not very relevant. Therefore, in Table 2 the proportions are also shown using only past-week risky drinkers as the base number. Overall, among risky drinkers 6.9% had an alcohol-related code in the healthcare registers (vs. 1.7% among all respondents) and 3.9% self-reported substance-abuse-related healthcare service use (vs. 0.8% among all respondents). Of the risky drinkers who self-reported substance-abuse-related healthcare service use, 64% had such records in the healthcare register.
In Finland, employed people often have employer-provided occupational healthcare, which is especially the case in cities and is often organised through private healthcare providers. This healthcare is not reported in the PCR. In principle, this was excluded from the self-report measure, but in any case Table 2 has further been divided on the basis of employment status. The proportion of self-identified substance-abuse-related service users covered in the register is somewhat better among those who do not work than among those who do (50.1% vs. 35.3%).
Survey-based self-reports among people who do and do not have alcohol-specific records in registers
Now we turn to look at the intersections from the opposite angle: we take as a starting point the group of respondents who have records of substance-abuse-related healthcare service use in registers and examine their survey responses (compared to people who did not have register-based substance-abuse-related healthcare service use). First, we look at the same measure that was used above for the survey, self-reported substance-abuse-related healthcare service use. Among the 1182 respondents (weighted n; unweighted = 950) who had any alcohol-specific code in the health registers, 22% (n = 265) reported this in the survey (Table 3, first row). This is also illustrated in the Venn diagram in Figure 1. However, as the time period covered by the health registers is twice as long as that in the survey, this proportion cannot be accepted at face value.
Proportion of respondents with self-reported elevated alcohol consumption or alcohol-related service use measures, by categories of alcohol-specific codes in register
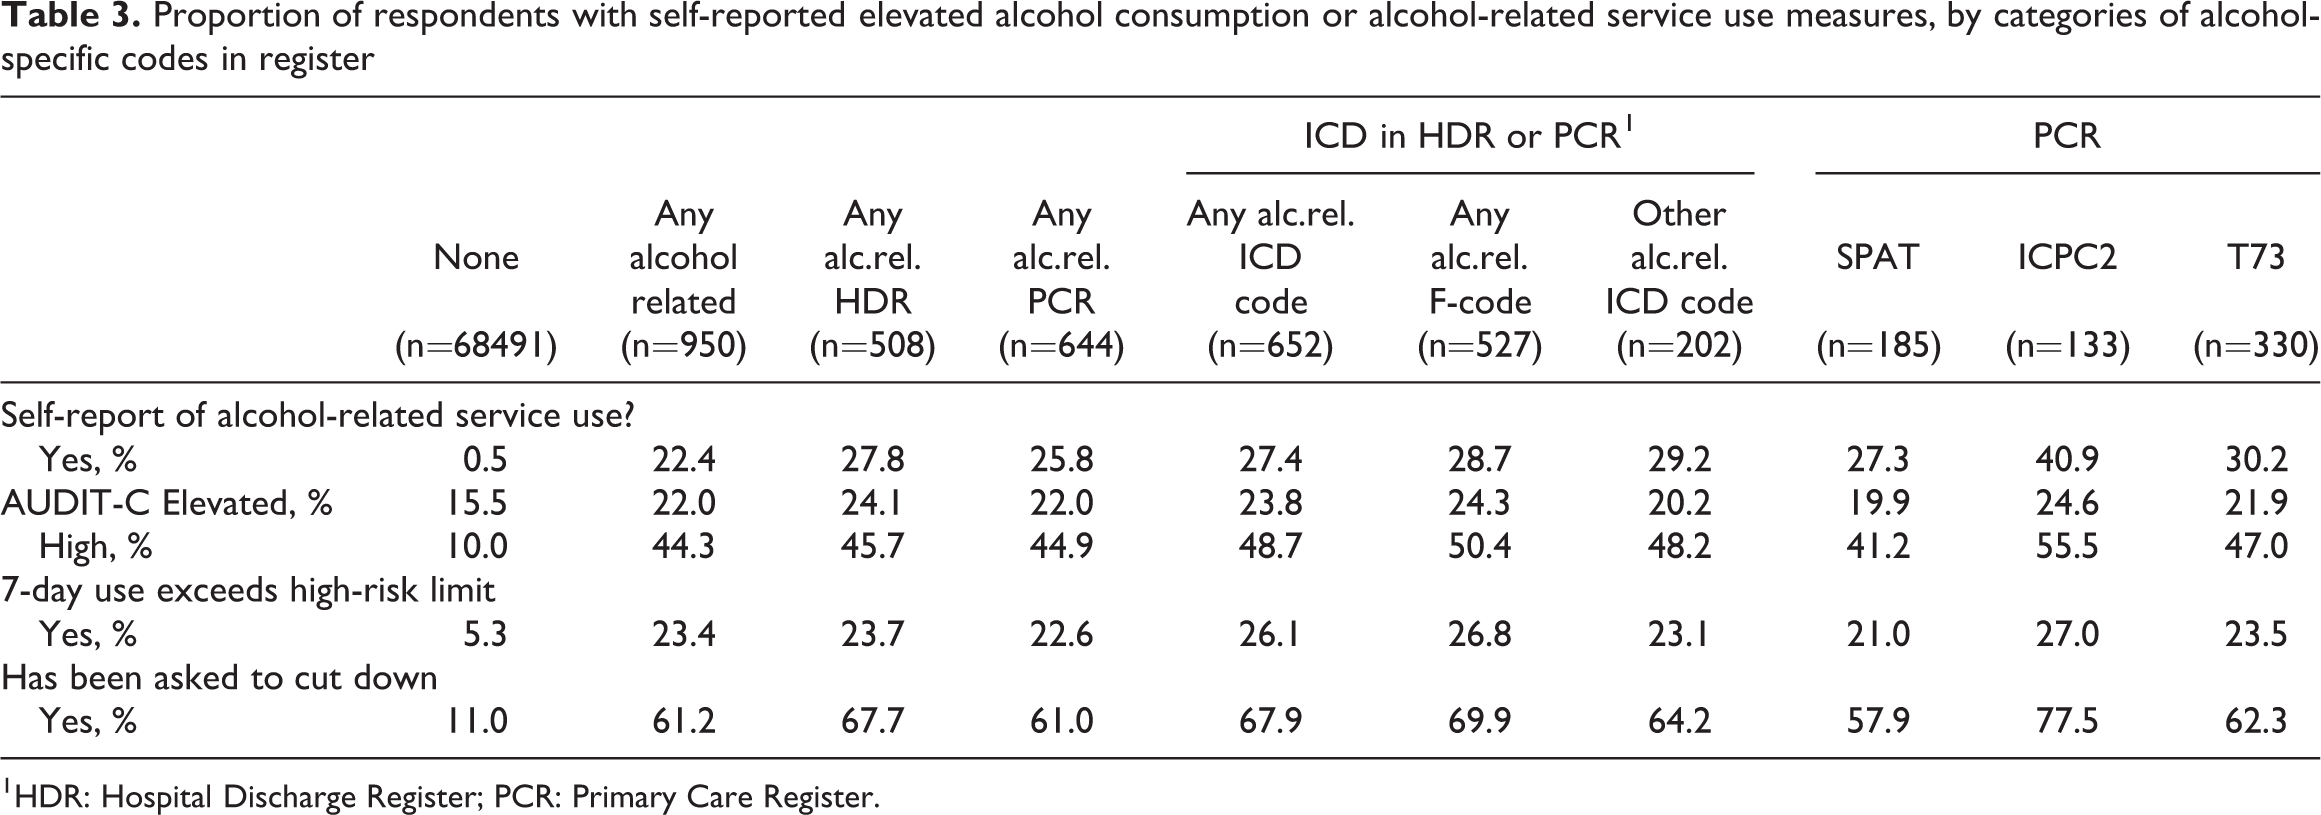
1 HDR: Hospital Discharge Register; PCR: Primary Care Register.
The proportion of heavy drinkers, whether measured by the AUDIT-C, past-seven-day high-risk drinking or being asked to cut down, was, unsurprisingly, clearly higher among those respondents who had records of alcohol-related service use in the registers than among other respondents. In the former group, 61.2% had been asked to cut down their alcohol consumption; 44.3% were identified in the AUDIT-C questionnaire to be high-risk drinkers and a further 22.0% to have an elevated risk. Interestingly, only 23.4% had reported high-risk drinking in the seven days preceding the survey.
There was relatively little variation in this pattern depending on the type of alcohol-related code found in the healthcare registers (columns 3 through 10 in Table 3). Among people who had a code for alcohol misuse in primary care (ICPC2) the proportions of self-reported heavy drinking and having been asked to cut down were somewhat higher, while in the subgroup that had alcohol-related SPAT codes (guidance or brief intervention, or detoxification or rehabilitation), these proportions were somewhat lower.
Which factors independently predict having an alcohol-specific code in healthcare registers?
We now look at what factors may help explain whether or not a record of substance-abuse-related healthcare service use will be found in health register data, when the self-reported use of such services is adjusted for. Table 4 shows the results of a logistic regression model with and without adjustment for other factors in the table, which allows assessment of the strength of the associations independent of the other (correlated) factors. With the exception of past-week heavy drinking and year, all variables remained statistically significant predictors of substance-abuse-related healthcare visits even after adjusting for the other factors. The likelihood of these register entries was higher for men, the middle-aged, people with basic education only, the non-employed, high-risk drinkers, people who have been asked to cut down their alcohol intake and, especially, people who have themselves reported having used healthcare services for substance abuse. The results were roughly similar in the subsamples of employed and non-employed. In the subcategories of requests to cut down, a physician’s request was most clearly associated with an alcohol-related healthcare register entry (OR = 19.7 when adjusted for gender, age and year only, or 5.9 when also adjusting for other sources of requests to cut down), then a nurse or equivalent’s (OR = 13.6, or 3.6), others’ (OR = 9.1, or 3.3) and a family member’s (OR = 4.2, or 1.5).
Odds ratios of having a record of substance-abuse-related healthcare visits in the health register data, by survey variables.
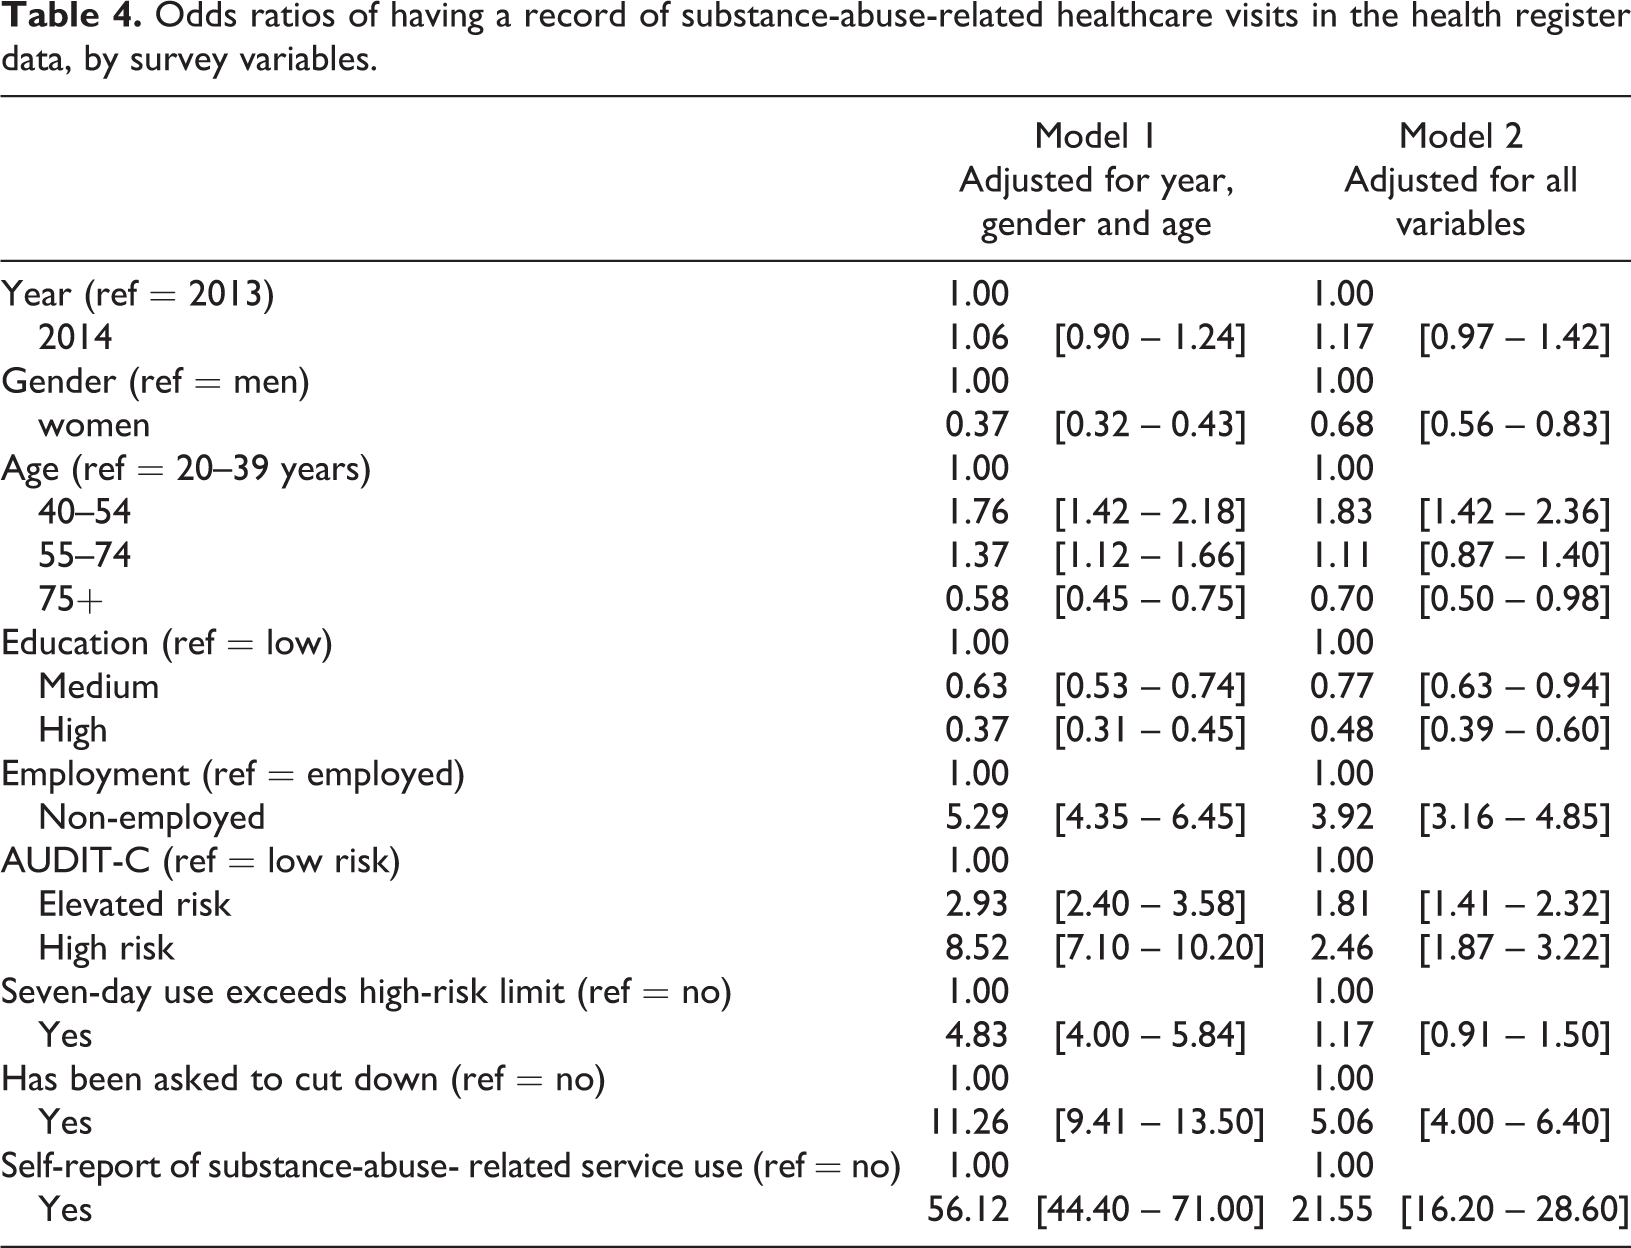
In the survey, respondents were also asked which type of place they had visited for substance-abuse-related services. The places most closely associated with actual register entries were other hospital than a psychiatric hospital (OR = 129, adjusted for gender, age and year), health centre (OR = 62), mental health clinic (OR = 30) and detoxification centre (OR = 20). The associations were lower but still statistically significant for the so called A-clinics (OR = 15; visits to which are not always recorded in registers, and which were therefore not included in the combined measure) and for participating in an AA group (OR = 6.3), which was a separate question in the survey. The associations with occupational or student healthcare, private clinics (which were not part of the combined measure), psychiatric hospital and “other” were not statistically significant.
Discussion
This research demonstrates that a better coverage of alcohol problems can be achieved if the primary care register is used in addition to the hospital discharge register. But it also demonstrates the current challenges in the measurement of alcohol problems or risky drinking, whether register data or survey data are the source of information. As a prime example, records of substance-abuse-related healthcare service use could be found in the healthcare registers for only just under a half of those survey respondents who self-reported use of such services, even if the time period which the health register covered was twice as long. Only 22% of all respondents with records of substance-abuse-related healthcare service use according to registers (in the longer time period) reported this in the survey (in the shorter time period). We found that, with the self-report adjusted for, the likelihood of a substance-abuse-related health register entry was increased if the respondent was male, middle-aged, had basic education only, was non-employed, a high-risk drinker or had been asked to cut down. The approach and design of this study is descriptive and suggestive. The mismatch between measures and the associations is clear, but the interpretation about what explains these differences and what conclusions can be drawn is far from straight-forward.
The first task we set for ourselves was to compare different sets of register data as sources of information on alcohol problems. The health register on outpatient primary healthcare visits used in this study (PCR) represents a relatively new data source for research. Its potential, strengths and weaknesses should be studied further. Some evidence from Sweden already exists that many common adult psychiatric disorders are identifiable only in primary care registers (Sundquist et al., 2017). This finding was confirmed in our study. By using data on outpatient primary care visits, and by using ICPC2, SPAT and the form of service code in addition to ICD codes, the coverage was almost two-fold compared to if only hospitalisation data had been used. By using ICPC2, heavier drinkers were included than when using SPAT codes. Thus, when there is a need for identifying alcohol problems on the basis of registers and a good coverage is important, using outpatient data in addition to inpatient hospital register data can be recommended. However, the kinds of potential biases introduced when using these data are so far not well understood.
Previously, capture-recapture methods have also been introduced in the alcohol field to answer the question of the actual size of the problem drinking population using several independent sources of information (Corrao et al., 2000). Similar research design has been used more often for assessing the number of drug users (Frischer et al., 1991). The method estimates true prevalence on the basis of the degree of overlap in two or more separate samples of the population in question (e.g., survey vs. healthcare register). The assumptions made in the method are not necessarily directly applicable in our case, e.g., assumption of homogeneity, i.e., that for each data source it should apply that all problem drinkers are equally likely to be included in the data (Shenassa, 1999) or if the data from two sources are compared for the same group of people as in this article, then the samples are not independent at all. However, it seems like a promising avenue for future research to explore possibilities to use this approach.
Our second and fourth tasks had to do with assessing the performance of the register data using the surveys as a point of comparison. Register data quality regarding alcohol-related issues has not been much examined. Overall, it has been previously found that the quality of inpatient and hospital discharge data is good, but data on outpatient visits are less studied and hence less is known about this (Sund, 2012). Our finding was that only 46.2% of the respondents with self-reported substance-abuse-related healthcare service use in those services that should in principle be found in the register (during the preceding 12 months) were actually identified in the registers (in either the same or in the previous year). In an ideal world of perfect reporting and recording, this proportion would be close to 100%, especially when taking the longer time period into account. However, before drawing conclusions some limitations need to be acknowledged. Even if the survey form allowed us to try to specify treatments which should be found in the registers, the reality may be different. Service providers of similar services might report to the health registers or not depending on whether they are categorised as belonging to the health or to the social service sector, and especially regional differences in the organisation of the service system may be substantial (Samposalo et al., 2018). A register recording the use of social services is being developed in Finland and will respond to information needs in the future, but currently this is likely to cause some unintended mismatch. This also means that currently the register based on healthcare services is limited in its capacity to fully inform about the prevalence of services offered for alcohol problems.
Despite the potential mismatch, we believe that the result strongly suggests that there are quality issues in the registration practices for healthcare services for alcohol problems. The association between own reporting and being identified in the register was the strongest for hospitals (other than psychiatric), health centres and mental health clinics, so these places are likely to record substance-abuse-related visits better than average. In contrast, e.g., psychiatric hospitals had no associations, which may suggest a need for them to review their recording practices. For employer-provided healthcare and private physicians, for which no associations were found either, the lack of data is a known, built-in problem and an acknowledged target of development for the registers. However, because only a small proportion of self-reported service use occurred among the employed and because the mismatch between survey and register data was seen even though the survey data excluded occupational healthcare services, developing recording practices of occupational healthcare will not suffice to tackle the observed quality issue in registration practices.
Further ideas for developing the quality of recording practices may come from the fitted regression model. With risky drinking and self-reported substance-abuse-related healthcare service use held constant, men, the middle-aged, those with basic education or who were non-employed were relatively well identified in the health records. This suggests that women, the young and old and people with higher education and who are employed have a lower chance of getting their substance-abuse-related service use recorded in the registers. For the employed there is a natural explanation, as they use occupational healthcare services and hence do not end up with records in the health register; this is a target for development in itself. For the other factors, the results suggest there may be biases related, e.g., to acknowledgement of problems in individuals representing groups where the problems are less frequent or to avoidance of stigmatisation that service providers should be aware of.
Of the different self-reported measures related to alcohol use, the best predictor of having a substance-abuse-related code in healthcare registers (and presumably of real prevalence of alcohol problems) was having been asked to cut down drinking. Of people with an alcohol-specific code in registers, 61% reported this, and the all-adjusted odds ratio of alcohol-specific code in healthcare registers for them was greater than 5. This was particularly the case if the request was made by healthcare personnel. This may again either indicate that they then also recorded this worry which would be a technical explanation for the association, or it could also be a more substantive sign that worry by healthcare personnel is indicative of actual problem drinking and a cause for worry.
Our third task was to examine what self-reported alcohol use looks like for people who have been identified in healthcare registers to have used services for substance-abuse-related problems. Underreporting of alcohol consumption and other alcohol-related issues is a widely acknowledged phenomenon in survey studies (Gmel & Rehm, 2004; Kopra et al., 2018; Stockwell et al., 2008). The comparison of this article cannot be taken at face value, because the time periods covered differ: a person can first have been a heavy drinker, then received treatment for related problems, and then quit or reduced drinking, and hence they could quite accurately both have a record of substance-abuse-related service use and self-report no or low alcohol consumption. Despite this, we believe that the results of this study suggest considerable underreporting. Even if respondents with an alcohol-specific code in the healthcare registers reported much higher alcohol consumption than others, only 44% were categorised as having high risk in AUDIT-C, and another 22% as having elevated risk. Furthermore, only 23% of the respondents with an alcohol-specific code in the healthcare registers had reported exceeding the high-risk use threshold in the previous week. The comparison of these survey-based measures of heavy drinking and their associations with substance-abuse-related service use suggests that the past-seven-day measure of risky drinking is a poor measure of health harm, while having been asked to cut down may function much better in this respect.
All in all, these results identified an evident need for continuing education and development regarding recording of treatment of substance use disorders. Further development of recording practices is essential in order to advance treatment and knowledge transfer within different sectors in social and healthcare services and from the personnel to the patient. Furthermore, in the secondary use of health and social data for research purposes regarding substance use disorders, the challenges described by this study should be noted.
Footnotes
Declaration of conflicting interests
The authors declared no potential conflicts of interest with respect to the research, authorship, and/or publication of this article.
Funding
The authors received no financial support for the research, authorship, and/or publication of this article.