
Abstract
Aim:
To analyse prevalence and trends in older people’s (60+) alcohol use in Finland in 1993–2018.
Data and method:
Data on people aged 65+ were obtained from the Health Behaviour and Health among the Finnish Elderly study (HBHFE) for the years 1993–2011 and from its successor the National FinSote Survey for the years 2013–2018. Data for 60–64-year-olds and for the reference group (20–59-year-olds) were obtained from the Health Behaviour and Health among the Finnish Adult Population (HBHFA) study for the years 1993–2011 and from the FinSote study for the years 2013–2018. Four measures were chosen to describe prevalence and trends in drinking patterns in five-year age groups among men and women aged 60+: prevalence of current drinking, prevalence of frequent drinking, typical amounts of drinking and prevalence of heavy episodic drinking (HED).
Results:
Regarding prevalence of current drinking and frequent drinking, older women have been catching up with men, but older men still consume larger amounts of alcohol per occasion. The long-lasting increase in the prevalence of current drinkers continued in most older female age groups into the 2010s, settled in most older male and some female age groups, and shifted downwards in the oldest male age groups. In most older male and female age groups, the increasing trend in frequent drinking continued to the present. Data on typical amounts consumed and HED were only available for 2013–2018. In that period those measures remained rather stable.
Conclusion:
More detailed research on drinking patterns among people aged 60+ years is needed for two reasons: older people’s drinking is a new cultural phenomenon and alcohol-related social and health harms are increasing in older age groups.
Finnish population studies show that alcohol consumption among those aged over 65 years has increased since the mid-1980s. This is true particularly for women (Helldán & Helakorpi, 2014; Tigerstedt et al., 2018; Vilkko et al., 2010). With the phenomenon being historically new, it has raised much discussion and concern, particularly in the 21st century, when drinking grandmas and grandpas have become a popular theme in daily papers and weekly magazines (Törrönen et al., 2015).
Finnish social and medical scientists reported the first signs of older people’s changing drinking patterns in the late 20th century (Kivelä et al., 1988; Tolvanen, 1998; Tolvanen & Jylhä, 1994). Although some informative studies have been published in Finland in the 2000s (e.g., Ahlström & Mäkelä, 2009; Haarni & Hautamäki, 2008; Jyrkämä & Haapamäki, 2008; Sulander, 2007; Tigerstedt et al., 2018; Vilkko et al., 2010), they form a relatively scattered collection of knowledge.
While in the last 50 years Finnish drinking patterns have been analysed meticulously in specialised studies of every other age group, older people’s drinking has received less attention. One indication of this is that between 1968 and 2008 the upper age limit of the Finnish “Drinking Habits Survey”, a population study focusing specifically on Finnish drinking patterns, was set to the relatively young age of 69 years.
The exclusion of older people from such studies had reflected the fact that in North America and the Nordic countries drinking had been previously much rarer among these older age groups in the first half of the 20th century (Ahlström & Mäkelä, 2009). In 1968 as many as 55% of Finnish women aged 50–69 were abstainers, i.e., they had not used alcohol during the last year. Those women were born between 1899 and 1918. Within 40 years, from 1968 to 2008, the per capita volume of Finnish women’s alcohol consumption increased six-fold and the proportion of abstainers among 50–69-year-old people had shrunk to around 15%. The trend was similar but much less dramatic among men aged 50–69 years: the proportion of abstainers fell from 19% in 1968 to 10–13% in 2000–2016. (Härkönen et al., 2017).
The data situation was improved in 1985 when the study entitled “Health Behaviour and Health among the Finnish Elderly” (HBHFE) began. Between 1985 and 1991, it included 65–79-year-old people, and from 1993 to 2013 the upper age limit was increased to 84. Since then even those over 84 years have been surveyed.
In spite of these improvements in collecting data on drinking habits among older people, we still lack elementary knowledge of different aspects of what has happened in older people’s drinking in recent decades. Thus, the aim of this study is to provide a basic view of how older men’s and women’s drinking habits have developed in the last 25 years for different age groups over 60 years.
To fill this knowledge gap we examined the following indicators: (1) prevalence of current drinking, (2) prevalence of frequent drinking, (3) typical amounts of drinking and (4) prevalence of heavy episodic drinking.
Data and methods
To accomplish our task we used data from three national survey datasets managed by the Finnish Institute for Health and Welfare (THL). The Health Behaviour and Health among the Finnish Elderly (HBHFE) postal survey was carried out biannually in 1993–2011 including people between 65 and 84 years of age. Each year, a random sample of 300 men and 300 women for each five-year age group was selected from the national population register (i.e., 2,400 people). For example, in 2011 the total number of respondents was 1,723 (853 men, 870 women) and the response rate was 72%. In previous years the response rate varied between 73% and 85%. Data for people aged 60–64 years came from the Health Behaviour and Health among the Finnish Adult Population (HBHFA) postal survey covering the population aged 15–64 years.
In 2013, the HBHFE survey was integrated into the “National FinSote Survey” (FinSote) study, which is carried out annually as a postal and online survey including people who are aged 20 years and above. The annual size of the random sample has varied between 5,000 and 59,400 during the period 2013–2018. The probability of sampling people over 75 years of age was doubled in order to secure a sufficient number of respondents in that age group. Those elderly who were living permanently in institutions were not included in the sample frame. Moreover, those who were incapable of answering the questionnaire due to deteriorated health or dementia were handled as non-response. The response rate across all age groups and survey years within the period 2013–2018 declined (53% in 2013–2015 vs. 45% in 2018). The response rate among people over 55 years of age has varied between 67% and 58%, respectively across this period (see Table 1).
Total number of respondents aged 60+ years, number of respondents in reference group (20–59 years), number of respondents in each five-year age group per survey and by gender, and survey response rates.
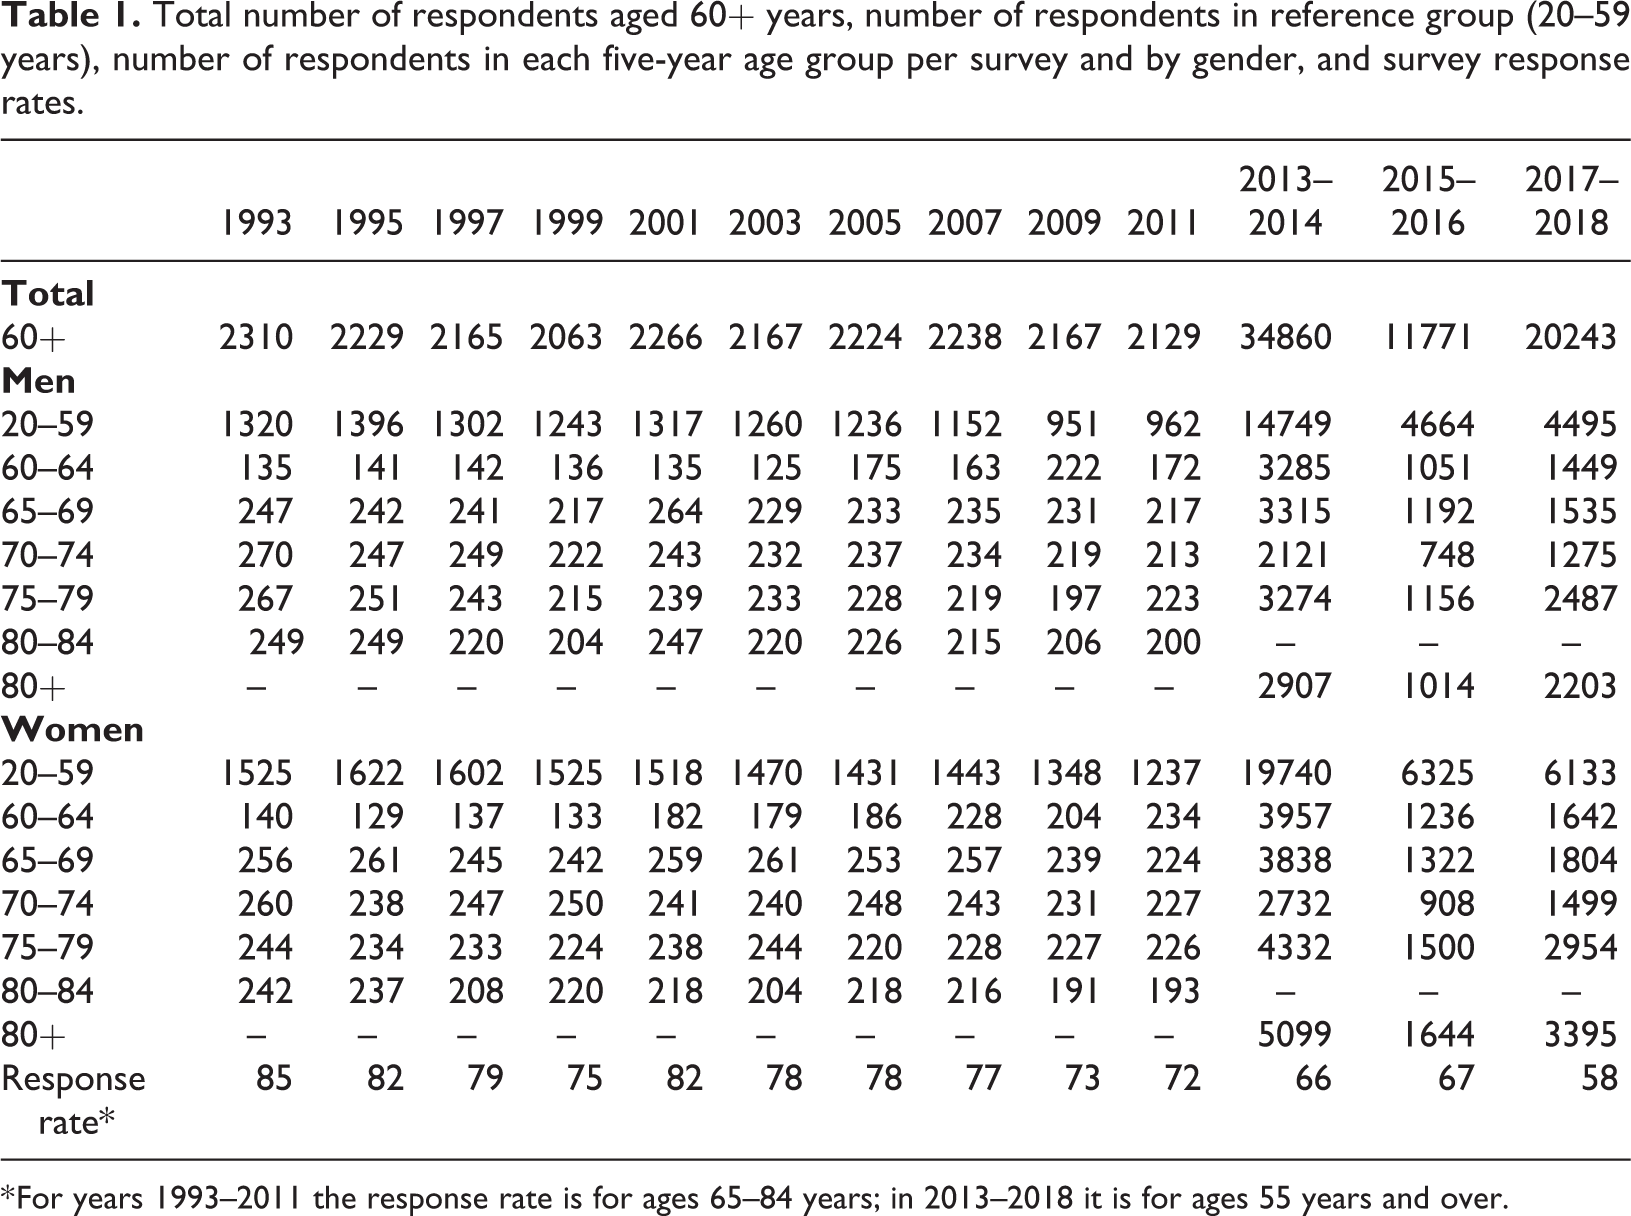
* For years 1993–2011 the response rate is for ages 65–84 years; in 2013–2018 it is for ages 55 years and over.
To restore the population representation of the FinSote data, weights were used in the analyses. The calculation of weights was based on the inverse probability weighting (IPW) method. The weight variable values were calculated using register-based data for the whole sample on age, gender, marital status, language, education and geographical area. According to previous research, the IPW method has been found to improve the accuracy of studies made on the Finnish population (Härkänen et al., 2014), though other times the improvement has been reported to be very small (Kelfve et al., 2013; Tolonen et al., 2019).
In order to maintain the bi-annual rhythm of the data series running from 1993 to 2011, we combined the data of two consecutive annual data collections for 2013–2018. That is, after 2011 the surveys used were combined for years 2013/2014, 2015/2016 and 2017/2018.
Older people are often lumped together into one single age group despite the fact that their social and functional abilities and capacities vary a lot due to both age and other factors. Therefore, when analysing the indicators of alcohol use we divided people over 60 years of age into five 5-year age groups, except for frequent drinking, for which we could use only four 5-year age groups due to differences in the response categories in the questionnaires for people younger vs. older than 60 years. By this five-year age grouping we hoped to grasp age-specific variations in older people’s drinking patterns.
We operationalised the four indicators in the following way:
Prevalence of current drinking – the proportion of drinkers during the past 12 months (1993–2018).
Prevalence of frequent drinking – the proportion of people using alcohol at least once a week (1993–2011) or at least twice a week (2013–2018).
Typical amounts of drinking – the average number of units consumed on a typical drinking occasion (2013–2018).
Prevalence of heavy episodic drinking – the proportion of those who have drunk six or more units (12 g) on a single occasion at least monthly during the last year (2013–2018).
In our analysis we used different reference groups depending on dataset and the comparable questions available. To serve as a reference group, we utilised the HBHFA survey covering ages 20–64 years and conducted in 1993–2011. The response rates in this study varied between 56% and 72%.
For research Measure 1 the reference group of people aged 20–59 years, as well as the age group 60–64 years, were derived from the HBHFA. The same reference group and the age group 60–64 were not available for Measure 2, because the frequency question was formulated differently. For Measures 3 and 4 the reference group 20–59 years was derived from the FinSote study.
Results
Prevalence of current drinking
In the combined age group of 60–84-year olds, a minority (39%) of women reported in 1993 that they had used alcohol in the past year. Twenty-five years later in 2018, the corresponding proportion had increased to more than two thirds of that age group (69%).The trend among men of the same age group was less radical, but substantial, i.e., showing an increase from 67% to 81%. As a result, the difference in prevalence between men and women has diminished markedly in one generation, from 28 percentage points to about 12 percentage points.
In Figure 1 this entire age group of 60–84-year-old people is broken down into five-year age groups. The figure shows that the older the age group, the smaller the proportion of alcohol users. This applies to both men and women. In most male age groups, the trend was moving upwards in the 1990s and until 2003–2007, after which it has become more or less stable or, among the oldest men, even started descending. In the male reference group (20–59 years) the proportion of alcohol users has remained unchanged throughout the study period.
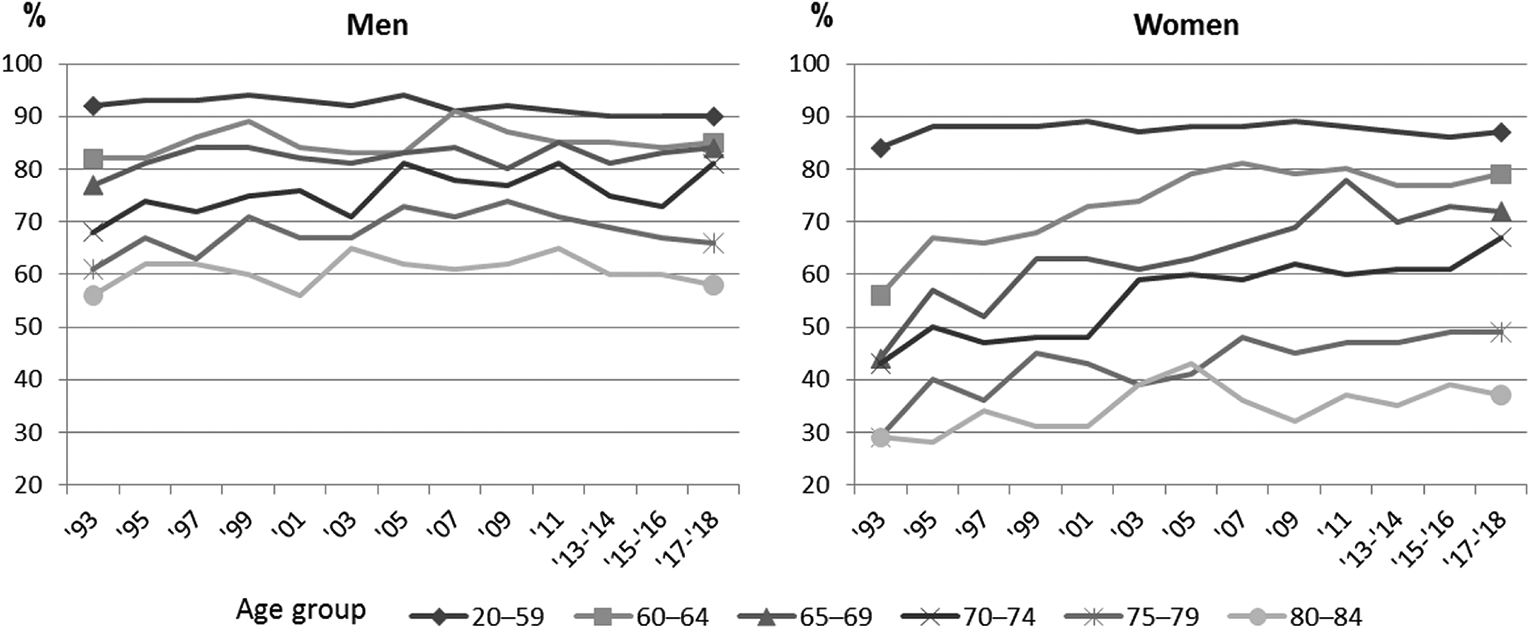
The proportion (%) of 60–84-year-old men (left) and women (right), by five-year age groups, that has consumed alcohol during the last 12 months, 1993–2018. Reference group aged 20–59 years included.
For older women, the proportion of alcohol consumers has increased considerably and continuously in all five-year age groups except for the oldest one, where the increase took place in 1993–2005 and thereafter levelled out. The increase was most notable in the 1990s and the first years of the 2000s. After that the number of consumers among 20–59-year-old women has been more or less stable.
The gradually decreasing difference in the prevalence of alcohol use between older men and women in the last 25 years reflects different histories of men and women. Regardless of birth cohort, alcohol use has been a common habit for older men for a very long time. Among women, alcohol consumption only started to increase in the 1960s, when younger cohorts as opposed to older ones, began to drink. When in the 1990s and onwards these younger female cohorts aged, they also brought their drinking habits into old age. Figure 1 demonstrates that throughout the 2010s ca. 70–80% of women and ca. 80–85% of men aged 60–69 years had consumed alcohol in the past year. That is, the gender difference in the proportion of alcohol users had diminished from some 25–30 percentage points in 1993 to about 5–10 percentage points in 2017/2018. These men and women of the 2010s were born in the 1940s and 1950s. Whereas in the case of Finnish men, the so called wet generation, which spread liberal drinking practices in the 1960s and 1970s, is usually defined as the baby boomers born in the late 1940s (Sulkunen, 1981), female wet cohorts have been shown to be a much broader category ranging from those born in the late 1940s all the way up to 1969 (Härkönen, 2013; Härkönen & Mäkelä, 2018).
Although the drinking of women aged 60–64 years is catching up with that of men, the oldest female age groups lie far below the corresponding male groups. For example, the proportion of male users aged 80–84 years has oscillated between 55% and 65% compared to 30–40% among women.
Prevalence of frequent drinking
With the exception of the oldest age group, the frequency of older men’s drinking has tended to increase (Figure 2, left), especially for those aged 65–69 years. The steep increase in this age group is driven by men born in the late 1920s and accelerates when the cohorts born in the 1940s reach retirement age. We also note that the fairly small differences in drinking frequency between the male age groups in the 1990s and the first years of the 2000s tend to grow larger in the 2010s due to the increasing drinking frequency among the 65–74-year-old men.
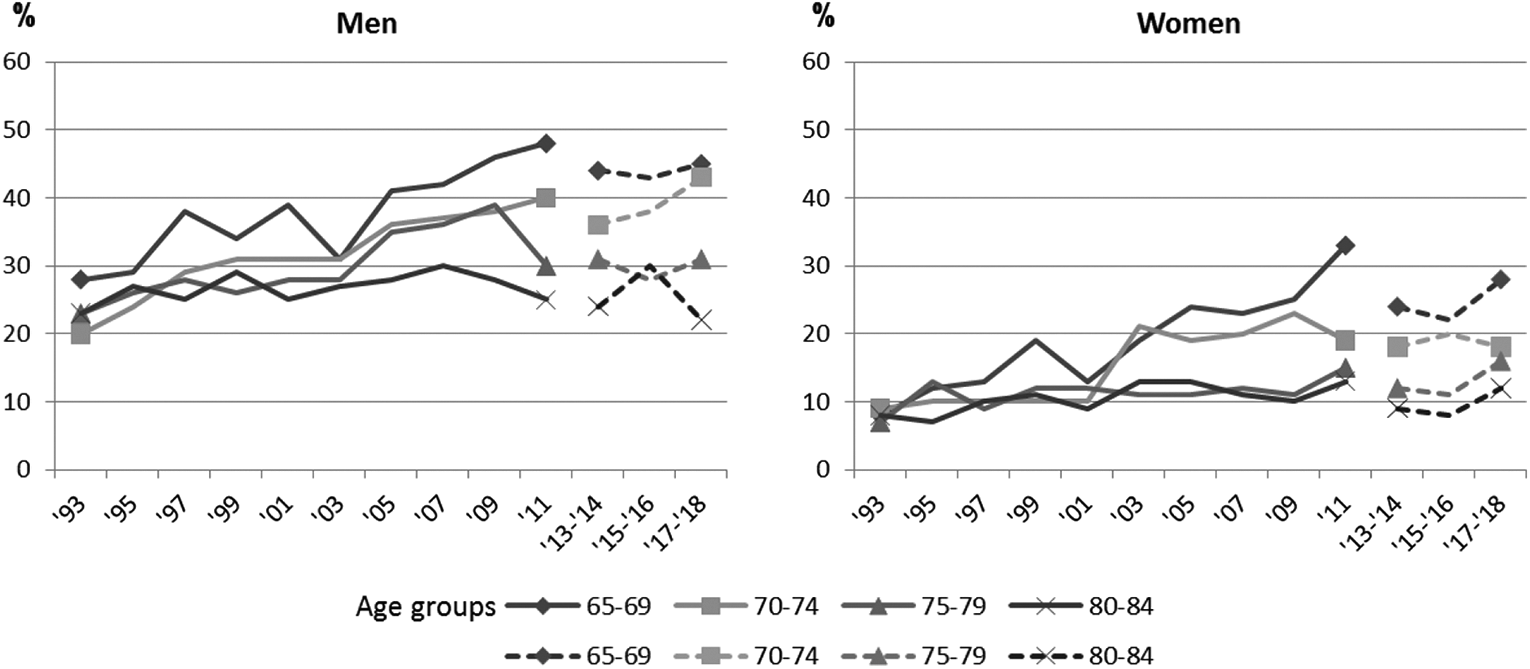
The proportion (%) of 65–84-year-old men (left) and women (right), by five-year age groups, that has used alcohol at least once a week (2001–2013) and at least twice a week (2013–2018; broken lines).
The curves for women look quite similar, but the frequencies are much lower. First, in 1993, weekly drinking was equally rare in all older age groups: only 7–9% of respondents in each five-year age group drank alcohol at least once a week. However, around the turn of the century, the proportion of alcohol users began to increase among women aged 65–74 years. The steeply rising trend in 1993–2018 is driven by these 65–74-year-old women who were born between 1919 and 1953. Second, the oldest female age groups are an exception as their frequency of drinking seems to have been quite stable since 2000. Therefore, significant gaps have developed between the different female age groups (Figure 2, right).
As mentioned, the HBHFE survey was reorganised in 2013. As a result, the time series concerning drinking at least once a week ceased and was replaced by a measure of drinking at least twice a week (broken lines in Figure 2). Although the curves for the different age groups are not consistent, it is obvious that frequent drinking especially among women between 65 and 69 years (born in the late 1940s and early 1950s) has increased even in the 2010s. For men aged 65–74 years the direction is also upwards in the 2010s. In addition, changing to the stricter criterion for frequent drinking, from at least once a week to at least twice a week, changed the prevalence rates surprisingly little.
Finally, Figure 2 illustrates that, in spite of the fact that the gender gap in frequency of drinking once or twice a week has shrunk during the last 25 years, older men still drink much more frequently than women. In 2017/2018 almost half of men and a good quarter of women aged 65–69 years reported that they drank at least twice a week. On the other hand, we also observe that in 2017/2018 the proportion of women aged 65–69 years drinking alcohol at least twice a week for the first time exceeded the proportion of men aged 80–84 years drinking equally often, and almost caught up with men aged 75–79 years.
Typical amounts consumed
Data on the number of units of alcohol the respondents consumed on a typical drinking occasion are available from 2013 to 2018. The response options ranged from 1–2 units to 10 or more units. In Figure 3 we present the average amount consumed on a typical drinking occasion. The results indicate, first, that the older the age group, the smaller the amounts typically consumed on a drinking occasion. Actually, there is a notable difference between the younger olds and the older olds, and more so among men than among women. Second, men consume much larger amounts than women. In fact, when we looked closer at those typically drinking relatively large amounts (5 or more units per occasion), men aged 60–69 years were found to be a case of their own: in 2013–2018 between 25% and 27% of them typically drank at least five units per occasion (not shown in Figure 3). Related to gender differences, we noticed that women aged 60–69 years and men aged 75 years or more typically consume about the same amount on average, i.e., ca. 2–2.5 units. Third, between 2013 and 2018, both for men and women, the trend in typical amounts consumed on average is either stable or, for the oldest men, descending. In the reference group (20–59 years) there is a downward trend, particularly among men. As a result, in 2017/2018 there remained very little difference between the average amount of alcohol typically consumed by 60–64-year-old men and men aged 20–59 years.
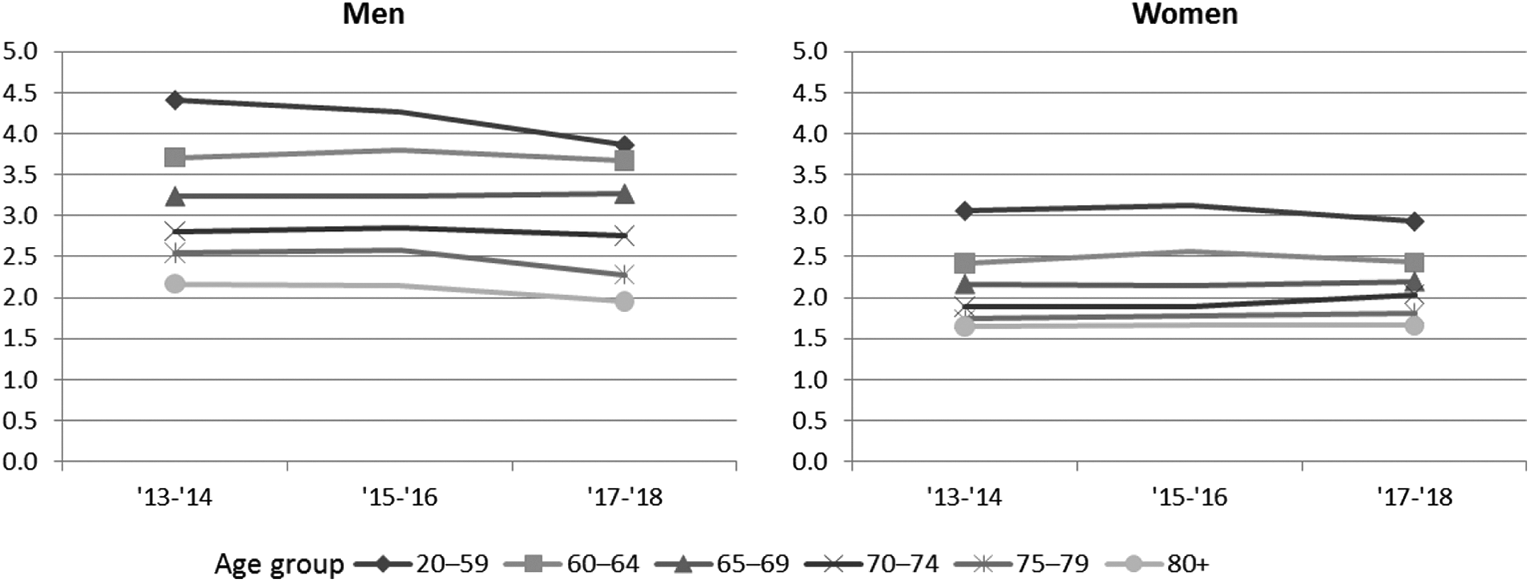
The average amount of units of alcohol consumed on a typical drinking occasion for men (left) and women (right) over 60 years of age, by five-year age groups, 2013–2018. Reference group aged 20–59 years included.
These results prove that age really matters: younger and older olds prefer very different amounts of alcohol. But gender also matters: although in recent decades men’s and women’s drinking has converged in many respects, older men and women prefer very different amounts of drink.
Heavy episodic drinking
Data on consuming large amounts (6+) on one occasion (“heavy episodic drinking”, HED) at least monthly during the last year are also available only for the period 2013–2018 (Figure 4). Similar to the proportion of respondents typically using five or more units per occasion, men aged 60–64 years turn out to be in a league of their own: around 40% of them had consumed six or more units on a single occasion at least once a month. The oldest male age group was clearly more moderate: among them the corresponding proportion varied between 7% and 10%. Among older women HED was rather uncommon. The 10% level was exceeded only by those aged 60–64 years (11–13%), while 97–99% of the oldest age group did not engage in HED monthly or more often.
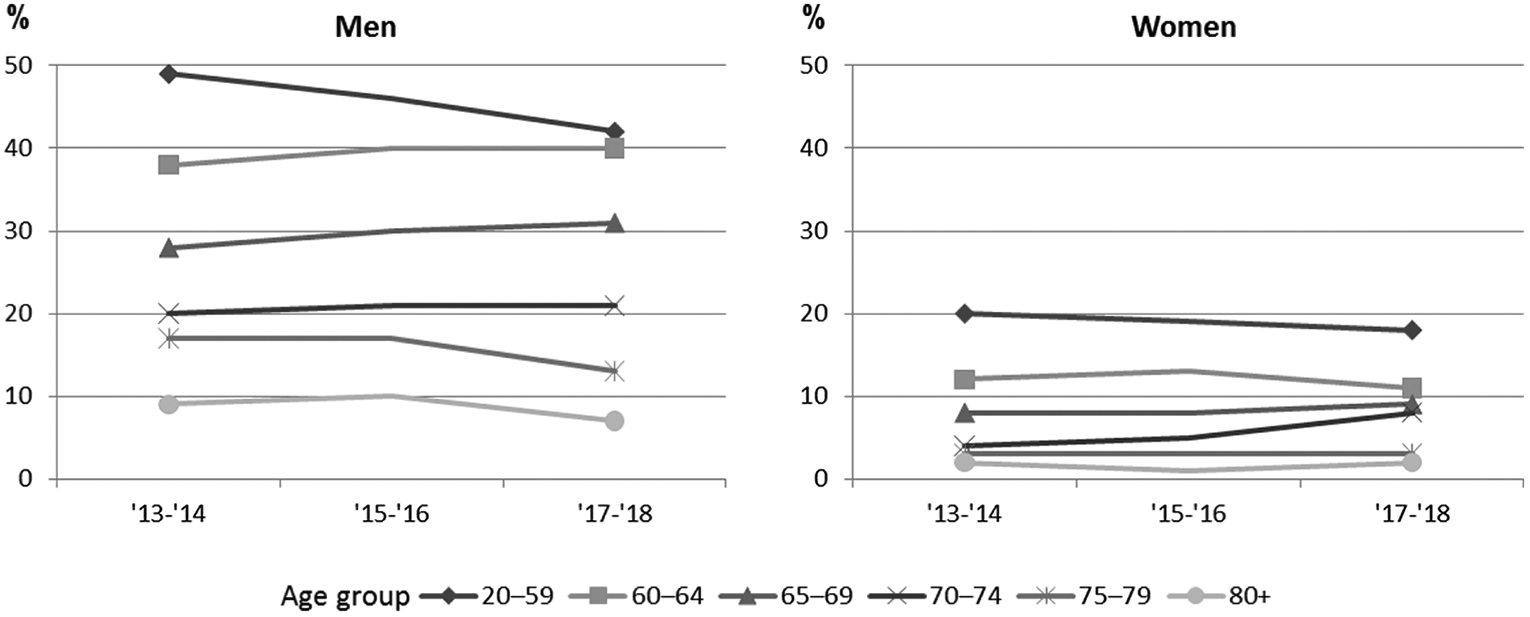
The proportion (%) of men (left) and women (right) over 60 years of age, by five-year age groups, that has consumed six or more units on a single occasion at least once a month, 2013–2018. Reference group aged 20–59 years included.
Generally speaking, the levels of older people’s heavy episodic drinking were quite stable in most age groups in the period 2013–2018, whereas there was a downward trend among those aged 20–59 years, particularly among men.
Conclusions
In sum, basic indicators of alcohol use – prevalence of use, prevalence of frequent drinking, quantities of alcohol typically consumed on one occasion and large quantities (6+ units) consumed at least monthly – show that people aged over 60 years constitute an essential subgroup of alcohol consumers. Among older Finnish men, the prevalence of alcohol consumption was high already before the millennium shift, but after that their frequency of drinking has reached new levels. In addition, a significant proportion of older men tend to consume quite large amounts of alcohol. In contrast to older men, the change is more comprehensive and pronounced among older women, because until the 1980s alcohol consumption was not customary behaviour among women of retirement age.
Data on the prevalence and frequency of drinking were available for the period 1993–2018. In the course of this one-generation period, the gender gap in the proportion of alcohol consumers has narrowed substantially. In the 2010s, ca. 70–80% of women and ca. 80–85% of men aged 60–69 years were current alcohol users, and the gender difference had diminished in 25 years from ca. 25–30 percentage points to ca. 5–10 percentage. Likewise, while both men and women drink more frequently nowadays than 25 years ago, the relative change among women has been much greater. Regarding typical and large amounts consumed, data were only available for the period 2013–2018. It turned out that older women typically contented themselves with much smaller amounts of alcohol than men.
Research carried out in the 21st century as well as public debate have paid much attention to alcohol consumption becoming widespread and frequent in Finland among age groups exceeding the age of 60. Our results indicate that, concerning the prevalence of current drinking, the growth starting in the second half of the 1980s (Laitalainen et al., 2008) continued until about 2003–2007 for most age groups. Thereafter, the rising trend weakened, settled on a higher level or, in some male age groups, shifted downwards. In some female age groups the increase continued even into the 2010s. Regarding frequent drinking (once or twice a week), the picture is different as the upward trend continued into the 2010s for most age groups, except for the oldest male and female age group.
Regarding both typical amounts of drinking and prevalence of heavy episodic drinking, it is important to note that while for those below 60 years of age, the trends for the 2010s are pointing downwards (Mäkelä, 2018), our data on older people (although covering only the years 2013–2018) rather suggest stable levels in heavy drinking.
One should be careful not to consider people aged 60 years or more as one single age group of “people in retirement age”, as the differences in drinking patterns within this wide age span are very large. In particular, drinking patterns among men and women aged 65–69 resemble those of younger male and female age groups, respectively, while drinking patterns among men and women aged 80 years or more are very different.
Our analysis concentrated on changes in drinking patterns. However, it should be noted that the increase in older people’s alcohol consumption goes hand in hand with an escalation in social and health harms related to alcohol. Statistics and registers tell the bare truth about the development of harms in older age groups. For example, in the first years of the 2000s the number of alcohol-related diseases (primarily of the liver) increased by ca. 50% among those aged 60 years and older. After 2007, deaths from alcohol-related diseases have decreased sharply in other age groups, but among those over 60 years the mortality rate has remained at the record-high level (Statistics Finland, n.d.; see also Mäki, 2020). We also know that one third of the clients visiting social and health agencies in Finland because of alcohol and drug problems have passed the age of 55 years (Kuussaari et al., forthcoming).
There are some limitations in our study which should be taken into account when interpreting the results. First and foremost, because this study was part of a comparative collaboration, the selection of measures was narrowed down by what was available to study in all four participating Nordic countries. For the same reason, we had to limit the scope to a very basic descriptive-level analysis and could not analyse the potential causes of changes of other background factors than age and gender. Second, because the data collection was carried out among elderly persons, some of the non-response was due to cognitive impairment or poor physical health, which might have caused population-specific measurement errors.
In this article we have concentrated on analysing status and trends in gender- and age-group-specific patterns of older people’s alcohol consumption. The impact of certain cohort effects has been mentioned only in passing, although they seem to be most relevant for a deeper understanding of drinking in old age. Future research would gain from analysing cohort effects more thoroughly.
Footnotes
Declaration of conflicting interests
The authors declared no potential conflicts of interest with respect to the research, authorship, and/or publication of this article.
Funding
The authors received no financial support for the research, authorship, and/or publication of this article.