
Abstract
Aim:
To investigate maternal alcohol intakes before and during pregnancy, their impact on mothers and infants to 18 months.
Method:
Prospective study of 504 New Zealand volunteers visited in months 4 and 7 of pregnancy, measurements taken, lifestyle details recorded including alcohol intake before and during pregnancy. Eighteen months after birth, 370 infants were measured, and infant development recorded.
Results:
Nineteen per cent of mothers never drank, 53% stopped when they knew they were pregnant, 29% continued to drink. Twenty-two per cent of drinkers binge drank (over 50 g alcohol per session) before pregnancy and 10% during pregnancy. Daily drinking was associated with increased obesity in mothers. Alcohol consumption before or during pregnancy was not associated with infant motor development, had a slight negative effect on growth, and a significant association with vocal ability to 18 months. Energy intake appeared to partially moderate this effect.
Conclusion:
Maternal alcohol consumption exceeding 50 g per session both before and during pregnancy was associated with decreasing vocal ability in the 18-month old infant.
The aim of this article is to report data on maternal alcohol intakes before and during pregnancy for a sample of 504 women from the general New Zealand (NZ) population, and to investigate evidence of impacts on the health and development of their infants up to 18 months, or on the health of the women themselves. In particular, the data were examined for evidence that increasing alcohol consumption, or perhaps binge-drinking, were associated with growth retardation or developmental delays in physical coordination and language in the infants. The association between maternal alcohol and maternal obesity was also examined. The results provide health professionals with further evidence to encourage drinking cessation or moderation of intake before and during pregnancy.
The next paragraphs introduce the topics under consideration. First, maternal alcohol intake is believed to be high in NZ, and this study provides more data on prevalence of consumption, prevalence of binge-drinking before and during pregnancy, and quantity and duration of prenatal alcohol exposure (PAE) of the foetus. Drinking before pregnancy is significant, because usual drinking habits may continue until pregnancy recognition several weeks after conception. Consequently the foetus may be exposed to high concentrations of alcohol in its early development, when most susceptible to alcohol’s effects (Cohen-Kerem & Koren, 2003; Nykjaer et al., 2014; for an animal model see Webster, 1989). As regards prevalence, several studies have reported on NZ maternal alcohol intake before and during pregnancy (Connor & Casswell, 2012; Mallard, Connor, & Houghton, 2013; McLeod, Pullon, Cookson, & Cornford, 2002; Ministry of Health, 2009; Parackal, Parackal, & Harraway, 2013; Rossen et al., 2018; Superu, 2015). Overall, these indicate that around 71–82% of women drink before pregnancy, 22–53% continue drinking when they know they are pregnant, with 7–12% continuing to drink heavily. Criteria for heavy (or binge) drinking will be considered in the methods section. Heavy alcohol consumption may be associated with obesity in the mother (Traversy & Chaput, 2015), and this link is explored below. As well as being harmful to the woman, maternal overweight or obesity is further believed to be a risk factor for infant mortality, or morbidity when the infant is older (Dutton, Borengasser, Gaudet, Barbour, & Keely, 2018; Johansson et al., 2014).
It is widely agreed by researchers that there is no level of PAE which is known to be safe for the foetus, at any stage in pregnancy (Ministry of Health, 2010; Subramoney, Eastman, Adnams, Stein, & Donald, 2018). Sellman and Connor (2009) suggest 1–5% of NZ-born children are affected by foetal alcohol spectrum disorders (FASD), and the rate may be rising due to increasing alcohol consumption by young women. However, not all infants with PAE go on to be diagnosed with FASD or more severe foetal alcohol syndrome (FAS). There may be genetic reasons why children have different outcomes from the same exposure, and lifestyle factors have also been implicated (Eberhart & Parnell, 2016; McQuire, Daniel, Hunt, Kemp, & Paranjothy, 2019). May et al. (2013) found that poor maternal nutrition among drinkers was associated with higher rates of FASD. The timing of alcohol exposure may also be important: a foetus may be affected by alcohol consumed before the mother knew she was pregnant, but there is also evidence of harm from alcohol consumed later in the pregnancy (May et al,. 2013; Nykjaer et al., 2014). Even if the infant is not clinically diagnosed with FASD, there may be developmental consequences arising from moderate maternal alcohol intakes (McCormack et al., 2018; Schoeps et al., 2018; Subramoney et al., 2018). Some consequences are discussed below, specifically the effects of PAE on foetal and infant growth, physical coordination, and language development.
Restricted foetal growth (reduced weight, length and head circumference) is one of the diagnostic criteria of FAS, usually associated with heavy alcohol use (Bandoli et al., 2019; Feldman et al., 2012; Little & Wendt, 1991). It is less clear whether restricted foetal growth is associated with light to moderate PAE. Zuccolo et al. (2016) in a large sample found no significant relationship between head circumference and maternal or paternal alcohol before or during pregnancy, and Slavensky and Kesmodel (2018) found no relationship between binge-drinking in early pregnancy and foetal growth. By contrast Myers et al. (2018) report restricted birthweight, head circumference and length, for gestation where the mother had ≥ 2 drinks per week during some trimester of pregnancy. Bandoli et al. (2019) found reduced infant growth for mothers who continued drinking at moderate to high levels during pregnancy, but no significant effect for mothers who reduced their consumption after pregnancy recognition. Growth reduction may be transient: Sampson, Bookstein, Barr, and Streissguth (1994) found PAE associated with infant measures at birth and eight months but not at older ages. The present study contributes some independent data on these issues.
Next, there is evidence of delays in motor skills and language with heavy PAE but less evidence with light PAE. A review by Subramoney et al. (2018) concluded heavy PAE was associated with impaired motor skill development in young children, and other reviews have drawn similar conclusions for older children (Bay & Kesmodel, 2011; Doney et al., 2014). The association is less certain for light to moderate PAE (Hutchinson et al., 2019). A meta-analysis by Flak et al. (2014) found evidence that maternal binge-drinking was associated with impaired cognitive development in young children. Coles et al. (2015) found evidence that nutritional supplementation reduced the ill-effects of PAE on cognitive development of six-month-olds. McGee, Bjorkquist, Riley, and Mattson (2009) found impaired language development in infants who had been heavily exposed to alcohol in utero, but a review by O’Keeffe, Greene, and Kearney (2014) did not find language impairment with low to moderate alcohol exposure. O’Leary et al. (2009, 2010) found a dose-response relationship between alcohol exposure and infants’ behaviour, but the association with language was non-significant. The present study will explore for evidence of delays in reaching physical coordination milestones, and on reduced language development at 18 months.
Methods
Study participants
This report is based on data from a NZ study of maternal nutrition and lifestyle factors and their impact on maternal and infant health outcomes (Watson & McDonald, 2007, 2009, 2010, 2014). The study of pregnancy to six weeks after birth was funded by the NZ Ministry of Health, and a Health Research Council grant permitted infant follow-up to 18 months post-partum. Ethical approval for the study was obtained from the Massey University Human Ethics Committee and the Auckland Ethics Committee. Funders required 500 subjects with selection biased towards including more Maori and Pacific women, and more women of lower socioeconomic status, than in the general population. Subjects lived in rural and urban centres in the upper North Island of NZ. This was a convenience sample: participating clinics throughout the study area distributed information to potential volunteers, who then contacted the organisers.
Subjects were matched to an interviewer of their own ethnicity. Interviewers visited each subject near the start of month 4 and month 7 of pregnancy. In month 4, questionnaires were administered in the subject’s preferred language to determine demographic, medical, health and alcohol consumption details, anthropometric measurements were taken, and the subject’s diet assessed. Health, anthropometric and diet information was again collected in month 7. The same interviewer visited subjects approximately 18 months after delivery, took anthropometric measurements of mother and child, and completed a questionnaire to determine details of infant health and development. Not all subjects agreed to take part in the follow-up study, and others were untraceable. This article is based on data from 504 women, and the 370 who were followed up. Multiple births were omitted; there were no other exclusions.
Measures
Maternal height and weight were measured using calibrated standard equipment and procedures Gibson (2005). Ethnicity was classified as Maori, or Pacific (Tongan, Cook Island, Samoan, Nieuan, Fijian), and everyone else was included in the European/other category (97% European, 3% other). Education was assessed both by years of post-primary schooling and by type of post-school education (on-the-job, polytechnic/other, university). Socioeconomic status was represented by categorising either the woman’s full-time occupation, or her partner’s full-time occupation if she was not employed full time (only 56% of women were in full-time work); or she was categorised as benefit-only if neither she nor her partner (if any) were employed full time and the woman was dependent on government welfare payments for basic living expenses. Full-time occupation was further grouped as higher (managers, professionals, technicians, associate professions) or lower (clerks, tradespeople, manual occupations, etc.). Smoking was classified as yes/no and further quantified as none, < 5, 5–10, and > 10 cigarettes per day.
In the month 4 questionnaire women were asked about their alcohol consumption (if any) before pregnancy, and during pregnancy (categories non-drinker/drinker before; and non-drinker/stopped/continuing drinker during pregnancy). Drinkers were shown models to help gauge the volume of alcoholic drinks consumed. The beverages most frequently consumed, usual volume, usual time to drink this amount (in hours), and frequency of drinking occasion (closest answer from: ≤ once/month, 2–3 times/month, weekly, 2–3 times/week, most days) were recorded. Assuming the average amount of alcohol in NZ beer is 0.035 g/ml, in wine/cooler is 0.095 g/ml and spirits 0.33 g/ml (Health Promotion Agency, 2016) the total grams of alcohol consumed by subjects in a typical drinking session before and during pregnancy was calculated. Note alcohol consumption in NZ is commonly expressed in terms of “standard drinks” consisting of 10 g of alcohol, similar to the amount in one 330 ml can of beer at 0.035 g/ml or 80 ml of table wine at 12.5 g/ml or one 30 ml shot of spirits.
Binge-drinking or heavy episodic drinking has been variously defined as consuming 4–7 or more standard drinks per drinking occasion (Cooper, Petherick, & Wright, 2013; Foltran, Gregori, Franchin, Verduci, & Giovannini, 2011; Kelly et al., 2009; Marchetta et al., 2012; O’Callaghan, O’Callaghan, Najman, Williams, & Bor, 2003; Parackal et al., 2013; Streissguth, Barr, Sampson, Bookstein, & Darby, 1989). For this article we define binge-drinking as ≥ 5 standard drinks per drinking session.
The possible moderating effect of nutrition on alcohol intake is represented in this article by log(energy) intake from diet (excluding alcohol). Most nutrients are strongly correlated with energy intake, so it provides a one-variable surrogate for nutritional adequacy. Energy intake was assessed in both month 4 and month 7 by an interviewer-administered 24-hour dietary recall using food models, followed by a three-day food record kept by the subject. Mean maternal energy intake was calculated from these eight days of dietary data, using Foodworks (Xyris Software, Australia, Pty Ltd). More details on nutrient intakes are included in Watson and McDonald (2009).
The follow-up interviews to ascertain infant development details took place at a mean 18.1 months (SD = 3.8 months; first quartile 15.4, third quartile 20.9 months). Gestation length was calculated from the last date of menstruation until birth. Infant growth at follow-up was measured by weight, head circumference, length, and upper arm circumference: weight was measured by the difference between the mother’s weight holding and not holding the child, length in a custom-made box with sliding foot, and head circumference with an insertion tape. Infant weight, head circumference and length at younger ages were obtained from the “Baby’s Health and Development Book”. This book is provided by the NZ child welfare service Plunket, and development figures are recorded by paediatric nurses when infants are taken to free child health clinics. As infant ages did not always match the intended variables (e.g., weight at 45 days), Plunket data were used if available within 14 days of the target age; otherwise the variable was set as missing.
Physical coordination and movement were measured by the age in months at which the infant achieved certain milestones, being able to: sit without support, crawl, stand with support, stand without support, take a few steps, and be well balanced while standing/walking (if achieved). Milestone age was as recorded by the paediatric nurse or if definitively stated by the mother/caregiver. Verbal development was measured by age at first word, in months, and by the number of words the baby could say at the age of the interview, as volunteered by the mother/caregiver. Sometimes mothers listed the actual words, especially for children under 15 months, but other mothers estimated numbers (for example “at least 20”, “about 50”) and/or stated the child was putting words together or speaking full sentences in the case of older children. Since some data for older children was imprecise, verbal development was considered using several measures: log(minimum number of words stated), or; whether or not the child was speaking at least 20 words, or; whether or not the child was putting words together.
Statistical analysis
Data were analysed using the package Minitab (Minitab LLC, Pennsylvania, USA). Statistical analysis relating to infant development was restricted to the 370 subjects for whom we had follow-up data. For some variables, missing data reduced this sample size further, and the maximum available data were used for each relationship studied. For data collected about the mother (age, weight, height, occupation group, ethnicity, parity, smoking, alcohol and energy intakes) hypothesis tests were performed for whether the followed-up subset was a biased sample compared to the full dataset. Continuous measures such as age were compared using independent samples t-tests (for followed-up vs not followed up) and category variables such as occupation group were tested for independence to follow-up status by Chi-square test. Statistical significance was assessed as p < 0.05.
Continuous measures such as infant birthweight were compared across category variables such as drinker category (non-drinker, stopped drinker, continuing drinker during pregnancy) using the one-way ANOVA, or the Kruskal-Wallis test in the case of skewed data. Relationships between category measures (such as occupation group and drinker category) were assessed using Chi-square tests. Possible bivariate relationships between numeric measures (such as between log(number of words) and log(1+ g alcohol)) were assessed by linear regression, or spearman correlation.
Bivariate relationships may, however, be partially due to confounding variables. For example, infant head circumference may depend not only on PAE but on the exact infant age when measured, and possibly on: gender, maternal anthropometric measures, length of gestation, length of breastfeeding, ethnicity, occupation group, smoking, and log(energy) intake during pregnancy. Many other potential confounders (such as body mass index (BMI), parity and education) were also considered but ultimately not adjusted for, as they were non-significant and there were too many potential confounders to adjust for them all. The analysis was adjusted for the potential effect of confounders by including them as predictors in a multiple linear regression model of each infant measure against alcohol intake. If a confounder was significant for any infant measure it was used in all linear regressions. If the regression coefficient relating an infant measure at a particular age to the log(1+ g usual alcohol intake per session before pregnancy) was significant in a model including confounders, then this was taken as evidence the association was not explained by the confounders.
Similarly, binary logistic regression was used to find significant associations between binary infant outcomes (the infant saying over 20 words; or infant saying two or more word combinations) with log(1+ g alcohol intake) when significant confounders were included in the regression (the sample size was too small to adjust for non-significant confounders). We also hypothesised that the effect of increasing log(energy) intake on infant measures may differ, depending on alcohol intake, and this was explored in both linear and logistic regression models by allowing for an interaction between energy and alcohol intakes.
Results
Women lost to follow-up were younger on average (29.5 vs 31.4 years, t-test p = 0.001), more likely to be Maori or Pacific (Chi-square p = 0.001) and more likely to be dependent on government welfare as their only source of income (Chi-square p = 0.001). There were no significant differences between those followed up or lost to follow-up in: maternal weight, height, BMI, parity, household size, smoking, log(energy) intake, drinking category (non-drinker, stopped or continuing), g alcohol intake per drinking session pre-pregnancy or during pregnancy, or frequency of drinking session.
Maternal drinking categories
Subjects were divided into three categories according to their alcohol consumption habits during pregnancy: those who never drank (19%); those who stopped drinking when they knew they were pregnant (53%); and those who continued to drink during pregnancy (29%). Table 1 shows some anthropometric, demographic, energy and alcohol intake details for all mothers, and mothers with follow-up data, in these categories. There were significant differences between drinking categories for: maternal age, weight at month 4, weight gain from month 4 to month 7, ethnicity, number of children, household size, and mean alcohol intake per session before pregnancy. Drinking categories did not differ significantly for height, occupation group, post-school education, smoking (yes/no), energy intake from diet, and breastfeeding for at least two months. There were also no significant differences in years of schooling, numbers of cigarettes smoked, or rural vs urban location (not shown in table). To be specific, each drinking category had distinct anthropometric and demographic characteristics. Non-drinkers were heavier, were more likely to be married, had more children, lived in larger households, and were more likely to be of Pacific ethnicity. Women who stopped drinking during pregnancy were the lightest at month 4, gained the most weight during pregnancy, had fewer children and the smallest household size. Those who continued to drink during pregnancy were older, had the lowest weight gain, and were least likely to be Pacific. Usual alcohol consumption before pregnancy was lower in women who stopped drinking during pregnancy. Most Pacific mothers did not drink. Maori mothers consumed the most alcohol, followed by a small number of Pacific drinkers, then European/other.
Anthropometric and demographic details of all mothers, and mothers with birth outcome data according to their drinking status.
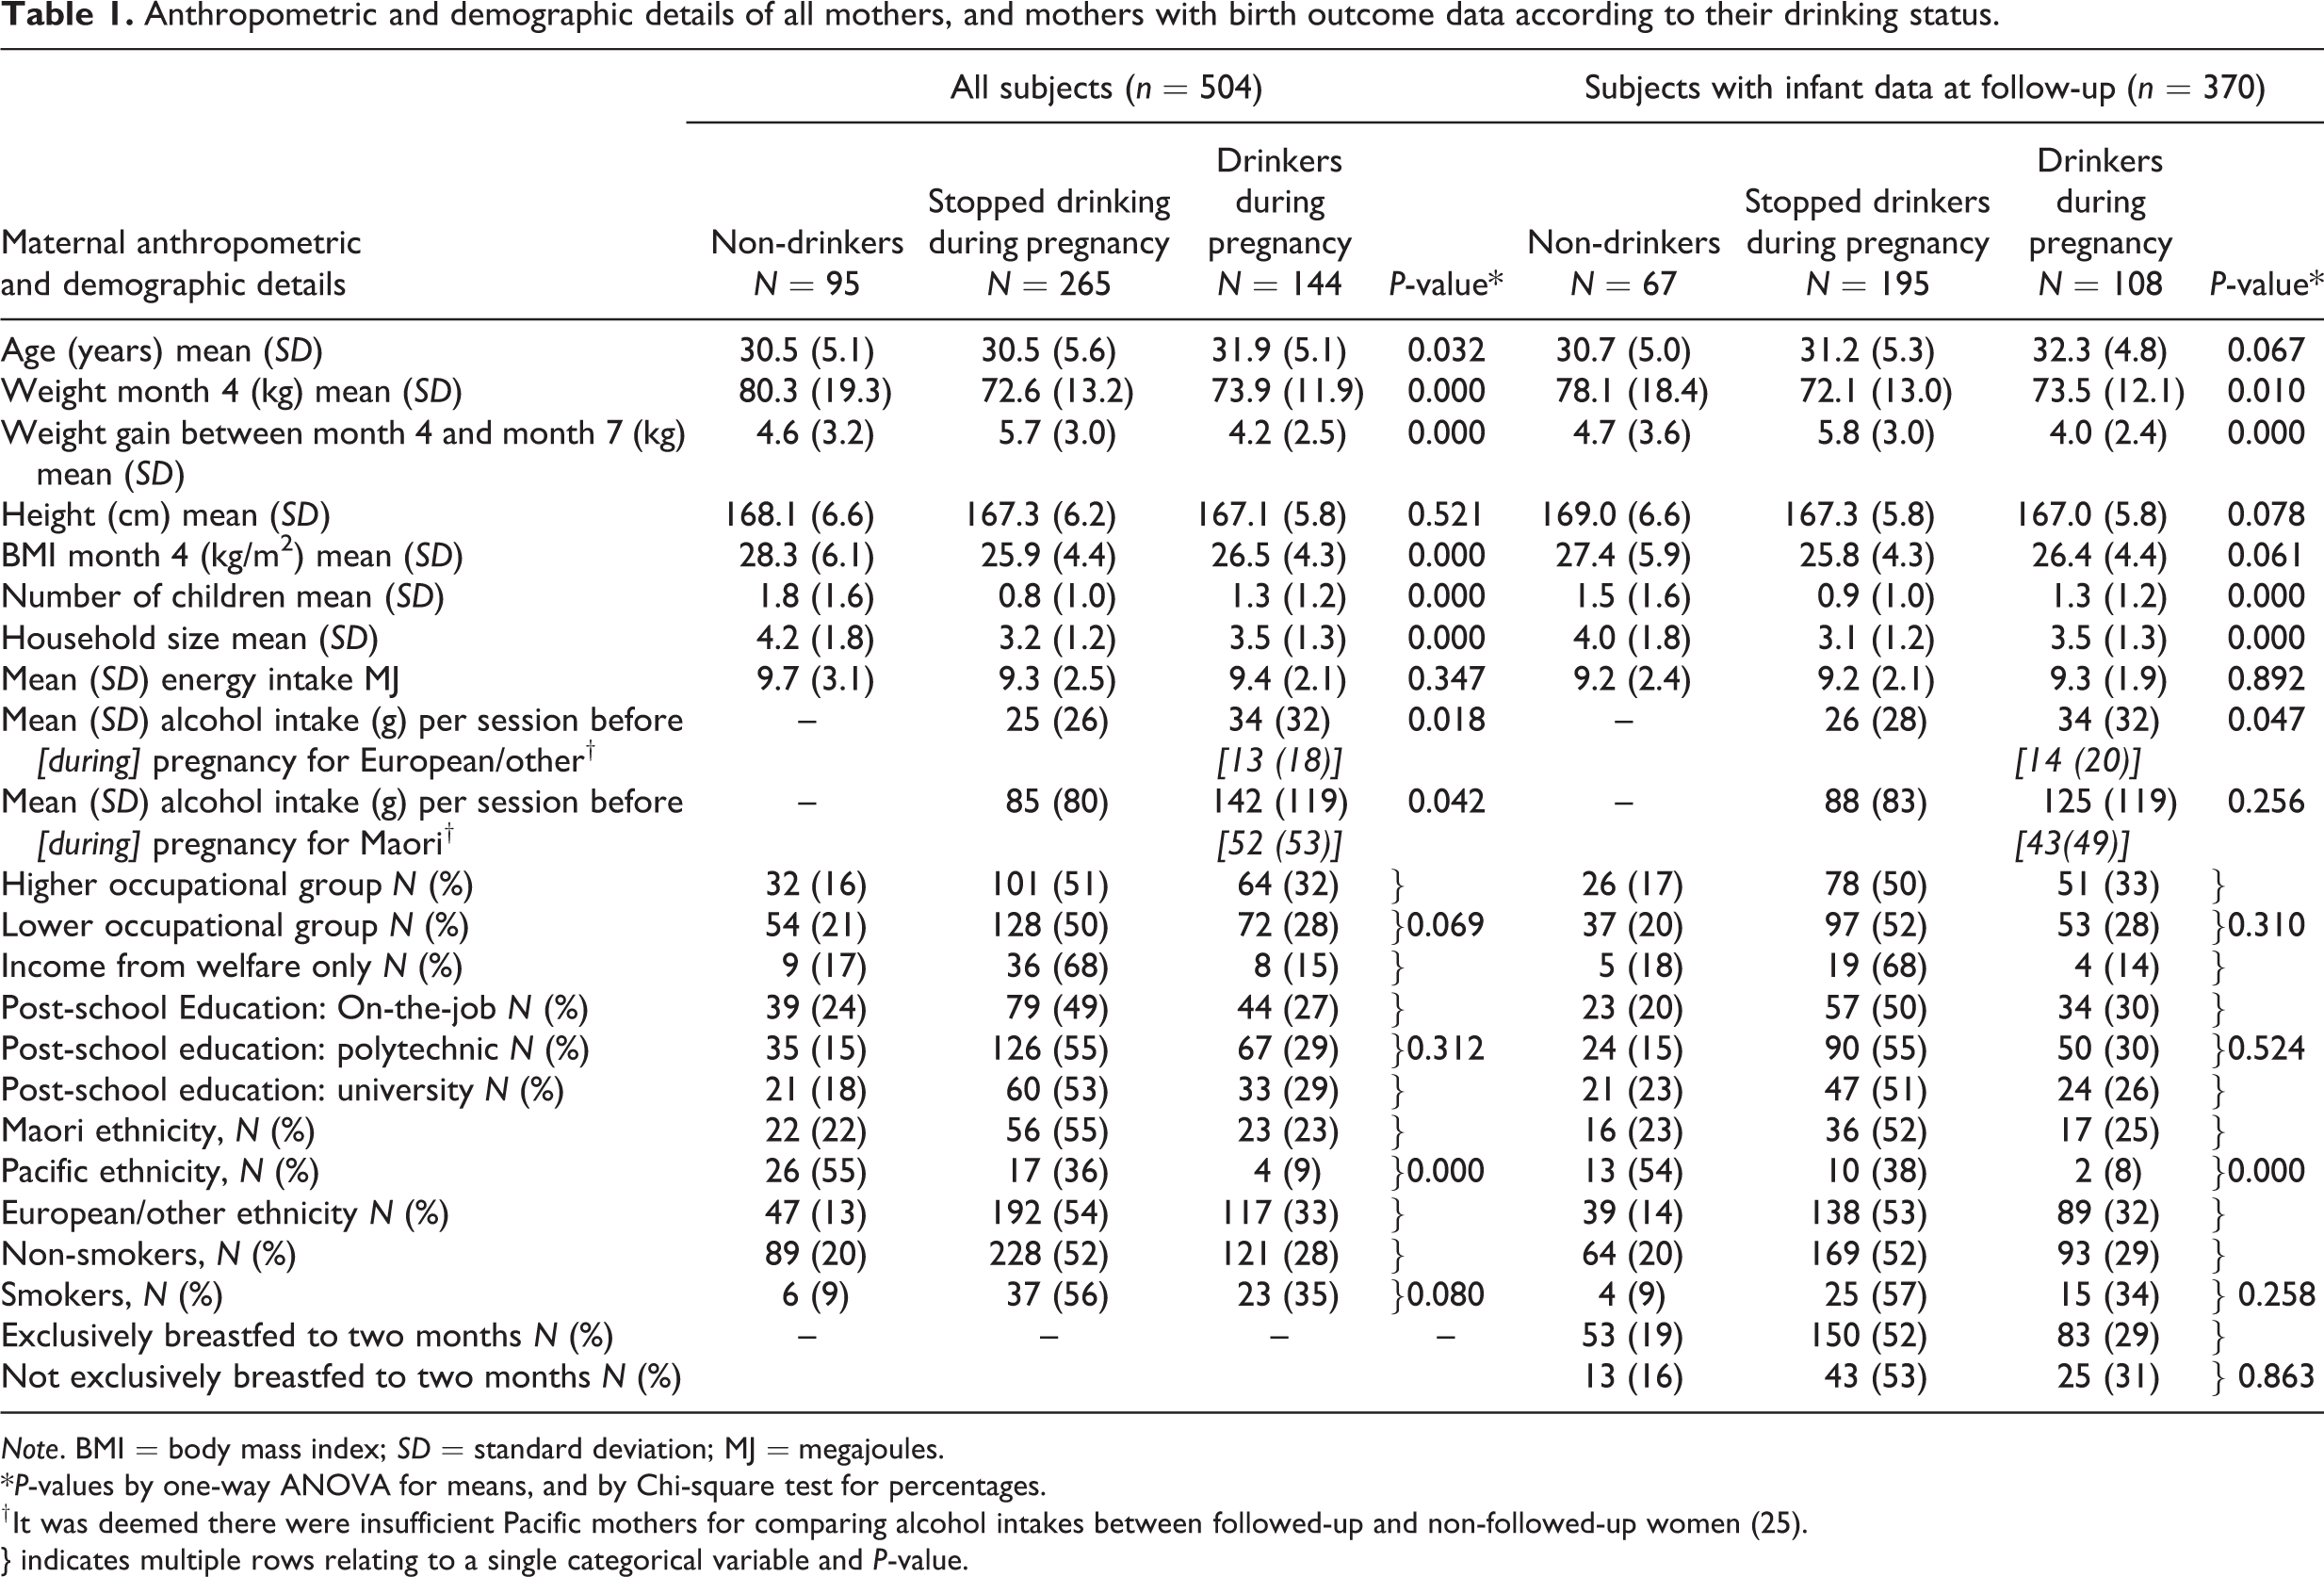
Note. BMI = body mass index; SD = standard deviation; MJ = megajoules.
*P-values by one-way ANOVA for means, and by Chi-square test for percentages.
† It was deemed there were insufficient Pacific mothers for comparing alcohol intakes between followed-up and non-followed-up women (25).
} indicates multiple rows relating to a single categorical variable and P-value.
Table 2(a) shows basic data about the frequency of alcohol consumption, usual amount of alcohol consumed in a drinking session before and during pregnancy, and the BMI at month 4 of pregnancy, divided according to frequency of drinking sessions before pregnancy. Amongst drinkers before pregnancy, the median usual consumption was two standard drinks per drinking session, dropping to one drink per session when the women knew they were pregnant, irrespective of how frequent the drinking sessions were. For those consuming median intakes of alcohol before pregnancy, the alcohol provided an estimated additional 0.9 megajoules (MJ) of energy per week, above what was measured by food intake. For drinkers at the 75th and 90th percentiles of g alcohol intake, the alcohol provided an estimated additional 2.4 MJ and 5.3 MJ of energy respectively per week. Amongst the drinkers there was a relationship between high BMI at month 4 of pregnancy and frequency of drinking per week before pregnancy. Specifically, within each frequency group we ascertained the 75th and 90th percentile of BMI. These are shown in Table 2(a), and the BMI percentiles were significantly higher among the more frequent drinkers (Spearman correlation = 1.0 for both percentiles versus frequency of drinking session per week; Pearson correlation 0.989 (p = 0.001) for 75th percentile, and 0.998 (p < 0.001) for 95th percentile vs frequency of drinking: see Figure 1). In other ways of looking at it: the percentage of women who were clinically obese at month 4 rose from 10% for those drinking < once a month to 20% for daily drinkers (p = 0.039); and a regression of BMI at month 4 against usual pre-pregnancy g alcohol remained significant (p = 0.048) even after adjusting for log(energy) from food (p = 0.021) and for ethnicity (p = 0.001). Results were similar for BMI at month 7.
Alcohol consumption before and during pregnancy.
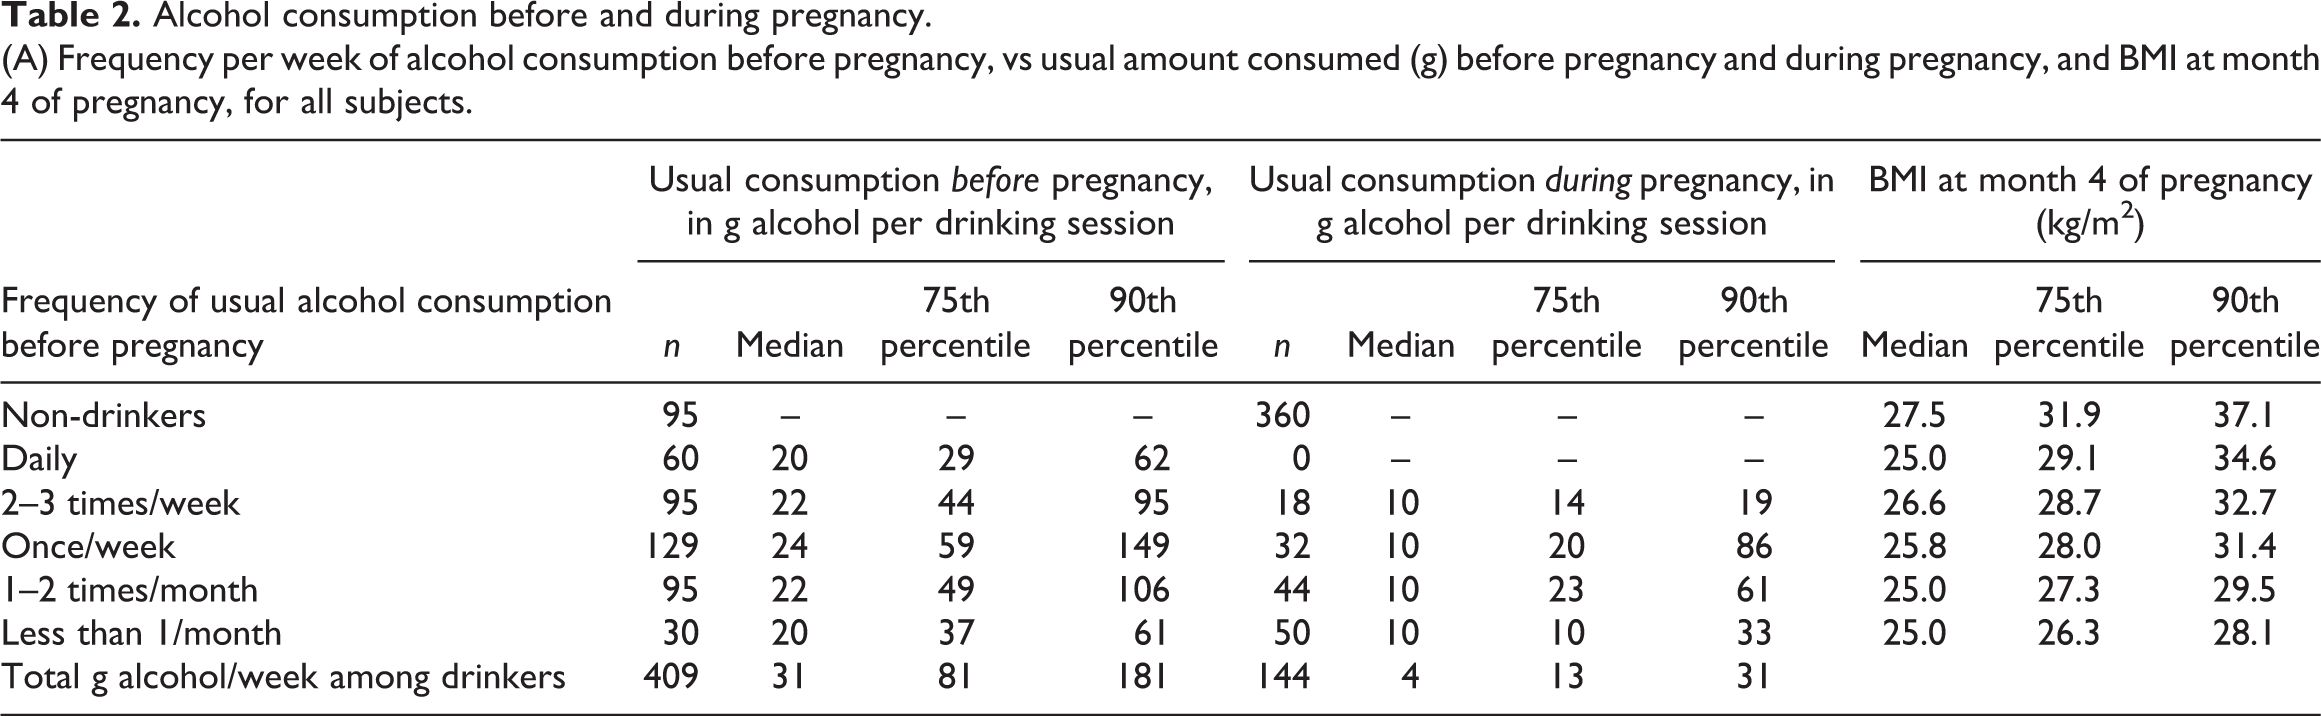
Note. BMI = body mass index; SD = standard deviation.
* One standard drink in New Zealand is defined as a drink containing 10 g alcohol.
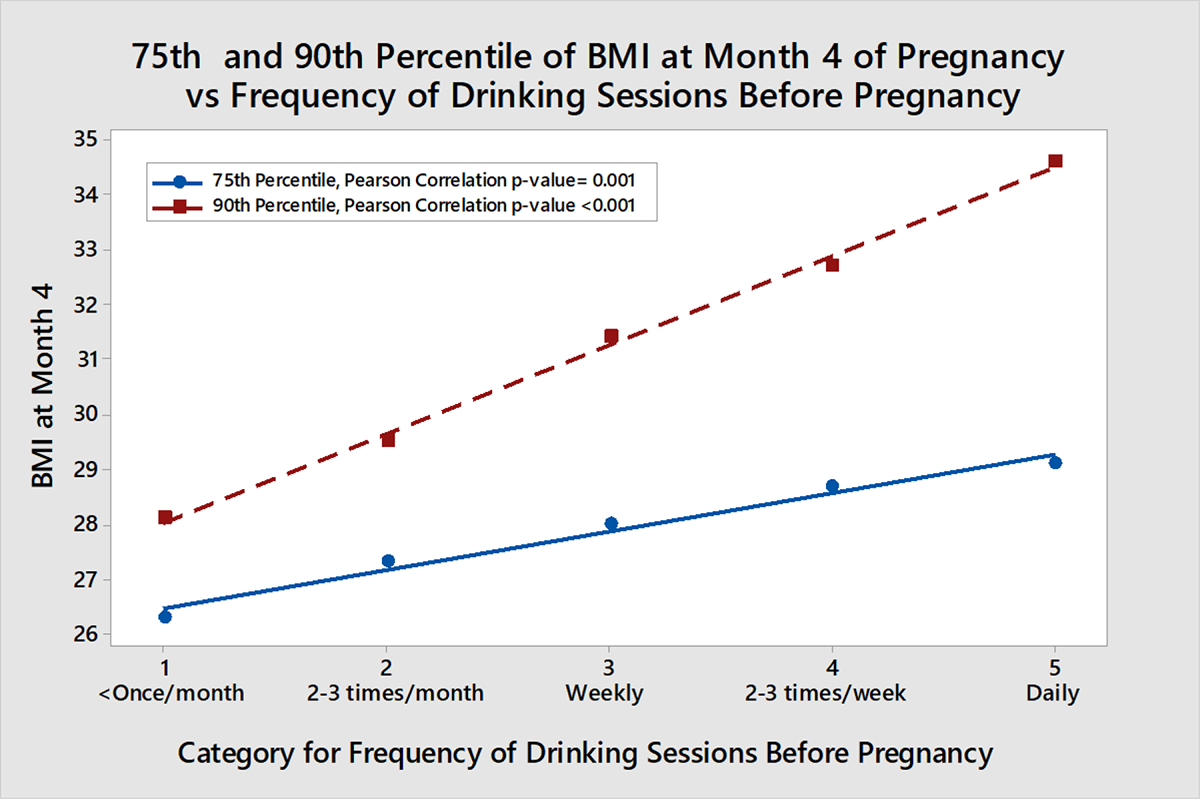
Relationship between frequency of drinking session before pregnancy and the 75th and 90th percentile, for the frequency group, of BMI at month 4 of pregnancy. Drinking frequency group sizes from left 30, 95, 129, 95, 60.
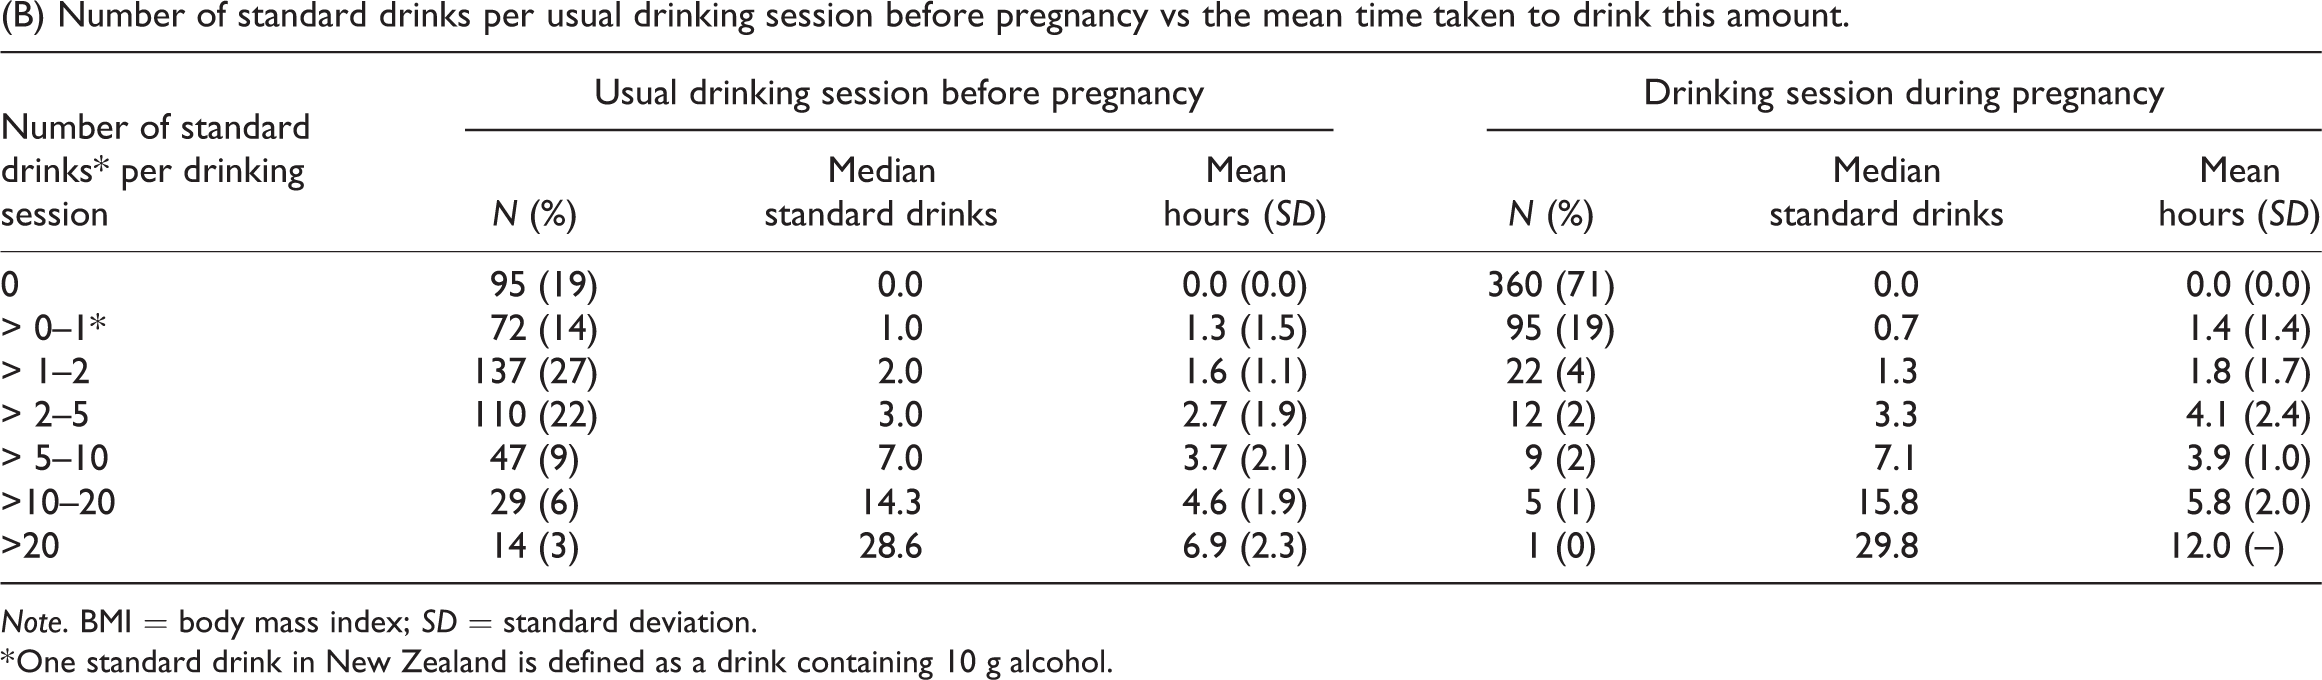
Table 2(b) shows the median number of standard drinks per drinking session before and during pregnancy and the mean time taken to drink this amount. Further analysis showed that the light drinkers (up to two standard drinks per drinking session before pregnancy): were older (median 33 years); more likely to have been in the higher occupation group (50%) and to be married (84%); less likely to be supported by welfare (2%) and to smoke (3%); with 59% of European/other women drinkers, 43% of Pacific women, and 21% of Maori women in this category. By contrast the heavier drinkers (10 or more standard drinks per drinking session) were younger (median 25 years, p < 0.001); less likely to be in the higher occupation group (16%, p < 0.001) or be married (37%, p < 0.001); more likely to be on welfare (30%, p < 0.001) and to smoke (60%, p < 0.001). Only 2% of European/other women drinkers, 19% of Pacific women, and 38% of Maori women were in this group (p < 0.001).
We found 22% of drinkers binge drank (five or more standard drinks per drinking occasion) before pregnancy and 10% during pregnancy. It is generally considered that it takes one hour for the liver to metabolise the alcohol in one standard drink (Health Promotion Agency, 2016). Table 2(b) shows that, pre-pregnancy, the alcohol in up to five standard drinks (median three drinks, mean 2.7 hours) would be mostly metabolised by the end of the drinking session. However, for those having > 5–10 drinks (median seven drinks, mean 3.7 hours), it would take over three hours on average to clear the alcohol after drinking ceased. Those drinking > 10–20 drinks would take a mean 8.3 hours (SD = 3.2) to clear the alcohol and for those drinking > 20 drinks the mean time to clear the alcohol was 21.1 hours (SD = 4.9) from an hour after drinking ended. So if usual drinking habits continue until pregnancy recognition, which may be several weeks after conception (Parackal et al., 2013), the foetus could be exposed to damaging levels of alcohol for hours, even after their mother ceased to drink. Since there may be more than one drinking session per week, this could multiply into many hours of alcohol exposure per week.
Infant growth
Mean infant weight, length, and head circumference at birth, at 45, 90, 270, 450 days and at follow-up are shown in Table 3 for mothers who drank alcohol before pregnancy, and those who did not drink. These measures were mostly lower in infants born to mothers who usually drank alcohol before pregnancy, though the difference was not always significant. Table 3 also shows the association between the measures and per-session g alcohol consumed before pregnancy and during pregnancy after adjusting for these significant confounders in multiple regression: gestational age, infant age at measurement, gender, ethnicity, exclusive breastfeeding to two months, mother’s weight and height, maternal smoking, and whether or not the woman was a non-drinker before she knew was pregnant. Few women smoked (13%), and smoking during pregnancy was not significant for any of the measures. The coefficients for g alcohol consumed per session either before pregnancy or during pregnancy were mostly negative (though not often significant) suggesting that alcohol consumed before and during pregnancy could have a negative effect on growth. Further calculations implied that alcohol consumption during pregnancy had the stronger effect. For example, the estimated effect on infants aged 90 days, for 50 g alcohol consumed per drinking session before pregnancy was that infants weighed an estimated 0.05 kg less, were 0.3 cm shorter, and had head circumferences 0.2 cm smaller than those with zero intake. By contrast, infants of mothers who drank 50 g alcohol per session during pregnancy weighed an estimated 0.45 kg less, were 0.9 cm shorter and had a head circumference 0.2 cm smaller than with zero intake during pregnancy. By follow-up (mean 547 days) this effect had disappeared.
Measurement trends for weight, length, head circumference and upper-arm circumference between birth and follow-up at 18 months, in infants born to usual drinkers and non-drinkers before pregnancy, and association with g alcohol consumed before and during pregnancy.
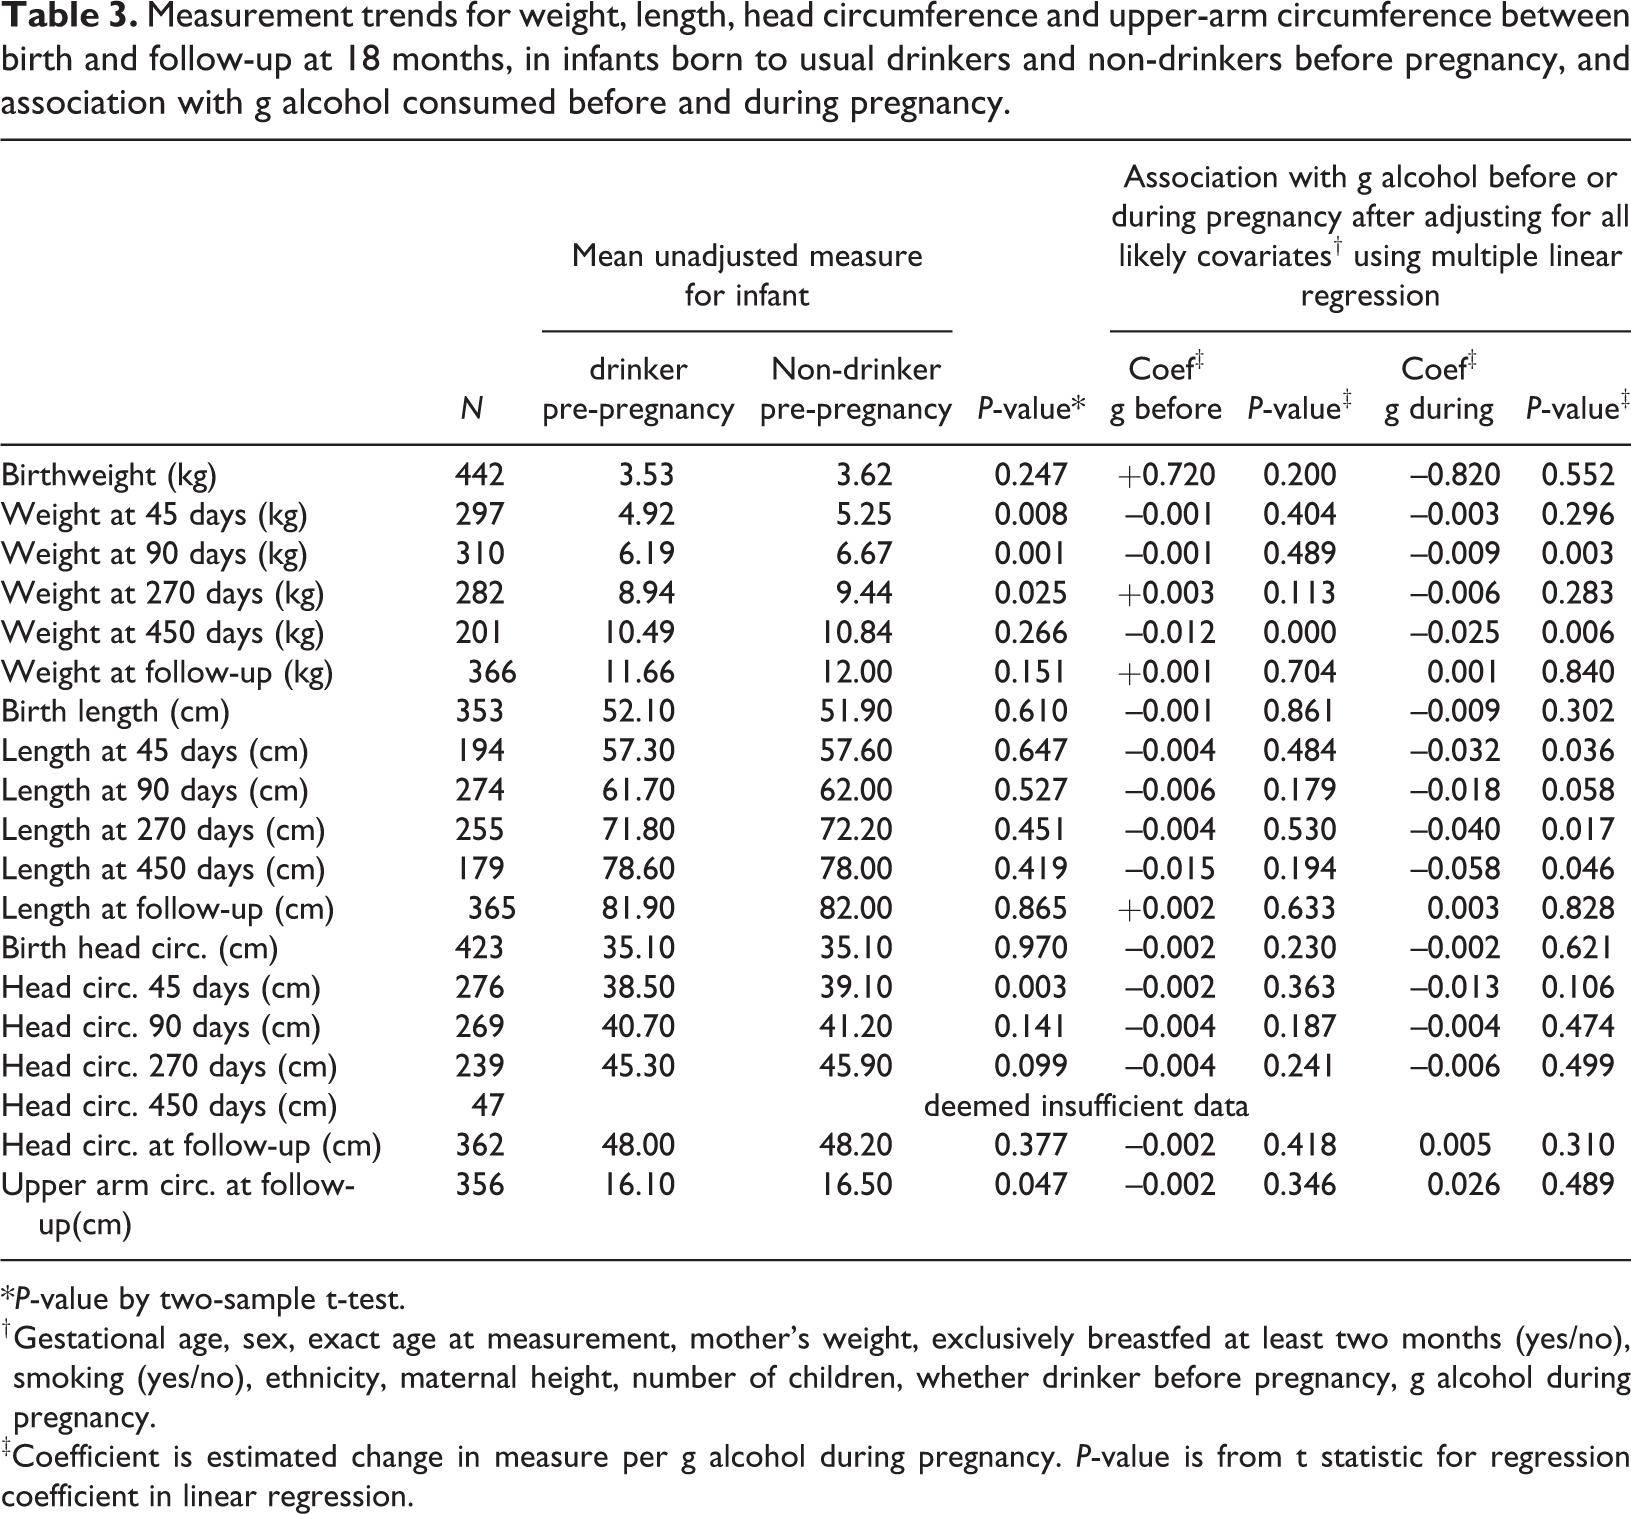
*P-value by two-sample t-test.
† Gestational age, sex, exact age at measurement, mother’s weight, exclusively breastfed at least two months (yes/no), smoking (yes/no), ethnicity, maternal height, number of children, whether drinker before pregnancy, g alcohol during pregnancy.
‡Coefficient is estimated change in measure per g alcohol during pregnancy. P-value is from t statistic for regression coefficient in linear regression.
Infant coordination and language development
We investigated, using the Kruskal-Wallis test, whether there was any association between drinking behaviour category (non-drinker, drinker stopped during pregnancy, continuing drinker during pregnancy) and physical coordination milestones. There were no significant differences in median age between these groups for: sitting (median six months, p = 0.344), crawling (median eight months, p = 0.641), standing without support (median 11 months, p = 0.767), or walking well (median 13 months, p = 0.757), and the median age at first word was 10 months for non-drinkers versus nine months for stopped and continuing drinkers (p = 0.836). Similarly, there was no significant correlation between age at these milestones and g alcohol consumption in a drinking session, either before or during pregnancy.
There was a significant association between the probability of a child saying more than 20 words at follow-up, and maternal drinking before pregnancy (Chi-square test, p = 0.010). If the mother was a non-drinker, only 23% (15/65) of non-drinkers’ infants spoke more than 20 words at follow-up; this rate increased to 38% (88/233) for infants of mothers drinking up to 50 g alcohol per session before pregnancy, but was only 21% (12/58) for infants whose mothers drank more than 50 g per session. To help visualise these effects, Figure 2 shows the percentage of infants saying over 20 words versus the pre-pregnancy drinking by the mother (categorised as non-drinker, < 25 g, 25–49 g, 50–99 g, ≥ 100 g per drinking session). Using this categorisation the probability of saying over 20 words decreases with increasing alcohol intake (Chi-square p = 0.042). The non-drinking group had different characteristics to those that drank, which may partly explain the slower infant speech development (Table 1).
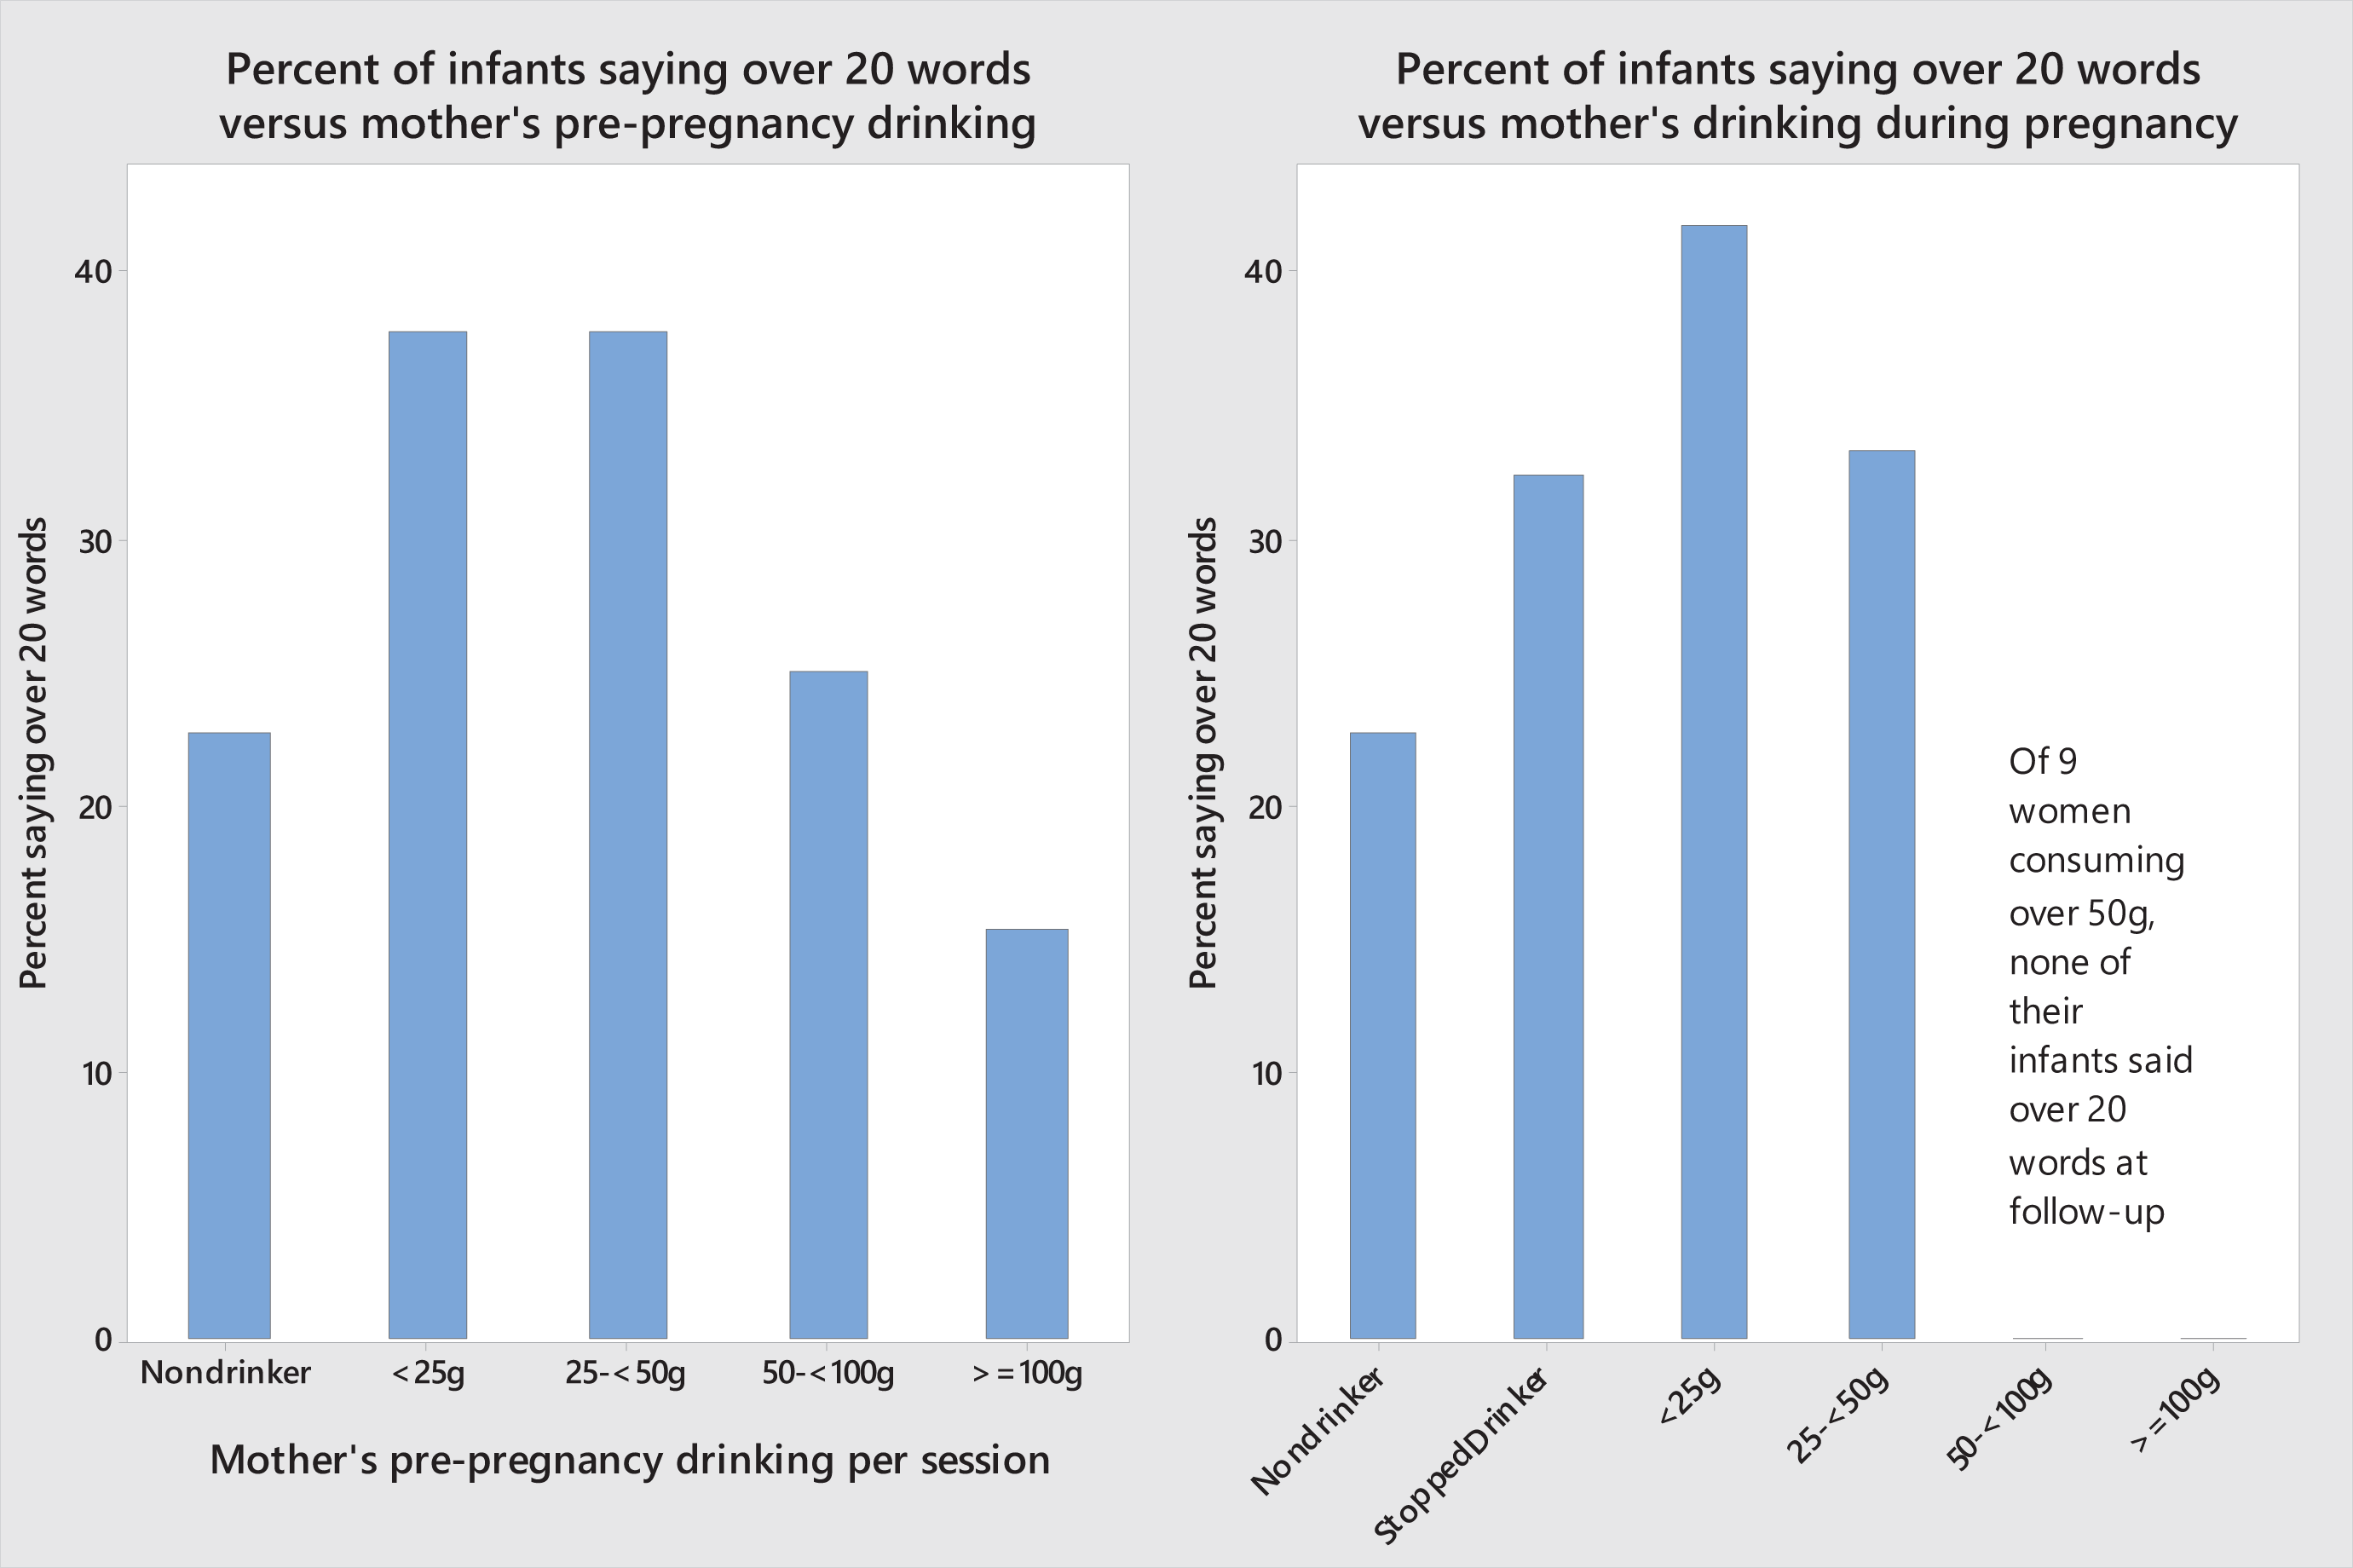
Percentage of infants saying over 20 words at 18 months vs g maternal alcohol per session before pregnancy and during pregnancy; percentages out of each drinking group; group sizes (pre-pregnancy) 65, 180, 53, 32, 26. Chi-square test for independence, p-value = 0.042; (during pregnancy) 65, 185, 91, 6, 7, 2. Chi-square p-value = 0.032 (with last two categories combined).
Figure 2 also shows the percentage of infants saying over 20 words at follow-up versus the mothers’ alcohol consumption after pregnancy recognition. Again, the percentage is not independent of alcohol category (Chi-square p = 0.032). There were few women in the high-consumption categories, which were combined for the Chi-square test. We did not find any evidence that stopping drinking was positively associated with vocal ability to 18 months, compared to continued light drinking during pregnancy. On the contrary fewer infants of stopped drinkers (33%) (62/187) spoke over 20 words compared to 42% (38/91) of infants of light drinkers (up to 2.5 standard drinks per drinking session); but the difference was non-significant (p = 0.166). We could not find any confounding variables to explain the lower percentage for stopped drinkers.
Two or more (2+) word combinations were used by 81 infants at follow-up. Specifically, infants born to 14% (9/65) of non-drinkers were using 2+ word combinations at follow-up, as compared to 27% (63/234) of infants whose mothers drank < 50 g alcohol per session before pregnancy, and 16% (9/58) for infants whose mothers drank ≥ 50 g per session (Chi-square p = 0.030). In a logistic regression model, being a non-drinker (p = 0.006) and log(1+ g alcohol pre-pregnancy) (p = 0.049) were both negatively related to the odds of using 2+ word combinations. The log(1+ g alcohol during pregnancy) was not significant (p = 0.196), nor was it significant whether the mother stopped drinking (p = 0.733). A linear regression found log(number of words) was negatively related to being a non-drinker (p = 0.048) and negatively but not significantly to log(1+ g alcohol pre-pregnancy) (p = 0.471) without adjusting for confounders.
Moderating effect of diet and other confounders
We investigated the possibility that some of the association of infant vocal ability with pre-pregnancy maternal alcohol intake might be moderated by confounders including energy intake from food and non-alcoholic beverages. There was no significant difference in mean energy intakes between month 4 and month 7 (mean difference was 0.2 MJ, p = 0.171), so the overall mean over both months was used. There was no significant difference in mean energy intakes for non-drinkers (9.7 MJ), drinkers who stopped at pregnancy recognition (9.3 MJ) and continuing drinkers (9.4 MJ, p = 0.347). In the regressions that follow, log(energy) and log(1+ g alcohol) have been standardised to avoid multicollinearity.
Using binary logistic regression, the significant predictors of a child saying over 20 words at follow-up were: (positive association) exact infant age at interview (p < 0.001) and log(energy) (p = 0.014); (negative associations) number of other children in household (p = 0.015), Maori (p = 0.037) or Pacific ethnicity (p = 0.021), mother being a non-drinker (p = 0.021), and log(1+ g alcohol pre-pregnancy) (p = 0.063). There was also an interaction of log(energy) and log(1+ g alcohol pre-pregnancy) (p = 0.010). We suggest the following interpretation of the interaction. The odds of the infant speaking over 20 words: increased with log(1+ g alcohol) if the mother was in the first quartile of energy intake (< 7900 kilojoules (kJ) per day); was unrelated to g alcohol if she was in the second quartile of energy intake (7900–9300 kJ per day); and decreased with log(1+ g alcohol) for those with above-median energy intake. Looking at it the other way, for non-drinkers or women who consumed < 50 g alcohol per drinking session, the odds of the infant speaking over 20 words increased with log(energy); for those consuming 50–100 g per session the odds were unrelated to log(energy); and for those consuming over 100 g alcohol per session the odds of speaking over 20 words decreased with increasing log(energy). We also considered log(1+ g alcohol during pregnancy) (zero if stopped or non-drinker), and a measure of pre-pregnancy weekly alcohol exposure time: the product of pre-pregnancy frequency of drinking session per week and the number of standard drinks per session (that is, allowing for one hour clearance per standard drink). When added to the model, alcohol exposure time was significant (p = 0.039) but being a non-drinker ceased to be significant (p = 0.256); log(1+ g alcohol during pregnancy) was not significant (p = 0.059).
Again using logistic regression, the odds of 2+ word combinations depended positively on exact age (p < 0.001) and log(energy) (p = 0.079); negatively on number of other children (p = 0.044), mother a non-drinker (p = 0.009) and log(1+ g alcohol pre-pregnancy) (p = 0.047); negatively but non-significantly on Maori (p = 0.206) or Pacific (p = 0.193) ethnicity; and on the interaction (p = 0.020) of log(energy) with log(1+ g alcohol pre-pregnancy), with a similar interpretation as above. The alcohol exposure time variable was not significant (p = 0.101), nor was log(1+ g alcohol during pregnancy) (p = 0.083).
A linear regression found that the log(number of words) was significantly positively associated with exact age (p < 0.001), exclusive breastfeeding for at least two months (p = 0.033), and being a non-drinker (p = 0.087). It was positively associated with log(energy) (p = 0.024) if the pre-pregnancy alcohol was < 70 g or the woman was a non-drinker. However, log(number of words) was negatively associated with log(energy) (p < 0.001) if the pre-pregnancy alcohol was ≥ 70 g. This tipping point of 70 g was estimated using non-linear regression as the most significant position for a tipping point; log(number of words) was related to Pacific ethnicity (p = 0.009) but not to number of other children (p = 0.205). Figure 3 illustrates the relationship between log(energy) and log(number words) after the latter was adjusted for confounders: the log(number of words) increased with increasing maternal energy intake for non-drinkers, and for drinkers of < 70 g per drinking session pre-pregnancy, but declined with log(energy) for mothers drinking ≥ 70 g per session. We interpret this as showing that at this level of alcohol intake, energy intake could no longer counteract the negative effect of alcohol. We found no association between log(number of words), energy, and alcohol intake during pregnancy, or whether or not the woman stopped drinking (p = 0.503). However, among drinkers whose energy intake was less than the median (9.3 MJ) there was a marginal negative association between log(number of words) and log(1+ g alcohol during pregnancy) (p = 0.074). Weekly alcohol exposure duration did not add significantly to the model (p = 0.884).
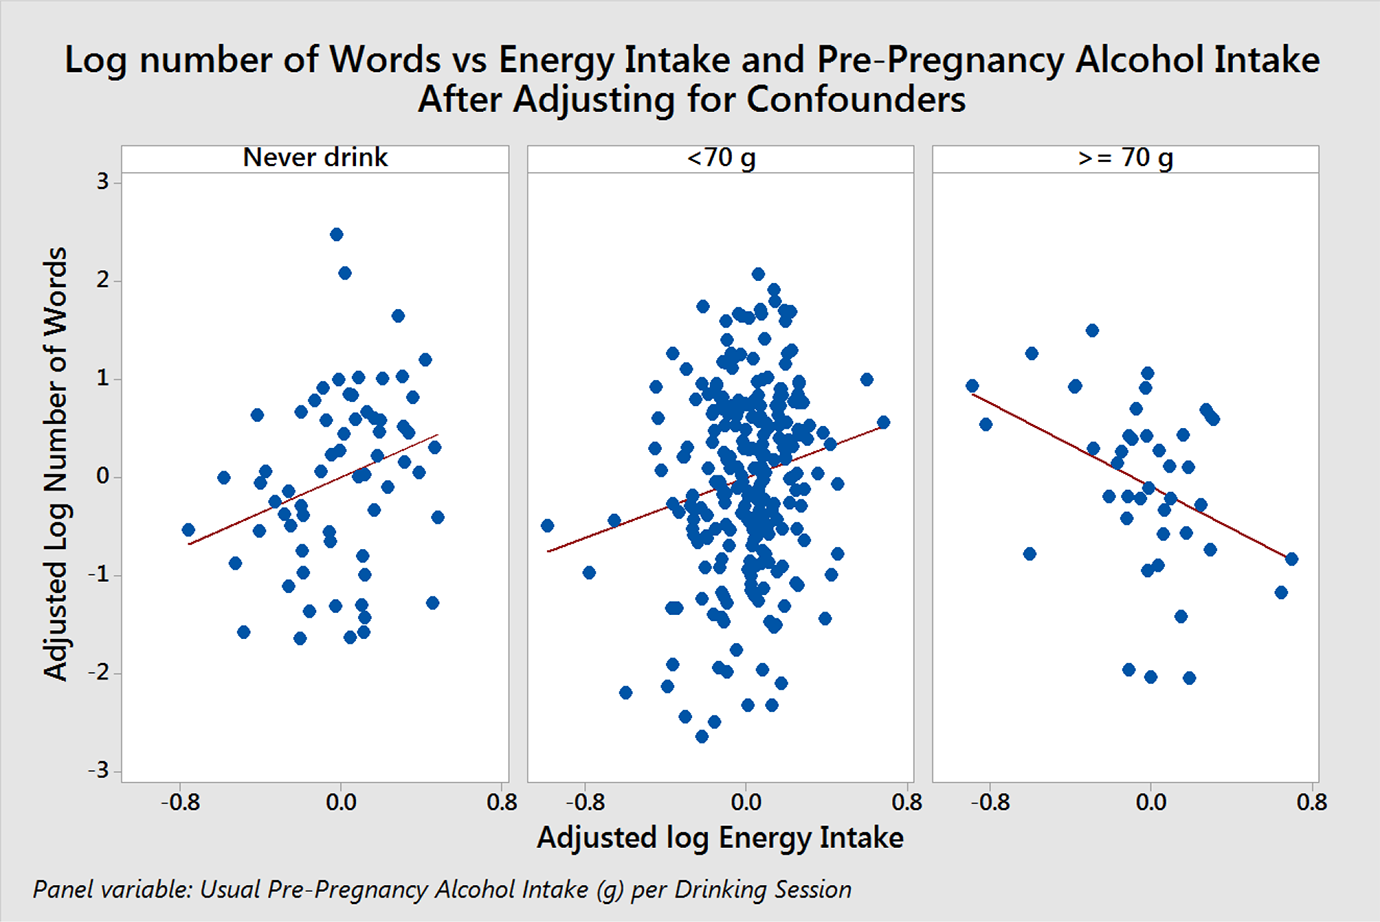
Log number of words at 18-month follow-up vs energy intake and pre-pregnancy alcohol intake (p < 0.001 for change in slope).
Discussion
Maternal characteristics
The drinking patterns shown in our data were within the range reported in other New Zealand studies (Connor & Casswell, 2012; Mallard et al., 2013; McLeod et al., 2002; Ministry of Health, 2009; Parackal et al., 2013; Rossen et al., 2018; Superu, 2015). Our results show frequent drinking may contribute to obesity. Mannisto, Uusitalo, Roos, Fogelholm, and Pietinen (1997) similarly found frequent drinking may contribute to obesity. However, in our study the highest median BMI occurred in the non-drinking group, and could be attributed to ethnic and cultural differences stemming from the higher percentage of Pacific women in this group (Ministry of Health, 2015).
Binge-drinking
Mallard et al. (2013) reported 20% of New Zealand mothers binge drank > 4 standard drinks at least weekly before, and 12% during, pregnancy. Our percentages were similar. The results on blood alcohol clearance time show that a foetus could be exposed to alcohol for several hours even after its mother finished a drinking session. Future researchers may find it useful to consider total weekly alcohol exposure time, as well as quantity of alcohol consumed in a drinking session.
Infant growth
Our results found some indications of reduced growth, but these were not always significant. Similar variable results have been found in other studies reporting the effect of low to moderate alcohol intakes on infant measures: in some studies, smaller infant measures were reported for children of drinkers (Bandoli et al., 2019; Chen, 2012; Nykjaer et al., 2014; Streissguth, Martin, Martin, & Barr, 1981; Sulaiman, Florey, Taylor, & Ogston, 1988), while in others no effect, or only a transient effect, was found (Bakker et al., 2010; Henderson, Gray, & Brocklehurst, 2007; O’Callaghan et al., 2003; Sampson, Bookstein, Barr, & Streissguth, 1994; Testa, Quigley, & Eiden, 2003).
Infant coordination and language development
We did not find any relationship between the age of achieving physical coordination milestones and drinker category or quantity of alcohol imbibed. Our finding that infants of non-drinkers had slower language development than light drinkers agrees with McCormack et al. (2018) who suggest such differences may be due to demographic differences between drinkers and non-drinkers. We found a negative association between infant verbal development and maternal alcohol intake when pre-pregnancy intakes were greater than 50 g per session. Sulaiman et al. (1988) reported an adverse effect only above an intake of > 100 g/week in humans. Animal studies have shown peak blood alcohol concentration is a critical factor when estimating the relative teratogenic risks of alcohol intake during pregnancy, i.e., a binge-style drinking pattern is the most harmful (Maier & West, 2001; Pierce & West, 1986; Scheops et al., 2018; Streissguth et al., 1989). Our results suggest delayed verbal development at alcohol levels associated with binge-drinking. May et al. (2013) and May, Hamrick, Corbin, and Hasken (2016) found that poor diet with prenatal alcohol intake led to increased risk of FASD. Further research on the possible association between verbal development, alcohol intake, and diet, would be valuable, in particular whether one can find a threshold maternal alcohol intake at which foetal harm greatly increases.
Limitations of the study
This was a convenience sample of 504 women, of whom only 370 were traceable or agreed to take part in the follow-up study of their infants to 18 months. Alcohol intake data were self-reported, and pregnant women especially may under-report their alcohol intake during pregnancy. The timing of alcohol consumption relative to conception is unknown, and alcohol data were only collected in month 4. Physical coordination milestones and number of words spoken by the infant were assessed by mothers’ recall, or from healthcare records in the infant’s health record book. They were not assessed using a standardised tool.
On the positive side this was a prospective, not retrospective, nutrition study, and in that context detailed information was collected on alcohol intakes, with measurement aids for actual quantity rather than general estimates. Subjects did not know alcohol would be a specific focus, and there was no reason for them to misreport their consumption. The study considered consumption both before the woman knew she was pregnant, and after she knew, whereas many other studies only consider alcohol intake during pregnancy. Rates of drinking before and during pregnancy were similar to those in other NZ studies and biological effects of alcohol are likely to remain the same.
Conclusions
Nineteen per cent of mothers never drank, 53% stopped when they knew they were pregnant and 29% continued to drink during pregnancy. Median consumption before pregnancy was two standard drinks per session, reducing to one when they knew they were pregnant. Twenty-two per cent of drinkers binge drank (≥ 5 standard drinks per session) before pregnancy and 10% during pregnancy. Heavier drinkers (10 or more standard drinks per session) were younger, likely to be of lower socioeconomic status, to be on welfare, and to smoke, with 2% of European drinkers, 19% of Pacific, and 38% of Maori women in this group.
The study found health implications of alcohol intake for pregnant women and their infants. Women who drank frequently, before pregnancy recognition, were more likely to be obese. Maternal alcohol consumption in g per drinking session, both before and during pregnancy, was negatively associated with mean infant weight, length and head circumference at various ages. No association was found between g alcohol consumption per drinking session, either before or during pregnancy, and the median age at which infants achieved gross development milestones such as sitting, crawling and walking. However, an association was found between the number of words spoken by the infant, and the maternal alcohol intake before pregnancy. The data showed impaired vocal development if the women’s alcohol intake exceeded 50 g per session before or (non-significantly) during pregnancy. The association may be moderated by maternal energy intake. More research on the possible association between verbal development, alcohol intake and diet, would be valuable.
Footnotes
Declaration of conflicting interests
The authors declared no potential conflicts of interest with respect to the research, authorship, and/or publication of this article.
Funding
The authors received no financial support for the research, authorship, and/or publication of this article.