
Abstract
Aims:
The purpose was to examine the changes in alcoholic beverage preferences among 14- and 16-year-olds in Finland from the year 1999 to 2017. In addition, the effects of age, gender and drinking style on beverage preference was studied.
Methods:
Nationally representative surveys of adolescent health behaviours in Finland from 1999 (n = 4943) and 2017 (n = 2451) among 14- and 16-year-olds were analysed using cross-tabulations and logistic regression modelling. Beverage data were coded from an open-ended question concerning the latest drinking occasion.
Results:
While the prevalence of 14- and 16-year-old adolescents’ alcohol drinking was more than halved between 1999 and 2017, the popularities of different beverages did not change equally. Drinking beer, cider and strong beverages mirrored the total decrease, as did the drinking of several different beverage types at a time. Wine drinking decreased only a little and alcopops actually increased in popularity. Taking the amounts of pure ethanol in the beverages into account, the proportion of alcohol drunk in the forms of beer and cider decreased notably, and in the form of wine it decreased a little. Strong beverages increased their share of alcohol drunk, but the most notable increase was seen in the share of alcopops, which more than doubled their share of the pure ethanol drunk.
Conclusions:
Increased popularity of alcopops among the under-aged together with the recent alcohol law change increasing the availability of alcopops in Finland call for attention to be paid both to marketing and the control of age limits of these products.
Adolescent alcohol use has decreased considerably in most developed countries since the turn of the millennium (Bhattacharya, 2016; de Looze et al., 2015; Kraus et al., 2018). This development has been markedly more pronounced than the slight decreases observed in population total alcohol consumption in the same countries ( Yearbook of Alcohol and Drug Statistics 2017, 2018). Recently, processes, explanations and reason behind declining adolescent drinking have been called for (e.g., Pennay, Livingston, & MacLean, 2015) and attempts to analyse them have been presented (Lintonen & Nevalainen, 2017; Raitasalo, Simonen, Tigerstedt, Mäkelä, & Tapanainen, 2018). Thus far, research is undecisive on the details of this development.
The alcohol policy changes in Finland from the year 1999 to 2017 were predominantly aiming at decreasing total consumption and restricting under-aged alcohol use. The Second European Alcohol Action Plan (2000−2005) was adopted by the WHO in 1999 ( European Alcohol Action Plan, 2000), and the WHO-EURO and the European Commission adopted the Declaration on Young People and Alcohol in 2001 with the purpose of protecting adolescents from harm caused by alcohol ( The Declaration on Young People and Alcohol, 2001). In line with these WHO actions, the Finnish government issued a national alcohol policy programme and, for example, the age limit of 18 years was extended to cover sales of beverages containing even small amounts of alcohol ( Yearbook of Alcohol and Drug Statistics 2017, 2018). In 2001, a national adaptation of the European action plan was approved. Working against these goals, quotas on tax-free alcohol imports for personal use by passengers from other EU countries were abolished in 2004 ( Yearbook of Alcohol and Drug Statistics 2017, 2018) and, as a counter-measure against predicted increase in tourist imports to Finland, alcohol taxes were lowered in March 2004 to prepare for Estonia joining the EU in May 2004. Government resolution on alcohol policy was announced in 2003 followed by a national Alcohol Programme 2004–2007, later extended to 2011, and transformed in 2015 into an Action Plan on Substance Abuse Prevention ( Yearbook of Alcohol and Drug Statistics 2017, 2018). In line with the programmes, the government decided that the retail sales of alcohol should not commence earlier than 9 o’clock in the morning and later, bulk discounts for alcoholic beverages were prohibited and advertising on TV and in cinemas was restricted. Taxes on alcoholic beverages were raised in 2008 by 15% on spirits and 10% on beer and wine. In 2009, taxes on alcoholic beverages were raised again twice. Also, the legislation on alcohol offences was amended enabling more effective interventions in, for example, possession of alcohol by under-aged people and alcohol marketing to under-aged people.
During the period from 1999 to 2017, the population total consumption (including unrecorded consumption; estimated using interview studies) first increased from 10.8 litres of pure alcohol to 12.7 litres in 2007, after which it decreased to 10.3 litres in 2017 ( Yearbook of Alcohol and Drug Statistics 2017, 2018). The preferred beverage has been medium-strength beer, which accounts for almost half of the total consumption (Karlsson, Härkönen, & Tigerstedt, 2018). Between 1999 and 2016, the consumption of strong beer has been steady at around 3% of the total consumption, while the popularity of cider has been both small and on a slight decline, and the consumption of alcopops, ready-made mixtures of spirits and soft drinks, has increased from around 3% to around 5%. Wine increased in popularity during the period studied, while consumption of spirits first increased until 2007, after which it decreased rapidly. All in all, the period from 1999 to 2017 witnessed little change in total consumption, decreases in the consumption of cider and spirits, and increases in the consumption of alcopops and wine, and little change in the consumption of either medium-strength or strong beer (Karlsson et al., 2018).
As in many industrialised countries worldwide, Finnish under-aged adolescents decreased their drinking from 1999 to 2017. The Adolescent Health and Lifestyle Survey showed that the proportions of 14-year-olds drinking alcoholic beverages at least once a month were 34% in 1999 and 6% in 2017, and among 16-year-olds, the figures were 58% in 1999 and 25% in 2017 (Kinnunen et al., 2017). The survey series was conducted bi-annually and illustrated a continually decreasing trend until the year 2015, after which the decline came to a halt. The European School Survey Project on Alcohol and Other Drugs reported that the proportion of 15- to 16-year-olds having drunk alcoholic beverages during the 30 days prior to data collection was 60% in 1999 and 32% in 2015 (Raitasalo, Huhtanen, & Miekkala, 2015). Beer had been consumed by 43% in 1999 but was down to 23% in 2015. The corresponding figures for cider were 49% in 1999 and 17% in 2015, for alcopops 29% in 1999 and 22% in 2015, wine 29% in 1999 and 13% in 2015, and spirits 42% in 1999 and 21% in 2015 (Raitasalo et al., 2015). Research on the beverage preferences among Finnish adolescents has shown that low-alcohol beverages account for most of the alcohol consumed by the under-aged (Lintonen & Konu, 2001). In 1999, beer was the favourite among boys and accounted for 44% of 14- and 16-year-olds’ consumption. In the same year, cider was the girls’ choice, and accounted for 28% of total alcohol consumption. All in all, alcohol in the form of beer, cider and alcopops amounted to 63% of all alcohol consumed by 14- and 16-year-olds (Lintonen & Konu, 2001).
Among adolescents, different beverage types have been shown to be associated with harms to a different degree and in different ways. Consequently, improved monitoring of alcoholic beverage preference among youth has been called for in order to form effective policies in relation to adolescent alcohol use (The ESPAD Group, 2016). Indeed, studies from Finland, Switzerland and the USA point out that beer and strong beverages are preferred by adolescents with riskier drinking patterns and other risky health behaviours (Dey, Gmel, Studer, Dermota, & Mohler-Kuo, 2014; Lintonen & Konu, 2001, 2003; Siegel, Naimi, Cremeens, & Nelson, 2011). Thus, from alcohol policy point of view, it is important to study beverage preference among drunkenness subgroups.
Alcohol beverage types have dramatically differing availabilities in Finland. Low-alcohol beverages (beer, cider, alcopops) can be purchased from every grocery store, kiosk and service station. Stronger beverages such as strong beer, wine and spirits are only available through state monopoly stores. The state monopoly stores excel in enforcement of alcohol sales age limits compared with grocery stores, especially smaller businesses such as service stations (Warpenius, Holmila, & Raitasalo, 2012). At the turn of the year 2017 to 2018, a law change increased the alcohol content limit of beverages sold in grocery stores from 4.7% to 5.5%, expanded the sales of alcopops, and reduced several other restrictions on the sales of alcoholic beverages ( Comprehensive reform of alcohol act, 2018; Finlex 1102/2017 Alkoholilaki, 2017).
In light of differing trends in alcohol consumption among under-aged adolescents in comparison with adults and the different impact of changes in availability of specific beverages among adolescents, our purpose is to examine the changes in alcoholic beverage preferences among 14- and 16-year-olds in Finland from the year 1999 to 2017. In addition, we will analyse the effects of age, gender and drunkenness severity on beverage preference.
Methods
The study data were derived from a bi-annual nationwide monitoring system of adolescent health behaviours in Finland, the Adolescent Health and Lifestyle Survey (AHLS), which has been conducted since 1977 (Kinnunen et al., 2017). The questions on alcohol use utilised in this study were presented in the years 1999 and 2017. Data were collected from February to May. Self-administered questionnaires were mailed to mutually independent, nationally representative samples of 12-, 14-, 16- and 18-year-olds; the current analysis concentrates on data on 14- and 16-year-olds. Two re-inquiries were sent to non-respondents in 1999, and three in 2017. In addition to a 12-page paper questionnaire, a digital version was available on the internet in 2017. Samples were obtained from the National Population Register Center and were based on particular dates of birth, so that all Finns born on the sample days were included.
The procedures performed were in accordance with the ethical standards of the institutional research committees and with the 1964 Helsinki declaration and its later amendments or comparable ethical standards. The study plan and data collection procedure were reviewed by ethics committees. In 1999, the Ethics Committees of the Pirkanmaa Hospital District (Finland) and in 2017 the Ethics Committee of the Tampere Region (Finland) approved the study protocol. Filling in the questionnaire was considered as adolescents’ consent to participate and no parental consent was required. In case the respondent’s parents wished to inspect the questionnaire, the respondent was instructed to present the questionnaire to his/her parents before answering.
In 1999, 1315 14-year-old and 1332 16-year-old girls responded; the corresponding numbers for boys were 1186 and 1110. The response rates were 85% among both 14- and 16-year-old girls and 74% (14-year-old boys) and 68% (16-year-old boys). In 2017, 723 14-year-old and 697 16-year-old girls responded, and the numbers for boys were 572 (14-year-olds) and 459 (16-year-olds). The response rates were 54% and 53% among girls, and 41% (14-year-olds) and 33% (16-year-olds) among boys. The mean age of the 14-year-old respondents was 14.6 years; the 16-year-olds were, on average, 16.6 years old.
The frequency of alcohol use was investigated with the question “How often do you use alcohol? Try to include also those times you consumed only small amounts of alcohol”. The answer choices were “daily”, “a few times a week”, “once a week”, “a few times a month”, “about once a month”, “about once in two months”, “3–4 times a year”, “once a year or less frequently”, “I do not use alcohol”. Drunkenness was measured with the question “How often do you use alcohol until you are really drunk?” The alternatives were “once a week or more often”, “once or twice a month”, “less frequently”, “never”. The measures for drunkenness have been found to be reasonably reliable and valid (Lintonen, Ahlström, & Metso, 2004; Lintonen & Rimpelä, 2001). Categories were combined for modelling. An indicator labelled “drinking style” was constructed by combining responses to the questions described above to form mutually excluding categories “drunk weekly”, “drunk monthly”, “drunk occasionally” and “drinks but not until drunk”. The qualities and quantities of alcoholic beverages consumed on the latest drinking occasion were inquired about with the question (Hibell et al., 1997): “Think back on your latest drinking occasion and describe in your own words as accurately as you can what you drank and how much? (If you shared drinks with other people please try to tell us how much you personally drank)”. The rates of valid responses to this question among eligible respondents (i.e., those reporting alcohol drinking) were 73% among 14-year-olds and 85% among 16-year-olds in 1999, and 79% (14-year-olds) and 83% (16-year-olds) in 2017. The open-ended answers were coded into beverage type categories and the amount of alcohol in pure ethanol.
The analyses have been adjusted for respondents’ ages by calculating the figures first separately for the age groups and then calculating the average of those figures to represent both 14- and 16-year-olds. Differences between the age groups are studied using logistic regression modelling.
Differences between the groups have been tested using a chi-squared test with p-value of .05 as the criterion for statistical significance. In analyses presented in Figures 1 and 2, the groups were defined by study year and specific alcoholic beverages. In the analyses presented in Figures 3 and 4, the groups were based on the different drinking styles and alcoholic beverage types. Tests have been performed for girls and boys aged 14–16-years-olds.
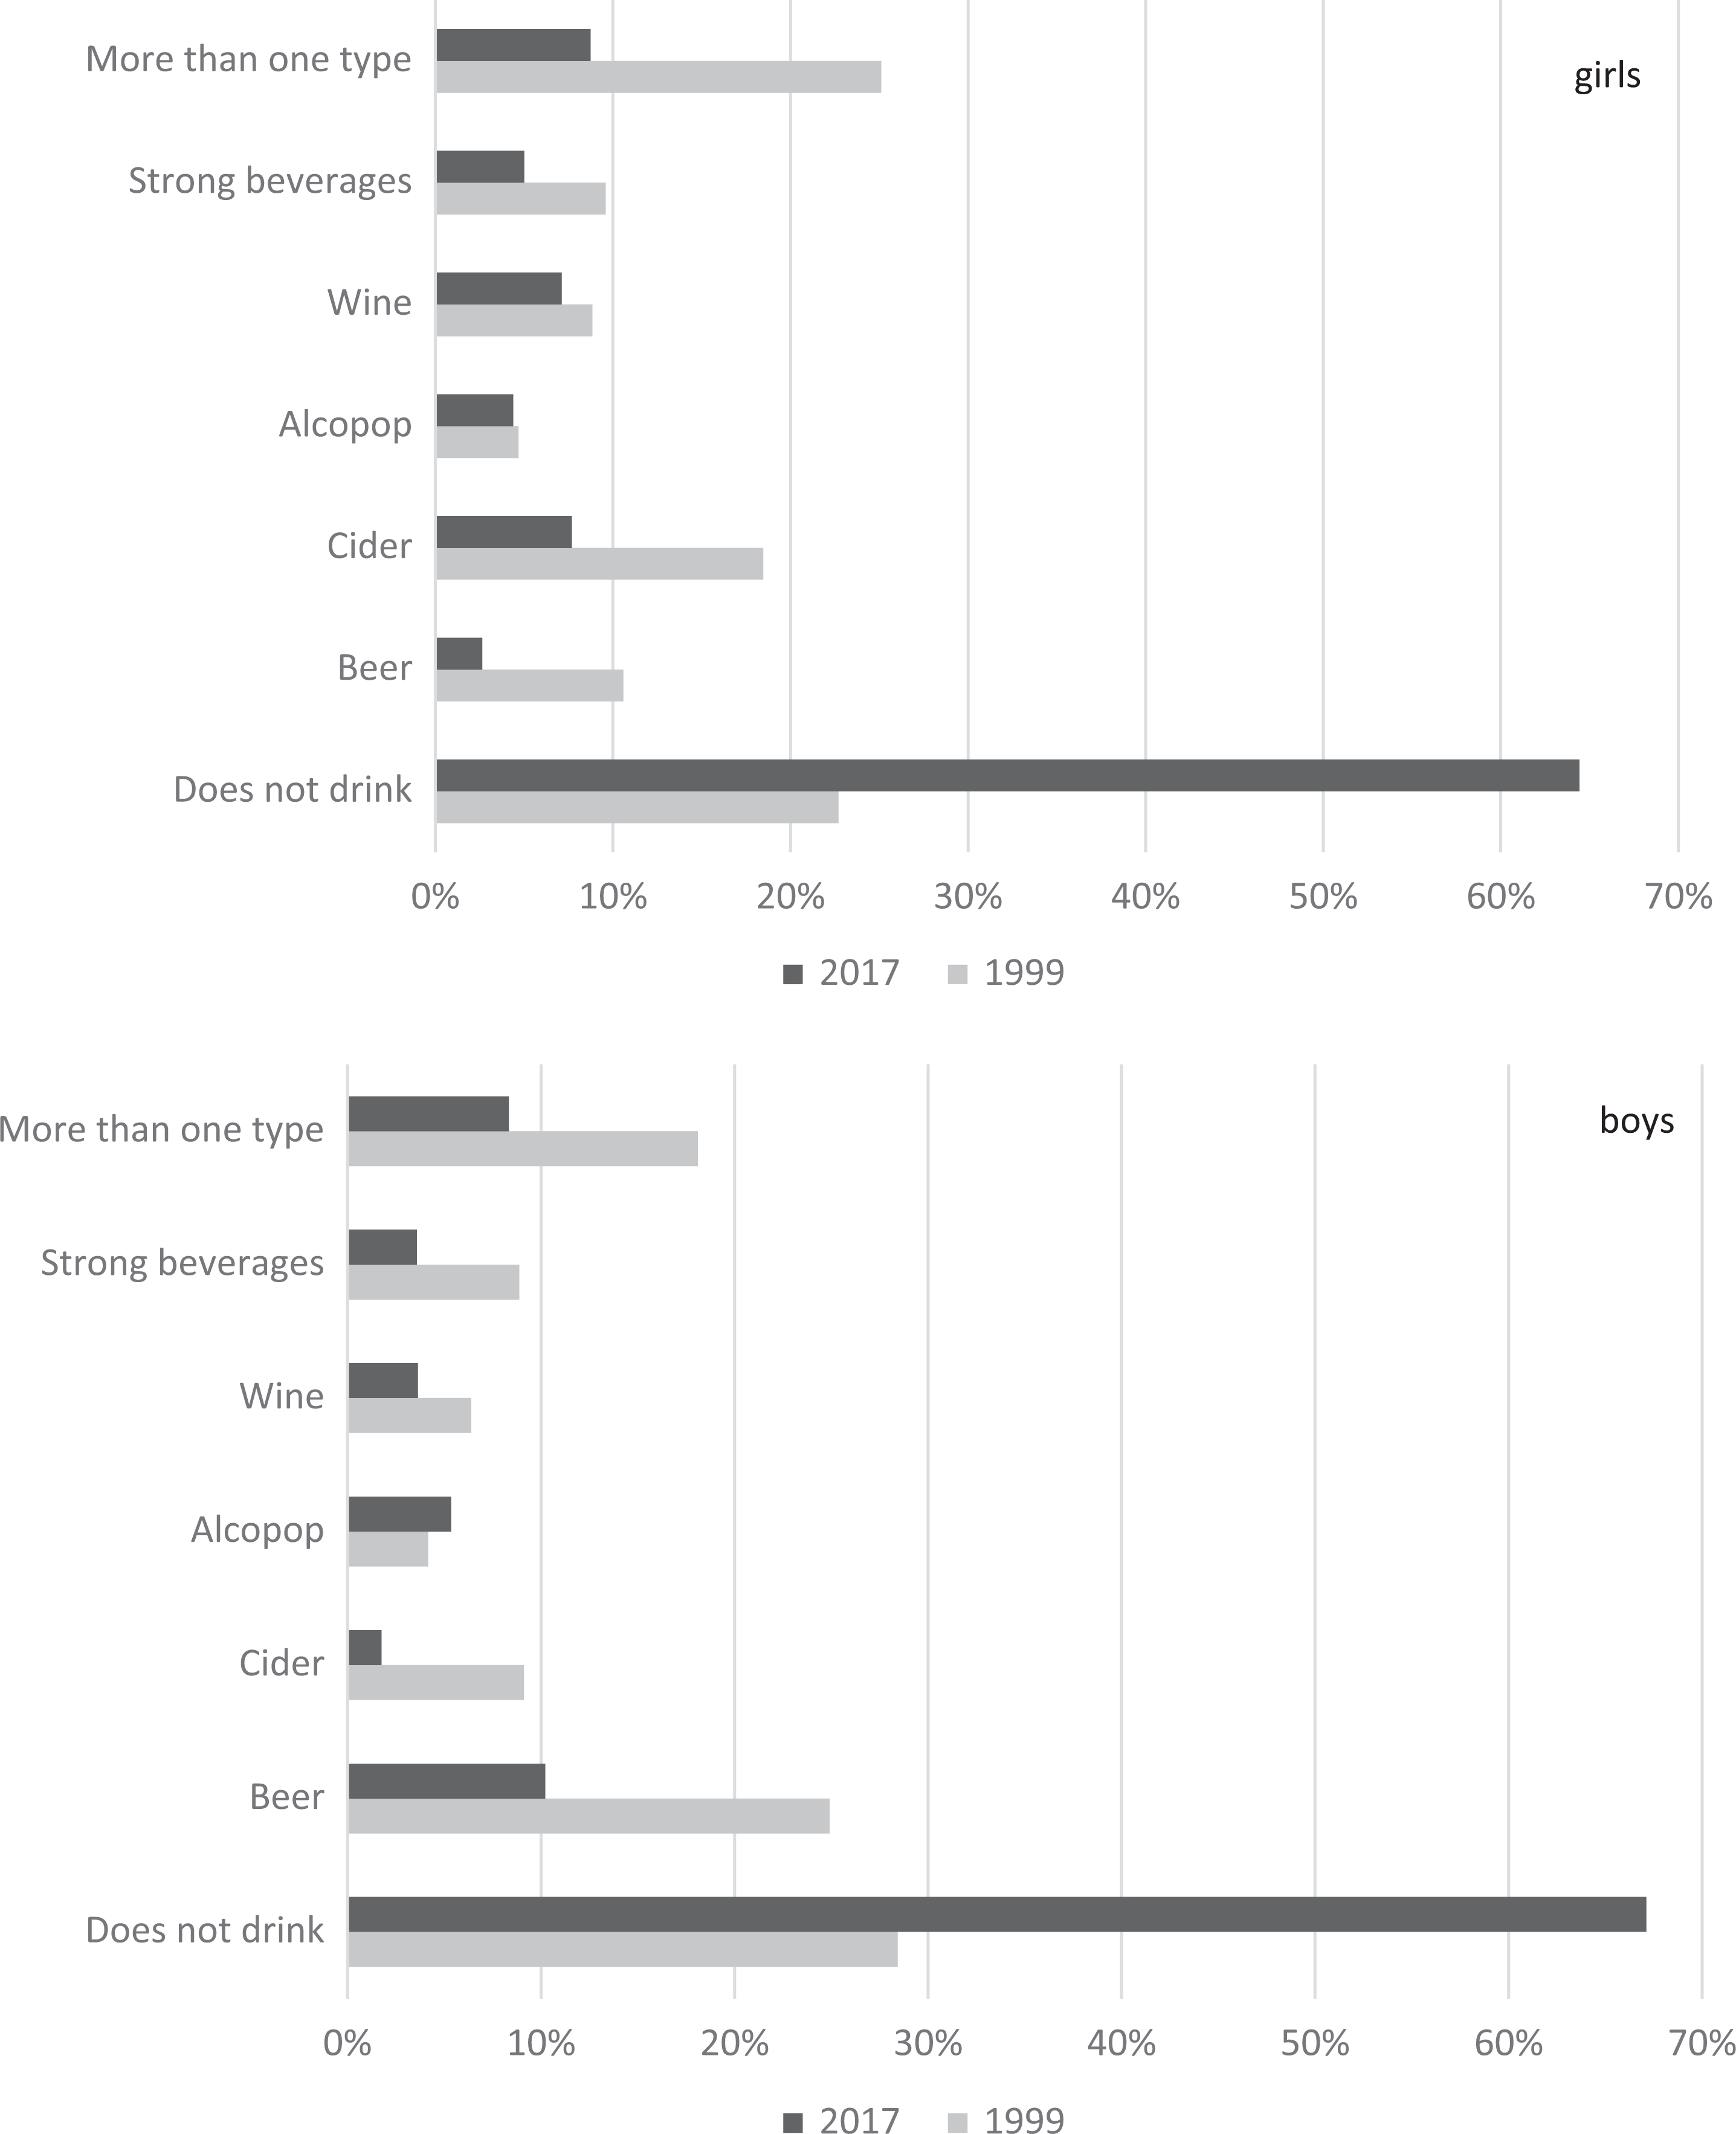
The distribution of alcoholic beverage type names reported on latest drinking occasion among 14- and 16-year-old girls (above) and boys (below) in 1999 and 2017.
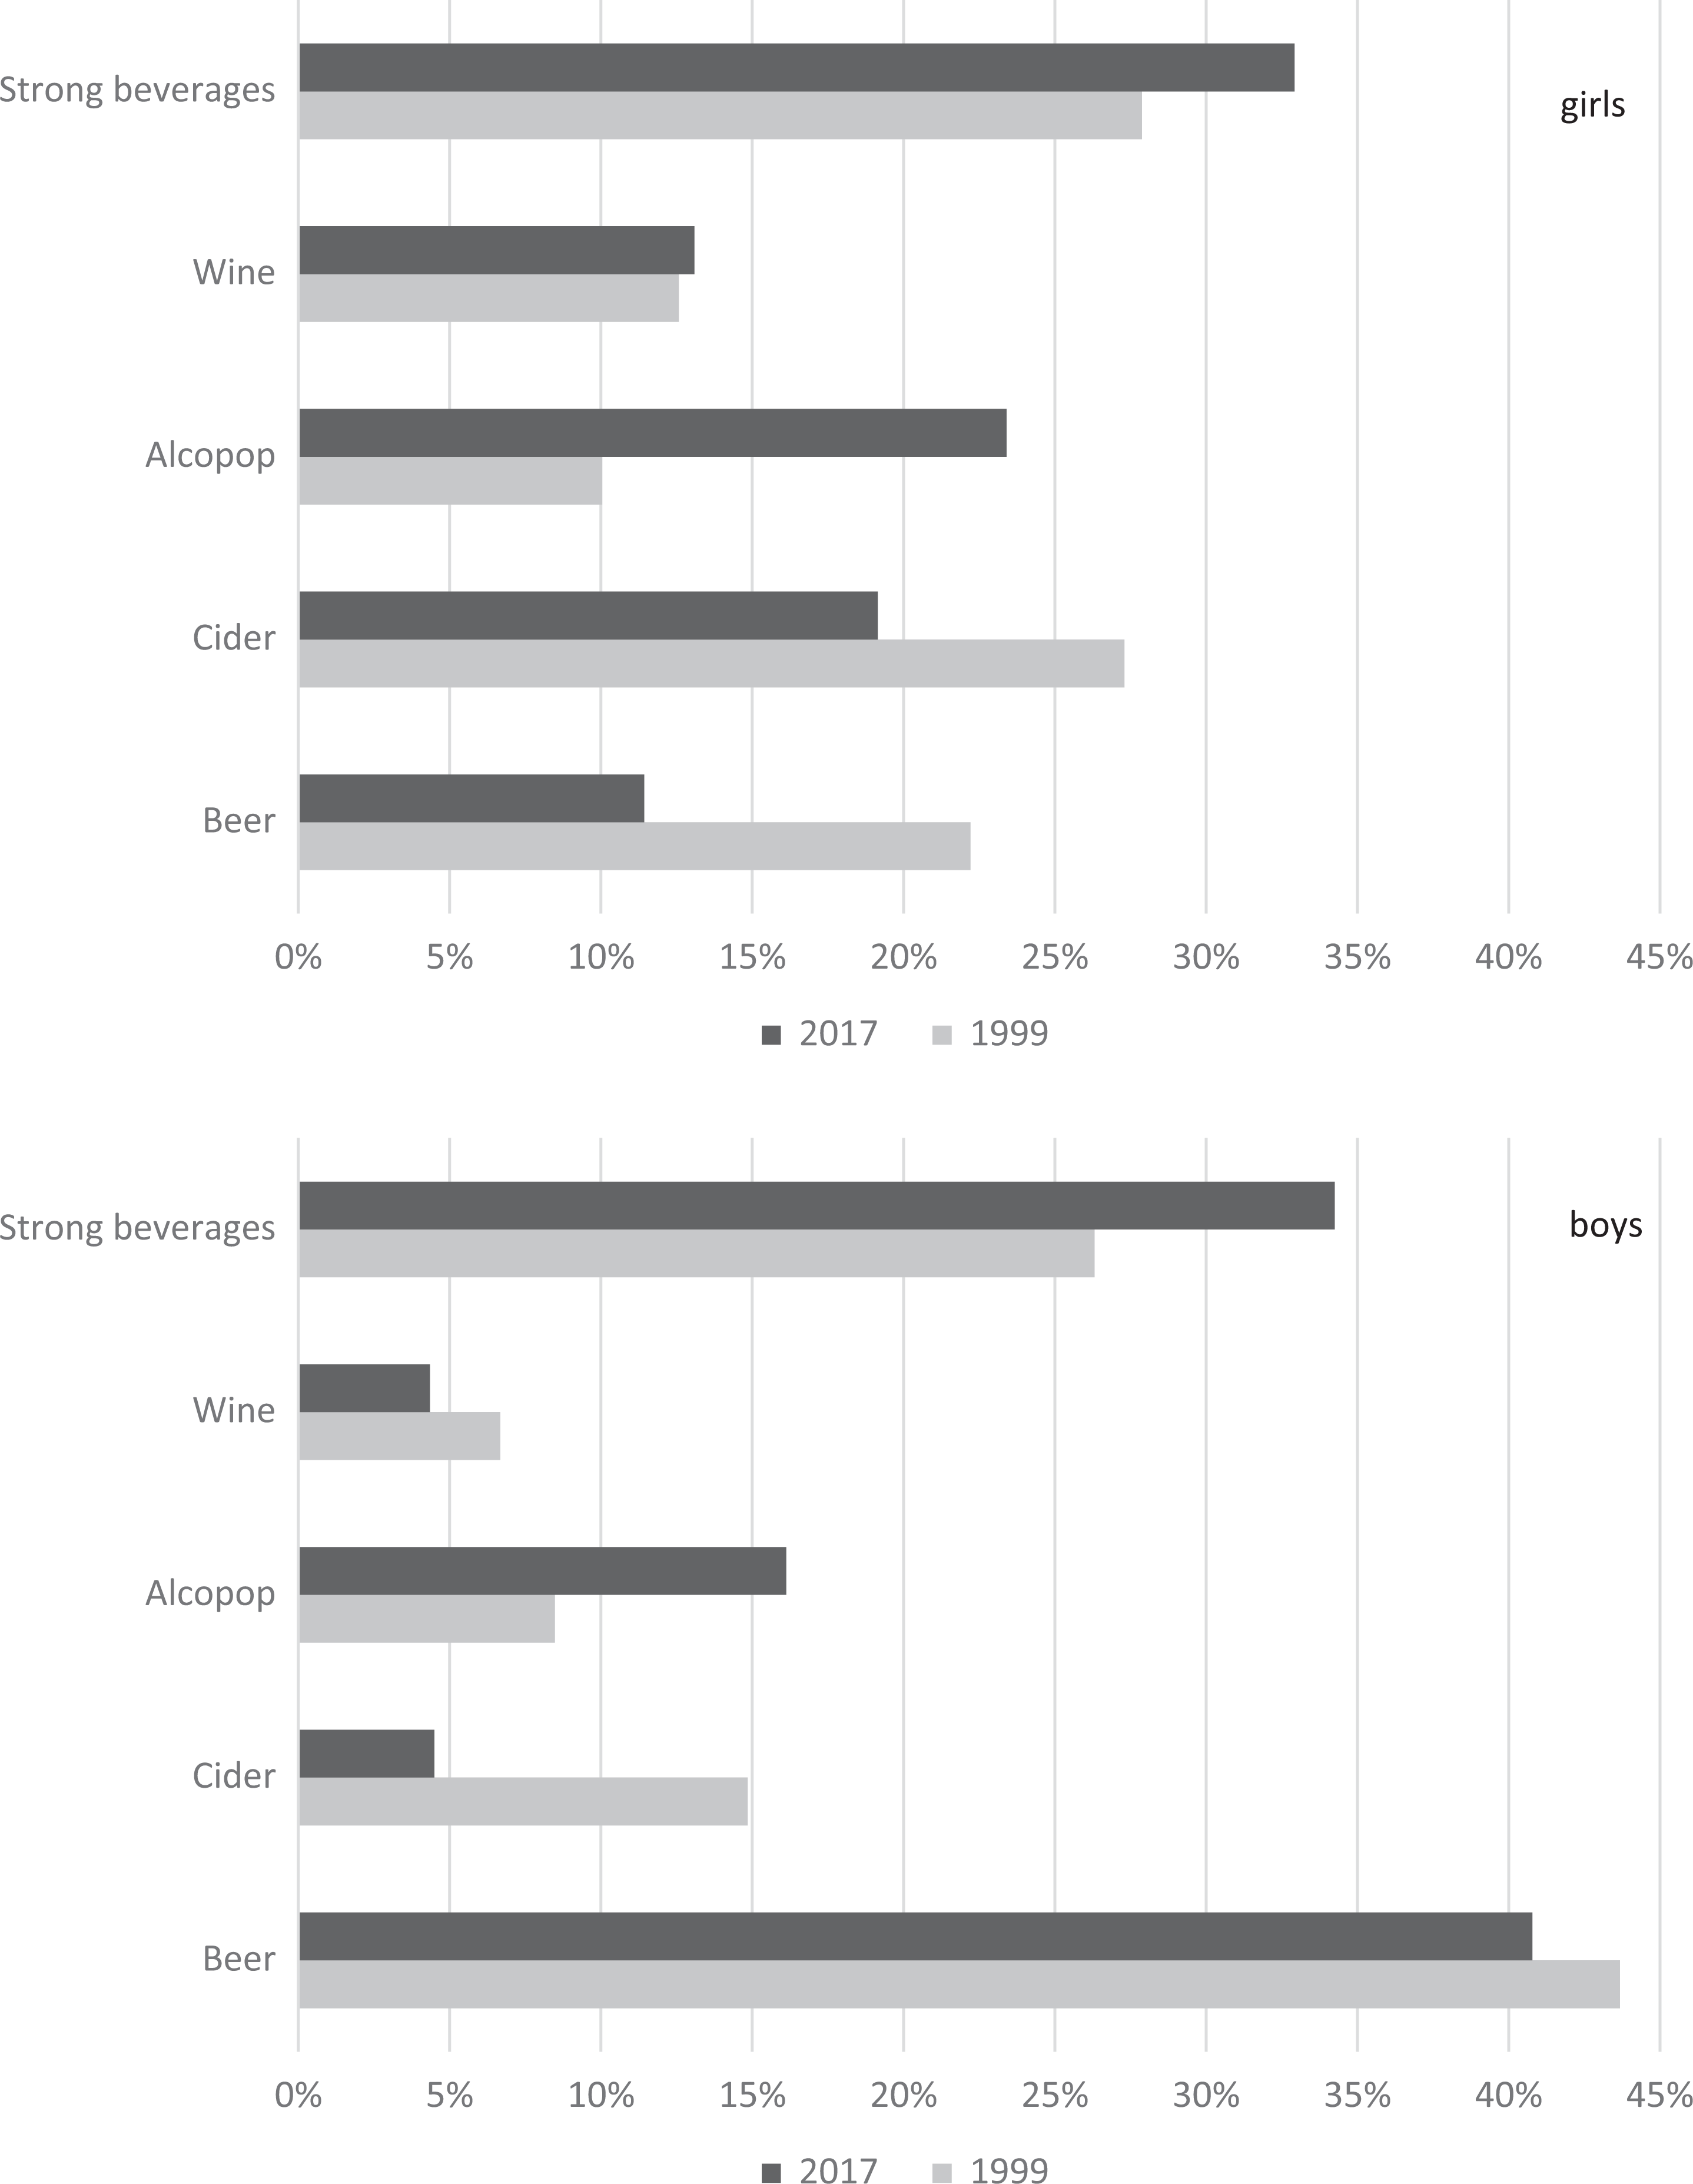
The distribution of 100% ethanol by alcoholic beverage type reported on latest drinking occasion among 14- and 16-year-old girls (above) and boys (below) in 1999 and 2017.
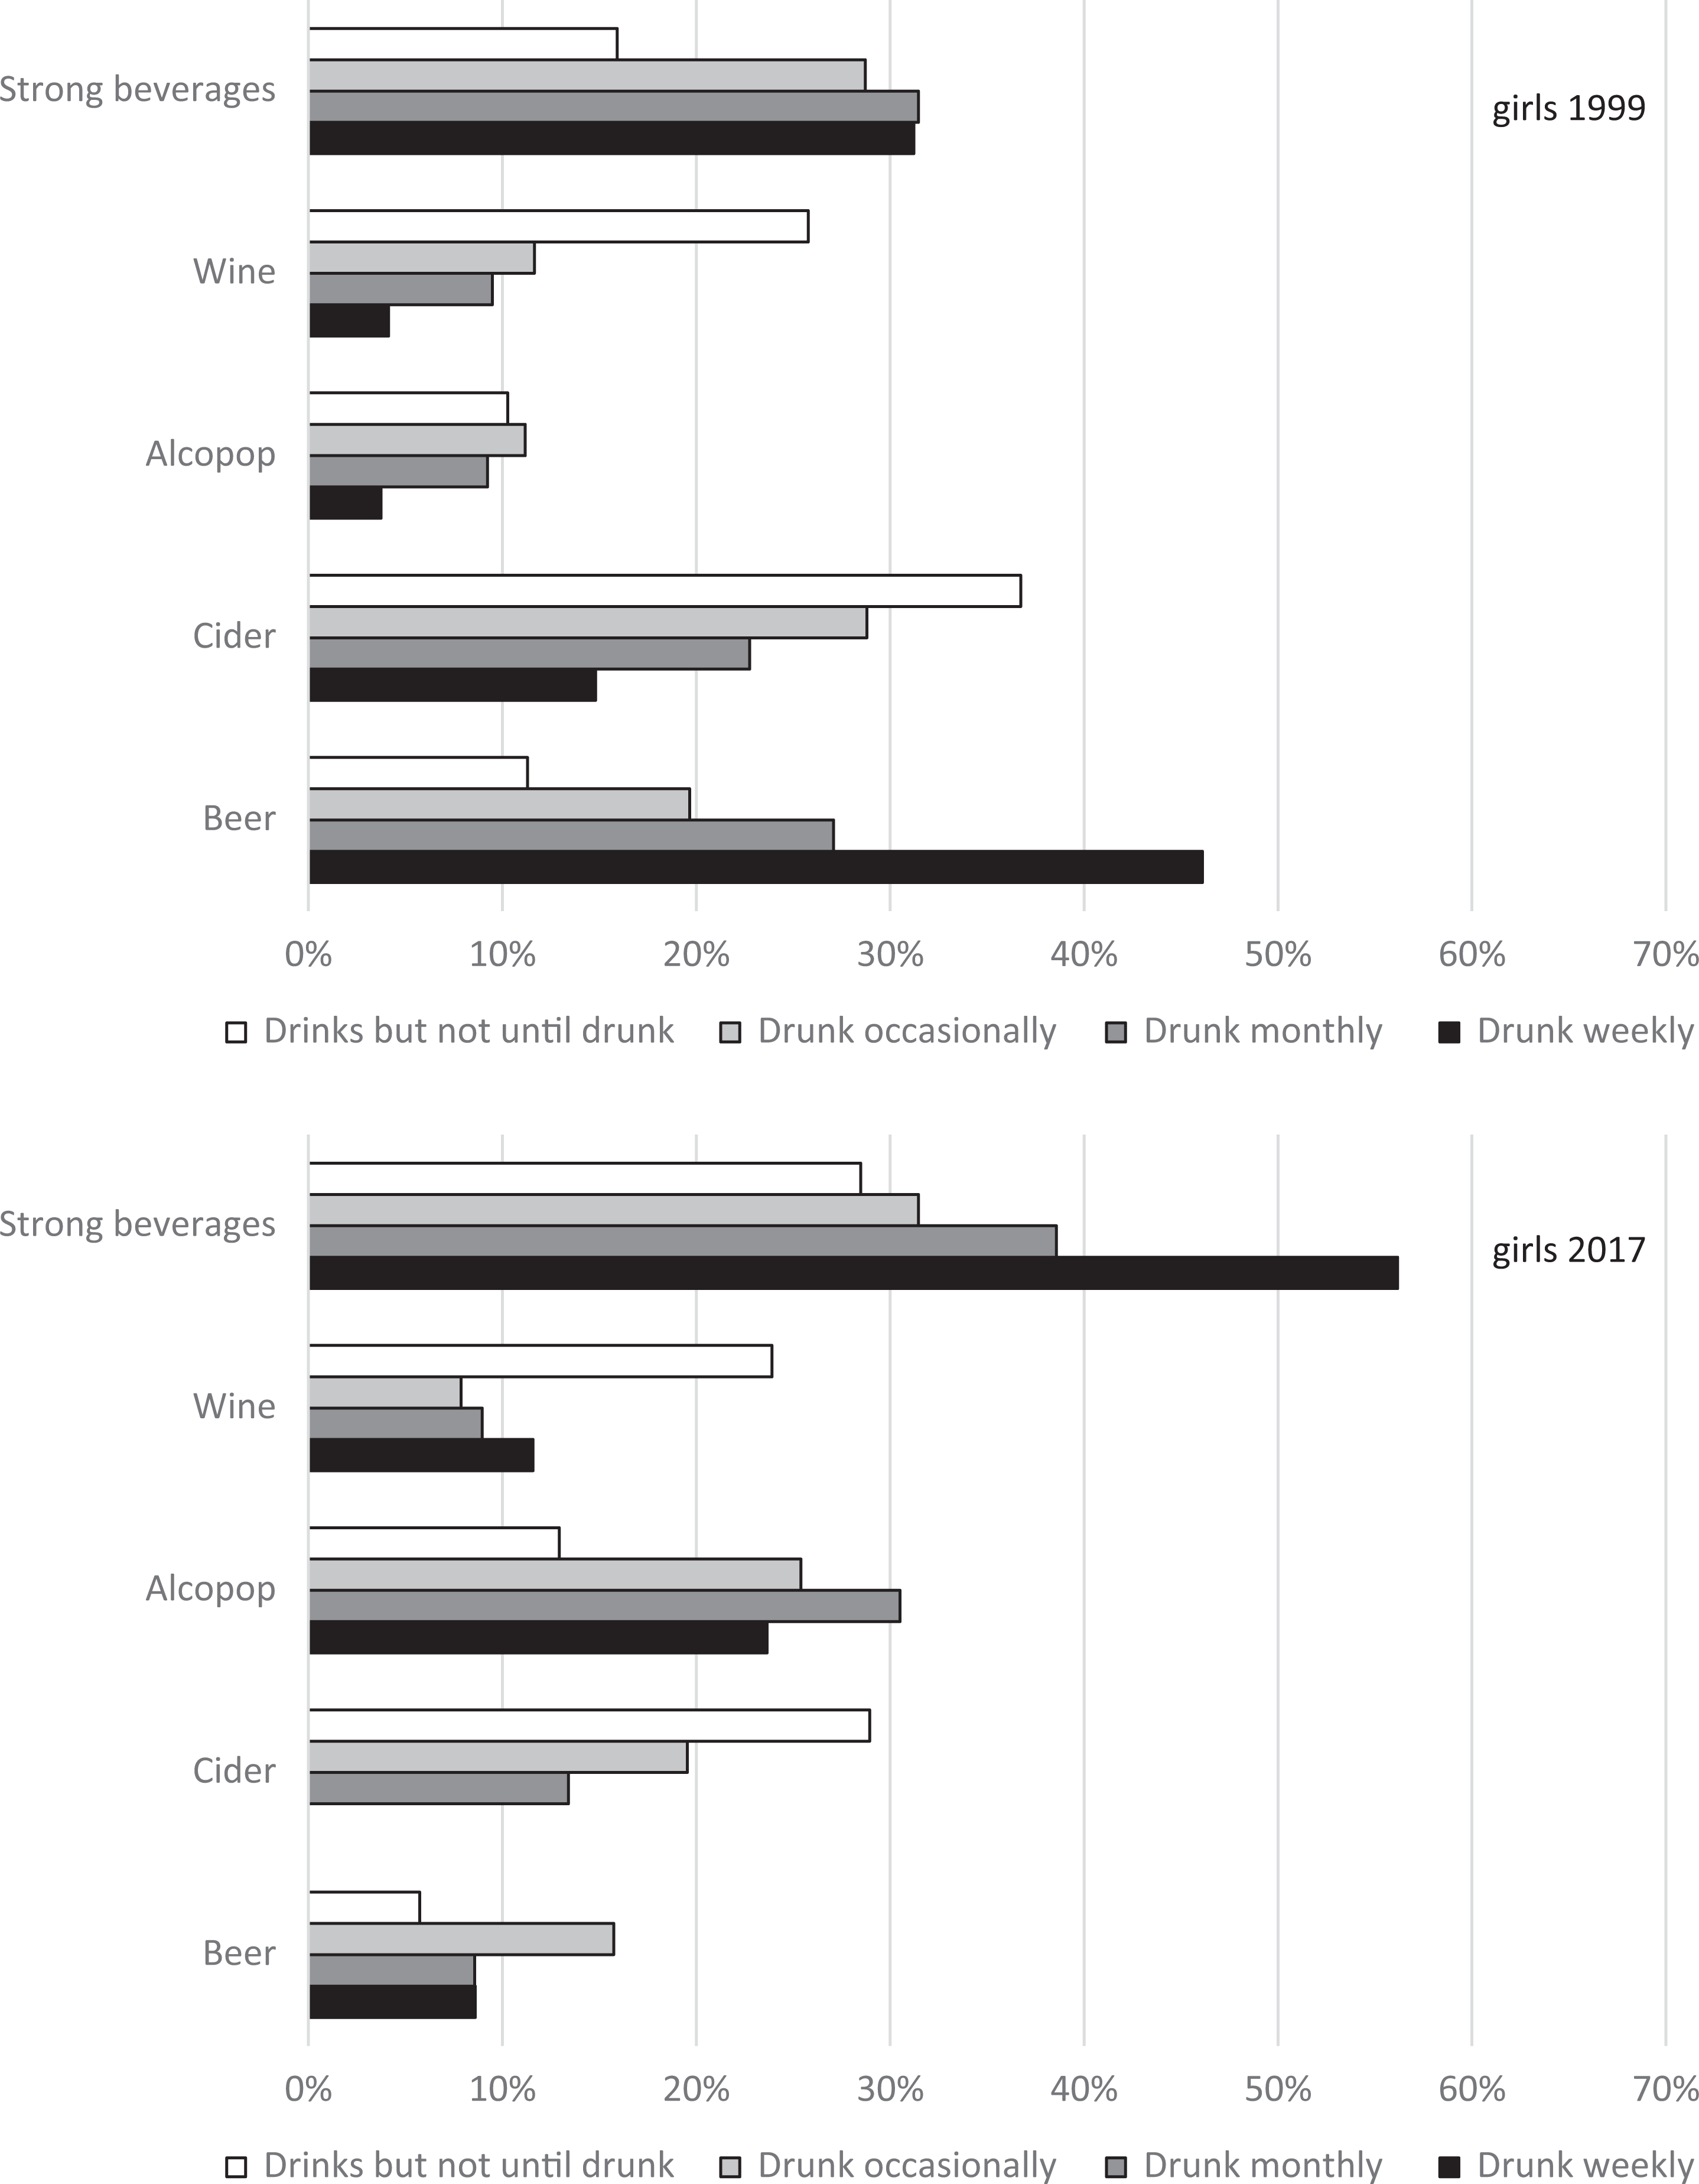
The distribution of 100% ethanol by alcoholic beverage type reported on latest drinking occasion among 14- and 16-year-old girls by drinking style in 1999 (above) and 2017 (below).
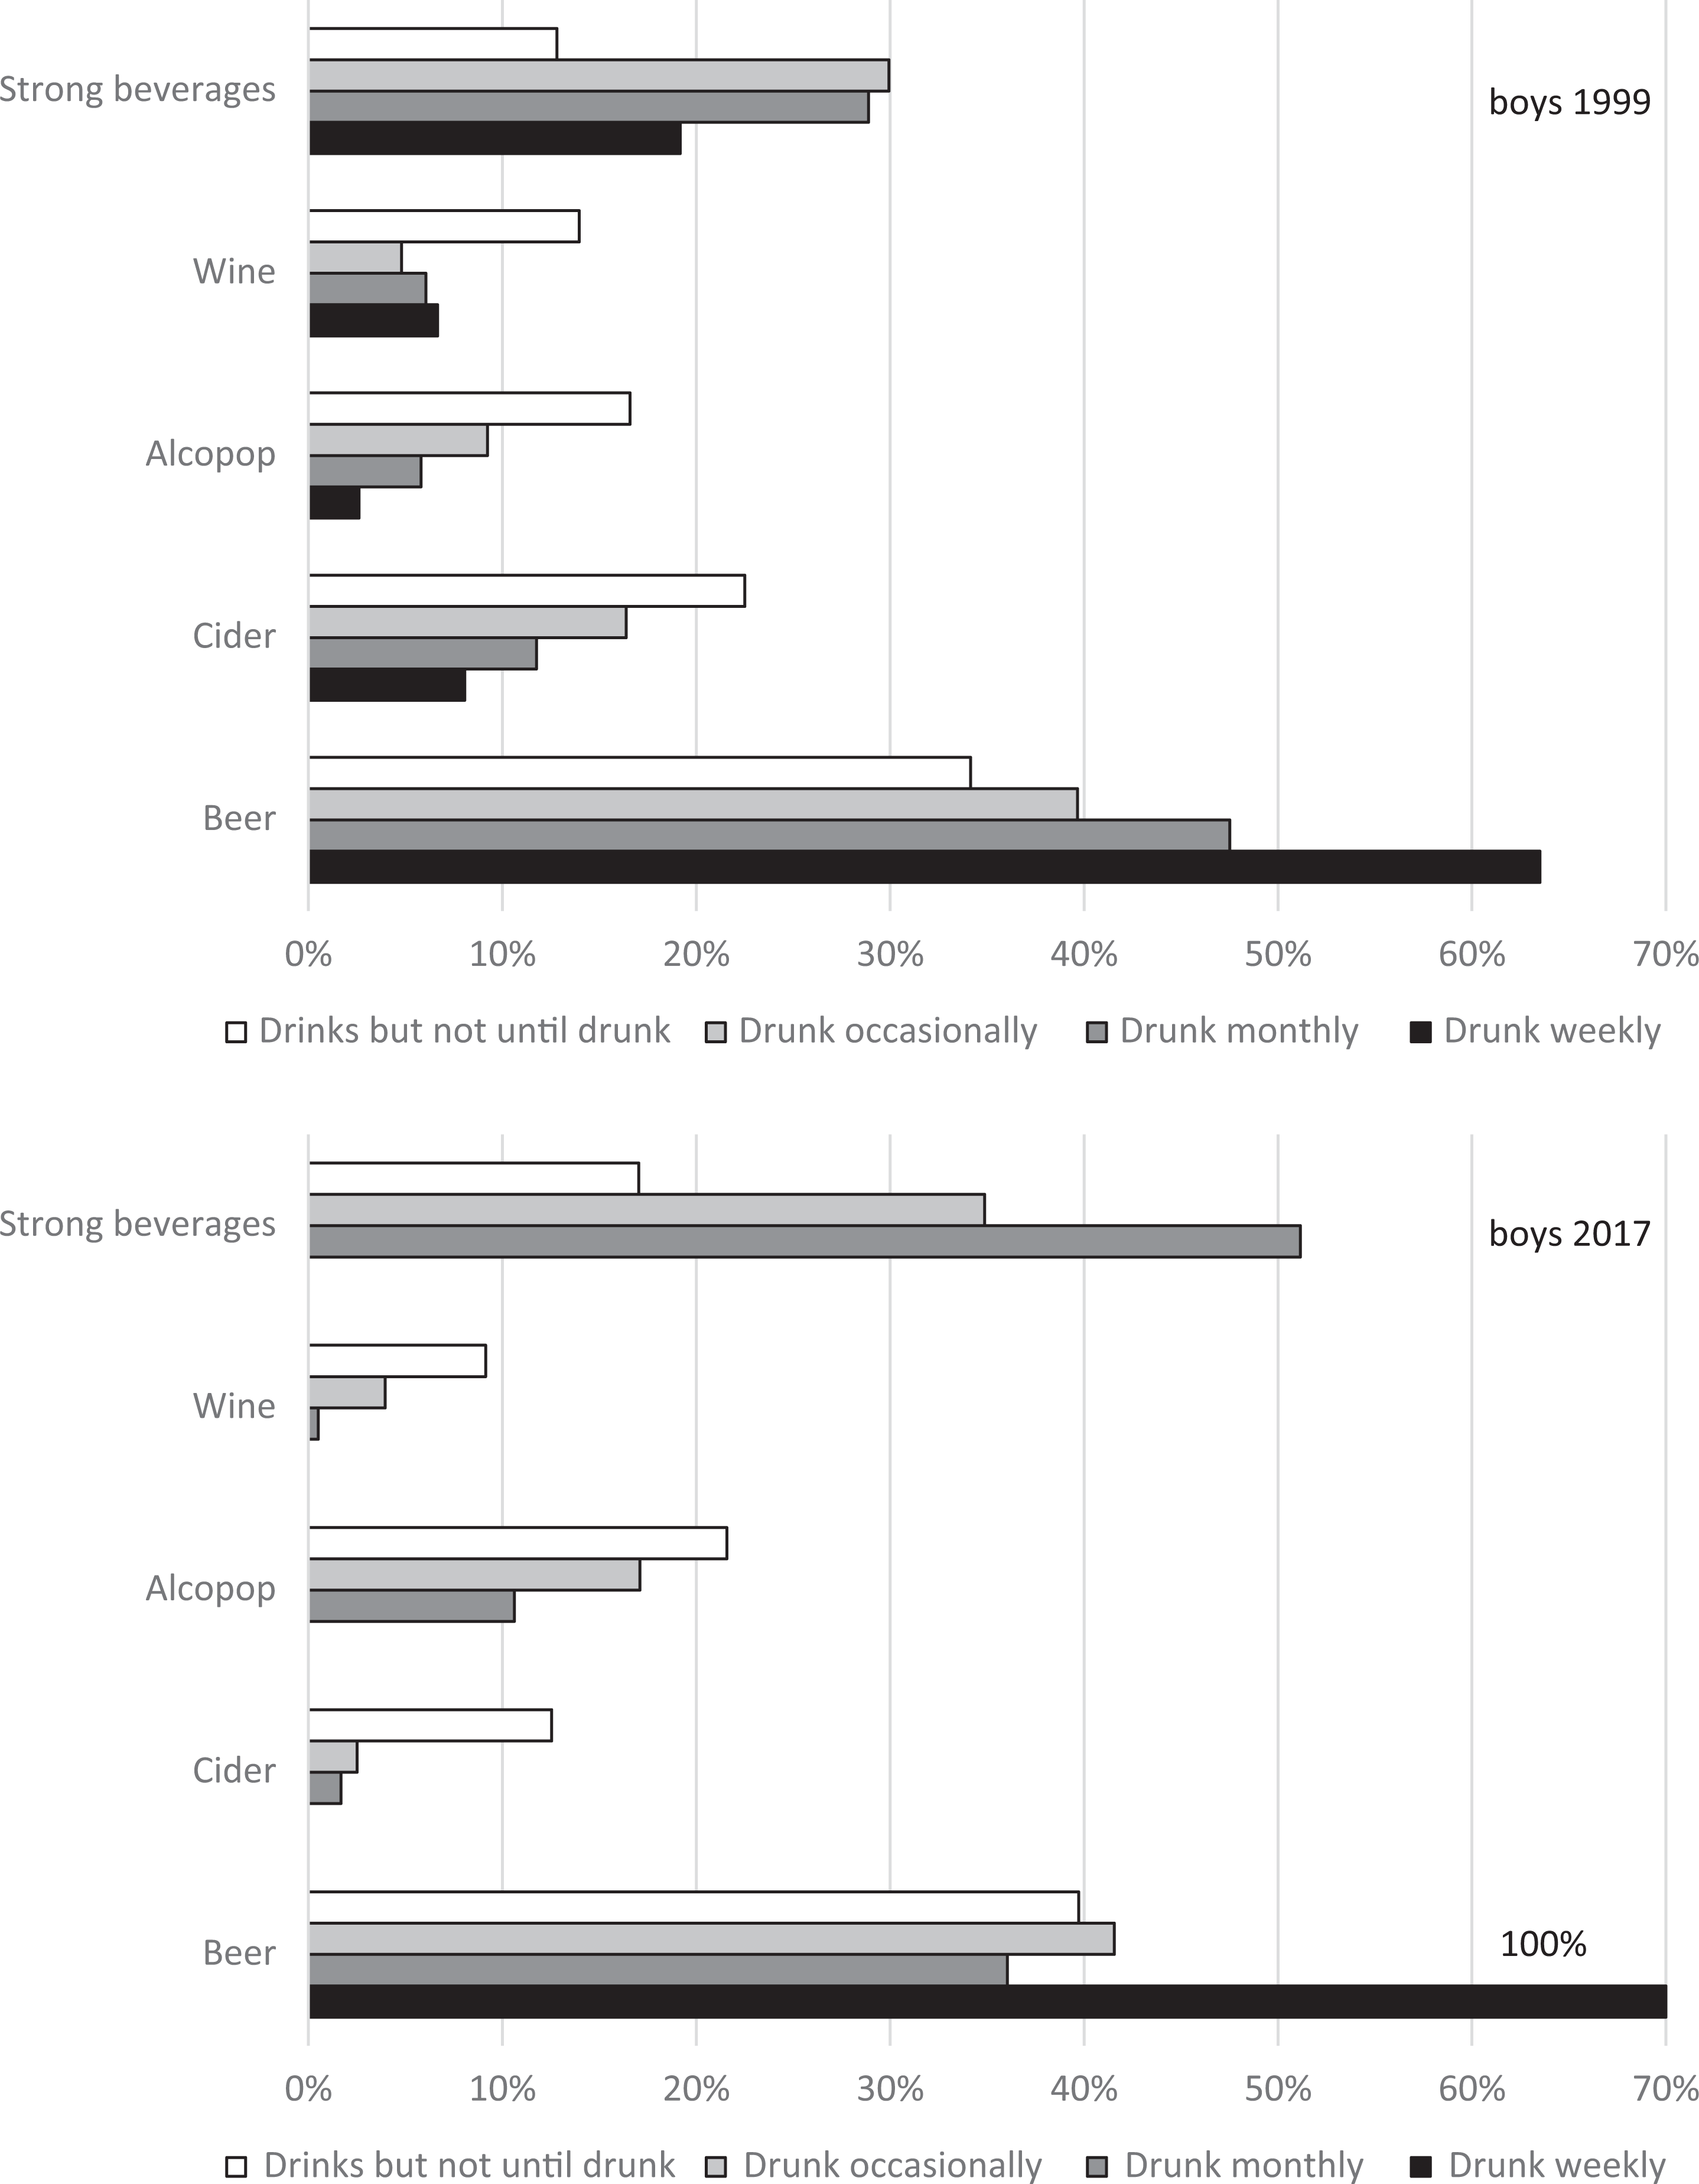
The distribution of 100% ethanol by alcoholic beverage type reported on latest drinking occasion among 14- and 16-year-old boys by drinking style in 1999 (above) and 2017 (below).
Logistic regression models predicting specific beverage use on the latest drinking occasion were executed separately for the five beverage type categories: beer, cider, alcopops, wine and strong alcoholic beverages. Predictors entered in the models simultaneously were: study year, respondent age and gender, alcohol-use frequency and drinking style.
Results
The most notable change in 14- to 16-year-old adolescents’ drinking from the year 1999 to 2017 was the increase (p < .05) of those who do not drink alcoholic beverages (Figure 1). In 2017, 64% of girls and 67% of boys reported that they did not drink alcohol. Among the girls, decreases were greatest for cider and beer (p < .05); notably, alcopops (ready-made mixtures of soft drinks and alcohol) remained almost as popular as in 1999 (not significant). Among the boys, drinking cider became rare (2%; p < .05), but alcopops were mentioned more often than in 1999 (p < .05). Drinking more than one alcoholic beverage on the same occasion became notably less popular among both genders in the year 2017 compared with 1999 (p < .05).
A clear gender difference in beverage type choice is seen when analysing the amount of 100% ethanol consumed by 14- and 16-year-olds (Figure 2). The most popular sources of ethanol were strong beverages (spirits, fortified wines, liqueurs) among girls (33% in 2017) and beer among boys (41% in 2017). Among the girls, beer and cider showed decreases in popularity (p < .05), and the most notable increase was seen in alcopops (from 10% in 1999 to 23% in 2017; p < .05). Cider became notably less popular among boys (p < .05), while alcopops doubled their share of ethanol from 8% to 16% (p < .05).
The choice of alcoholic beverage type consumed on the latest drinking occasion was related to respondents’ drinking styles both in the year 1999 and 2017 (Figure 3 and Figure 4; p < .05). Among 14- and 16-year-old girls, those who reported drinking until drunk once a week or more often favoured beer in 1999, but strong alcoholic beverages in 2017 (Figure 3). Girls who reported drinking alcoholic beverages, but never until drunk, favoured cider both in 1999 and 2017. In 2017, however, those drinking but not until drunk consumed almost as large a proportion of absolute alcohol in the form of strong alcoholic beverages (Figure 3).
Boys who reported drinking until drunk favoured beer on the latest drinking occasion both in 1999 and 2017 (Figure 4). There were very few boys who reported weekly drunkenness in 2017; when the groups reporting drunkenness weekly and monthly were combined, the favourite among boys in 2017 was strong beverages (50% of total ethanol versus 38% in the form of beer). With this exception, beer was the favourite among boys regardless of their drinking style both in 1999 and 2017. Cider, alcopops and wine were more popular among boys drinking in moderation, but even in this group of drinkers, beer accounted for 40% of the ethanol consumed.
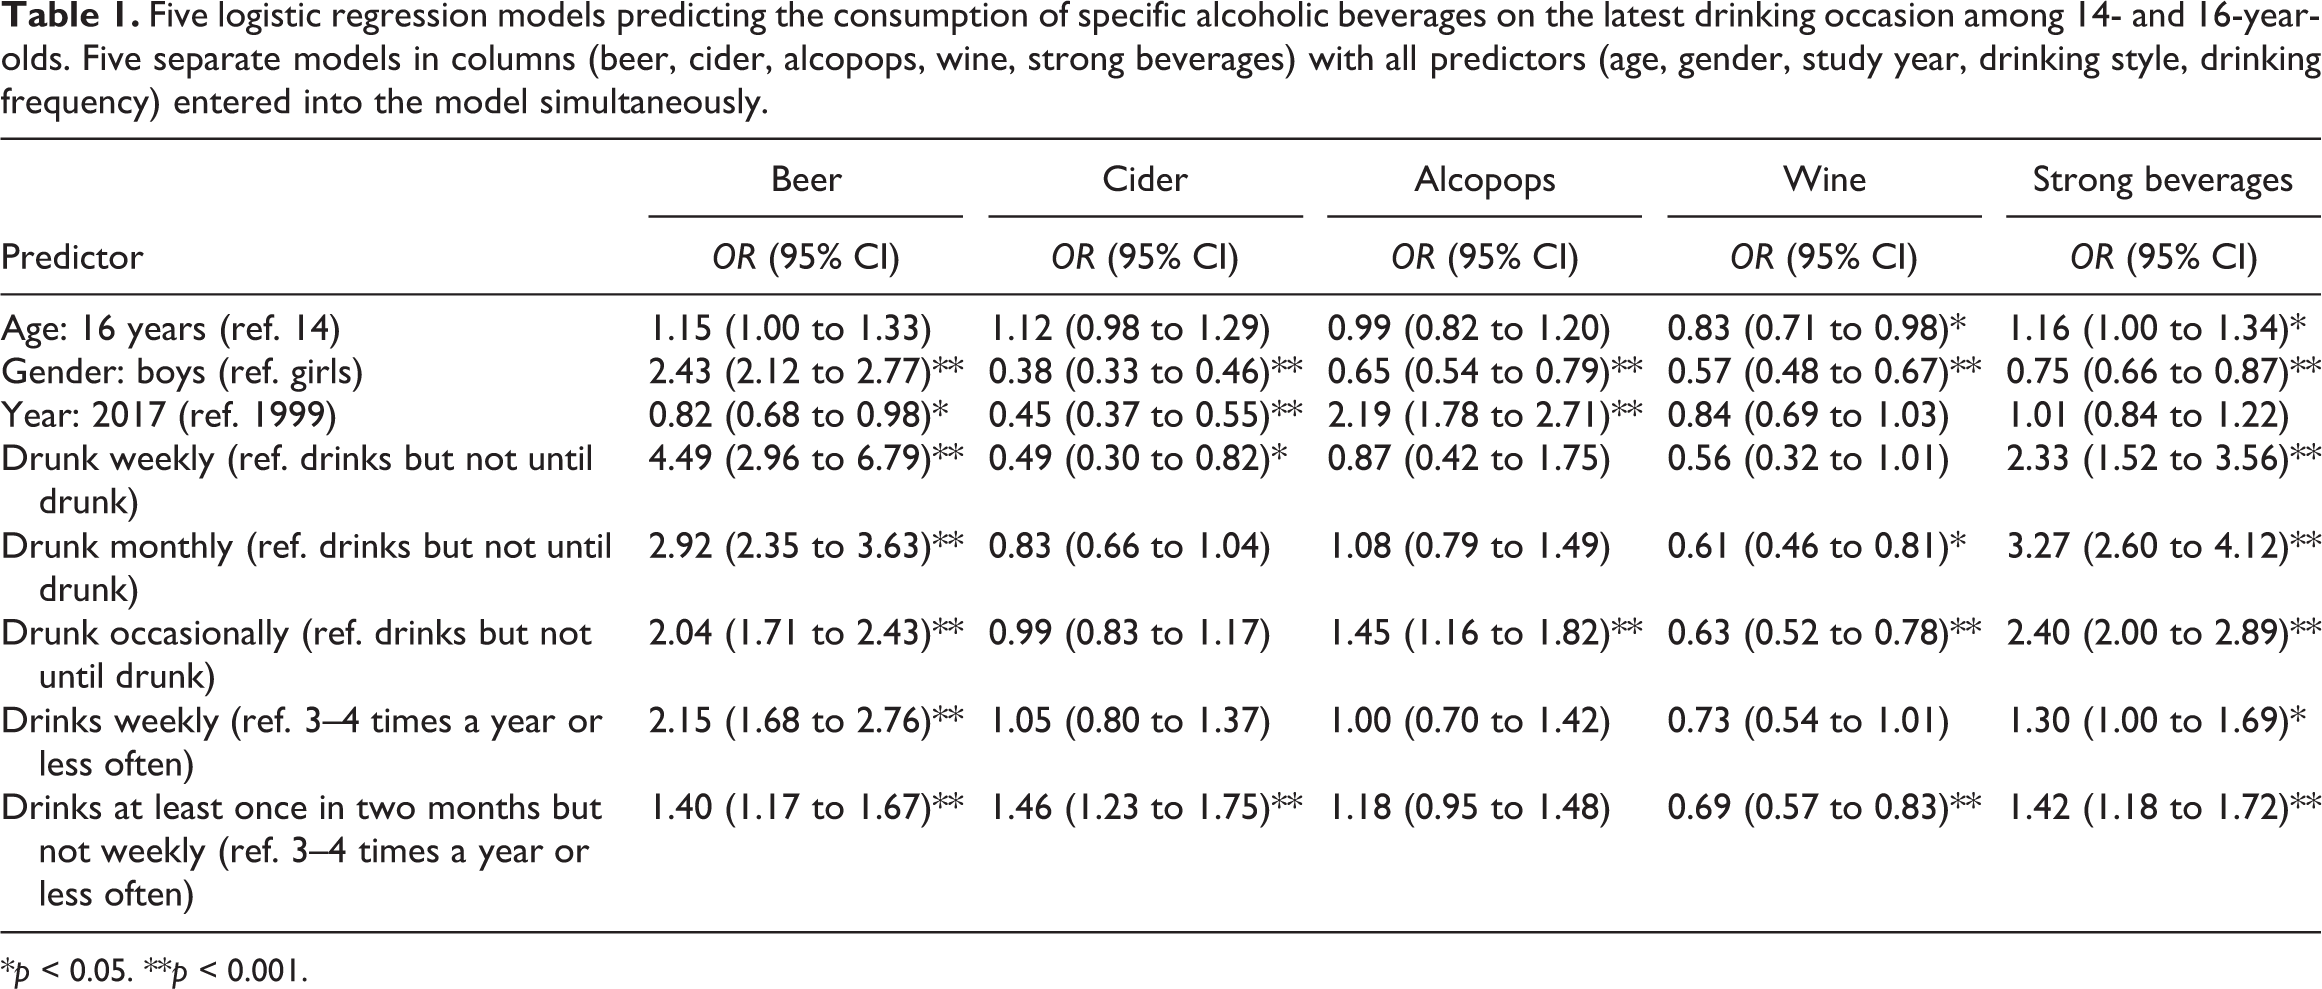
A logistic regression model predicting beer use on the latest drinking occasion showed that beer was preferred less in the year 2017 compared with 1999, and that boys preferred it more often than girls (Table 1, column 1). Drinking beer was also more common among those drinking alcohol more often, and among those drinking more often until drunk.
Five logistic regression models predicting the consumption of specific alcoholic beverages on the latest drinking occasion among 14- and 16-year-olds. Five separate models in columns (beer, cider, alcopops, wine, strong beverages) with all predictors (age, gender, study year, drinking style, drinking frequency) entered into the model simultaneously.
*p < 0.05. **p < 0.001.
The model predicting cider use showed that it was favoured by girls rather than boys, and significantly less in the year 2017 compared with 1999 (Table 1, column 2). Drinking cider was as common among weekly drinkers as it was among those drinking only a few times a year. However, those drinking alcohol at least once in two months but not weekly favoured cider more than those drinking less often.
Alcopops were more common on the latest drinking occasion in the year 2017 than in 1999 (Table 1, column 3). Girls drank alcopops more often than boys. There were no differences in alcopop use by drinking frequency. However, alcopops were preferred by those drinking until drunk infrequently when compared with those never drinking until drunk.
Drinking wine was more common among girls than boys, and among 14-year-olds than 16-year-olds (Table 1, column 4). Wine was favoured by those never drinking until drunk and those drinking alcohol at least once in two months compared with those drinking less often.
No change in the popularity of strong alcoholic beverages was seen between the years 1999 and 2017 (Table 1, column 5). Girls reported more strong beverage use than boys, and 16-year-olds more than 14-year-olds. Drinking more often increased the odds of drinking strong beverages, as did drinking until drunk.
The regression models showed that the only beverage type category that increased in popularity from the year 1999 to 2017 was alcopops (Table 1). Strong beverages were more popular among 16-year-olds than among 14-year-olds while wine was more popular among 14-year-olds. Beer was clearly favoured by boys while all other beverages were used more often among girls (adjusting for study year, age, drinking frequency and drinking style). Beer and strong alcoholic beverages were chosen by those drinking more frequently and in a more drunkenness-oriented drinking style. Wine was more popular among infrequent and moderate drinkers.
Discussion
While the prevalence of 14- and 16-year-old adolescents’ alcohol drinking was more than halved between 1999 and 2017, the popularities of different beverages did not change equally. Drinking beer, cider and strong beverages mirrored the total decrease, as did the drinking of several different beverage types at a time. Wine drinking decreased only a little and alcopops actually increased their popularity. Taking the amounts of pure ethanol in the beverages into account, the proportion of alcohol drunk in the forms of beer and cider decreased notably and in the form of wine a little. Strong beverages increased their share of alcohol drunk, but the most notable increase was seen in the share of alcopops, which more than doubled their share of the pure ethanol drunk by 14- and 16-year-olds.
At the population level, the period from 1999 to 2017 witnessed little change in total consumption, decreases in the consumption of cider and spirits, and increases in the consumption of alcopops and wine, and little change in the consumption of either medium-strength or strong beer (Karlsson et al., 2018). This picture is only partly reflected in the beverage type preferences among under-aged adolescents: cider became less popular and alcopops more popular both in the adult and adolescent populations. Part of the explanation behind different beverage preference trends among the adolescent and adult populations may lie in differences in availabilities: strong beverages, wine and strong beer, cider and alcopops are only sold through monopoly stores, which are known to be better at implementing age control (Warpenius et al., 2012). However, both cider and alcopops under the alcohol content of 4.7% were available through a dense network of grocery stores, kiosks and service stations. Thus, the shift in adolescent preference from cider to alcopops is likely to reflect a change in “taste” – whatever that may mean. In any event, the alcohol legislation change that took place on January 1, 2018 is likely to boost this shift from cider to alcopops as the selection of alcopops in grocery stores is widened.
In the Nordic context, Finland and Norway are still beer territory, while Denmark and Sweden have moved on to wine as the most popular beverage (Karlsson et al., 2018; Yearbook of Alcohol and Drug Statistics 2017, 2018). In addition, Finland is still characterised by high spirits consumption, although sprits have decreased in popularity among the adult population. Looking at the trends among adolescents, a shift from beer towards wine is evident. This trend, however, is likely to change the population-level picture very slowly.
The ESPAD surveys showed that the consumption of all beverage types had decreased considerably between 1999 and 2015 among 15- to 16-year-olds (Raitasalo et al., 2015). The analyses presented above are not in total agreement with this picture: alcopops increased in popularity. One possible explanation is the difference in measurement time points: ESPAD was collected in 2015 and AHLS in 2017. During the year 2017, the news media discussed alcopops extensively as part of the process leading to legislation change and this may have worked as unintended promotion of alcopops. In addition, it must be remembered that both surveys carry their own sources of measurement error; next data collections in both survey series may illuminate the situation further. The complementing analyses presented in this article show that, in addition to increased consumption of alcohol in the form of alcopops, drinking alcohol in the form of strong beverages increased from 1999 to 2017. This is likely to reflect increased bootlegging of strong beverages by adults to the under-aged.
The frequency of drinking and the amounts consumed per occasion differentiated the choice of beverage types. Among boys, beer was generally the choice regardless of drinking style both in 1999 and 2017, but in 2017, those drinking until drunk at least once a month favoured strong beverages. This shift in preference from beer to strong beverages among those drinking heavily was also seen among girls. Girls drinking only small amounts favoured cider both in 1999 and 2017. Getting drunk is likely to be even more hazardous for an adolescent than it is for an adult, and the leading harms experienced by the under-aged are related to drunkenness (Lavikainen & Lintonen, 2009; Samposalo, 2013). In addition to parents or older siblings buying strong beverages for the under-aged, semi-commercial illegal import from neighbouring countries, especially Estonia, to be sold to both adults and adolescents may also have increased.
Taking into account age, gender, study year and drinking style, the analysis indicated that drinking beer was common among frequent drinkers and heavy drinkers. At the other end of the spectrum, wine was popular among infrequent moderate drinkers. While strong beverages may present a serious issue concerning adolescent drunkenness, beer remains a key part of the adolescent alcohol issue not only because of its popularity, but also due to very limited measures of control for the sales of beer to the under-aged. Low-alcohol beverages such as beer, cider and alcopops can be purchased from every grocery store, kiosk and service station. The law change raised the allowed alcohol content available at grocery stores by 17% from January 1, 2018. It has been estimated that this change is likely to increase population total alcohol consumption by 6% through a process of stronger beer, cider and alcopops replacing milder alternatives (Mäkelä & Österberg, 2017). It is highly likely that the increase will be higher among the under-aged due to the same processes and already increasing adolescent interest in alcopops.
In line with the general trend of decreasing response rates to surveys, the AHLS rates have come down from 78% in the year 1999 to 45% in 2017. This development may have decreased the representativeness of the respondent data set, if the respondents differ from the non-respondents regarding their alcohol drinking. There is some indication that those drinking more heavily are less likely to respond (Kinnunen et al., 2017). Thus, the results may underestimate the prevalence of alcohol drinking and the proportion of beverage types favoured by those drinking heavily. However, item response rate to the question analysed in this study among those who responded to the questionnaire remained high and actually slightly increased from 79% in 1999 to 81% in 2017. In addition to those drinking alcohol more, other groups that are less likely to respond may exist – and consequently cause bias in the results. The age- and gender-specific subgroups differed in their response rates, but this possible bias was reduced by including age and gender in the models predicting beverage type consumption. An open question describing the latest drinking occasion draws from the idea originating from Klaus Mäkelä (1971) rather than a closed question used in reporting, e.g., the ESPAD beverage-specific figures. Over a hundred different ways of describing the beverage consumed, and dozens of ways to describe the amount were identified in the raw data. The full potential of the diverse data was not utilised in the current analyses and could be further looked upon from, for example, a beverage brand perspective. However, deriving the indicators used in the current analyses from a vastly more diverse set increased the validity of results. As the identical open question has been presented in the ESPAD surveys, it would be beneficial to see the data analysed and reported from the 2019 survey to illustrate the effects of the alcohol law change.
Between the years 1999 and 2017, the general trend in alcohol policy was one of gradual tightening. However, a major alcohol tax cut and the abolishment of quotas on passenger imports from other EU countries in 2004 resulted in a 10% increase in population total consumption. Some adolescent-specific action was carried out, e.g., the age limit of 18 years was extended to cover sales of beverages containing even small amounts of alcohol and marketing aiming at adolescents was banned. In addition, the national adaptation of the European action plan included local measures to improve age-limit control in grocery shops. With the step towards lower levels of regulation brought about by the 2018 Alcohol Law in Finland, the situation calls for measures to protect the under-aged from alcohol-related harm. Especially the increased availability of alcopops, products known to appeal to adolescents (Gale et al., 2015), calls for attention to be paid both to marketing and the control of age limits. However, experience from Germany shows that an alcopop tax resulted in a partial substitution of alcopops with beverages associated with riskier drinking patterns (Müller, Piontek, Pabst, Baumeister, & Kraus, 2010). Policy measures should focus on the reduction of total alcohol consumption instead of regulating specific beverages.
Footnotes
Acknowledgement
This research received no specific grant from any funding agency in the public, commercial, or not-for-profit sectors. The data were collected by the University of Tampere with funding from the Ministry of Social Affairs and Health, Finland.
Declaration of conflicting interests
The authors declared no potential conflicts of interest with respect to the research, authorship, and/or publication of this article.
Funding
The authors received no financial support for the research, authorship, and/or publication of this article.