
Abstract
This study compares subjective evaluations of daylighting environments from two universities: the Singapore University of Technology and Design (SUTD) in Singapore and Southeast University (SEU) in Nanjing, China. Two hundred and twenty-nine students evaluated their instantaneous daylighting environments. Four representative daylighting predictors, horizontal illuminance, vertical illuminance, mean luminance of an entire scene and CIE Glare Index (CGI), were matched between two universities using a propensity score matching method. Eighty-eight participants, 44 from each university, were matched in terms of these four daylighting predictors. The results demonstrate that there are statistically significant differences in subjective assessments between these two locations. Under quantitatively similar daylighting environments, more participants at STUD reported adequate daylighting levels with a noticeable degree of daylight glare, as well as desires to decrease current daylighting levels. On the other hand, more participants at SEU reported inadequate daylighting levels with an imperceptible degree of daylight glare, as well as desires to increase current daylighting levels. One reason for subjective assessment differences might be dissimilar socio-environmental contexts, where the participants are acclimatized to different daylighting environments between Singapore and Nanjing.
Keywords
Introduction
Studies have demonstrated the influences of physical environments in classroom settings on students’ attendance and learning efficiency.1–3 Of greater significance, lighting quality could affect students’ performance and well-being in both short-term and long-term, 4 which have been explored by multiple studies.5–7 By comparing over 10,000 students’ outcomes of the Iowa Test of Basic Skills from 71 schools, Tanner 5 found that daylight had significant effects on students’ variance in Science and Reading vocabulary scores. A positive relationship was found between students’ performance scores and design factors associated with daylight, including the type of window shading, percentage of window facing south, window glazing and the window-to-floor area ratio. 7
Students preferred southern orientations of glazing even with a risk of overexposure to direct sunlight to a certain extent. 8 The importance of daylight within educational buildings prompted many studies to explore effective tools9,10 and methods11,12 of creating comfortable daylighting environments. Daylighting design metrics are globally used with straightforward standards for architects and designers across different countries.13–15 Work performance in relation to lighting environment in office buildings has been reported. 16
A quick search concerning daylighting design standards across different nations demonstrates the application of diverse daylighting design metrics and their thresholds. For example, vertical eye illuminance is emphasized in North America 14 and Europe 15 due to the wide use of computers and laptops, 17 which has converted working planes from the horizontal to the vertical. Singapore has recommended detailed climate-based daylight metrics (CBDMs) for the assessment of non-residential buildings based on Daylight Autonomy. 18 However, GB 50033-2013, Chinese Standard for Daylighting Designs of Buildings 13 only specifies thresholds of point-in-time illuminance and daylight factor (DF) based on a horizontal working plane. For example, the requested horizontal illuminance and DF for classrooms in Daylight Zone 4 are 450 lx and 3.3%, respectively. 13 One way of advancing the Chinese Standard for daylight is to examine and employ international vertical eye illuminance that has been explored, proposed and validated by global researchers for years19–21 as well as CBDMs. However, one important factor that potentially influences the global generalization of daylighting design metrics is socio-environmental contexts, defined as ‘the climate and habitat (interior and exterior) to which a person has acclimatized and their behaviour and expectations towards these elements’ by Pierson et al. 22
Two types of studies have demonstrated the impact of socio-environmental context upon subjective daylighting evaluations: indirect ones and direct ones. The indirect studies compared their research conclusions to previous studies, both of which were conducted under diverse regions by different research teams. Early in 1964, Ichikawa and Chonan 23 proposed a higher average threshold of brightness between comfort and discomfort, for the Japanese participants, than for the North American participants as proposed by Luckiesh and Guth. 24 Iwata et al. 25 found that the glare sensation votes were lower for the Dutch participants than for the Japanese participants. 26 Liu 27 noticed that a lighting source with higher CCT might result in a more lively room atmosphere for Chinese observers but less lively for Dutch observers. 28 It is uncertain whether different research teams from diverse regions conducted their research following the same procedures and settings. In other words, it is difficult to control multiple research variables, especially between multiple groups of researchers.
On the other hand, direct studies compared subjective lighting assessments under multiple socio-environmental contexts in one study. In that case, researchers could better control experimental environments and research procedures, and then draw confident conclusions concerning socio-environmental contexts. However, controversial conclusions have been drawn from these studies. 29 Kim and Mansfield 30 proposed different appraisal paths of lighting environments in cafés between London and Seoul. The appraisal path refers to the psychological effects of light leading from appraisal through preference and mood to health and well-being, which was proposed by Veitch, Newsham and Jones. 31 The other path of this linked mechanism map is the vision path. In contrast, Schielke 32 concluded similar subjective lighting impressions among participants from Europe, America, Middle East and Asia through an online survey, whose ratings of lighting impressions for a salesroom were, respectively, strongly correlated. Moscoso 33 reported significant differences in pleasant and calm evaluations between participants in Greece and Norway, as well as between Greece and Switzerland in terms of window sizes. However, the perceptual impressions of façade and daylighting patterns were similar amongst Norway, Switzerland and Greece. 34 Pierson et al. 22 pointed out that no evidence suggested an influence of socio-environmental context on discomfort from daylight glare across Chile, Belgium, Japan and Switzerland. Different research methods and sample sizes of these studies might contribute to the inconsistent conclusions of socio-environmental contexts. 29 Nonetheless, studies that have revealed the influences of socio-environmental contexts or regional differences in some papers,33,34 do demonstrate the necessity for further exploration.
To lay the foundation for employing daylighting design metrics abroad, Singapore was selected in this study as a reference location due to its Asian culture and climate. Singapore is located near the equator with a tropical rainforest climate, which is different from most of the cities in China. Established from multiple field studies,35–38 daylighting design metrics for educational buildings 18 proposed by the Building and Construction Authority of Singapore is a good reference for further employment. Additionally, Nanjing under subtropical skies was selected in this study as it is representative of Daylight Zone 4 in China. 13 Of the five daylight zones, Daylight Zone 4 has the most cities with high density populations. 13 In other words, Daylight Zone 4 is a representative zone in China. Nanjing and Singapore differ in two aspects: climate and interior habitat. 22 Concerning the climate, Singapore does not have distinct seasons but exhibits monthly solar irradiance varying between 101 kWh/m2 and 164 kWh/m2, 39 while Nanjing exhibits monthly solar irradiance varying between 47.2 kWh/m2 and 159.5 kWh/m240 in four distinct seasons. Due to the diverse solar radiations throughout an entire year, buildings in these two locations demonstrate dissimilar responses to daylight and create different interior habitats. Based on the authors’ observations, buildings in Singapore are usually well-protected from solar radiation and direct sunlight. Higher educational buildings and offices often have both exterior and interior shading systems, which lead to relatively low distributions of daylight.35,36,38 On the other hand, buildings in Nanjing are not as well-protected as the ones in Singapore in terms of solar control, partially due to occupants’ need for solar heat during rainy days and winter seasons. Most educational buildings only have manually controlled interior roller shades, which lead to occasional sunlight penetration. Differences in climates and daylighting designs for classrooms between Singapore and Nanjing satisfy the definition of socio-environmental context, 22 which might be reflected by subjective assessments.
Therefore, this study aimed to compare subjective assessments of daylighting environments by matching daylighting quantities of two socio-environmental contexts, Singapore and Nanjing. The research question is: ‘Are there subjective evaluation differences concerning daylighting environments between two universities while students conduct computer-based tasks?’ This field study collected valid subjective assessments from 229 architecture students in two socio-environmental contexts. Then, 88 participants, 44 from each university, were matched in terms of daylighting predictors for comparing subjective assessments.
Materials and methods
Research design
This field study compared subjective assessments of daylighting environments under two socio-environmental contexts: Singapore and Nanjing. Subjective assessments of daylighting environments were collected through a digital survey at both the Singapore University of Technology and Design (SUTD) and Southeast University (SEU). Evaluations of students’ experience of daylighting distributions were either by simulation using calibrated models (SUTD)35,38 or measurement onsite (SEU). 41 Representative daylighting predictors were measured or extracted from high dynamic range (HDR) images. 42 Each participant’s responses to a survey questionnaire were associated with the daylighting condition that he/she experienced and evaluated. Then, a data-matching method, a propensity score matching (PSM) analysis,43,44 was applied to daylighting predictors to ensure quantitatively similar daylighting conditions before comparing subjective responses.
To minimize the effects of confounding variables, two controls were made for the research. First, the selection of participants at both SUTD and SEU were controlled. Both groups of participants were healthy undergraduate and graduate students majoring in architecture and design. Participants’ physical conditions and professional understandings of daylighting quality were similar. Second, participants’ visual tasks were controlled. All participants were instructed to complete the questionnaire by using their computers or laptops. In that case, visual tasks of screen-based performance for all participants were ensured. The following sections explain the procedure of collecting subjective and objective data at SUTD and SEU, respectively.
Classrooms at SUTD and SEU
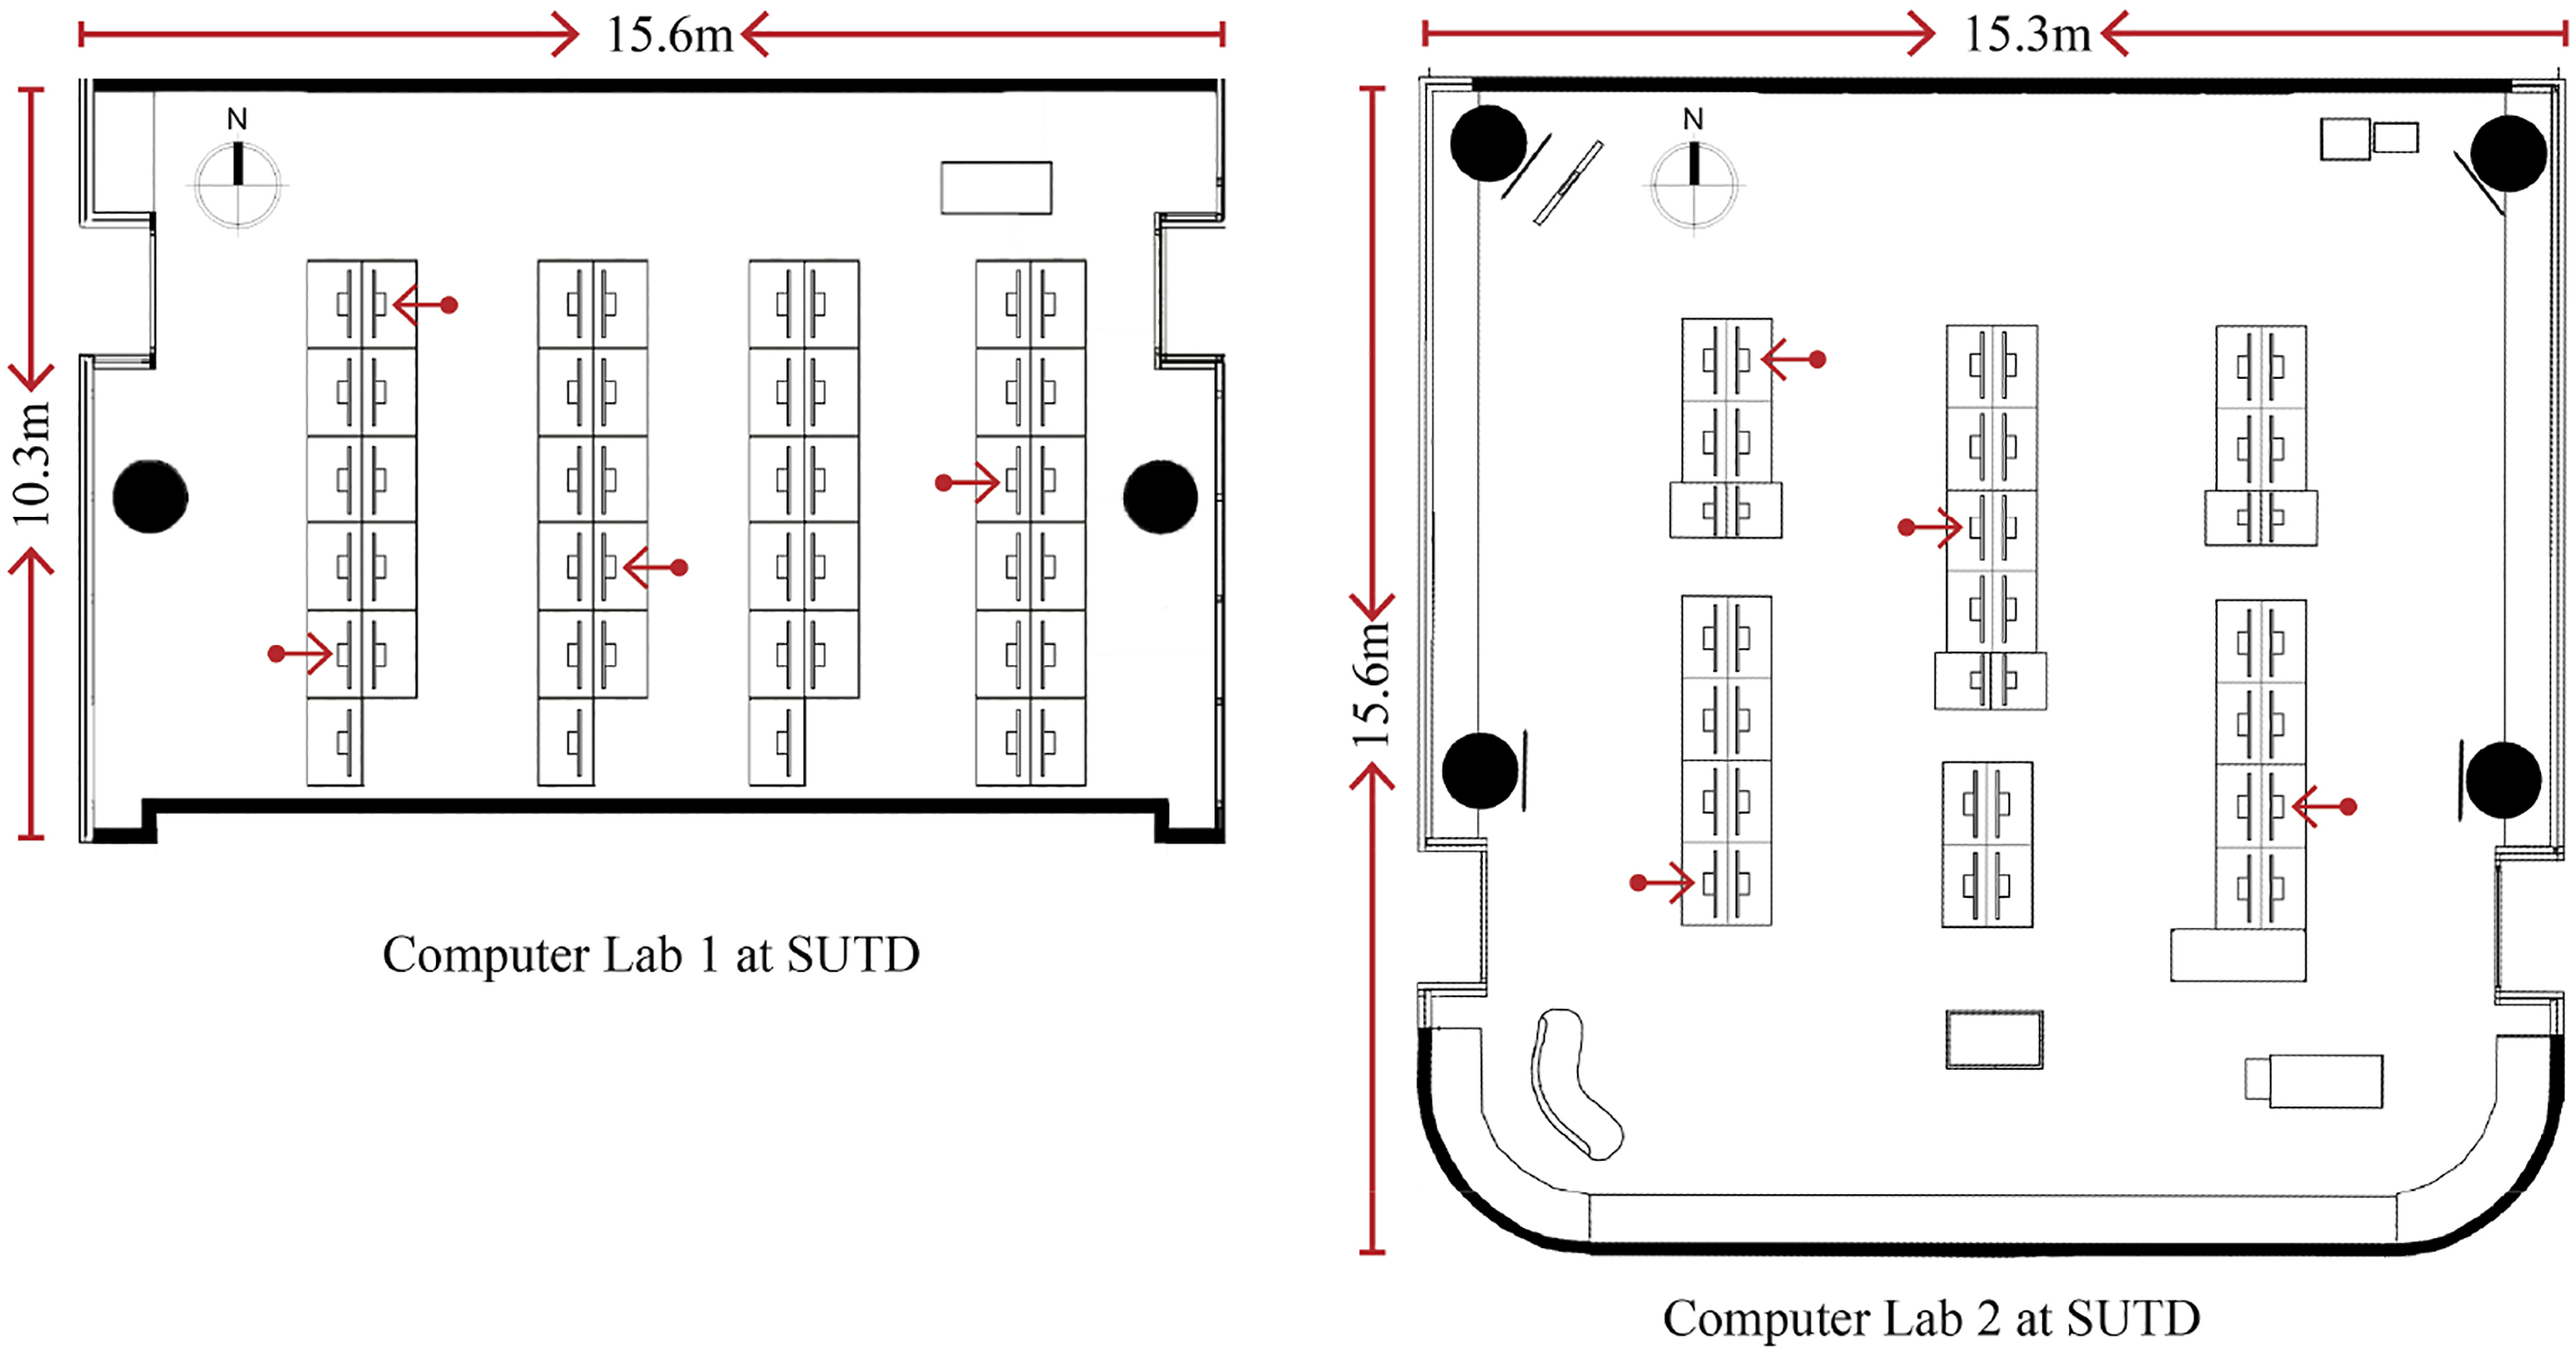
At SUTD (1.34°N, 103.96°E), the study was conducted within two computer labs, where students took classes and accomplished their individual or group work. Figure 1(a) shows the locations of two computer labs (red blocks) on the sixth floor, which are at the centre of the figure-eight shape building layouts. Therefore, the exterior views of both window sides are mainly opposite hallways and classrooms (Figure 1(a)). Figure 2 presents the dimensions, layouts and desk arrangements of the computer labs. Both computer labs are east-and-west orientated with double-sided windows. The height between the floor and the suspended ceilings in both classrooms is 3 m. The window-to-wall ratios (WWR) vary between 48% and 54%. Both computer labs have exterior overhangs and circulation spaces varying between 2.1 m and 2.5 m, which effectively block direct sunlight from penetrating into the spaces. Additionally, both sides of the windows in each computer lab have interior roller shades, which are manually controlled by occupants. Classroom locations and exterior views for (a) STUD and (b) SEU. The layouts of two computer labs at SUTD.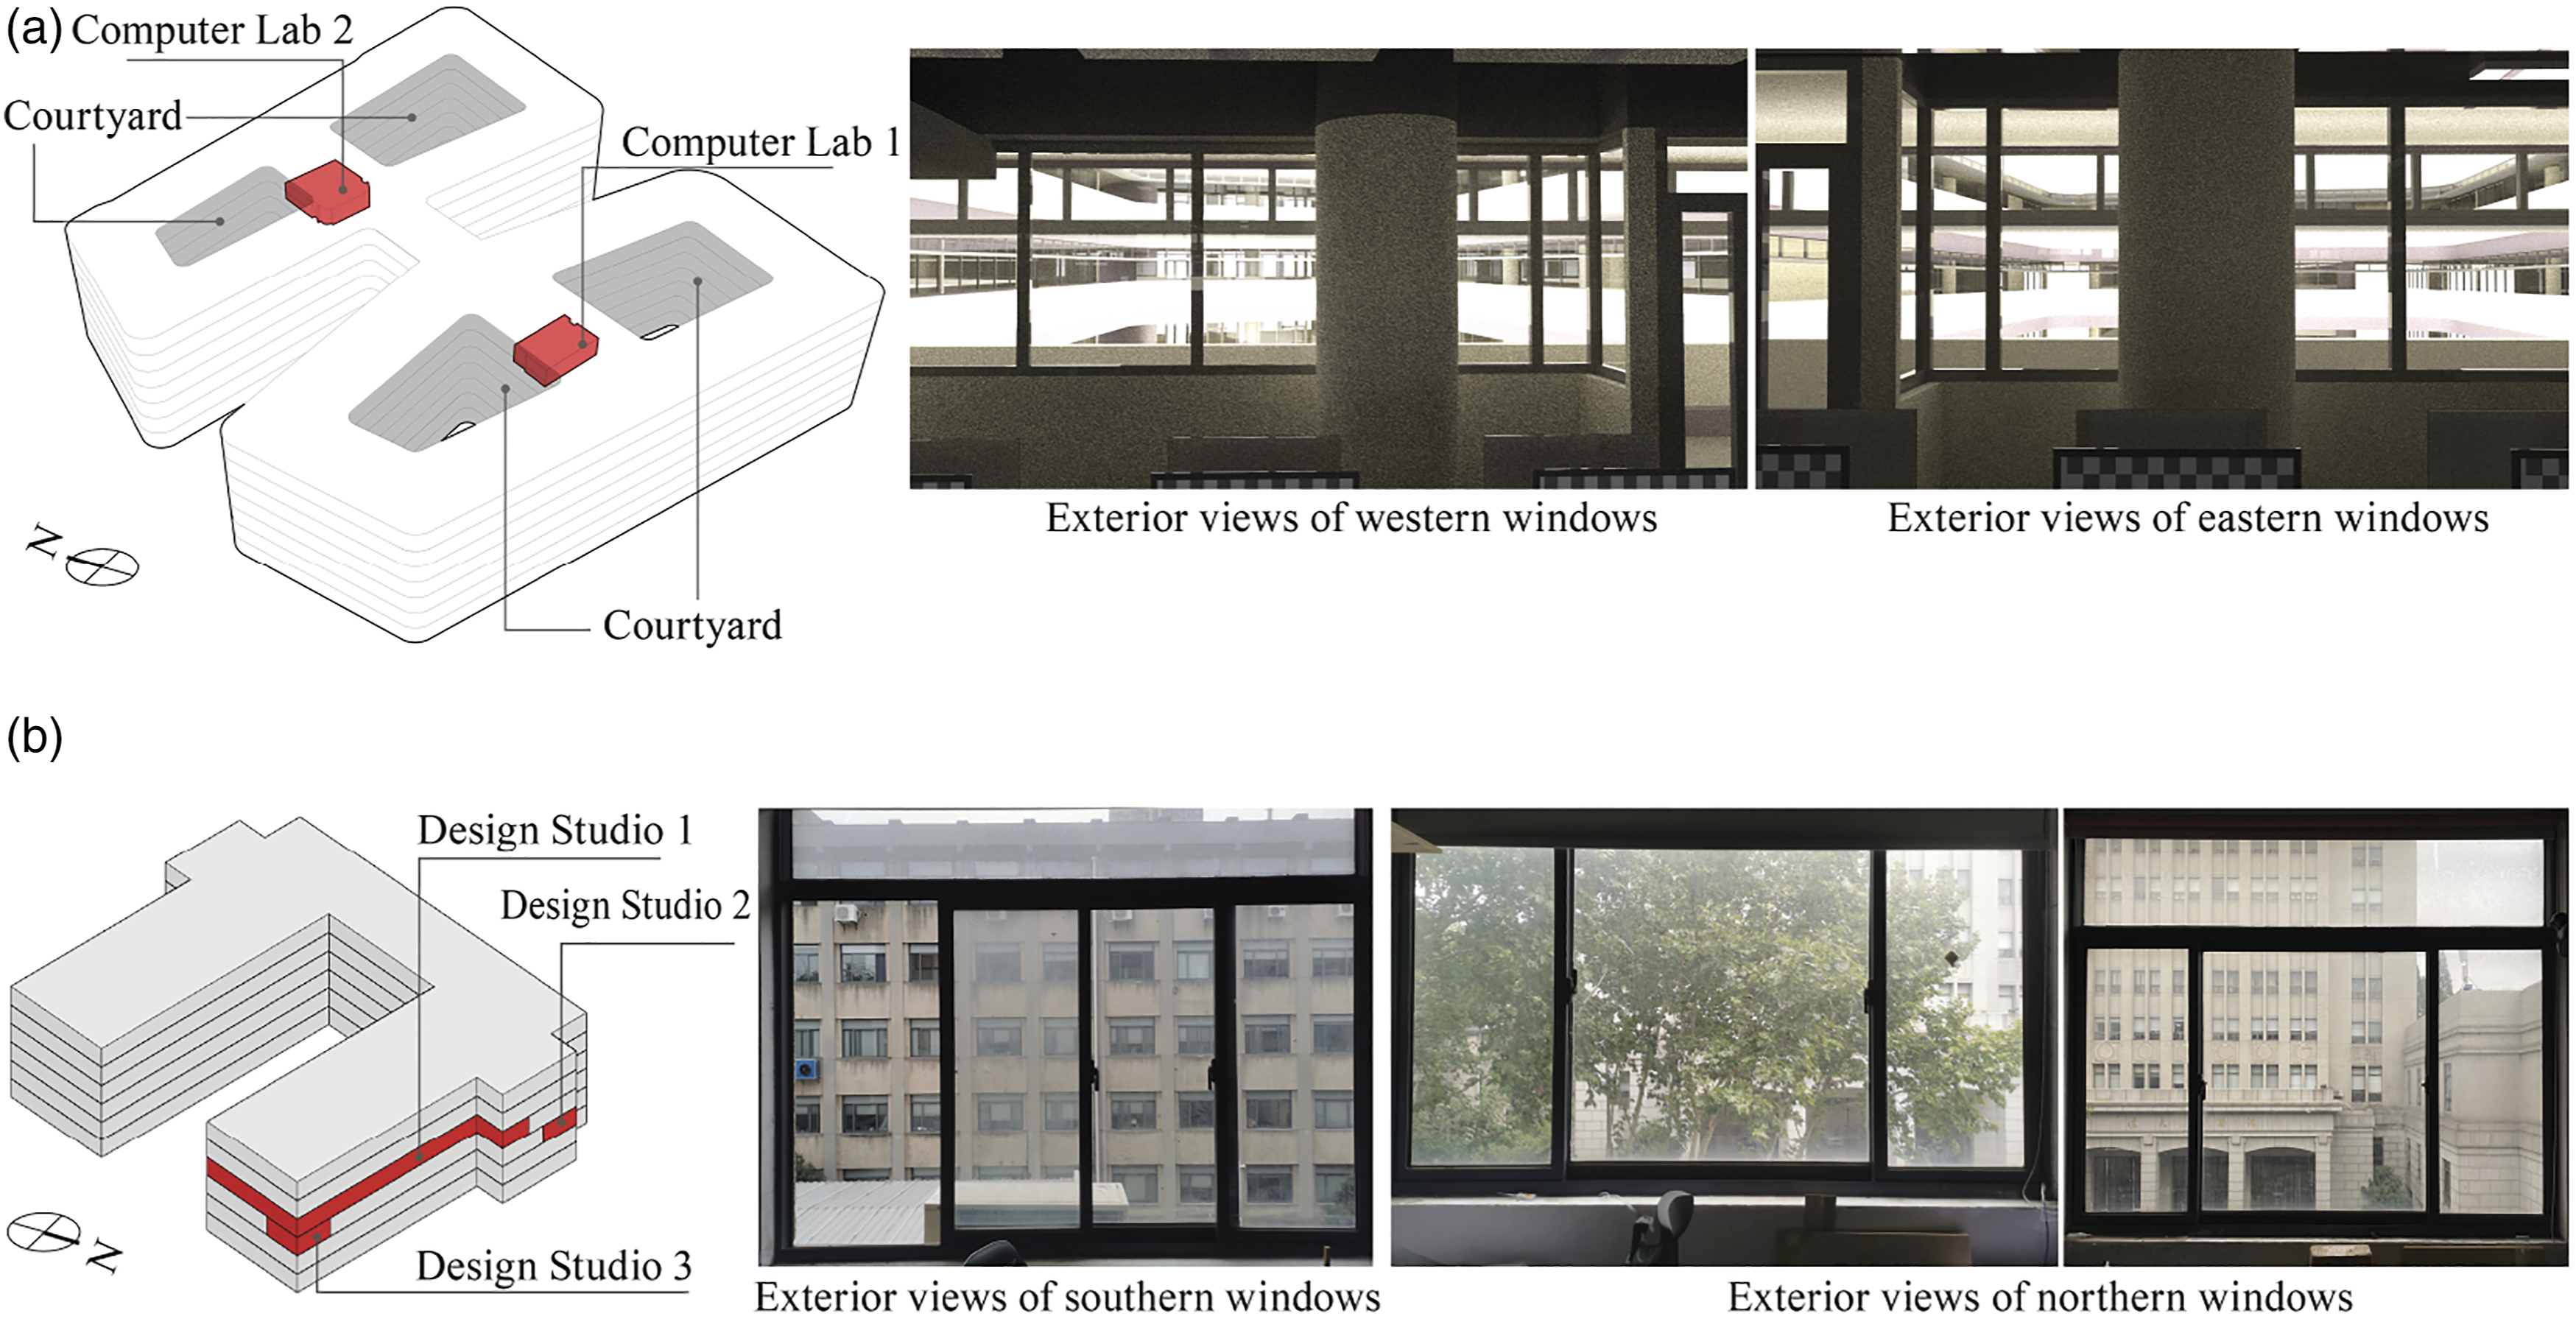
At SEU (32.06°N, 118.80°E), the study was conducted within three design studios, where students took design classes and worked on their design projects. Figure 1(b) presents the locations of these design studios (red blocks). Design studio 1 is on the fourth floor, and the other two are on the third floor. Due to the high density of the buildings on campus, the exterior views outside of both northern and southern windows are the surrounding buildings and trees (Figure 1(b)). Figure 3 presents the dimensions, layouts and desk arrangements of three design studios. Design Studio 1 is north-and-south orientated with double-sided windows. Design Studios 2 and 3 are north-oriented with single-side windows. Classrooms height for all three design studios is 3.5 m. The WWR is around 37%. These three design studios have no exterior shading devices but interior manually controlled roller shades, which were sometimes lowered by students sitting by the windows. The layouts of three design studios at SEU.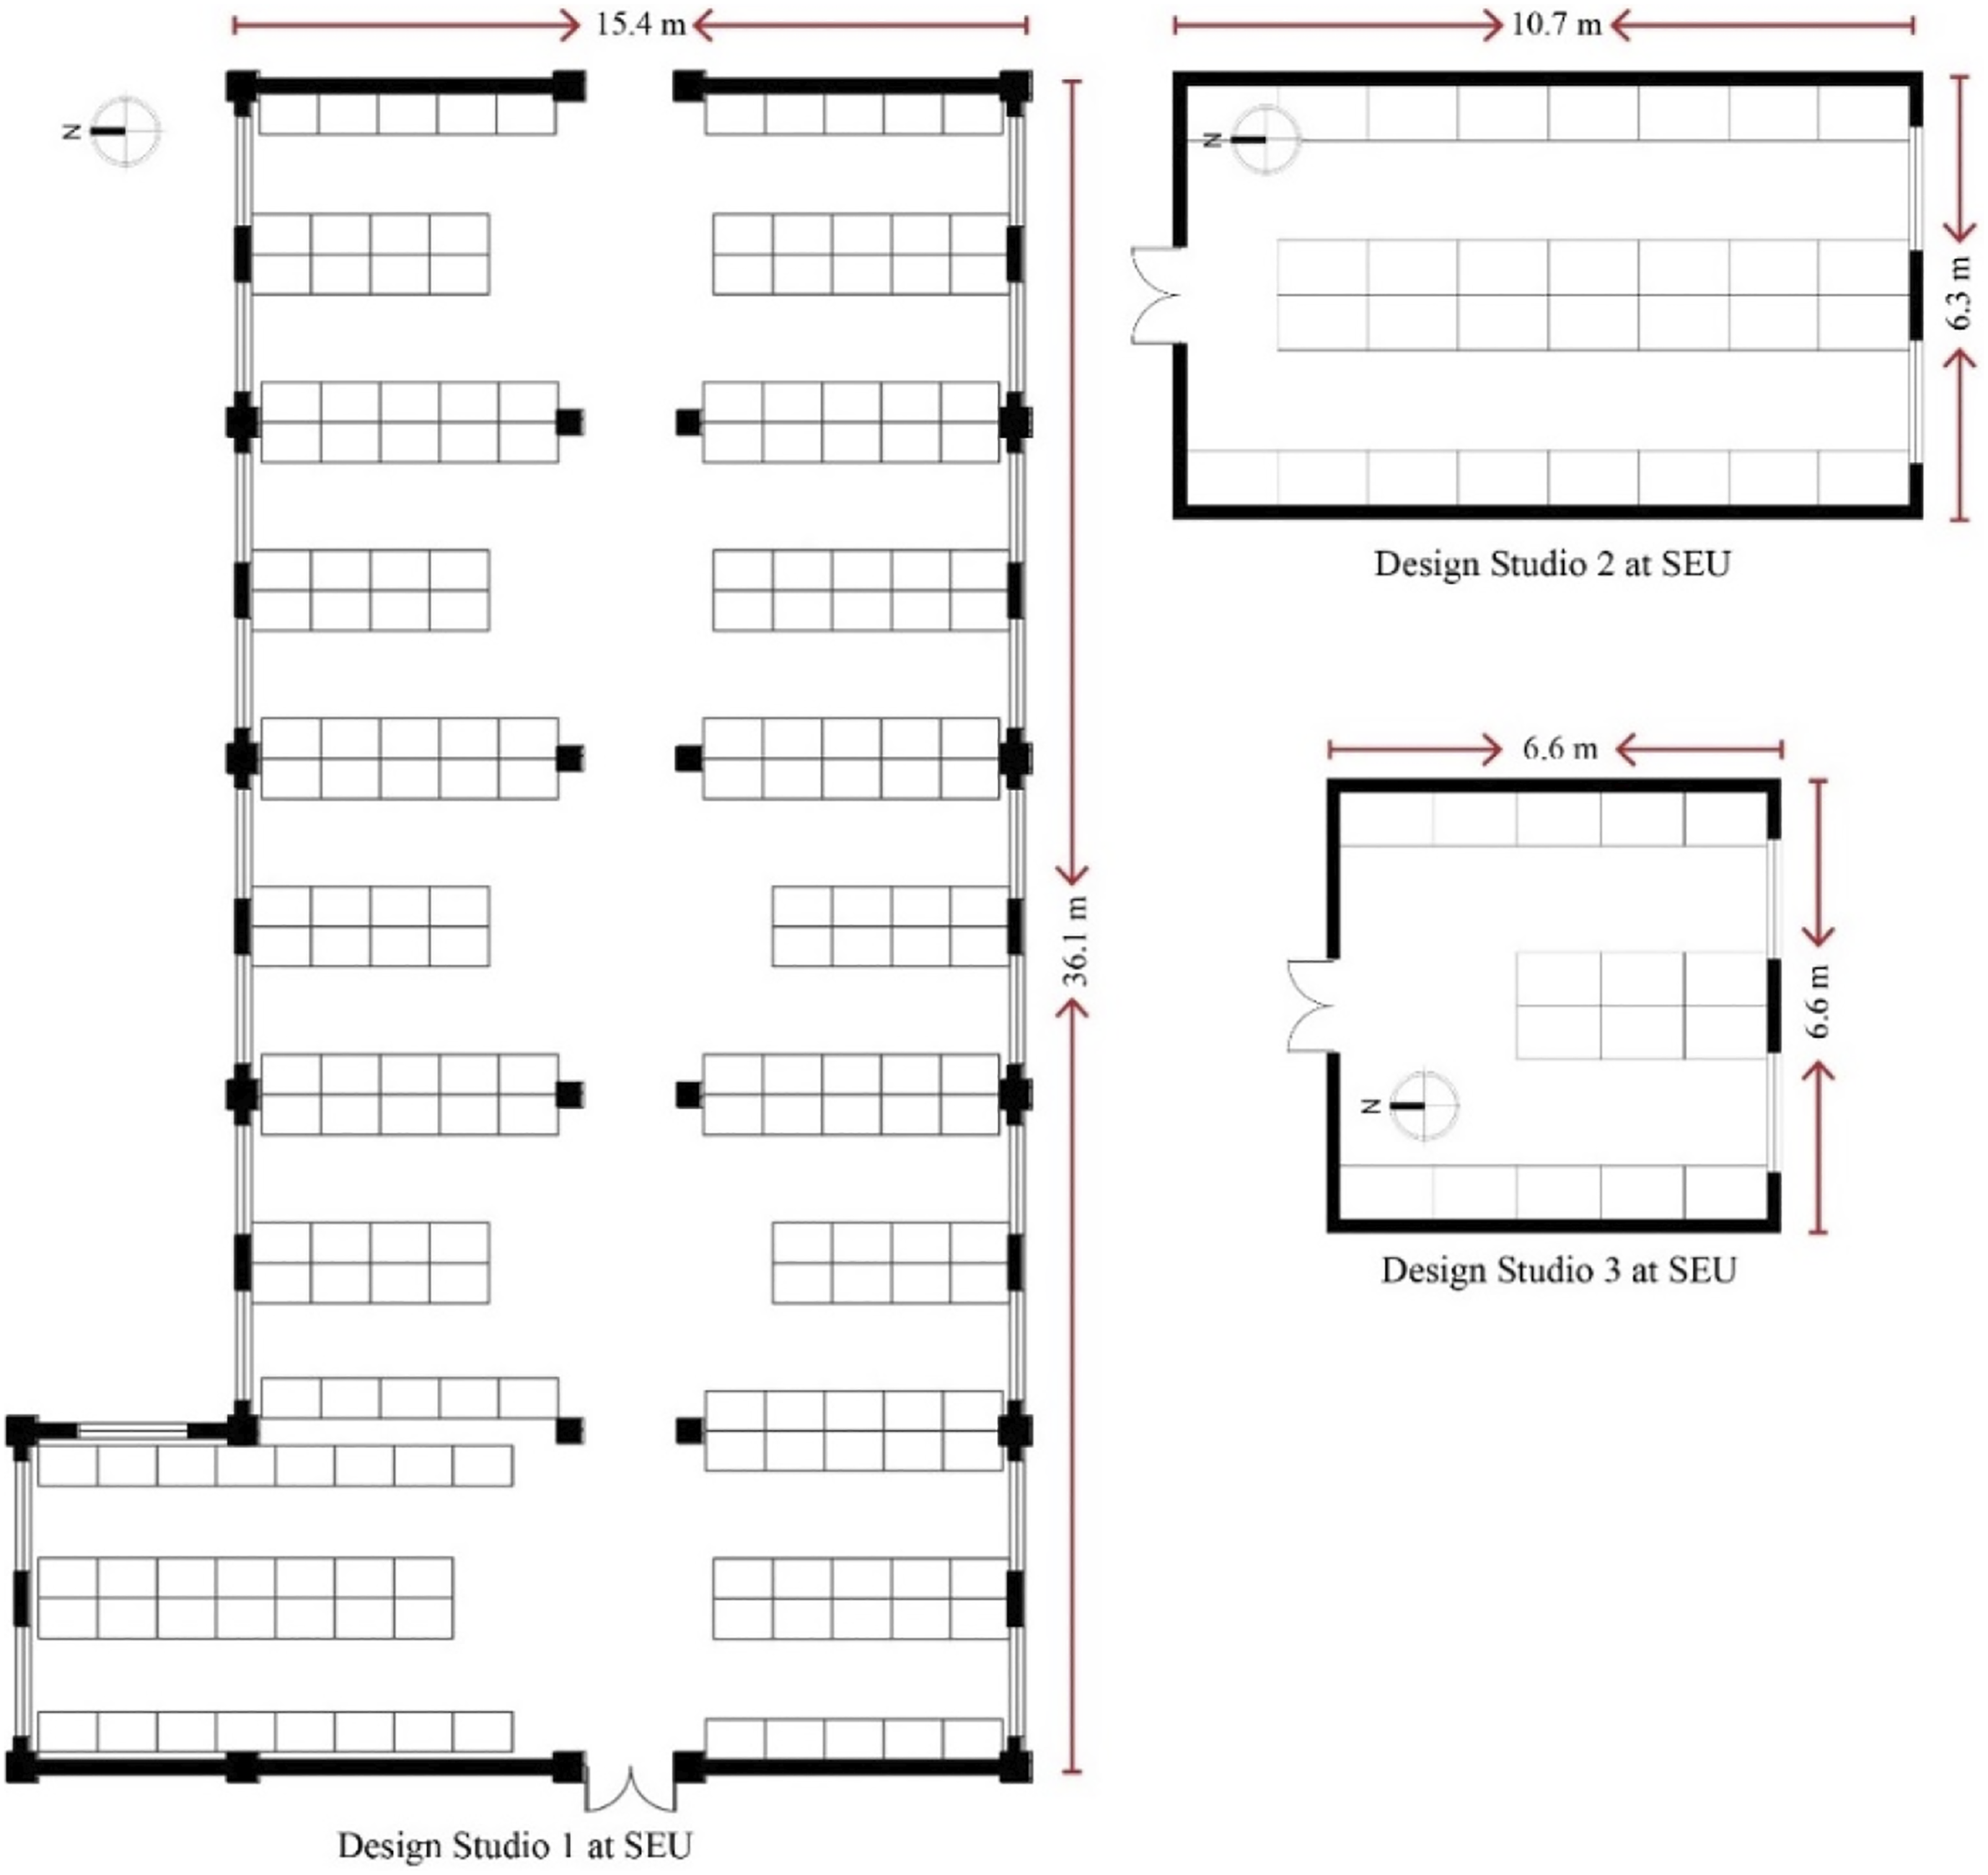
Questionnaire
Survey questions for evaluating daylighting environments and assigned values to the associated choices.
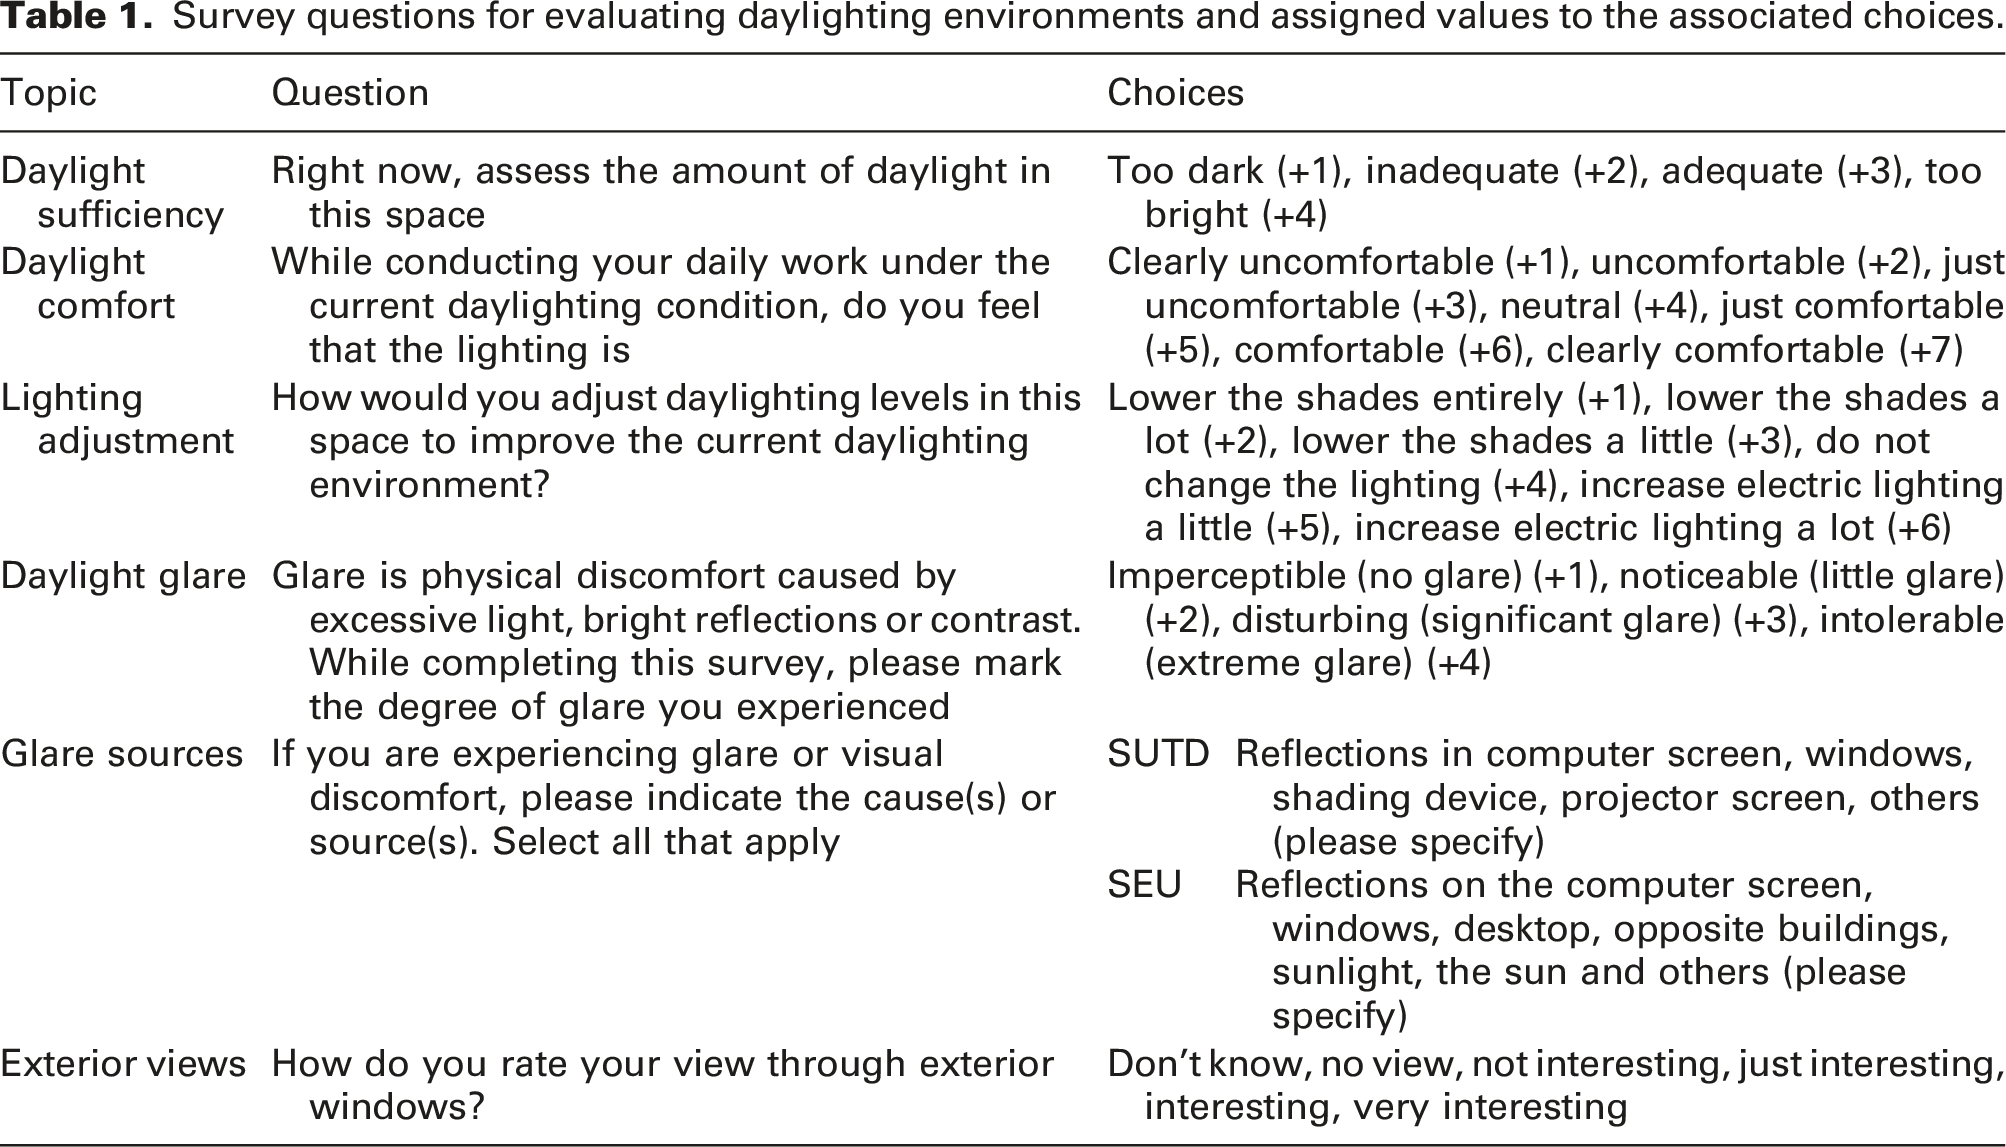
As the field study at SUTD was conducted first, the English questionnaire was translated into Chinese afterwards. In order to guarantee the accuracy of questionnaire translation from English to Chinese, the questionnaire was translated into Chinese by three investigators, and then the Chinese version was translated back to English by other three investigators. If any Chinese-to-English question was different from the original one, the translation was redone to ensure no translation errors. The research procedure and questionnaire were approved by the Institutional Review Board approval for both SUTD (the approval number is 16-115) and SEU (the approval number is 2022ZDSYLL389-P01).
The minimum required sample size in each socio-environmental context was estimated through the software G*Power 3.1. 47 For the estimation, it was assumed that the main statistical analysis would be a two-tailed Wilcoxon–Mann–Whitney test with a Type I error rate of 0.05, a power of 0.8 and the effect size d of 0.5. The minimum required sample size for each socio-environmental context was 67, which resulted in 134 participants for both socio-environmental contexts.
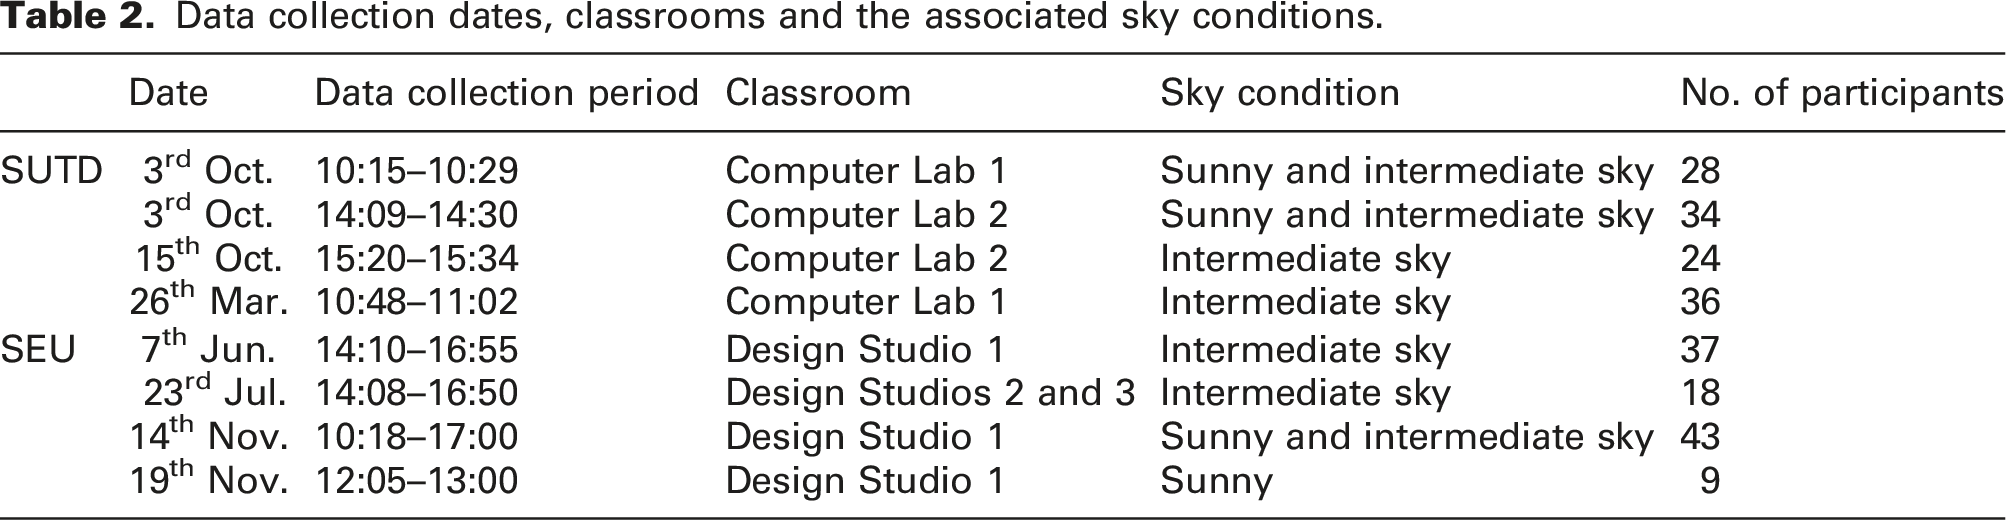
Figure 4 presents the annual global horizontal solar irradiance measurements on site, along with the red dots representing the time for data collection. Table 2 shows the dates and sky conditions while collecting data. At SUTD, 152 participants filled the questionnaire. Thirty incomplete questionnaires were removed, which resulted in 122 valid questionnaires from the third or fourth year of undergraduates. At SEU, 125 participants filled the questionnaire. Seven were removed due to dynamic variations of daylight with a difference of measured vertical illuminance before and after taking HDR images greater than 10%.
48
Five were removed due to the use of either a tablet or a phone while filling the questionnaire, and six were removed due to participants’ less than 2 years of staying in Nanjing. The valid questionnaires in Nanjing were 107. All the participants’ background information was checked to ensure that none of them had spent less than 2 years in their socio-environmental context while filling the questionnaire, the least amount of time for a person to acclimate to a socio-environmental context.49,50 Global horizontal solar irradiance average for each month in Singapore and Nanjing, where the red dots represent the time of data collection at SUTD and SEU, respectively. Data collection dates, classrooms and the associated sky conditions.
Daylighting predictors at SUTD and SEU
According to the observation before data collection, the computer labs were occupied by students taking courses during the daytime. Students worked on their individual or group assignment in the computer labs after class at night, which was inappropriate for examining daylighting quality. Therefore, the subjective data was collected before or after each class, and the associated objective daylighting data was generated by using accurate simulation models to shorten the period of data collection and minimize disturbance in class. The applicability and effectiveness of this one-time-measure and calibration procedure has been validated by Quek and Jakubiec.
51
First, HDR images at eight seating positions in two computer labs were taken by a Canon COS 5D Mark III with a SIGMA f/3.5 fisheye lens. The procedure and settings of taking HDR images followed the instruction proposed by Inanici and Jakubiec.42,48,52 The eight seating positions were widely distributed within two computer labs, as shown by the red arrows in Figure 2. Vertical illuminance in front of the lens was measured twice by using a Konica T-10A. The luminance values upon a 18% grey card in the field of a view was measured two to three times while taking HDR images by using a Konica LS-150. Geometry models of both computer labs were generated in Rhino and exported to Radiance for simulations. Interior and exterior opaque materials were measured by using a reflectance spectrophotometer.
53
Glazing transmittances were measured onsite by taking multiple paired illuminance measurements in front of and behind the glazing. Luminance distributions of computer screens at the eight seating positions were also measured and calibrated. Given the variation of luminance upon computer screens, the average luminance of these eight calibrated screens was used. Detailed data can be found in Kong et al.38,54 A weather station located on the roof of SUTD continuously logged global horizontal solar irradiance when taking HDR images and collecting survey data. Second, simulated luminance maps were visually compared to the HDR images for repeatably improving the accuracy of simulation results. Figure 5(a) illustrates the luminance distributions of HDR images and simulated luminance maps generated by the calibrated models. Simulated Ev were compared to measured Ev. Eight groups of calibration Ev resulted in a relative mean bias error (MBErel) of −0.3%, meaning that the simulated values were on average 0.3% smaller than the measurements, along with a relative root mean square error (RMSErel) of 8.5%. As the MBErel and RMSErel are lower than 20%, the illuminance and luminance quantities simulated by the calibrated models can accurately represent real lighting environments.55–57 (a) False-colour images of HDR images and simulated luminance maps at SUTD and (b) HDR images and the associated false-colour images at SEU.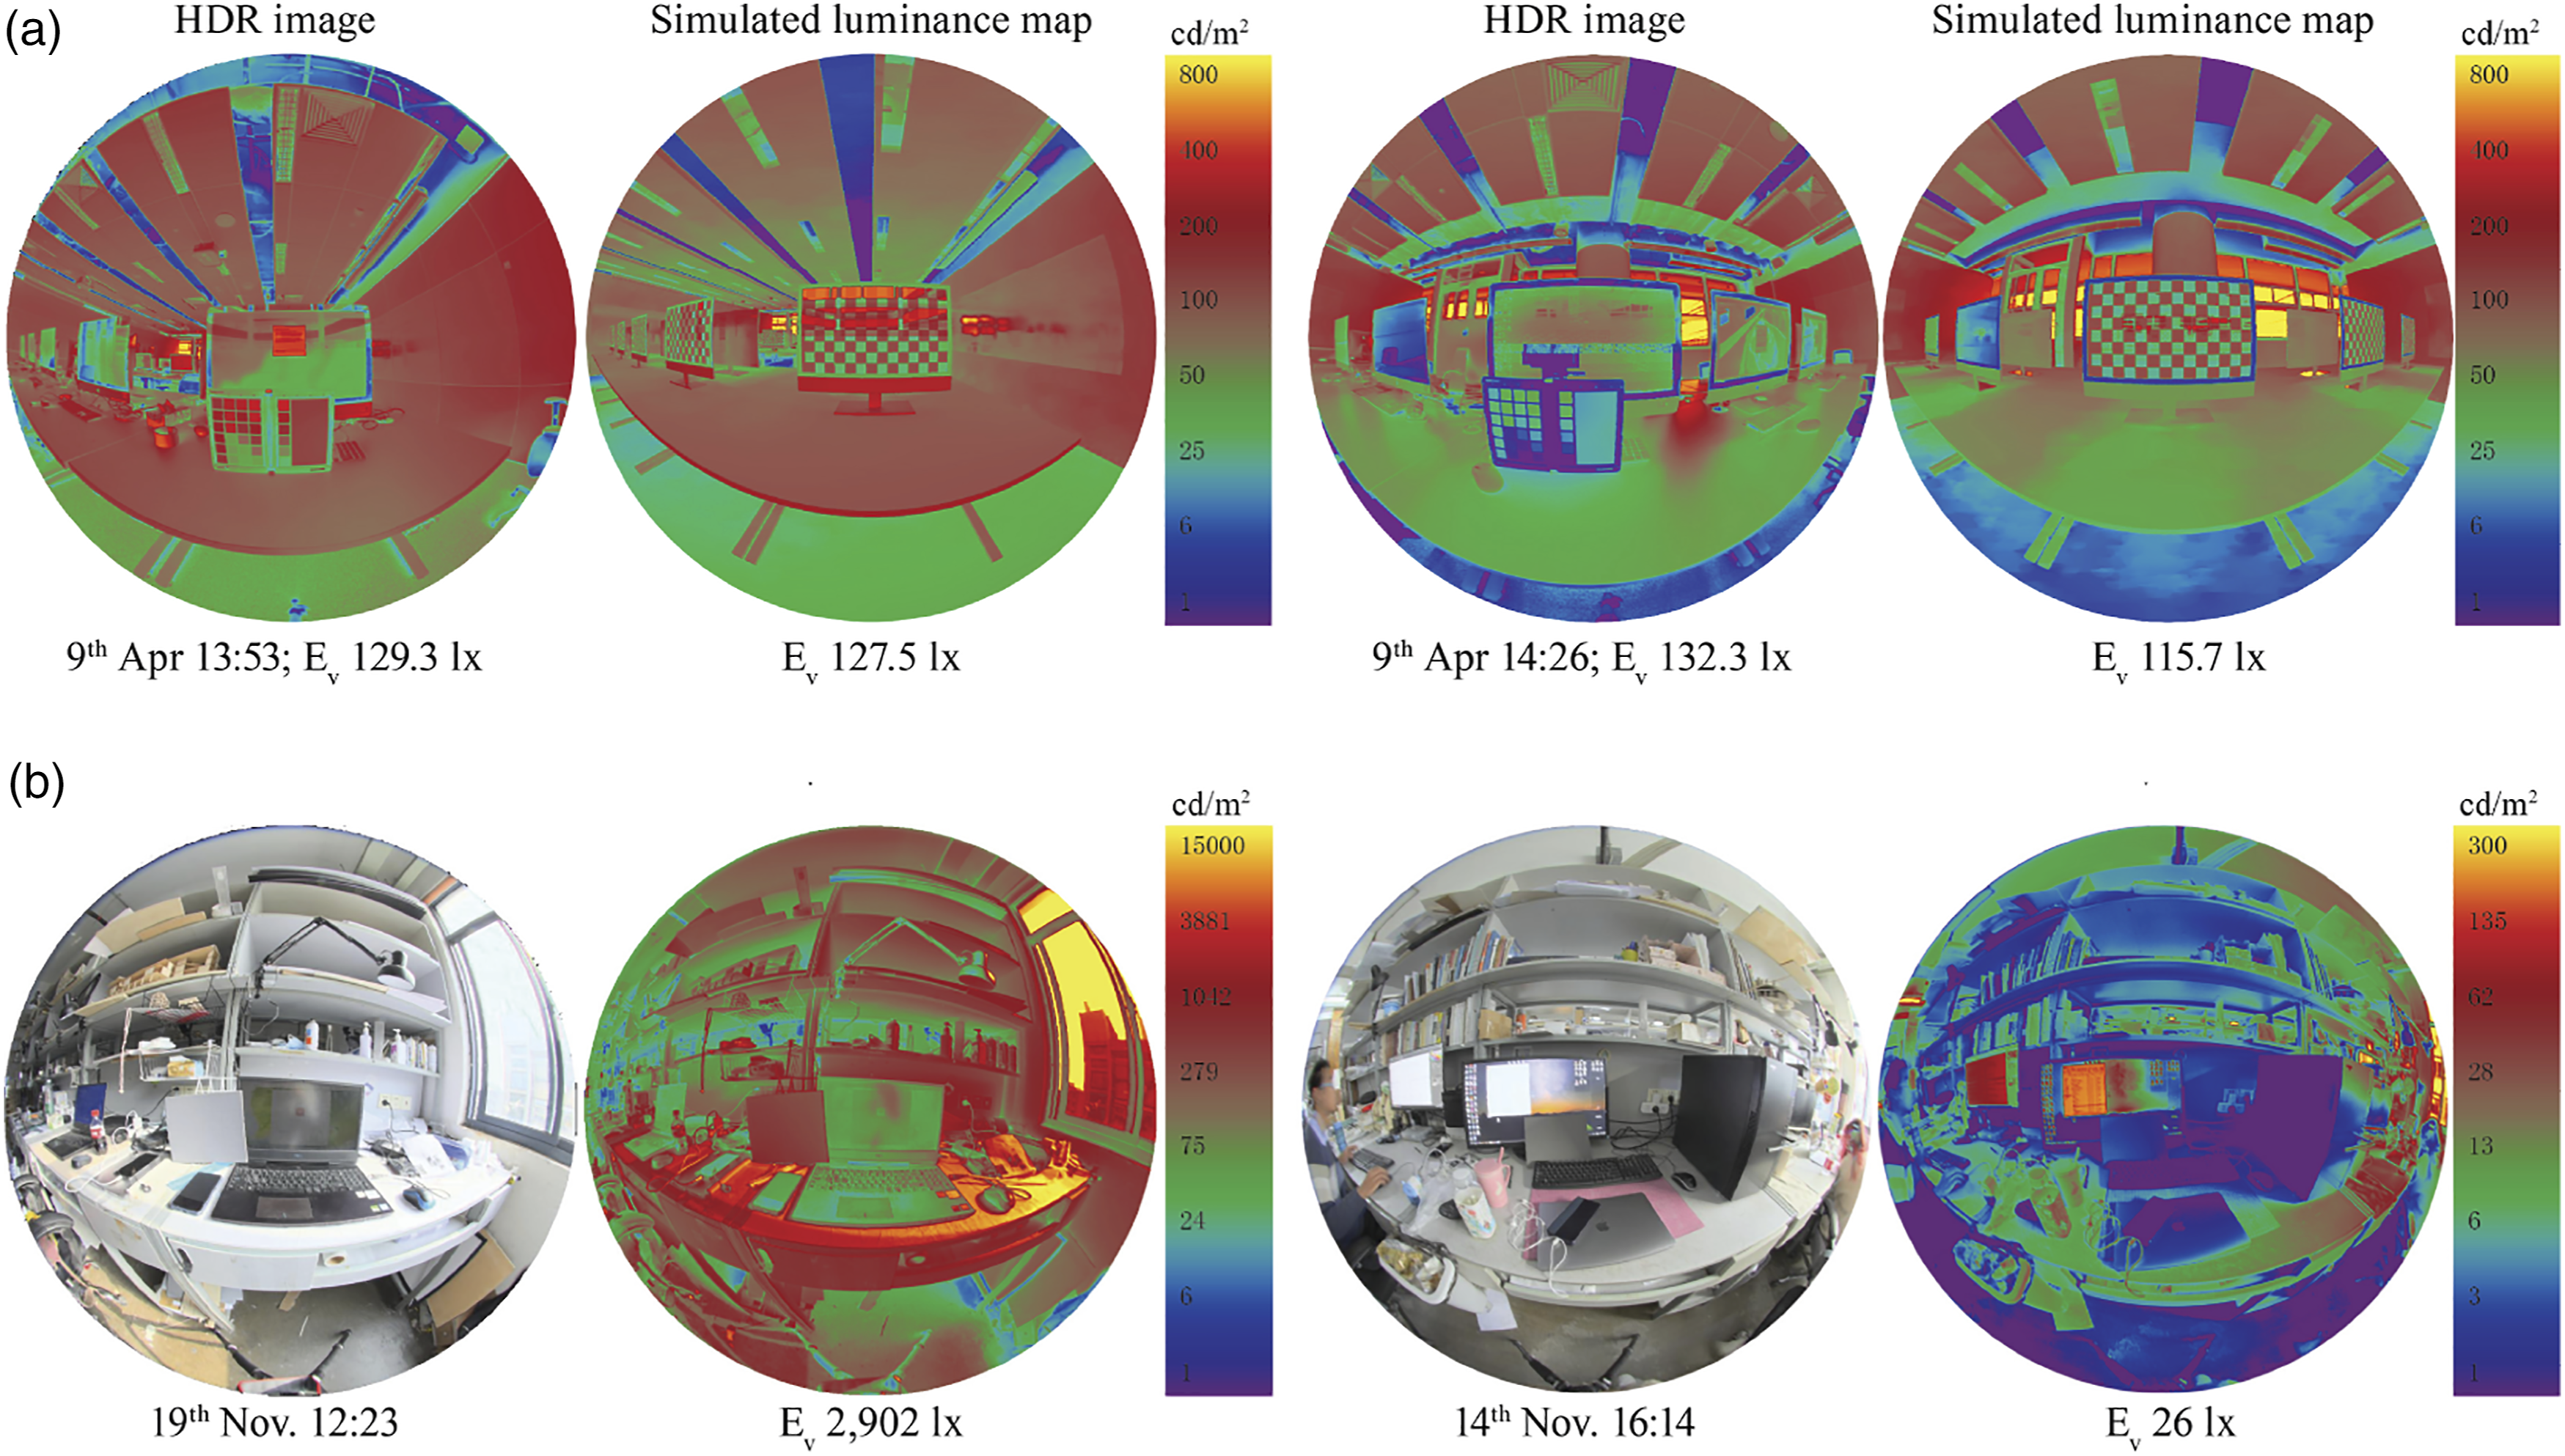
Finally, daylighting data relevant to each participant while filling the survey was simulated according to the survey-filling time and seating position. The submission time of each questionnaire recorded by the SurveyMonkey was extracted for creating the Perez sky.
58
Representative daylighting predictors of horizontal illuminance on a workplane (Eh), vertical eye illuminance (Ev), mean luminance of an entire scene (Lmean), Daylight Glare Probability (DGP)
59
and CIE Glare Index (CGI)60,61 were simulated. The dimensions and locations of Eh and Ev are shown in Figure 6 in black numbers. Eh, Ev and Lmean were selected due to their capability of predicting subjective assessments according to the previous analyses.35,38 DGP was selected due to its highest performance amongst the 22 glare prediction metrics.
62
CGI was selected due to its highest performance amongst the contrast-driven metrics under both dim and bright conditions.
63
Locations and dimensions of Eh and Ev for SUTD (in black numbers) and SEU (in red numbers) at a seating position.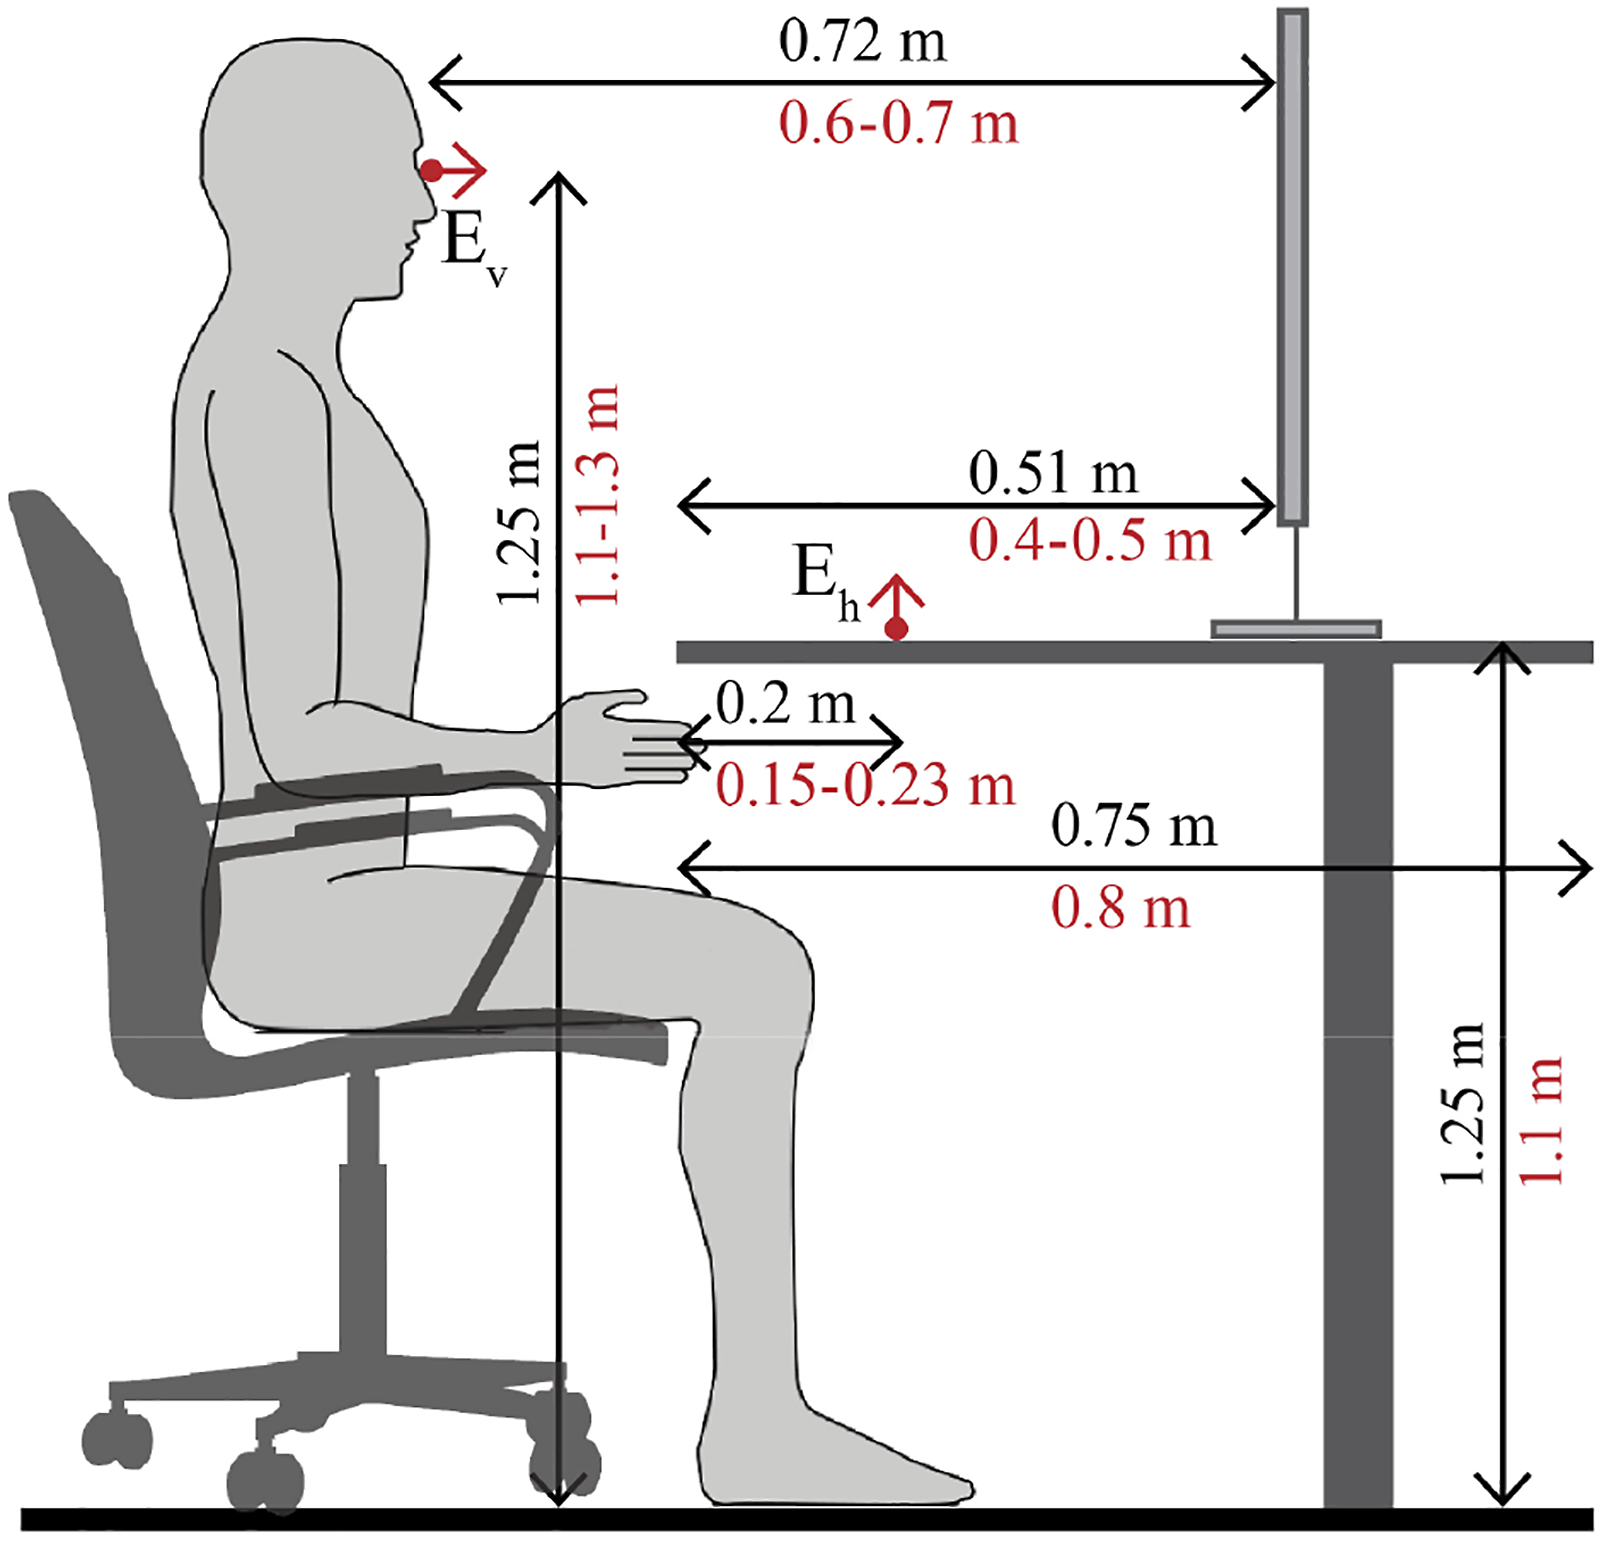
At SEU, students in design studios were surveyed outside of class time. Since no time limit was given while collecting both subjective and objective data, the questionnaire was distributed to each participant, and daylighting data was immediately measured after one participant completed the questionnaire. In that case, daylighting environments generated by simulation models at SUTD and recorded by measurements at SEU were similar times relative to the completion of the questionnaire. Eh, Ev and HDR images were collected in consequence. 41 Lmean, DGP and CGI were later extracted from the calibrated HDR images. As shown in Figure 6 in red numbers, the locations of measured Eh and Ev slightly varied according to individual seating habits. Figure 5(b) shows the HDR images and associated false-colour images for SEU.
Data analysis
The Kolmogorov–Smirnov test was applied to test the distributions of subjective responses and daylighting data at both SUTD and SEU. Since none of the p-value was greater than 0.05, neither daylighting data and subjective responses at SUTD nor at SEU followed normal distributions.35,38,41 The data analysis procedure included three steps: data matching, variance analysis and logistic regression analysis. Propensity score matching (PSM) was used for data matching. PSM was introduced by Rosenbaum and Rubin 64 and has been widely used in a diverse assembly of disciplines, such as economic, medicine, statistics and marketing. 65 By matching data based on selected covariates between the control (untreated) group and treated group, the bias can be eliminated, and the treatment effect can be estimated. 66 The purpose of this study was to extract and compare subjective responses between SUTD and SEU under quantitatively similar daylighting environments. Different subjective assessments of daylighting environments were considered as the treatment effect caused by socio-environmental contexts. However, biases of subjective responses were potentially caused by two aspects: experimental procedures and daylighting quantities. As introduced in the Research Design section, both experiments were conducted by the authors to guarantee the same experimental procedure. The demographic information of the sample groups, as well as their visual tasks, was controlled similarly. Moreover, daylighting quantities varying in diverse ranges certainly result in dissimilar subjective evaluations. To minimize the biases of subjective evaluations caused by diverse daylighting quantities, a PSM method was used to match representative daylighting predictors between SUTD and SEU.
PSM is a tool for causal inference in non-randomized studies that allows for conditioning on large sets of covariates.
67
In this study, the PSM analysis was conducted in six steps.
65
As illustrated by Figure 7, the black characters present the six calculation steps, and the yellow characters present the associated decision-making for each step. Participants at SUTD were considered as the control (untreated) group, and participants at SEU were considered as the treated group. Before the PSM analysis, the Spearman correlation was conducted to test if the initially selected daylighting predictors (Eh, Ev, Lmean and CGI) were correlated with subjective assessments. Then, the correlated ones were selected as the covariates for representing daylighting conditions. Propensity scores, defined as the selection probability conditions on the confounding variables, were calculated for quasi-experimental designs, where randomization was impractical or impossible. Although logistic regressions as well as classification and regression tree analysis can both estimate propensity scores, the former is more commonly used with a simpler calculation procedure.
68
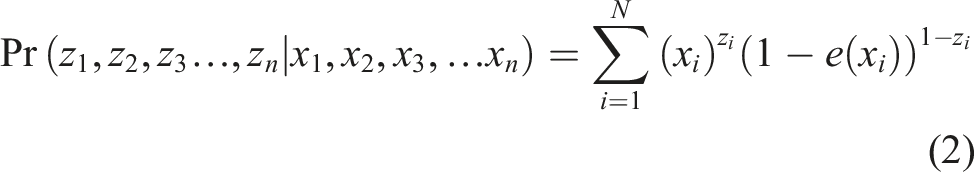
Equations (1) and (2) show the logistic regression method of calculating propensity scores. Steps of PSM analysis and settings.
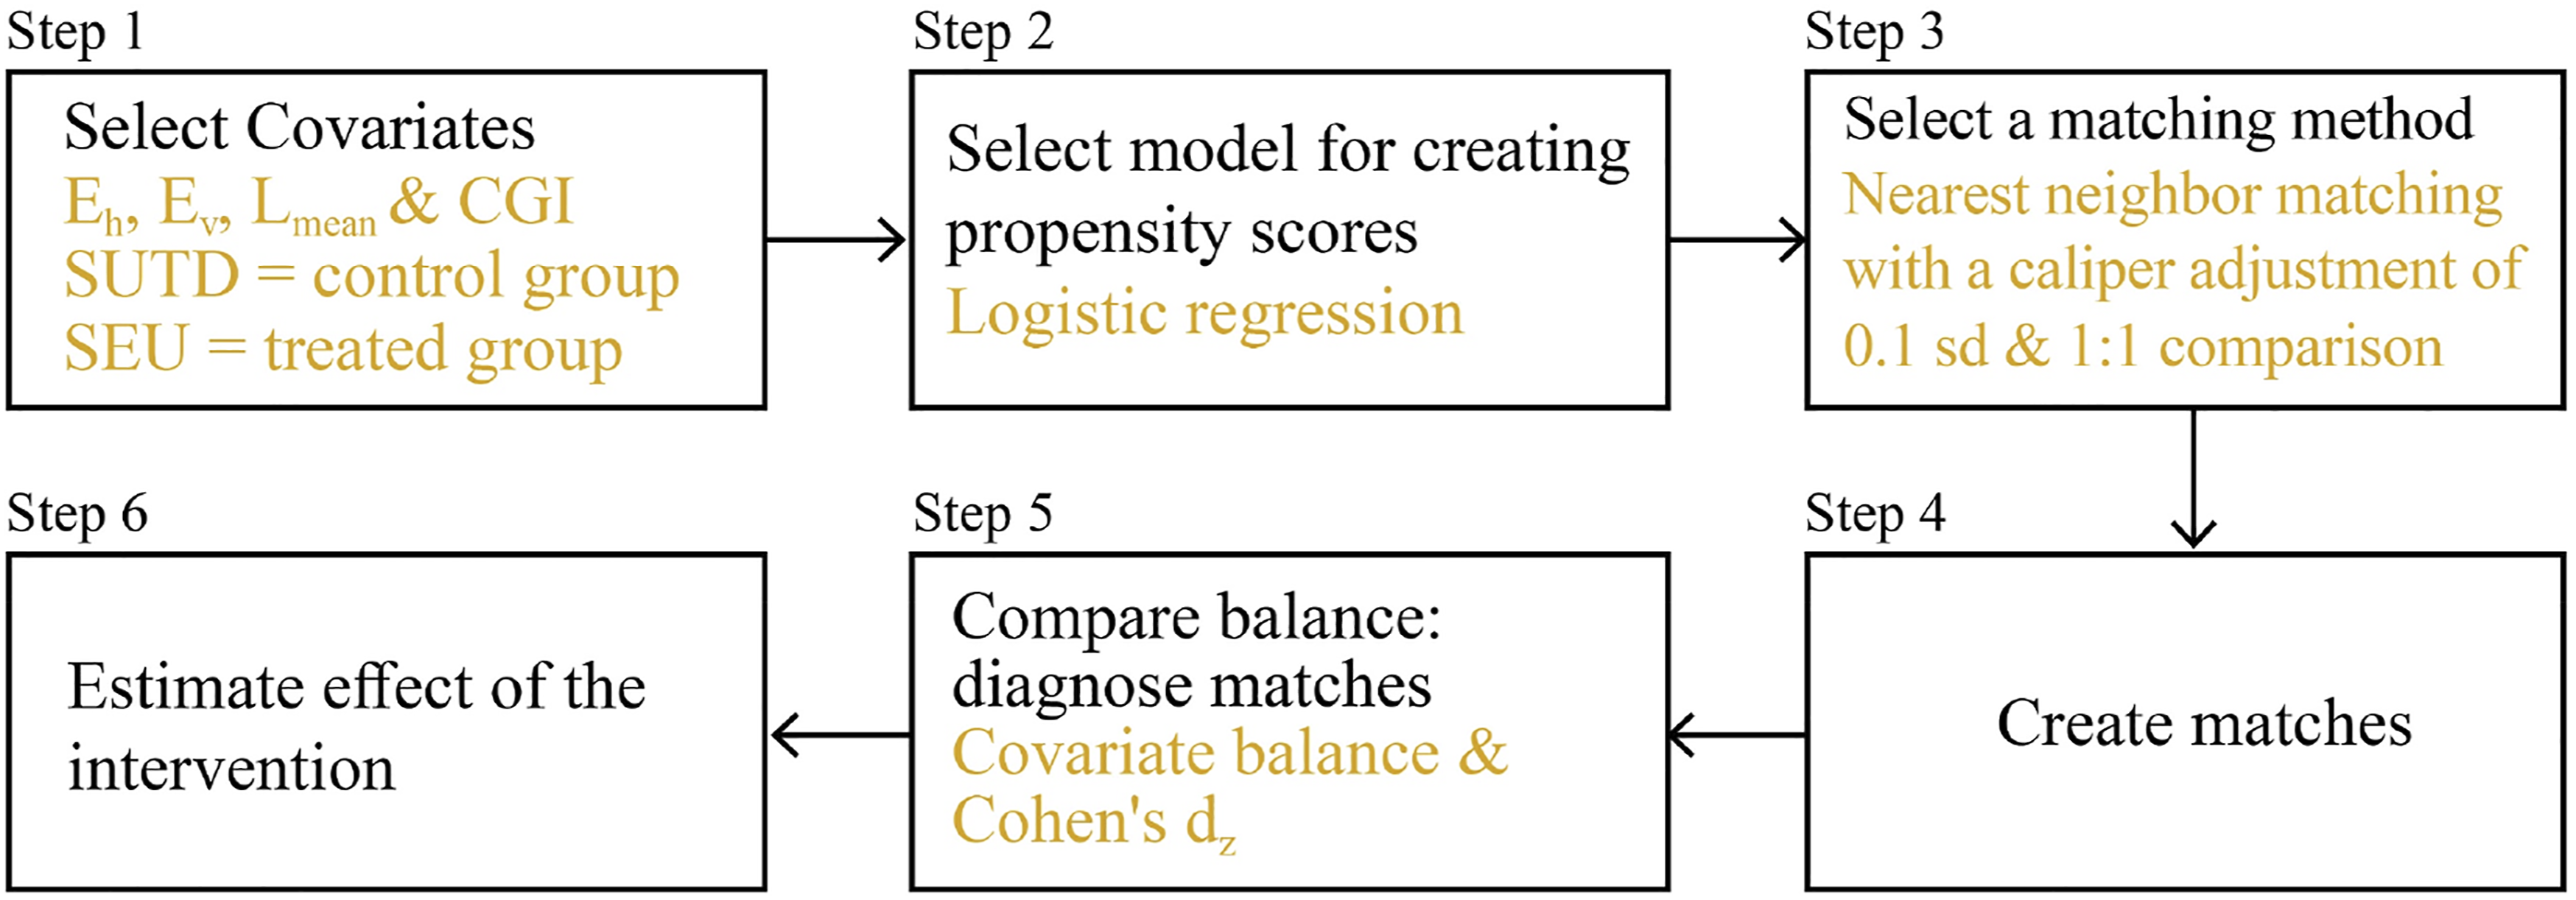
Daylighting predictors were matched using a 1:1 nearest neighbour matching with a caliper of 0.1 standard deviation of the logit of the propensity score. The nearest neighbour matching is the best technique, for it produces the best balance between the covariates in the treated and control groups, as well as the best balance of the covariates’ squares and cross-products between the two groups. 64 After data matching, both covariate balance 69 and Cohen’s dz 70 were calculated to compare the balance between matched SUTD and SEU.
Based on the results of PSM analysis, subjective responses associated with matched Eh, Ev, Lmean, DGP and CGI were extracted for variance analysis. If there was no statistically significant difference between subjective assessments, data from SUTD and SEU were combined for further correlation and logistic regression analysis. If there was a statistically significant difference between subjective assessments, correlation and logistic regression analysis were conducted separately for further comparison. The logistic regression model is shown by equation (3), where x is a daylighting predictor (Eh, Ev, Lmean, DGP or CGI), p is the probability of a predetermined outcome, a is the cut-off point and b is the corresponding effect parameter.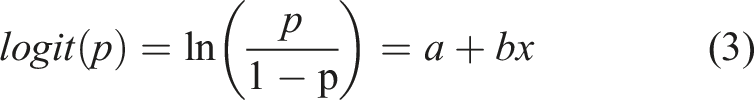
For example, if a logistic regression model between daylight comfort and Ev is proposed, this model indicates the predicted probability of an individual’s rating of daylight comfort based on Ev.
Results
Distributions of daylighting predictors before and after PSM analysis
Descriptive data and group comparisons between SUTD and SEU.
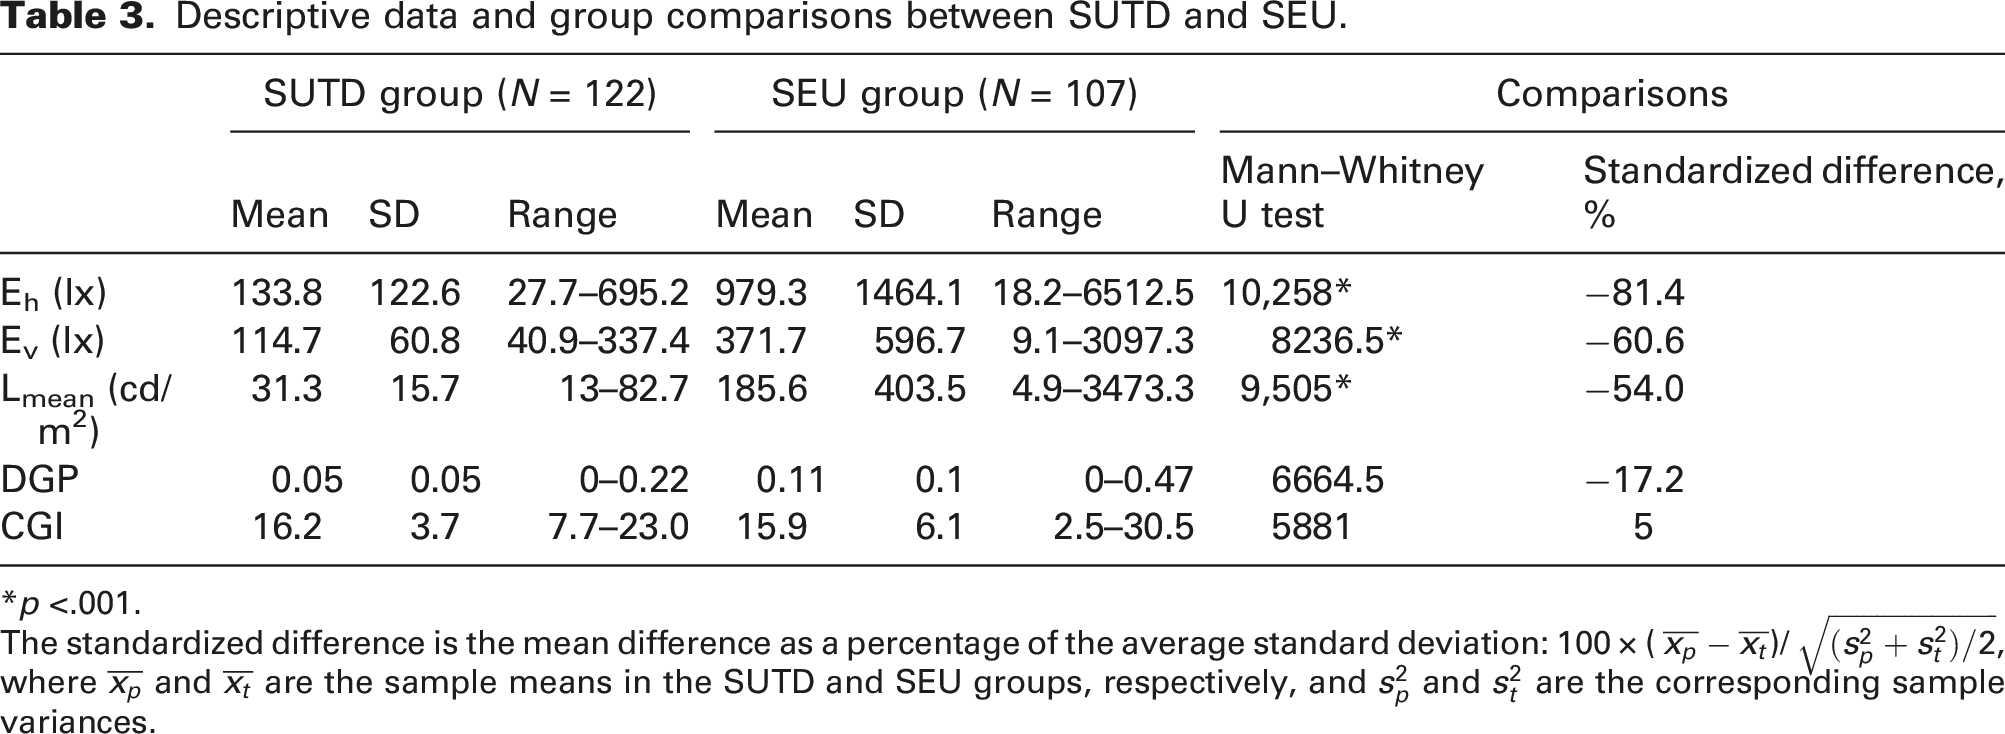
*p <.001.
The standardized difference is the mean difference as a percentage of the average standard deviation: 100 × (
Spearman’s correlation coefficients (ρ) between each daylighting predictor and the subjective responses to four subjective questions.
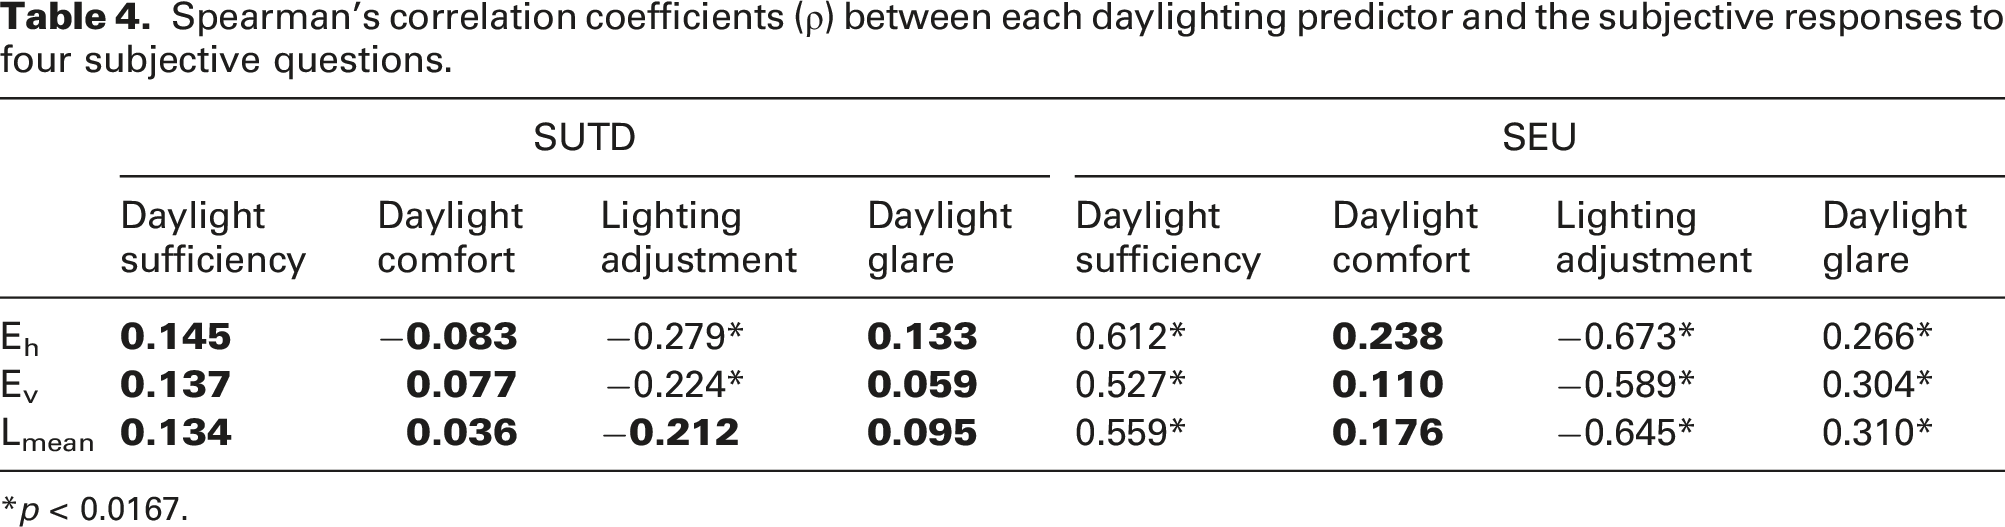
*p < 0.0167.
Daylight comfort was uncorrelated with any daylighting predictor. The distributions of daylighting predictors (Eh, Ev and Lmean) were grouped by the seven choices of daylight comfort, as shown by Figure 8, which demonstrated overlapping ranges. For example, the ranges of Ev at SUTD grouped by daylight comfort (including clearly comfortable, comfortable and just comfortable), neutral and daylight discomfort (including clearly uncomfortable, uncomfortable and just uncomfortable) were 28.8–441 lx, 37.7–437.3 lx and 27.2–689.4 lx, respectively. It is possible that the participants at both universities were confused by the question of daylight comfort, which contradictorily mentioned both ‘conduct your daily work’ and ‘under the current daylighting condition’. This might also explain the failure between the question of daylight comfort and daylighting predictors in the previous studies that utilized similar questionnaire.37,38 Based on the Spearman results, Eh, Ev and Lmean were selected as the daylighting predictors for the PSM analysis. The daylight sufficiency, lighting adjustment and daylight glare were the three primary questions used for comparison analysis. Distributions of three daylighting predictors grouped by the options of daylight comfort for both SUTD and SEU: (a) daylight comfort for SUTD, (b) daylight comfort for SUTD, (c) daylight comfort for SUTD, (d) daylight comfort for SEU, (e) daylight comfort for SEU and (f) daylight comfort for SEU.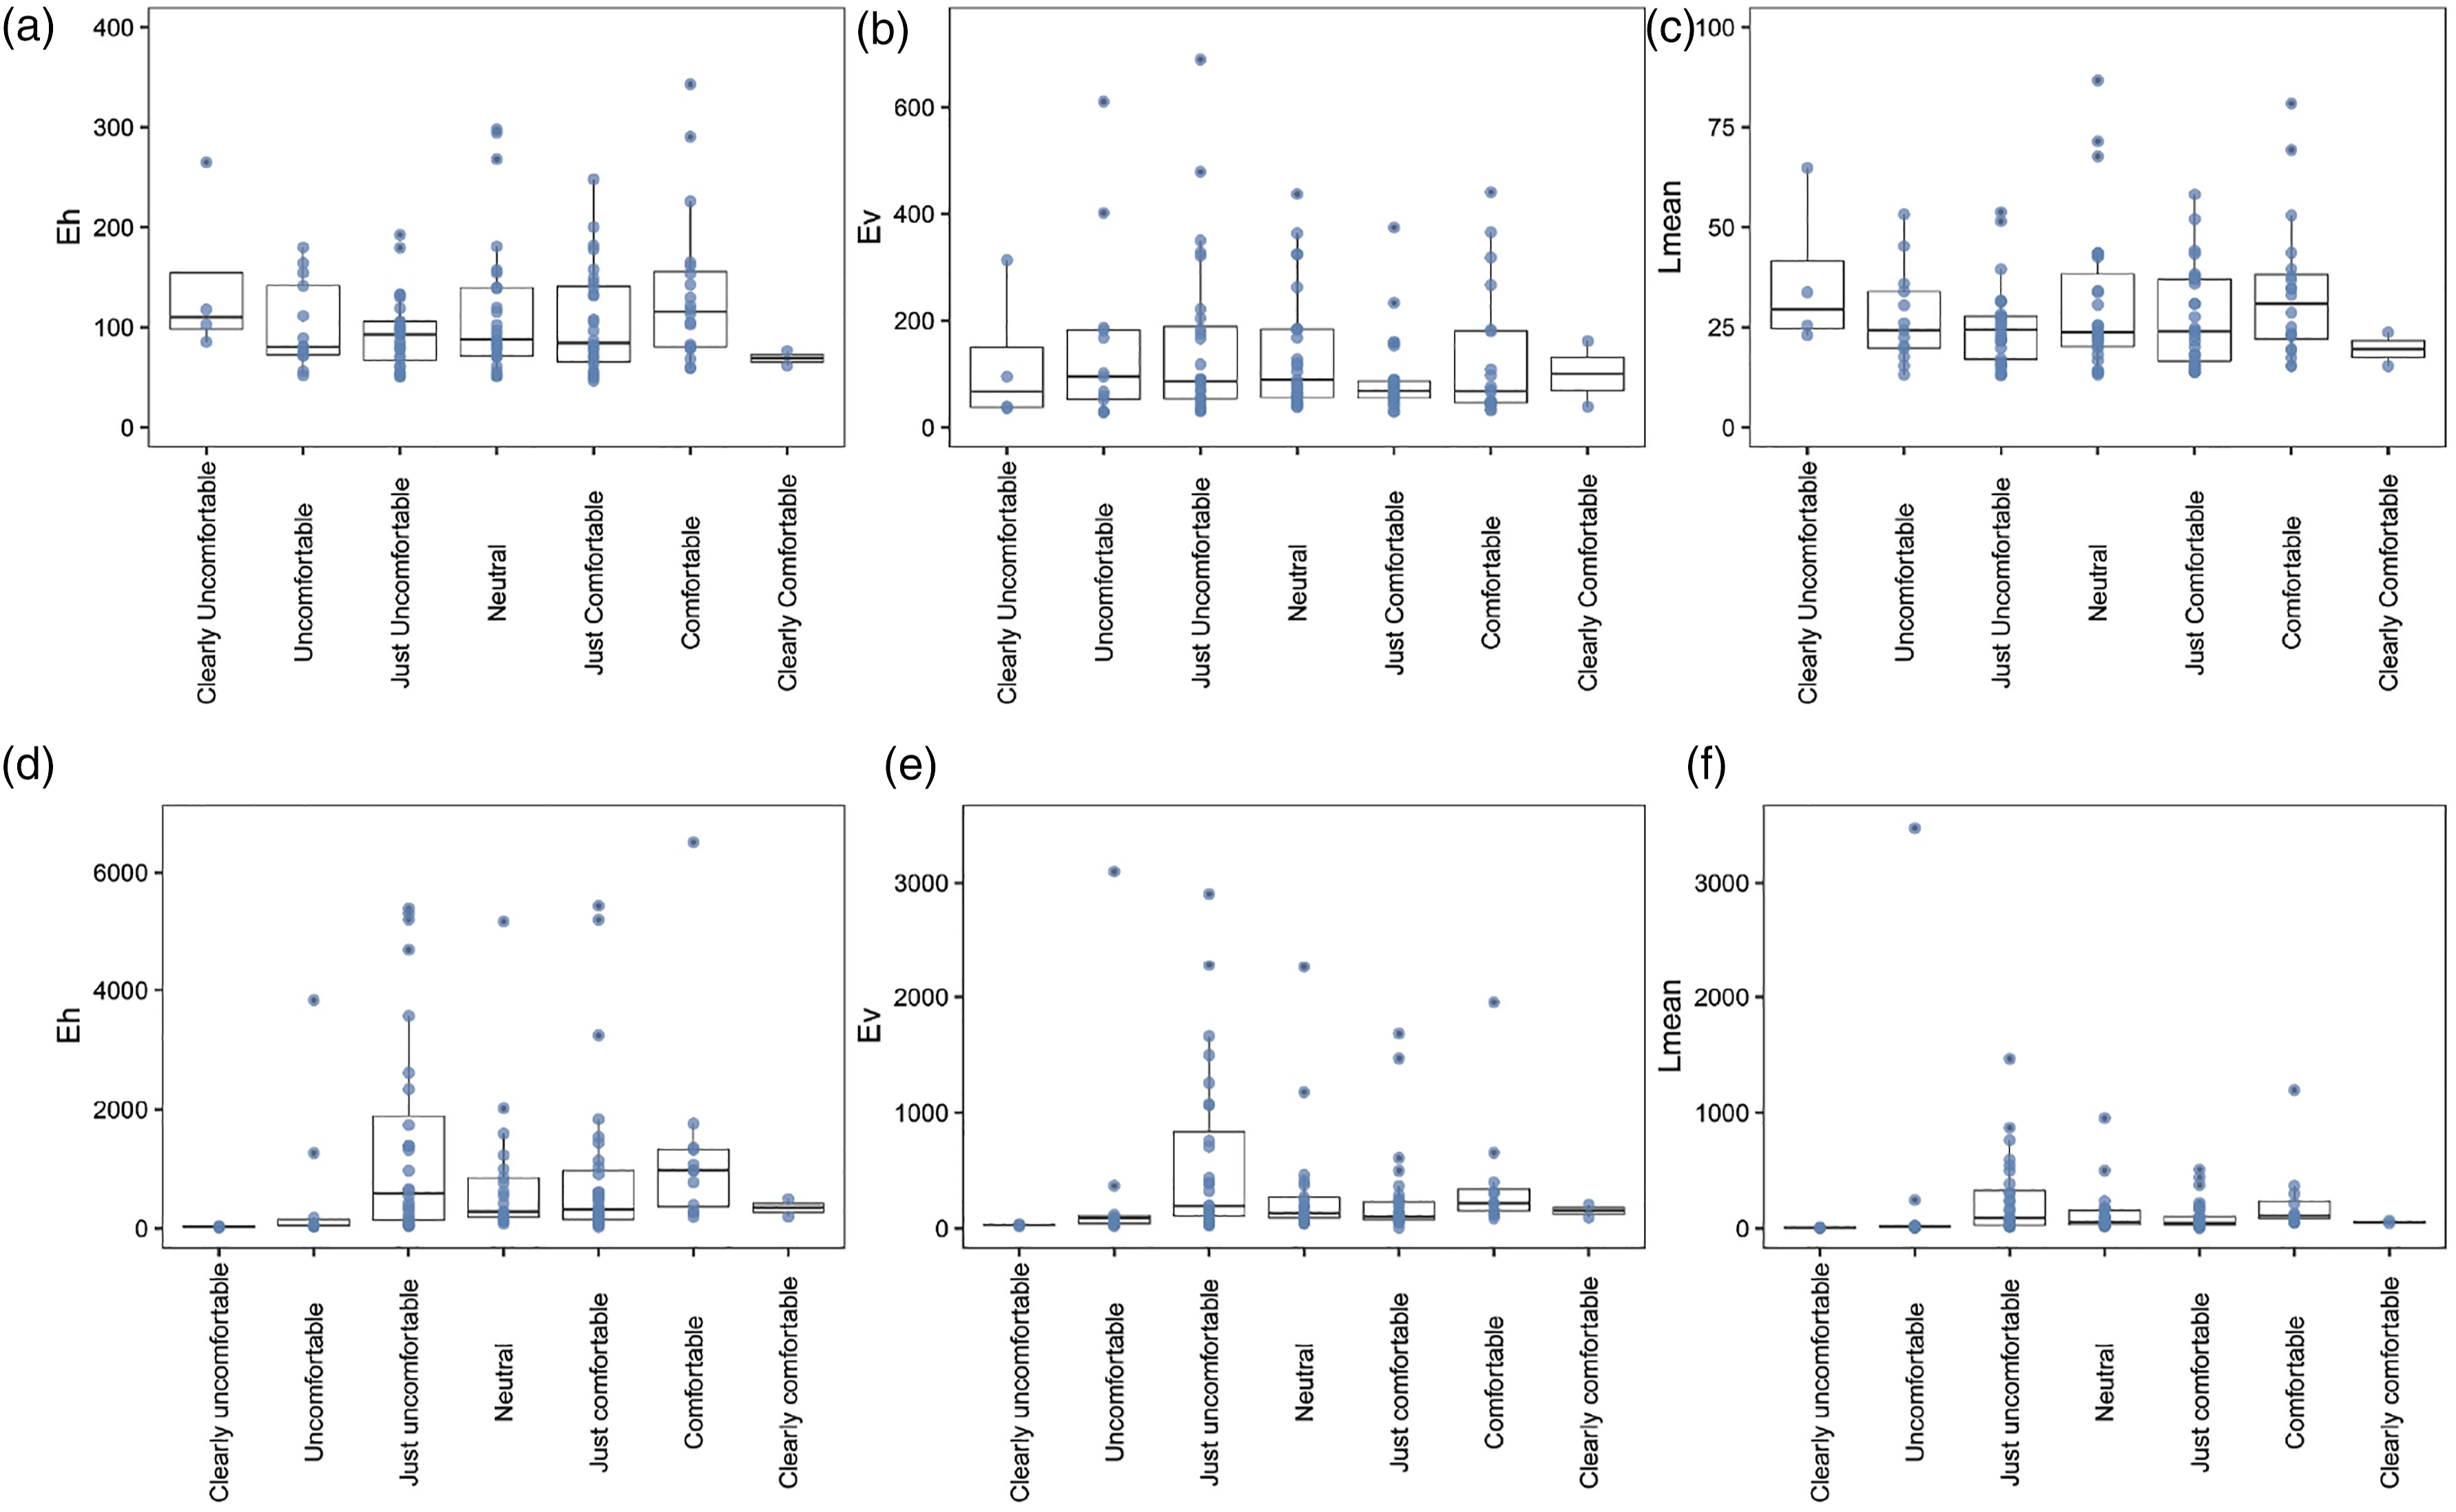
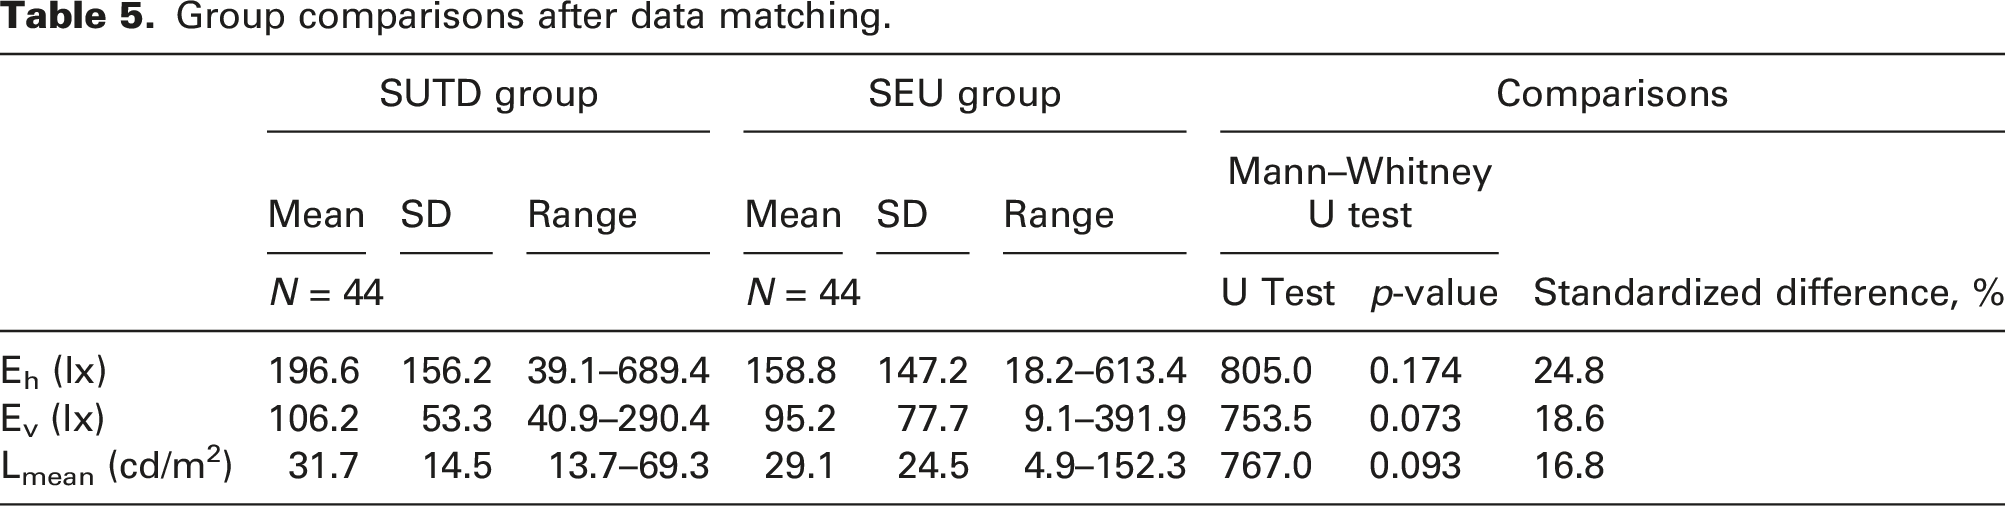
The PSM analysis was applied to the 229 participants, and 44 participants at each university were extracted, resulting in a total number of 88 participants. The overall X2 balance test was not significant (X2 (3) = 1.421, p = 0.701). Figure 9 presents the jittered plots of matched and unmatched observations, along with their propensity score values. Sixty-three observations with relatively higher propensity scores in the SEU group and 78 with low propensity scores in the SUTD group were excluded. Table 5 shows the distributions of matched Eh, Ev and Lmean at both SUTD and SEU. Ev and Lmean at SEU presented slightly wider distributions than those at SUTD. The absolute mean differences between SUTD and SEU varied between 2.6 and 37.8. Compared to the distributions of daylighting predictors prior to data matching (Table 3), the absolute standardized differences were decreased from 81.4% to 16.8%. Additionally, the results of the Mann–Whitney U test demonstrated that there was no statistically significant difference between SUTD and SEU in terms of Eh distributions (U test = 805.0, p-value = 0.174), Ev distributions (U test = 753.5, p-value = 0.073), Lmean distributions (U test = 767.0, p-value = 0.093) or CGI distributions (U test = 818.0, p-value = 0.211). Therefore, the daylighting environments evaluated by the 44 selected participants at SUTD were similar to the ones evaluated by the 44 matched participants at SEU. Jittered plots of matched and unmatched observations, along with their propensity score values. Group comparisons after data matching.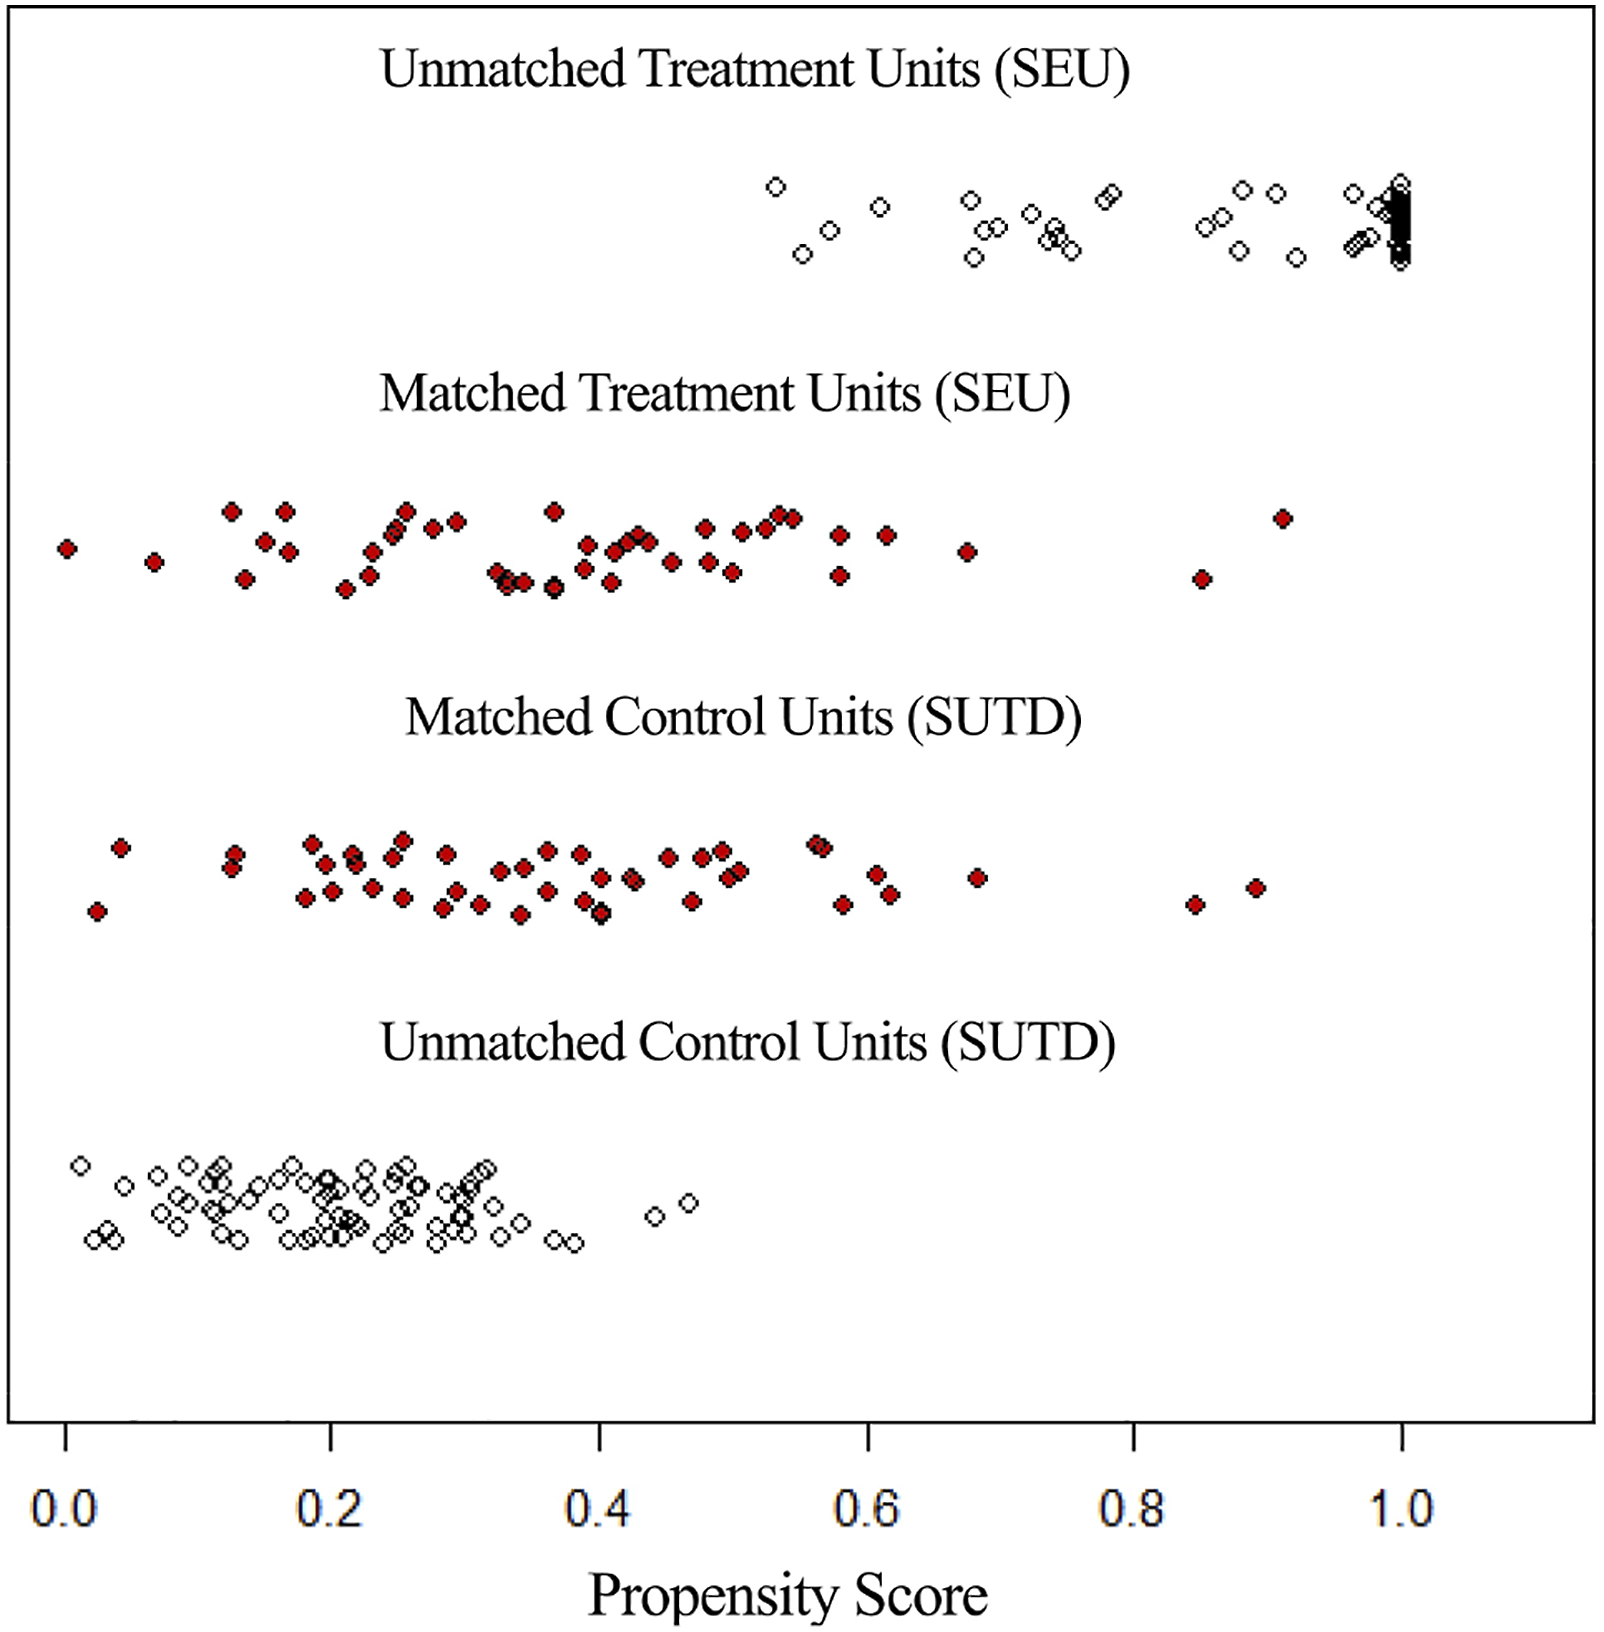
Comparisons of subjective assessments after PSM analysis
Demographic information of the matched 88 participants.
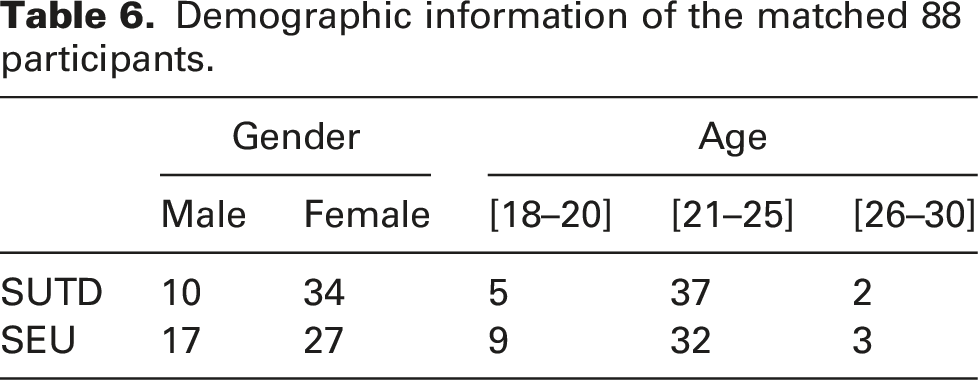
Figure 10 illustrates the distributions of subjective responses to the four questions after data matching. Concerning daylight sufficiency, 64% of participants at SUTD and 45% of participants at SEU considered their current daylighting levels adequate. However, 48% of participants at SEU considered daylighting environments inadequate, 30% higher than the percentage of participants at SUTD who reported the same daylighting level. Concerning daylight comfort, the distributions of subjective assessments between SUTD and SEU were comparable, given that none of the daylighting predictors was correlated with daylight comfort at either SUTD or SEU. Concerning lighting adjustment, 45% of the participants at SUTD desired to decrease their current daylighting levels, whereas only 20% of the participants at SEU reported the same desire. Concerning daylight glare, 64% of the participants at SUTD reported noticeable degree of daylight glare, while 41% of the participants at SEU reported the same degree. Distributions of matched subjective responses to (a) daylight sufficiency, (b) daylight comfort, (c) lighting adjustment and (d) daylight glare between SUTD and SEU.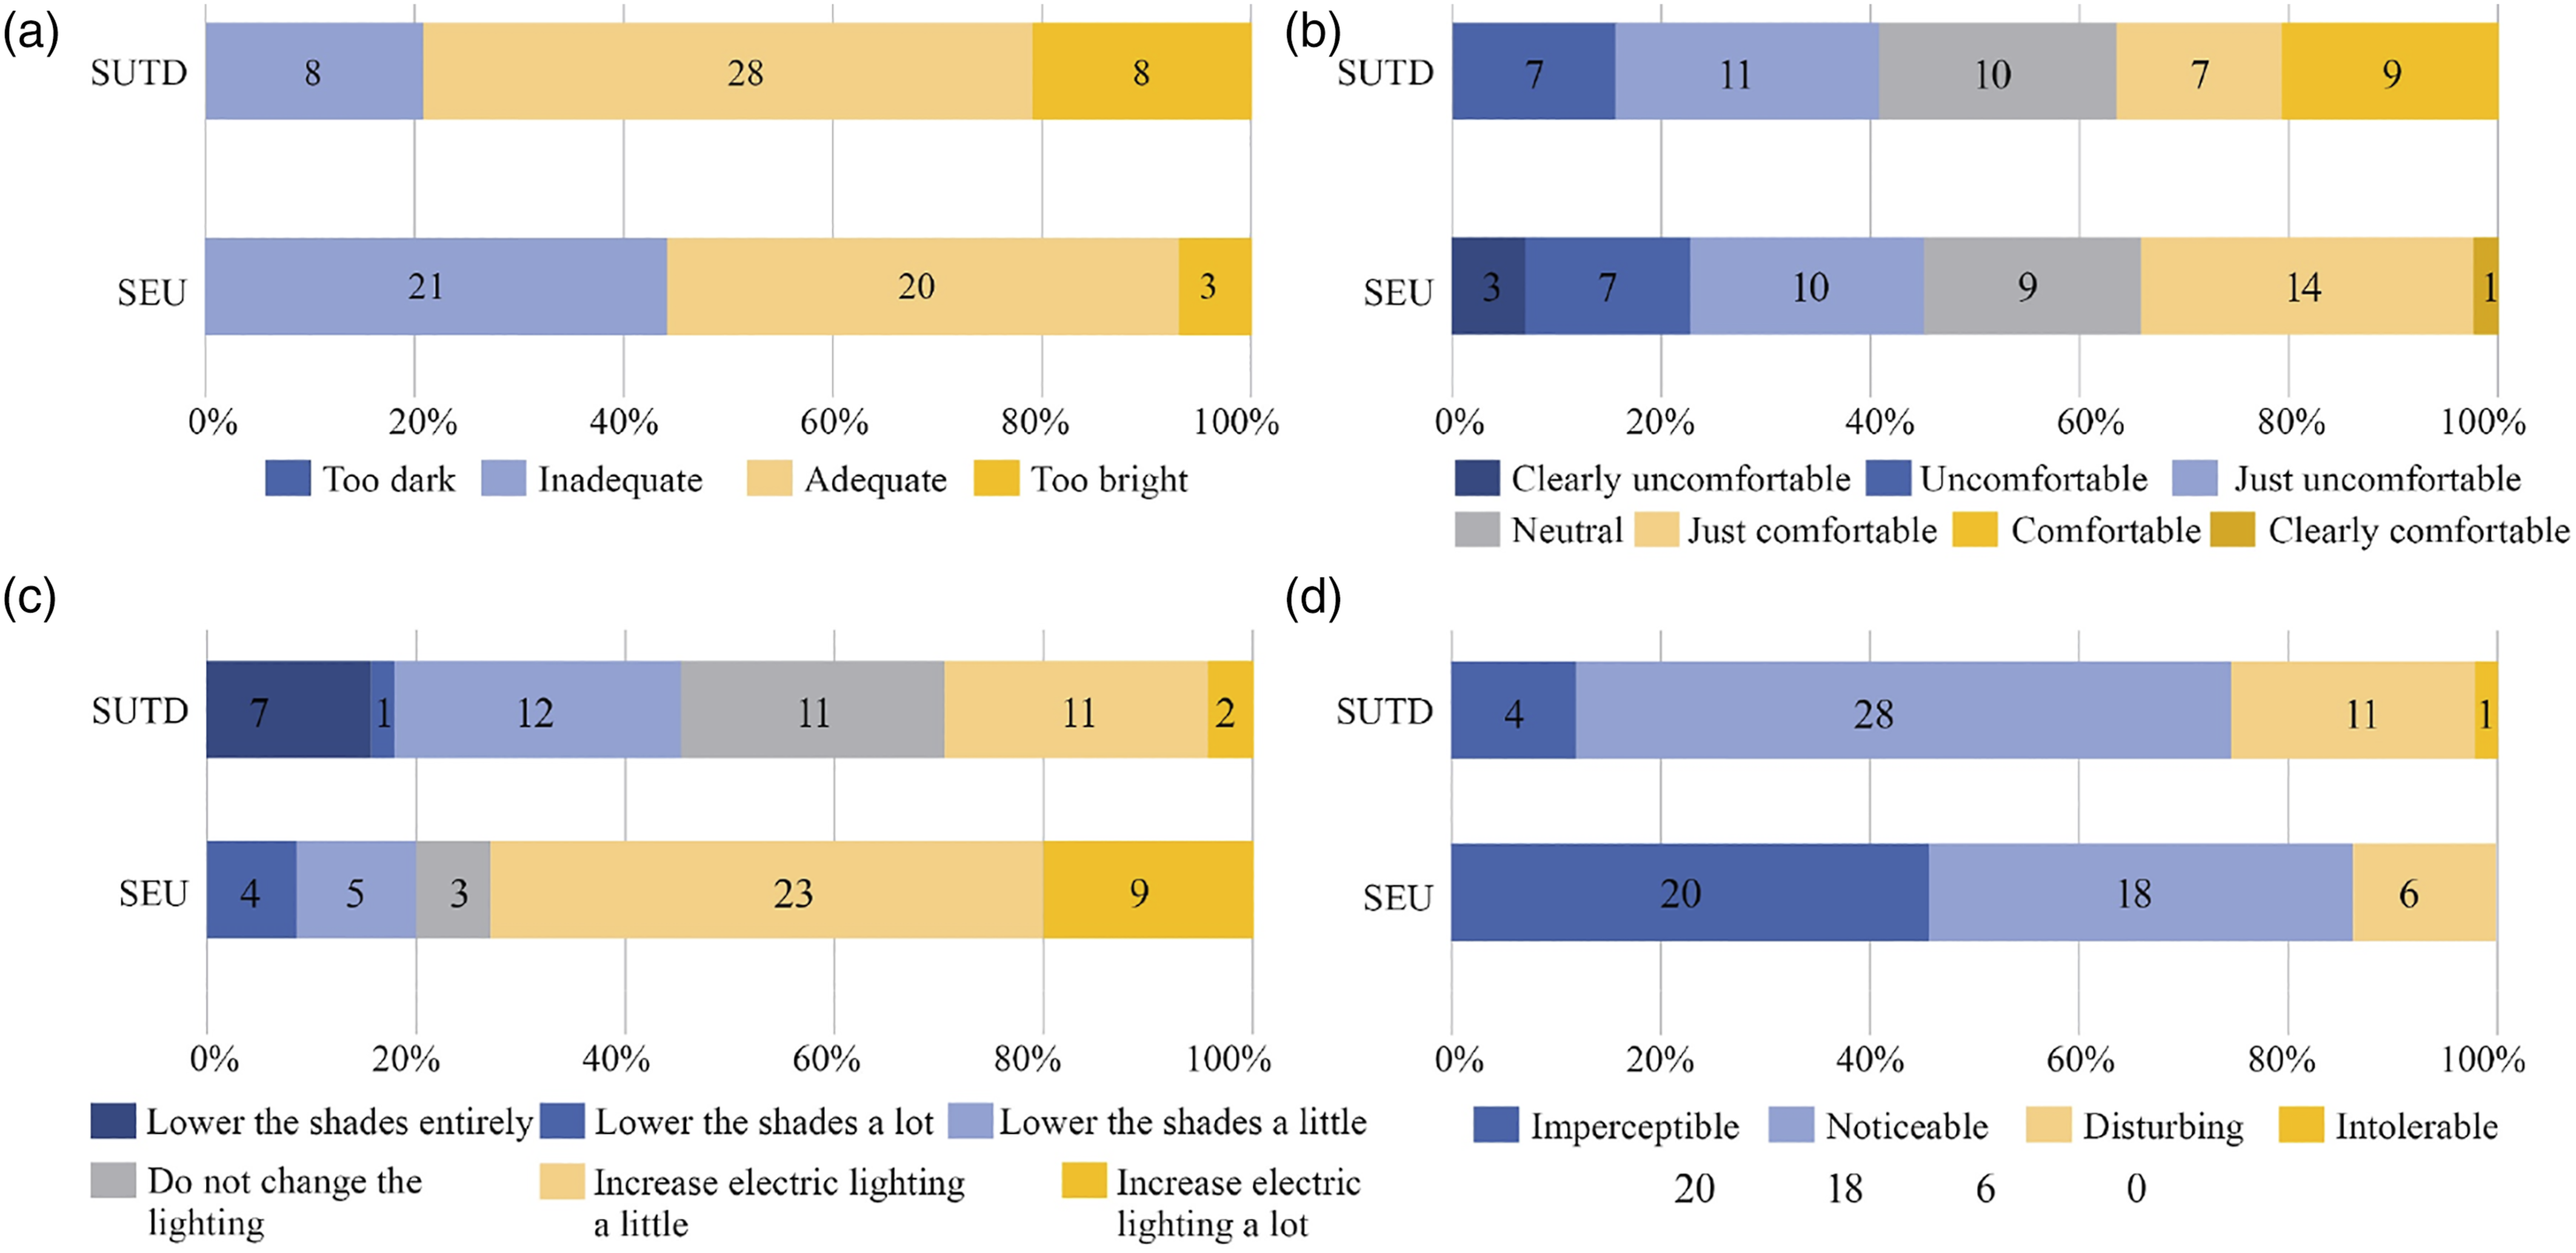
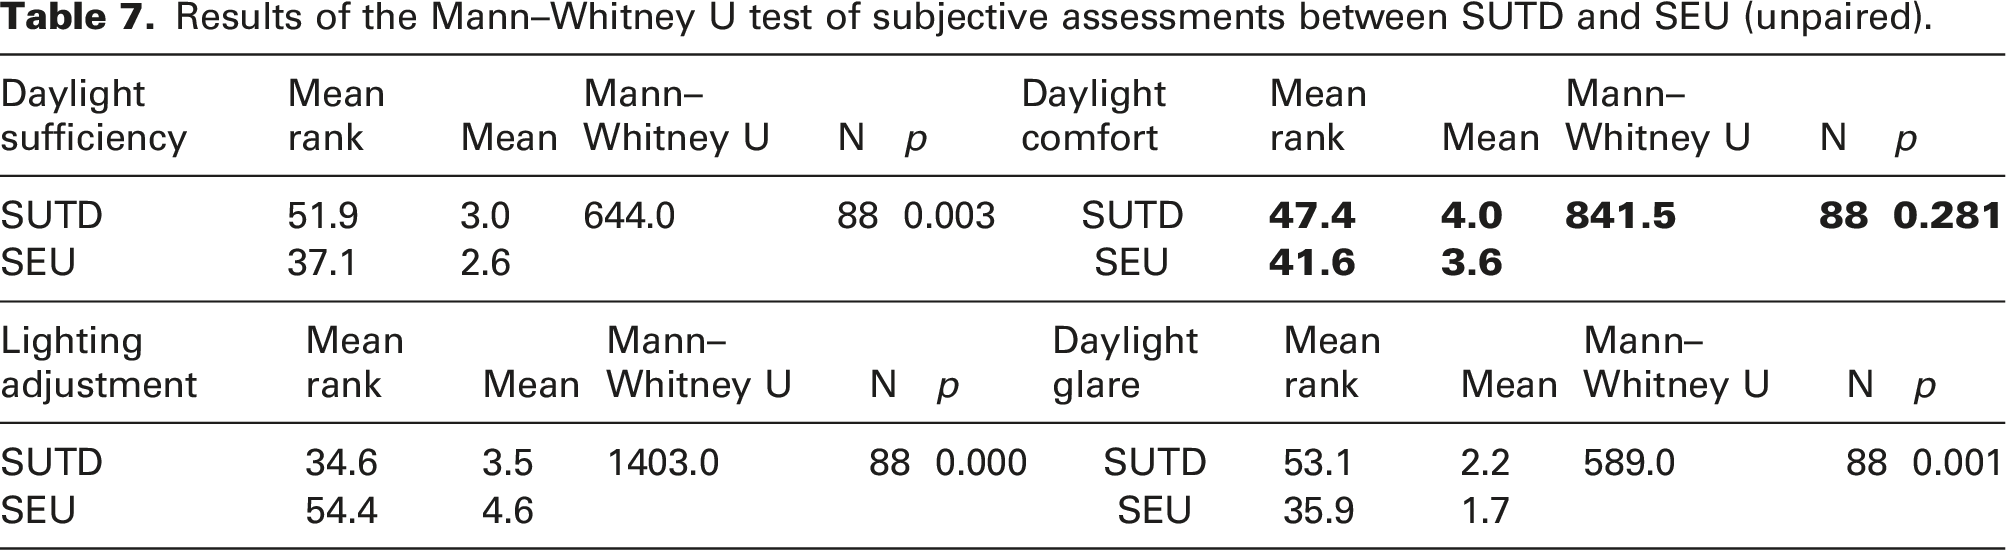
Results of the Mann–Whitney U test of subjective assessments between SUTD and SEU (unpaired).
Effect sizes for subjective assessments between SUTD and SEU.
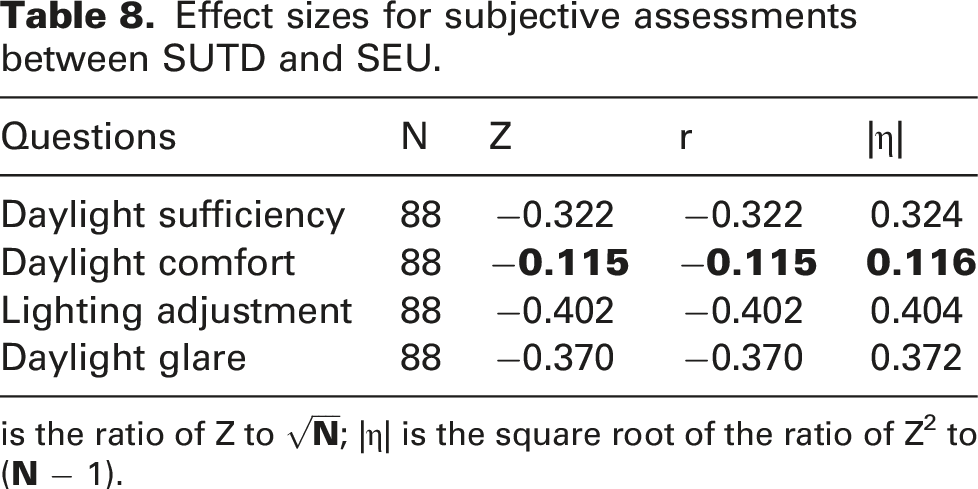
is the ratio of Z to
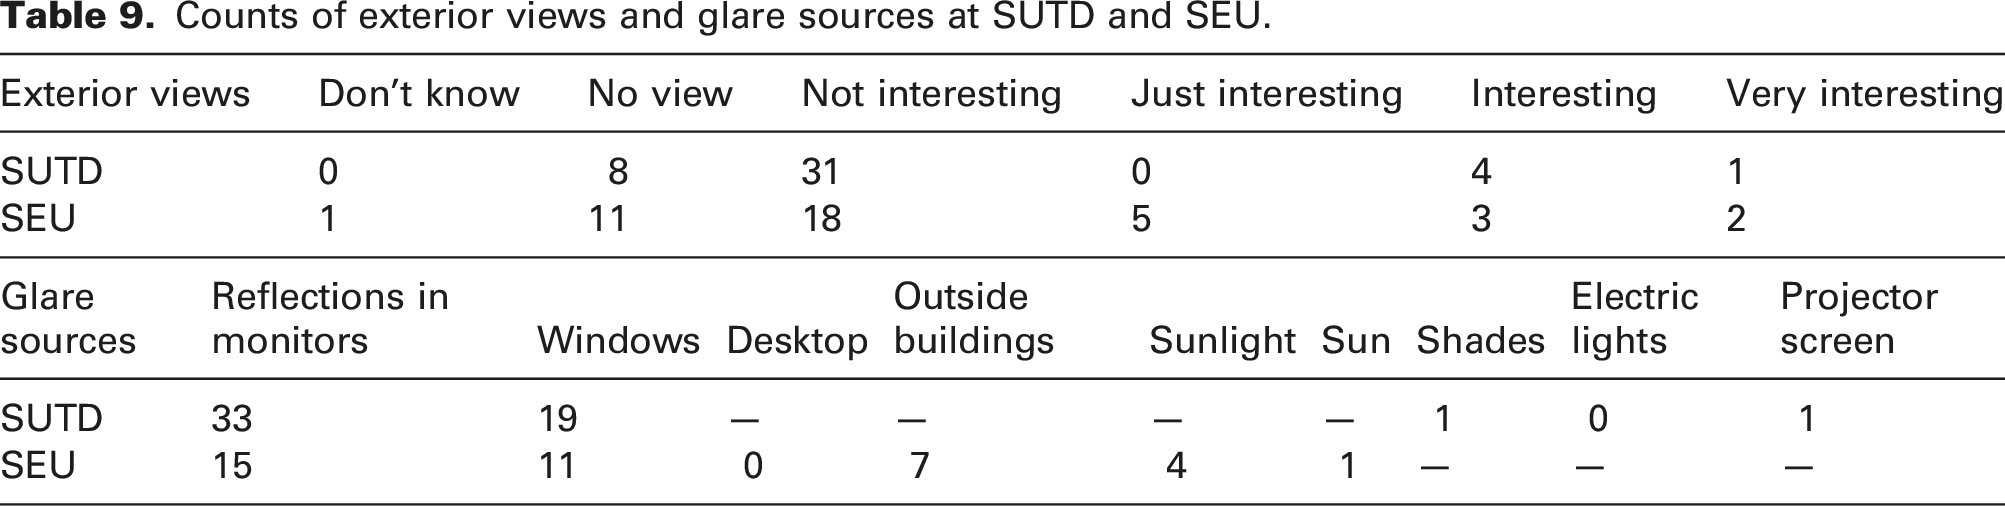
Counts of exterior views and glare sources at SUTD and SEU.
Comparisons of daylighting predictor thresholds
According to Table 7, there are statistically significant differences in subjective assessments between SUTD and SEU after matching the daylighting predictors, the differences included daylight sufficiency, lighting adjustment and daylight glare. To further compare whether the thresholds of daylighting predictors associated with subjective assessments between SUTD and SEU were different, a binary logistic regression (equation (1)) model between daylighting predictors and subjective responses was separately performed by using the initial data for SUTD (N = 122) and SEU (N = 107) before PSM. Given the results of the Mann–Whitney U test (Table 3) and Spearman test (Table 4), the logistic regression models between lighting adjustment and Eh or Ev were sought for both SUTD and SEU. Ev has statistically significant explanatory power in explaining subjective desires of adjusting current lighting levels for SEU (X2 = 22.372, p-value = 0.000) but not for SUTD (X2 = 2.51, p-value = 0.113). Only the logistic regression models between Eh and lighting adjustment for both SUTD and SEU were compared.
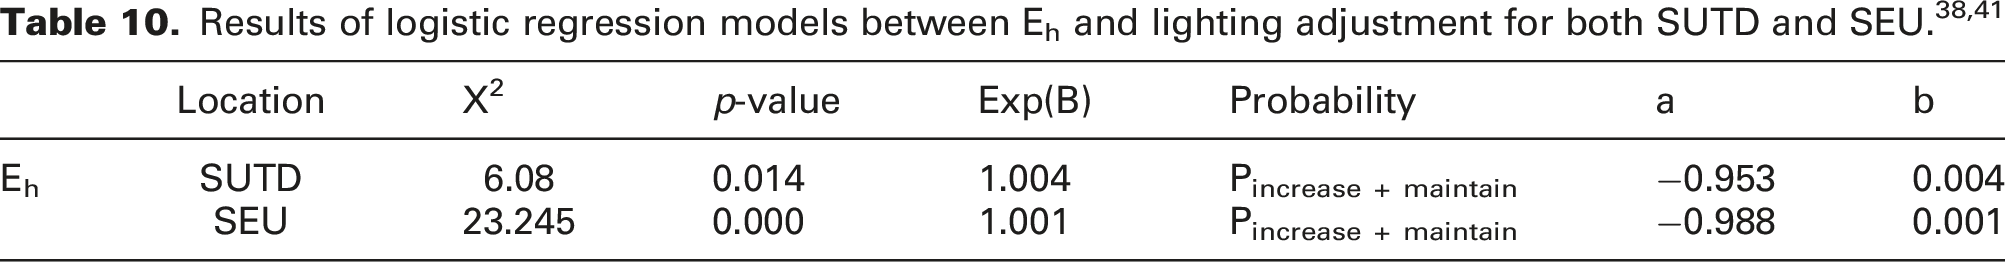
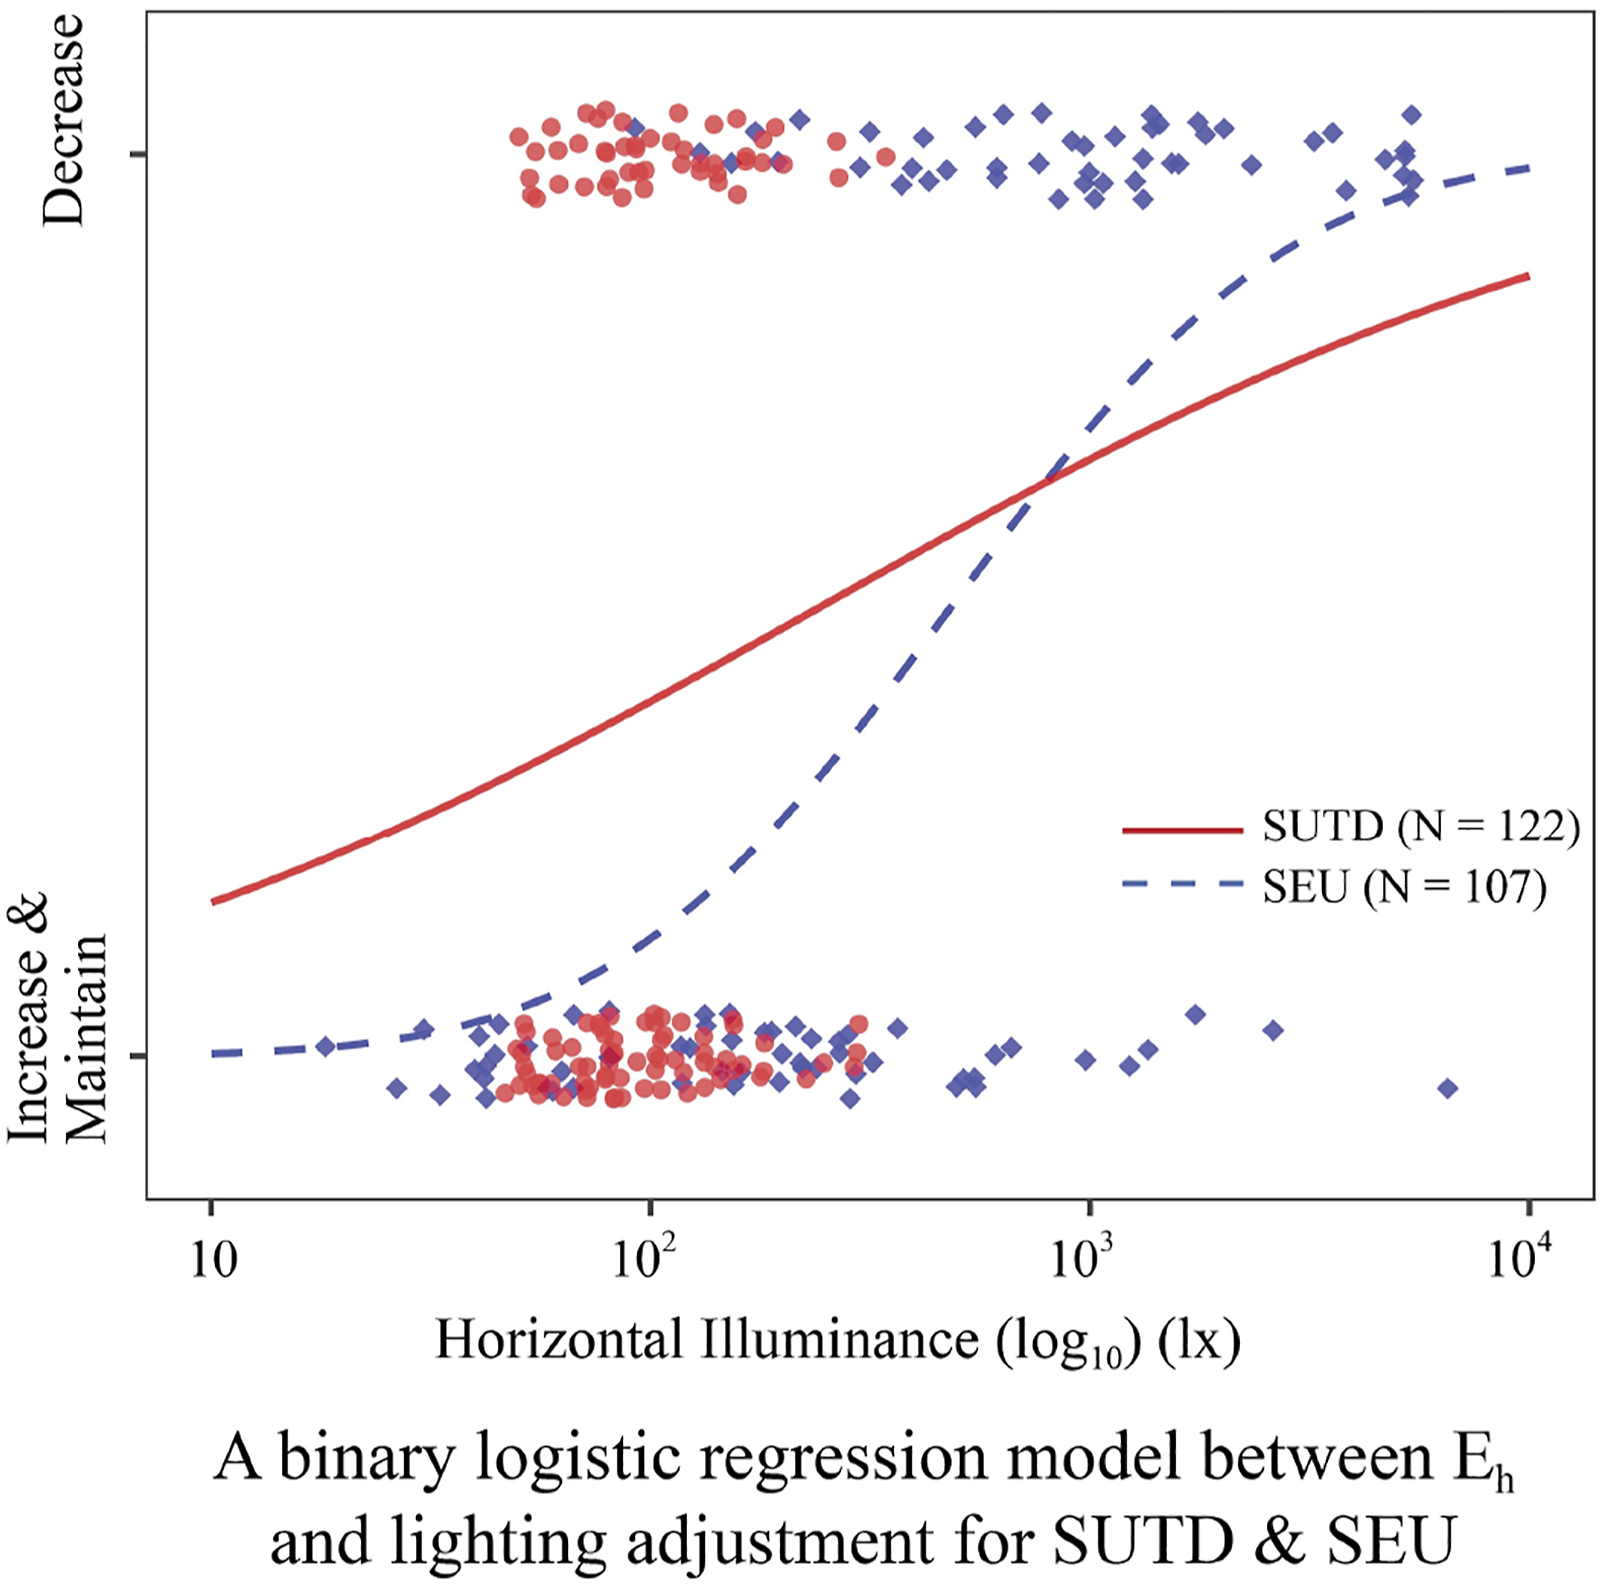
The binary logistic regression models between Eh and lighting adjustment for both SUTD and SEU.
Discussion
This study compares subjective assessments of daylighting environments at universities under two socio-environmental contexts: Singapore and Nanjing. By matching daylighting predictors of Eh, Ev and Lmean, subjective assessments under similar daylighting environments were extracted. CGI values at the two locations were also comparable without statistically significant differences. The variance analysis of subjective assessments demonstrated the statistically significant differences between these two groups. Under similar daylighting environments, more participants at SUTD rated their daylighting levels adequate with noticeable daylight glare, as well as desired to decrease or maintain current daylighting levels. On the other hand, more participants at SEU rated their daylighting levels as inadequate with imperceptible daylight glare, as well as desired to increase current daylighting levels. Participants at SEU might require higher levels of daylight to achieve similar subjective responses to the ones reported by the participants at SUTD.
This research is in alignment with previous studies,26,73–77 which suggest that people from different socio-environmental contexts present different daylighting perceptions. Nonetheless, these studies compared their conclusions to previously published ones. On the other hand, the studies that directly compared subjective assessments in one study have drawn inconsistent conclusions. For example, Schielke 32 concluded similar subjective lighting impressions amongst participants from Europe, America, Middle East and Asia by comparing subjective responses to the online survey from small sample sizes (19–26 participants from each region). Moscoso 33 reported significant differences caused by socio-environmental contexts in terms of subjective evaluations of window sizes, whereas Chamilothori 34 found no significant differences caused by socio-environmental contexts in terms of subjective impressions of façade and daylighting patterns. Although these studies focused on lighting impressions by using different research methods (online survey or laboratory experiments), the influence of socio-environmental contexts on subjective lighting assessments is inconclusive.
Except for different building functions, occupant groups and dissimilar countries, this field study is similar to Pierson’s field study 22 to a certain extent with different conclusions. There are two reasons that primarily impacted the research conclusions: differences caused by either socio-environmental context or data processing. First, none of the cities (Concepción, Punta Arenas, Antofagasta, Louvain-la-Neuve, Tokyo and Lausanne) explored in Pierson’s study 22 were close to the equator under a tropical weather. Daylighting levels at SUTD were relatively lower than the ones at SEU and the ones in Pierson’s study. 22 For example, over 85% of the Eh and Ev at SUTD were lower than 300 lx. Nonetheless, relatively low interior daylighting distributions under tropical weather have been reported by previous studies.78,79 Compared to abundant solar radiation and relatively uniform temperature without dynamic seasonal variations throughout a year in Singapore, distinct seasonal variations in Nanjing, especially rainy and humid winter, could possibly lead participants to hold more positive attitudes towards daylight 80 or even daylight glare. On the other hand, the daylighting environments at SEU were closer to the conditions in Pierson’s study, 22 where a mean Ev varied between 815 lx and 2289 lx under the maximized daylighting conditions. 81 That is to say, contrast-based glare predominated the daylighting conditions in this study, whereas hybrid and saturation-based glare predominated the daylighting conditions in Pierson’s study. 22
Second, Pierson et al. 22 strictly excluded 47% of the original sample, including the participants who reported computer screens but not daylight as one glare source. Since the emphasis of this study is to compare students’ evaluations while conducting screen-based tasks, it is inevitable to receive subjective reports of reflections in monitors. Different methods of filtering subjective assessments between this study (matching daylighting predictors) and Pierson’s study 22 (excluding certain types of glare sources) might lead to dissimilar conclusions.
Finally, although there is no significant difference in glare sources (reflections in monitors and windows) between SUTD and SEU, the primary reason that results in different counts of subjective reports of glare sources is the furniture layouts in high likelihood. At SUTD, the workstations were parallel to the double-sided windows. Participants facing towards one side of the windows were more likely to report windows as a glare source. The glossy monitors could easily reflect opposite windows, which might trigger participants to desire to adjust current daylighting conditions by lowering the shades. At SEU, on the other hand, the workstations were perpendicular to the windows. The participants’ eyesight towards monitors was parallel to windows, which could effectively reduce the probability of experiencing daylight glare directly from the windows or window reflections on matte monitors. Therefore, the relative positions between monitors, occupants and windows could have an important role in an individual's experience of visual comfort. 82 Although daylighting quantities represented by four daylighting predictors were comparable between SUTD and SEU after applying the PSM analysis, subjective impressions of daylighting environments are a combination of multiple factors, such as surrounding environments, space dimensions, window orientations, reflectance of exterior and interior materials, as well as furniture layouts. Studies in the future could extract other influential factors that could have an important role in defining subjective impressions of daylighting environments.
Limitations
This study has several limitations that potentially influence the conclusions, as listed below:
Different from the daylighting data measured at SEU, daylighting data at SUTD were simulated. The simulated horizontal illuminance, vertical illuminance and luminance maps might bias the results of data matching in two aspects: the exclusion of occupants in simulation models and the simulation errors derived from the calibration models. Nonetheless, the relatively low MBErel of −0.3% and RMSErel of 8.5% within 20% are considered scientifically accurate to represent measured data. 83
Given the survey was distributed in different seasons, seasonal variations might result in biases in the research conclusion. Since Singapore is located around the equator, it has uniform temperatures and abundant rainfall without dynamic seasonal variations throughout a year. However, with a humid subtropical climate, Nanjing has four distinct seasons with seasonal variations throughout a year. In other words, seasonal variations in climate in Nanjing might induce differences in subjective assessments of daylighting quality 84 and result in biases in the conclusion.
It is the first time to the authors’ knowledge that PSM analysis has been utilized in lighting research. Given the relatively low daylighting environments at SUTD, the matching data at SEU are also relatively low, which are more likely to associate with the participants who sit away from the southern windows. In other words, the 44 matched participants at SEU might only represent the workstations in low daylighting conditions, such as the ones away from southern or northern windows or even under intermediate or overcast skies.
Concerning the sample sizes and characteristics, this study is limited by specific sample types and socio-environmental contexts, namely, healthy university undergraduate and graduate students majoring in Architecture in screen-based tasks classrooms. Moreover, the 44 matched participants from each location are lower than the pre-calculated 67 participants in the G*Power, although it is difficult to control the counts of participants after data matching.
Finally, other potentially influential factors that were not included in this study, like thermal comfort, chronotype, self-assessed glare sensitivity, visual acuity, iris pigmentation, 26 physical state, emotional state, fatigue and caffeine ingestion, 85 should be explored in the future.
Conclusions
This study compared subjective assessments of daylighting quality within two regions: Singapore and Nanjing. Classrooms where students primarily perform screen-based tasks were focused. Subjective evaluations of daylighting environments were collected. Representative daylighting predictors of Eh, Ev and Lmean were selected and matched using a propensity score matching method. CGI was also compared to ensure relatively similar visual-comfort environments. Eighty-eight participants, 44 from each university, were extracted for further comparison. Under similar daylighting quantities, the participants at SUTD and SEU reported statistically significant different assessments in terms of daylight sufficiency, lighting adjustment and daylight glare. The logistic regression models between Eh and lighting adjustment also demonstrated threshold differences for achieving similar individual probability of decreasing lighting levels. It is possible that different socio-environmental contexts between Singapore and Nanjing lead to subjective assessment differences under similar daylighting environments.
Footnotes
Author contributions
Conceptualization: Z. K. and A. J.; methodology: Z. K., A. J. and Z. T.; software: Y. F.; validation: A. J. and Z. T.; formal analysis: Z. K. and Y. F.; investigation: Z. K. and A. J.; resources: Z. K. and A. J.; data creation: Z. K., A. J. and Z. T.; writing – original draft preparation: Z. K. and Y. F.; writing – review and editing: Z. K., A. J., Z. T. and Y. F.; visualization: Z. K. and Y. F.; supervision: A. J. and Z. T.; project administration: Z. K.; funding acquisition: Y. F. All authors have read and agreed to the published version of the manuscript.
Declaration of conflicting interests
The author(s) declared no potential conflicts of interest with respect to the research, authorship, and/or publication of this article.
Funding
The author(s) disclosed receipt of the following financial support for the research, authorship, and/or publication of this article: This research was financially sponsored by the National Natural Science Foundation of China (Grant No. 52208012 and Grant No. 51978429), the Start-up Fund for High-Level Talent Research of Jinling Institute of Technology (Grant No. jit-b-202132), Jiangsu Construction System Science and Technology Project (Grant No. 2021ZD13) and the University-Industry Collaborative Education Program of the Ministry of Education (Grant No. 202101042020).