
Abstract
Most visual comfort analysis is based on glare detections in limited fixed view scenes, but sports spaces present challenges given occupants’ spatial and view directional variations in sports-related visual tasks. This paper proposes an occupant-centric approach for spatio-temporal visual comfort assessment and optimization (ST-VCAO) in daylit sports spaces by better considering the occupants’ movement behaviour. It introduces the movable view scenes (MVS) in glare simulations and further accelerates the ST-VCAO process using the GPU-based parallel simulation combining response surface methodology. The proposed approach was applied to a real case building in Harbin, China. Annual daylight and glare simulations in two tennis courts with a total of 500 MVS were performed using Perez all-weather sky model with Chinese standard weather data. Results indicate that the proposed approach could sufficiently clarify the spatial variance and temporal variation of visual comfort across all MVS, which is appropriate for sports spaces. Meanwhile, using the developed workflow, the total computational time could be saved by 27.08% (Case 1) or 71.25% (Case 2). Amongst all Pareto solutions, the optimum alternative upon the worst one observed 200% (Case 1) or 50.7% (Case 2) higher visual comfort.
Keywords
Introduction
Daylighting plays a key role in achieving visual comfort and energy efficiency in buildings, which not only helps to improve occupants’ productivity and well-being 1 but also contributes to reducing the artificial lighting requirement. 2 However, excessive sunlight is also the main cause of discomfort glare that deprives the daylighting in professional sports halls.
National Fitness Hall (NFH) is an emerging multi-sport facility for public but not athletes in China the lighting standard of NFH is not as high as that of professional sports halls, which only requires the ‘Lighting Class III: low level (local, small club, training and school sports)’ 3 that can support people’s daily fitness sports and exercises. Daylighting has gradually been adopted in NFH, which is preferred by non-professional users. To improve occupants’ visual comfort in daylit NFH, daylighting design should consider both daylight availability and protection from glare. 4
Building standards and codes of daylight and glare have been promulgated but far away from guiding practical implementation in sports spaces. In China, the main daylighting standard ‘Standard for Daylighting Design of Buildings’ (GB 50033-2013) 5 only regulates the Horizontal Illuminance (Eh) and Daylight Factor (DF), while no visual comfort metrics are contained except for a simple requirement of Daylight Glare Index (DGI). Additionally, a few daylighting design guidelines and green building rating systems such as ‘Assessment Standard for Green Building’ (GB/T 50378-2014) 6 contain an entry about protection from glare, but they do not include the detailed evaluation requirements. 7 Recently, visual comfort metrics have increasingly been adopted in building regulations and standards, such as LEED, 8 WELL 9 and BS-EN-17037-Daylight in Buildings. 10
To date, most building standards and labels only include glare requirements and recommendations on anti-glare protection; few specifically set out how to predict glare or where to estimate it. Furthermore, there is a lack of reliable methods or guidelines to assess spatio-temporal visual comfort in large sports spaces, such as NFH. Given the complexity and uncertainty of players’ sports behaviours, it is thus essential to develop an occupant-centric approach that can better consider sports behaviour in spatio-temporal visual comfort assessment and optimization of sports spaces.
Literature review
Visual comfort metrics
Existing spatial and/or temporal visual comfort metrics.
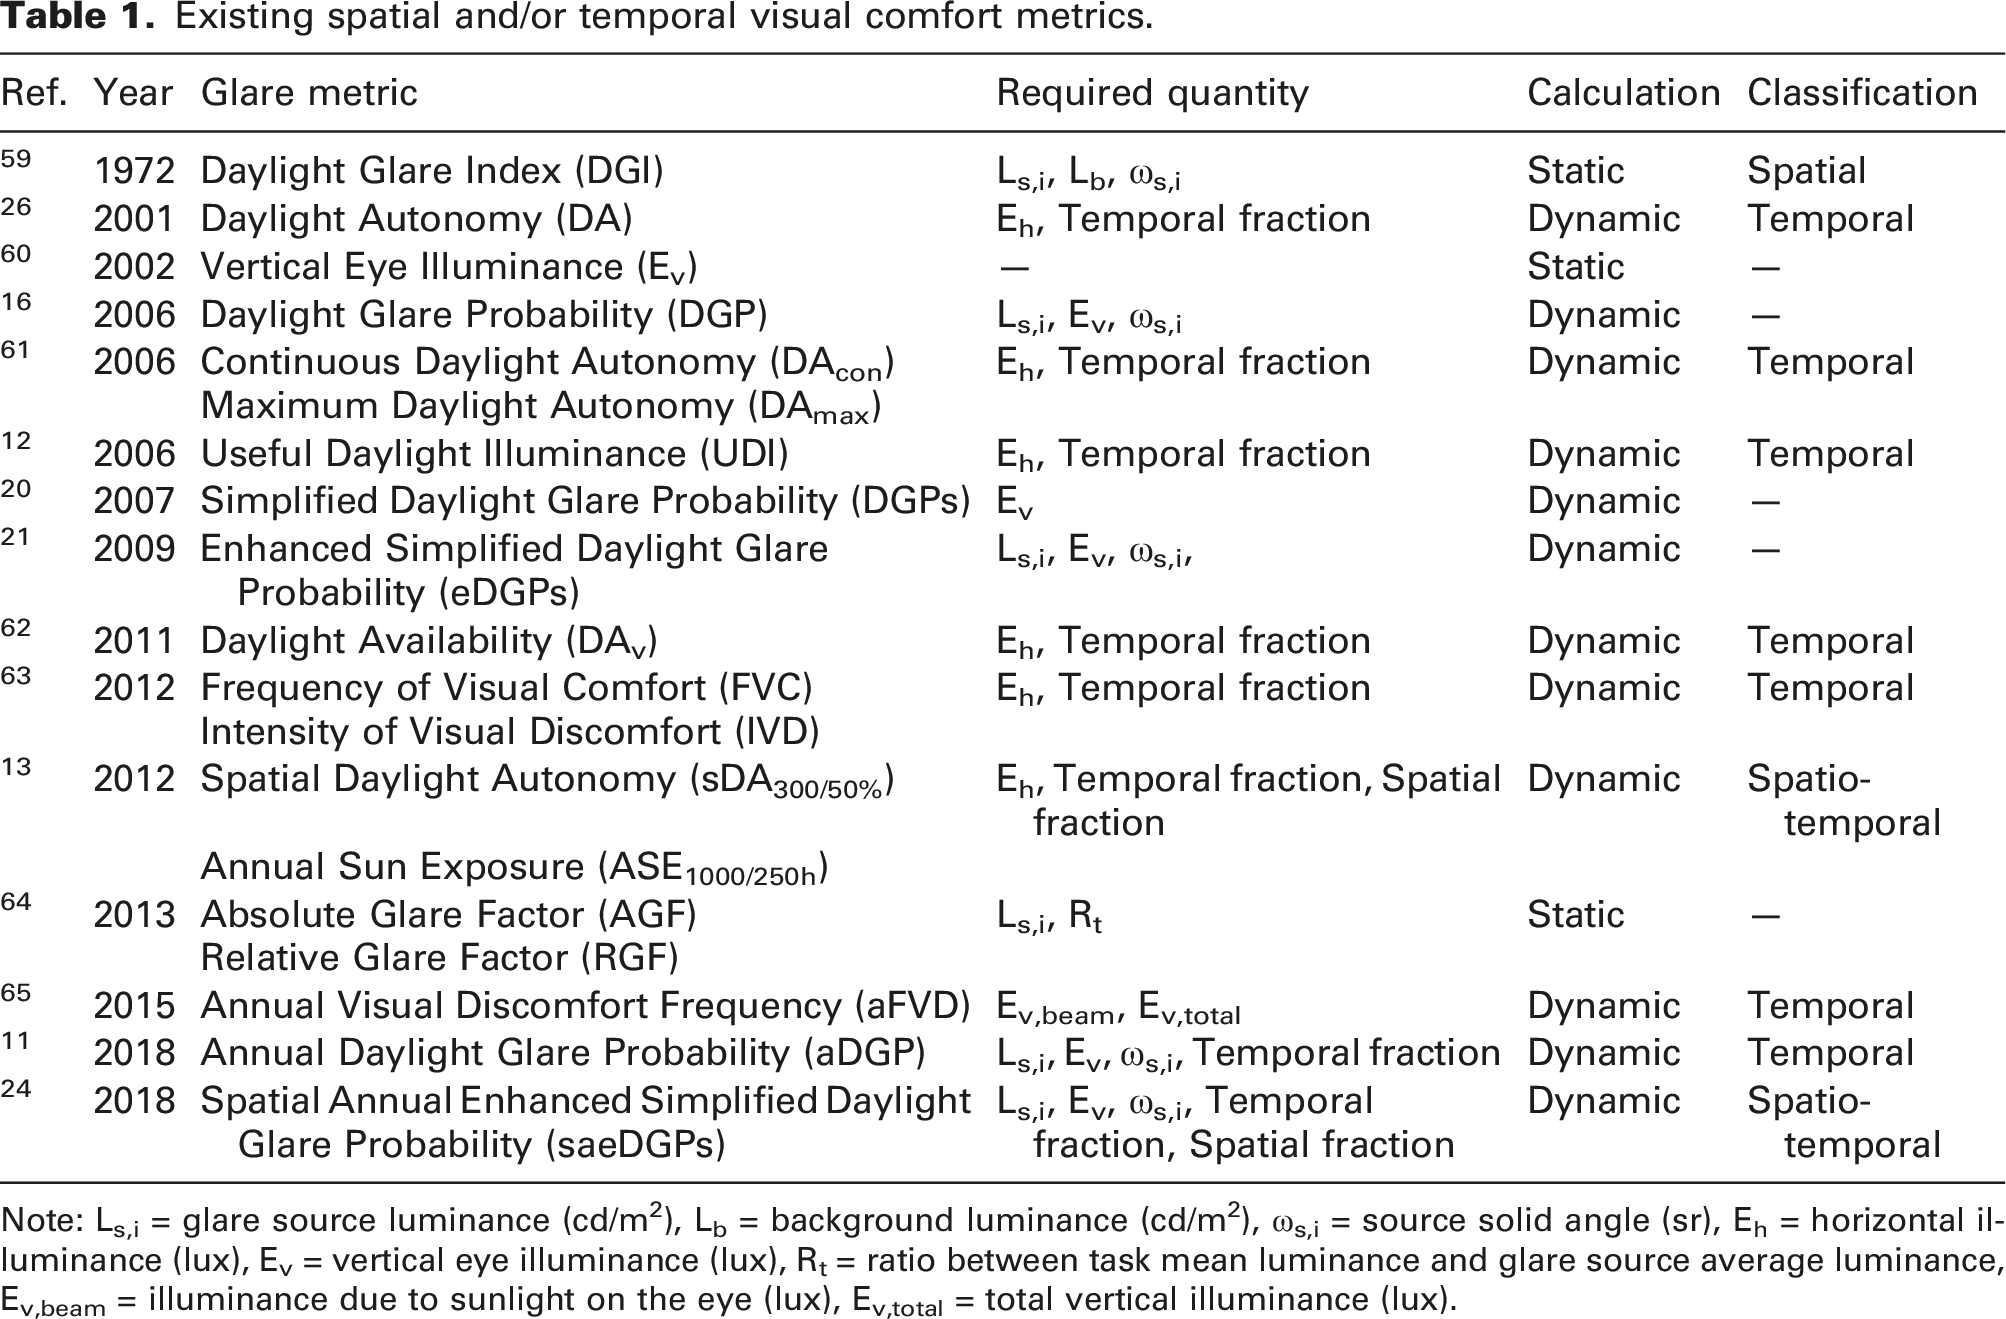
Note: Ls,i = glare source luminance (cd/m2), Lb = background luminance (cd/m2), ωs,i = source solid angle (sr), Eh = horizontal illuminance (lux), Ev = vertical eye illuminance (lux), Rt = ratio between task mean luminance and glare source average luminance, Ev,beam = illuminance due to sunlight on the eye (lux), Ev,total = total vertical illuminance (lux).
For accelerating the calculation of DGP, Wienold 20 developed an Ev-based simplification, DGP simplified (DGPs), which is quicker to calculate than full DGP, while it is not desirable in the case that is highly exposed to direct sunlight. Wienold and Reinhart’s study 16 verified that there exist dramatic deviations when using Ev to predict glare, especially when Ev is high. To address these limitations, Wienold 21 proposed the Enhanced Simplified Discomfort Glare Probability (eDGPs) which is more accurate than DGPs and, meanwhile, faster to simulate than DGP. Other attempts were carried out by Kleindienst et al. 22 who introduced the Model-based Daylight Glare Probability approximation method that only considers luminance sources and calculates the contrast term through low-render images at few representative timesteps across a year. 23 Aiming to achieve fast aDGP analysis, Jones and Reinhart 24 used GPU parallelization techniques to accelerate DGP simulations and advanced the spatial annual eDGPs (saeDGPs).
Visual comfort simulation methods
The past few decades have witnessed tremendous progress in daylight and glare simulation methods, from the conventional static methods, Daylight Factor (DF), to simulation-based approaches 25 that involve dynamic methods, Daylight Coefficient (DC)26,27 and Climate-based Daylight Modelling (CBDM).28,29 Later, several more efficient approaches for annual CBDM, such as 3-, 5- and 6-Phase methods,30–32 along with real-time simulation methods,24,33 were developed.
Recently, surrogate models built on machine/deep learning algorithms were extensively employed to handle complex non-linear problems like daylight and glare simulations, 34 serving as proxies to computationally sophisticated simulations. Ayoub et al. 35 developed five multivariate linear regression models to predict daylighting and energy consumption of residential buildings in hot-desert climates, which can provide designers with a pre-diagnostic tool without performing exhaustive analysis. Chatzikonstantinou and Sariyildiz 36 utilized machine learning algorithms to predict visual comfort in office buildings; three machine learning methods were compared in terms of their applicability in approximating DA and DGP. Ekici et al. 37 presented a multi-zone optimization methodology to support decision-making for high-rise buildings, in which artificial neural network (ANN) models were developed to predict daylight performance.
Research gaps and objectives
Despite many available simulation methods, tools and performance metrics, still, research gaps remain in spatio-temporal visual comfort assessment and optimization (ST-VCAO) within the domain of sports spaces: (i) Inefficacy: Very few of the existing daylight and glare metrics could simultaneously describe the spatial distribution and temporal variation of daylight availability and glare potential. They somehow reduce the simulation outputs into a single value which unavoidably sacrifices the sampling resolutions of visual comfort information and thus cannot address the complexity of spatio-temporal visual comfort in sports spaces. (ii) Insufficiency: Sports spaces differentiate from other spaces in occupants’ movement behaviour (OBm) involving the continuously changing view scenes, which would directly impact occupant’s glare perception across time and space. However, very limited attempts sought to study it, which results in performance discrepancies between the simulated models and actual ones. In most Ev or DGP-based glare studies, there were limited view scenes or timesteps being investigated, 38 which cannot be applied to sports spaces. (iii) Inefficiency: Most existing methods applying computational simulations for ST-VCAO that are time-consuming and can hardly provide immediate results and feedback. Furthermore, for large sports spaces, a heavy computation burden arises, resulting from the huge building massing (i.e. spatial sampling, view position and view direction), flexible occupancy schedules (i.e. temporal sampling, date and time) and complex visual tasks (i.e. occupant sampling, activity and identity). 39 Despite the availability of some advanced simulation tools (e.g. AcceleradRT and raytraverse), their applications for sports spaces were rare.
Therefore, this study aims to propose an occupant-centric approach for ST-VCAO of daylit sports spaces by better considering the OBm. The underlying hypothesis of the proposed approach is that OBm might directly affect the visual comfort in sports spaces, which could be appropriately modelled and computationally incorporated into glare simulation in terms of movable view scenes (MVS). The main objectives and contributions are as follows: • To incorporate MVS into annual glare simulation of daylit sports spaces, thereby realistically imitating player’s continuously changing view scenes in sports-related visual tasks; • To run GPU-based annual daylight and glare simulation in parallel for computation acceleration during the design of experiments (DoE) sampling; • To employ the response surface methodology-based multi-objective optimization and multi-criteria decision-making for determining the final optimum solution(s); • To develop a step-by-step data post-processing and visualization workflow for translating the visual comfort optimization results into intuitive design information.
Case building and targeted area
In this study, a four-storey NFH located in Harbin, northeast China (45.77 N, 126.68 E), was selected as the case building, as shown in Figure 1(a). It is a vertically functioned building and there is an open-plan sports space covered by a long-span roof on the top storey, which is divided into the tennis court area (with two standard tennis courts, courts #1 and 2) and the martial arts area. The tennis court area was determined as the sample sports space with the dimension of 42 m (length) × 44 m (width) × 15 m (height), which has east- and west-facing windows, blinds are closed during daily sports to prevent discomfort glare and supplementary electrical lighting is utilized. The player’s occupied area around courts #1 and 2 was specified as the targeted area (Figure 1(b)). Design information of the case building (unit: m): (a) case building and the sample sports space and (b) targeted area of the sample sports space.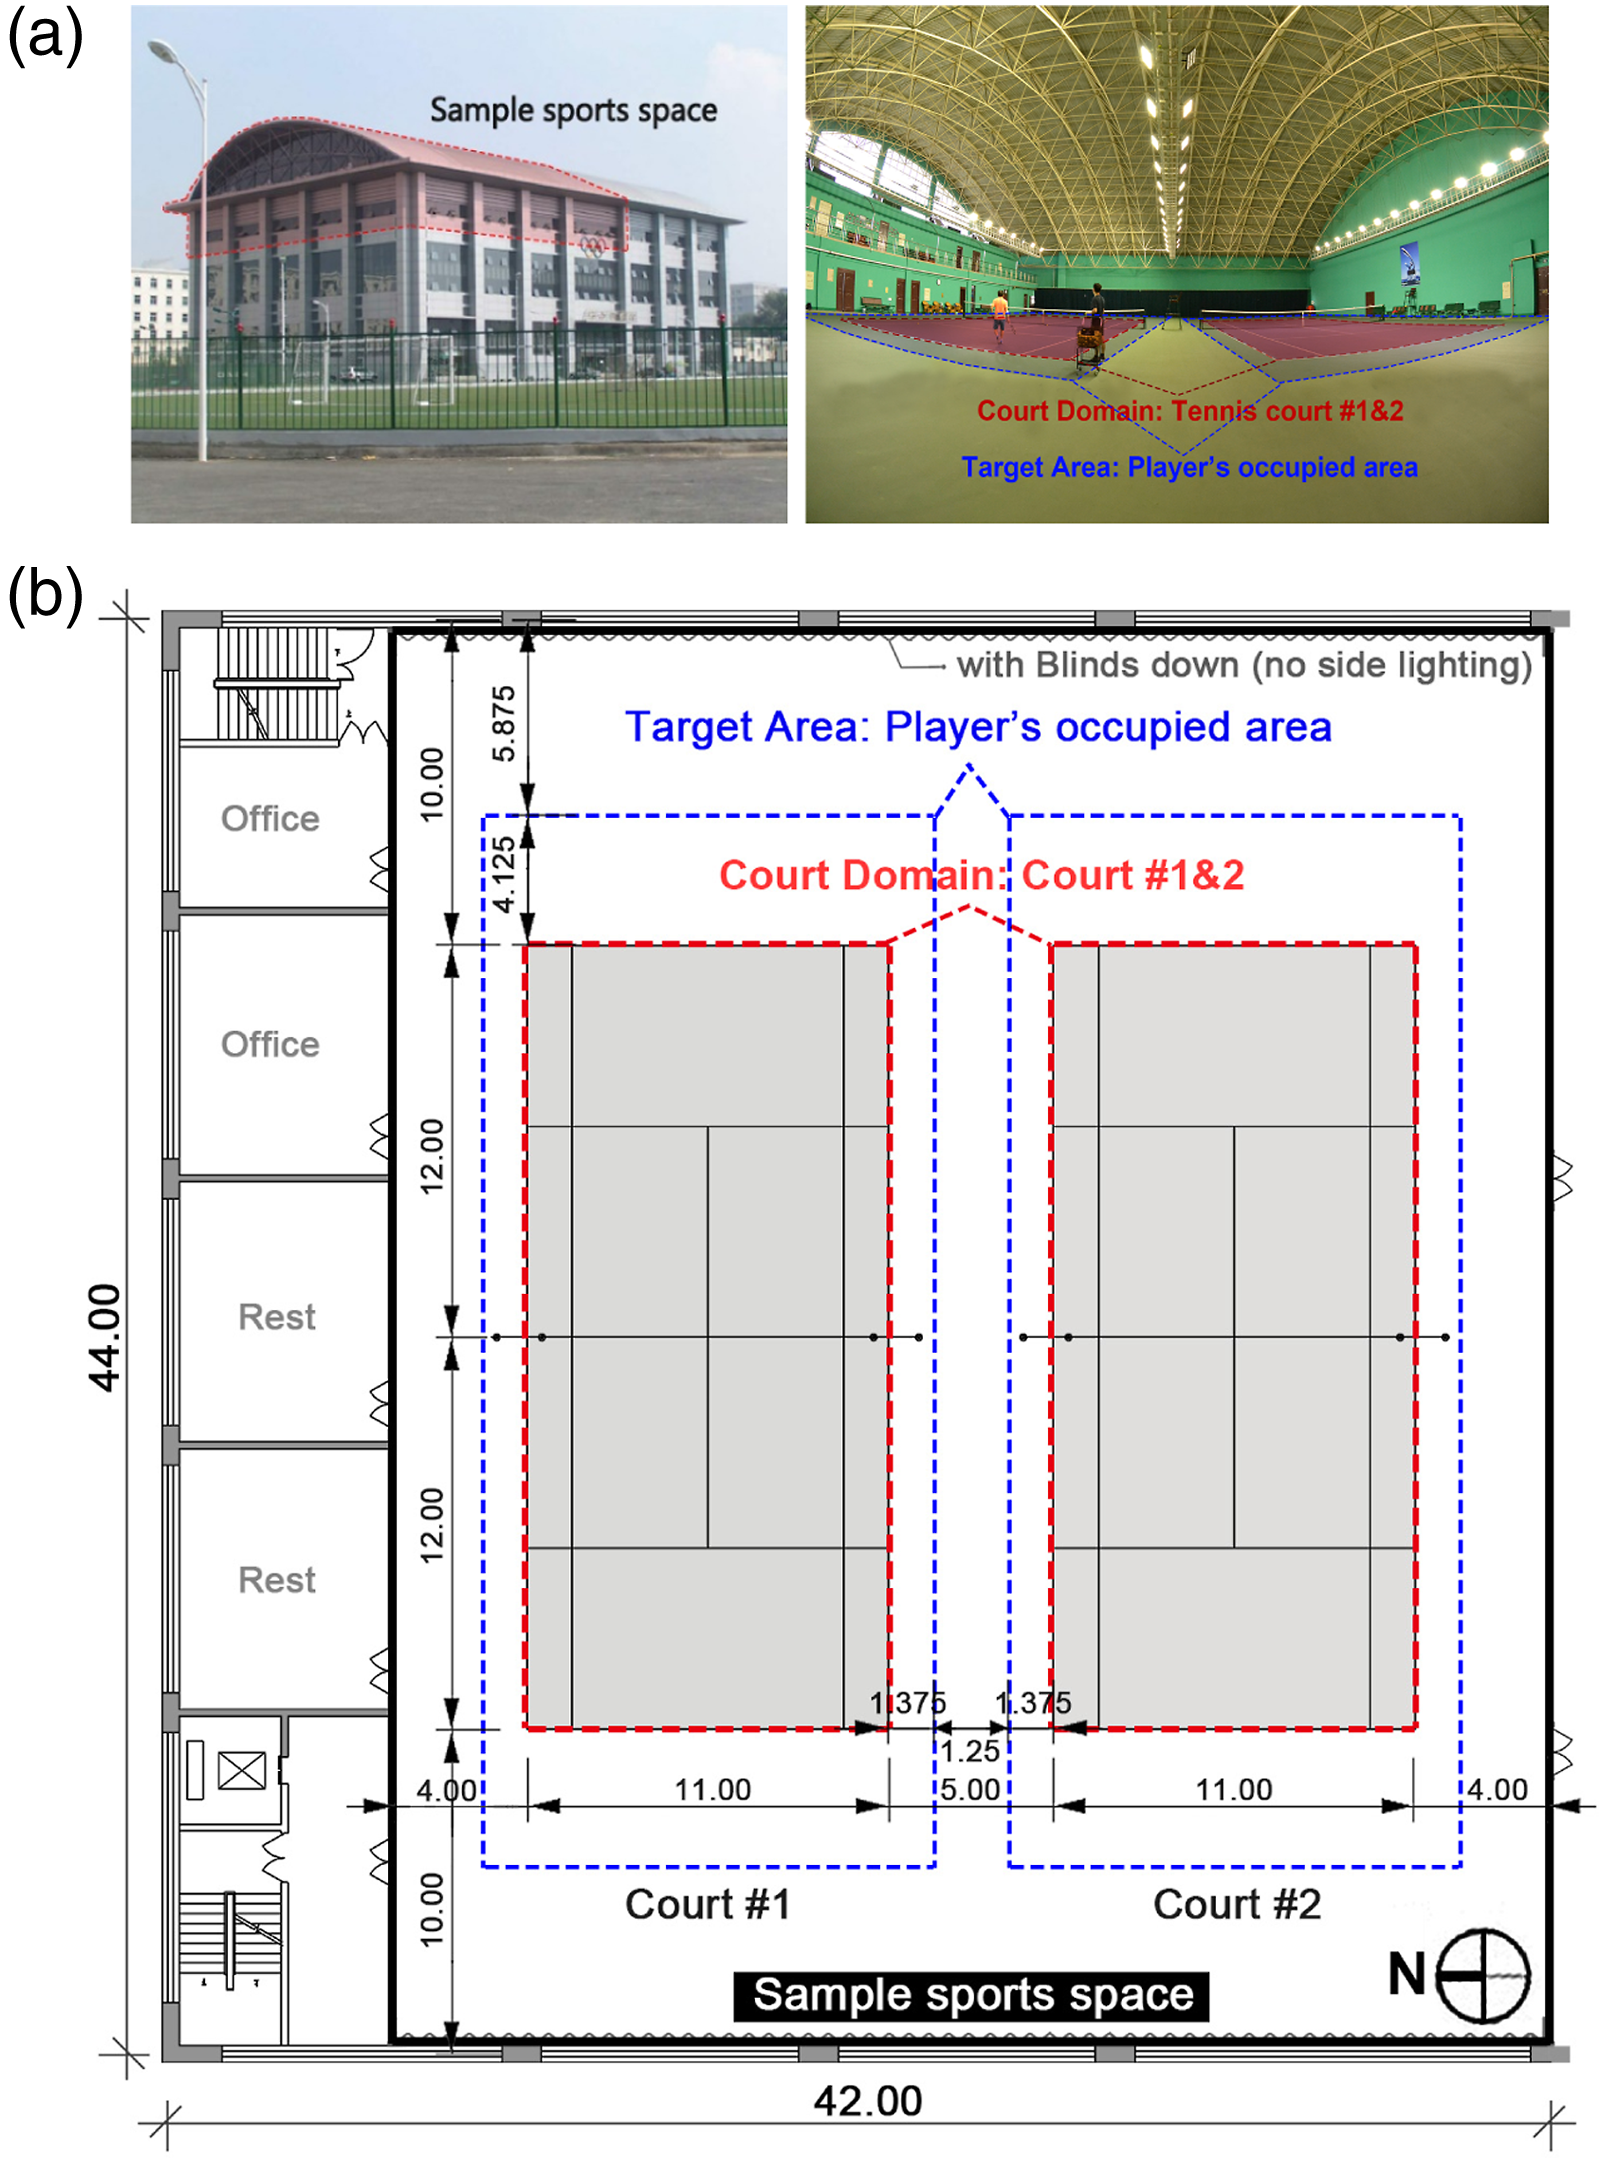
This case study attempted to introduce daylight into the sample sports space via roof skylights, aiming to reduce artificial lighting whilst ensuring visual comfort. Two cases with different retrofit design alternatives (RDAs) were determined, namely, RDA 1: horizontal skylights and RDA 2: vertical skylights. Each RDA can quickly generate many design options by adjusting predefined design variables. The main design purpose was to identify the optimal design solution(s) of skylight configurations that can achieve satisfying visual comfort in the targeted area.
Methodology
In order to predict and optimize spatio-temporal visual comfort in sports spaces by better considering the occupants’ movement behaviour, an occupant-centric approach combining surrogate modelling, computational optimization and decision-making and optimization results translation was proposed. Figure 2 illustrates the methodological framework of the proposed ST-VCAO approach, encompassing three phases composed of seven main steps: Step 1. Specify the model settings and conduct the design of experiments (DoE); Step 2. Occupants’ movement behaviour (OBm) modelling; Step 3. Perform annual daylight and glare simulation in parallel; Step 4. Establish the response surface model (RSM); Step 5. RSM-based multi-objective optimization (MOO); Step 6. Multi-criteria decision-making (MCDM); and Step 7. Data post-processing and visualization (DPPV). Methodological framework of the ST-VCAO approach.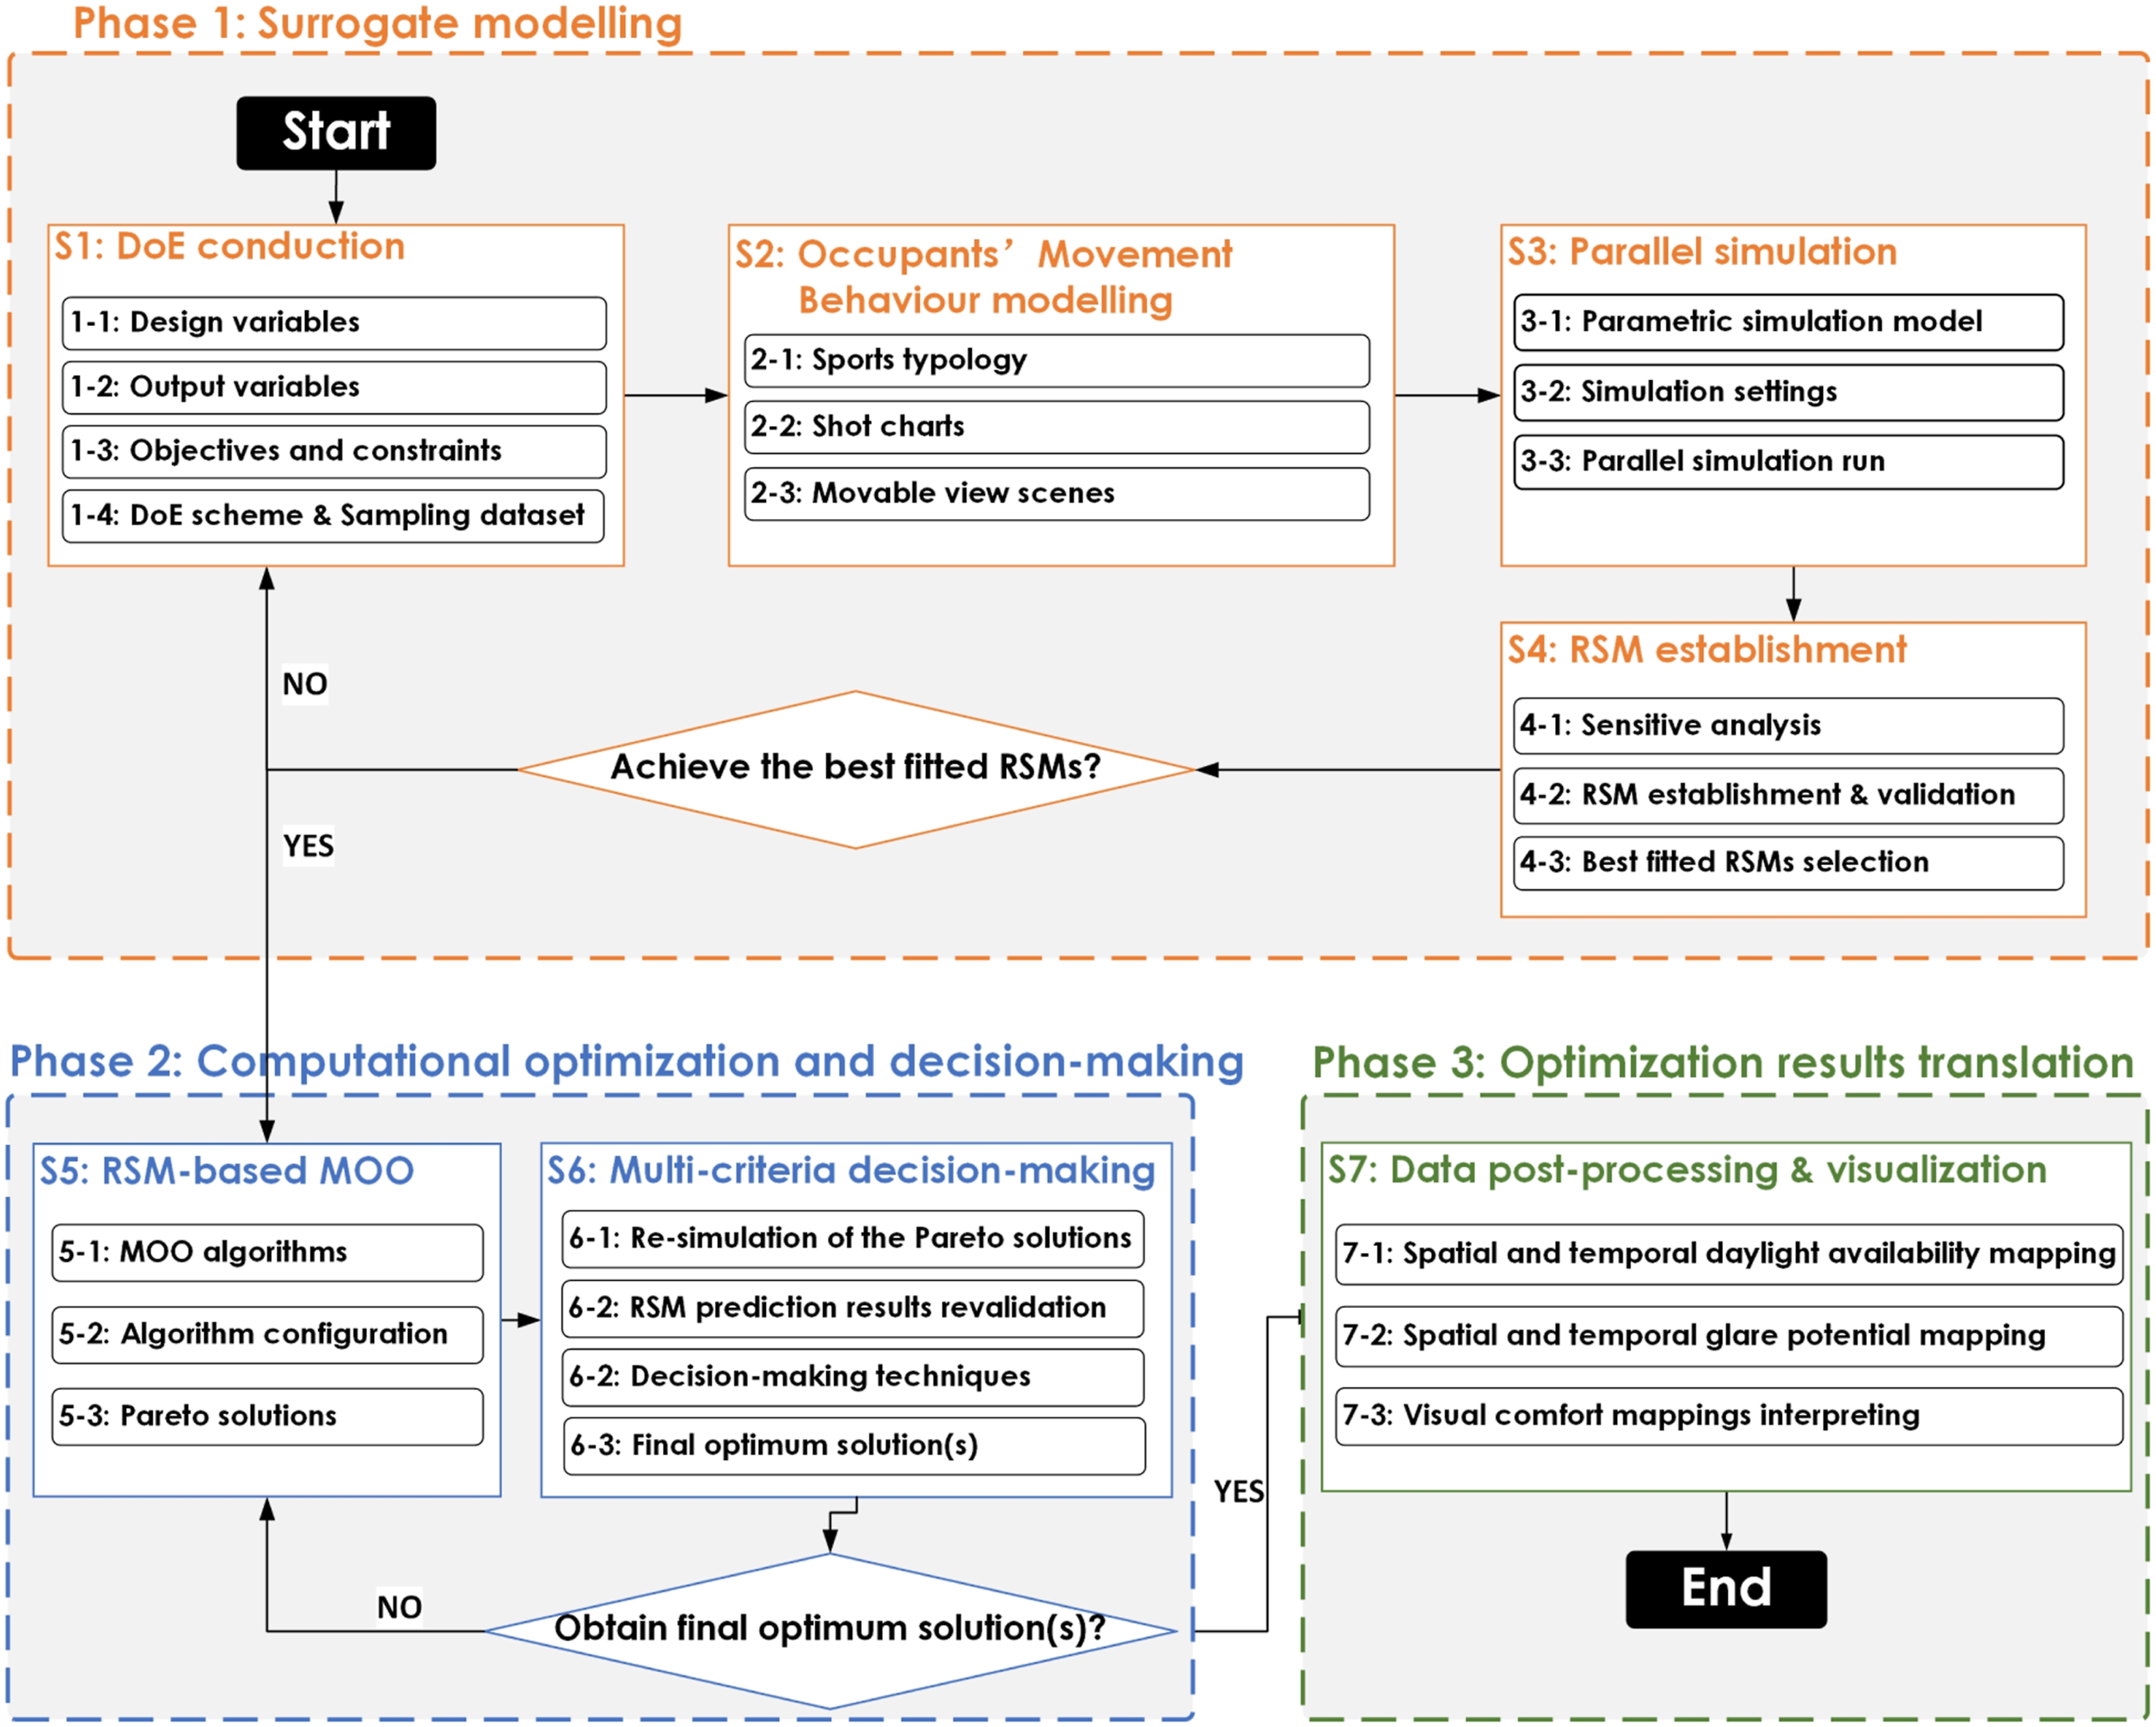
To achieve the above methodological framework, an integrated computational platform, Grasshopper-modeFRONTIER (GH-MF),40,41 was employed. GH-MF platform enables the automation of the entire workflow using the Grasshopper, Synchronizer and RSM nodes in MF. In this iterative process, MF is the driver that initiates the input data from DoE sampling dataset, as well as the switch to decide when to stop. GH generates building geometries and movable view scenes and specifies the model settings, based on which ClimateStudio performs the parallel simulation of annual daylight and glare and returns output data back to MF; specific workflows are as follows (Figure 3): Computational workflow of the ST-VCAO approach.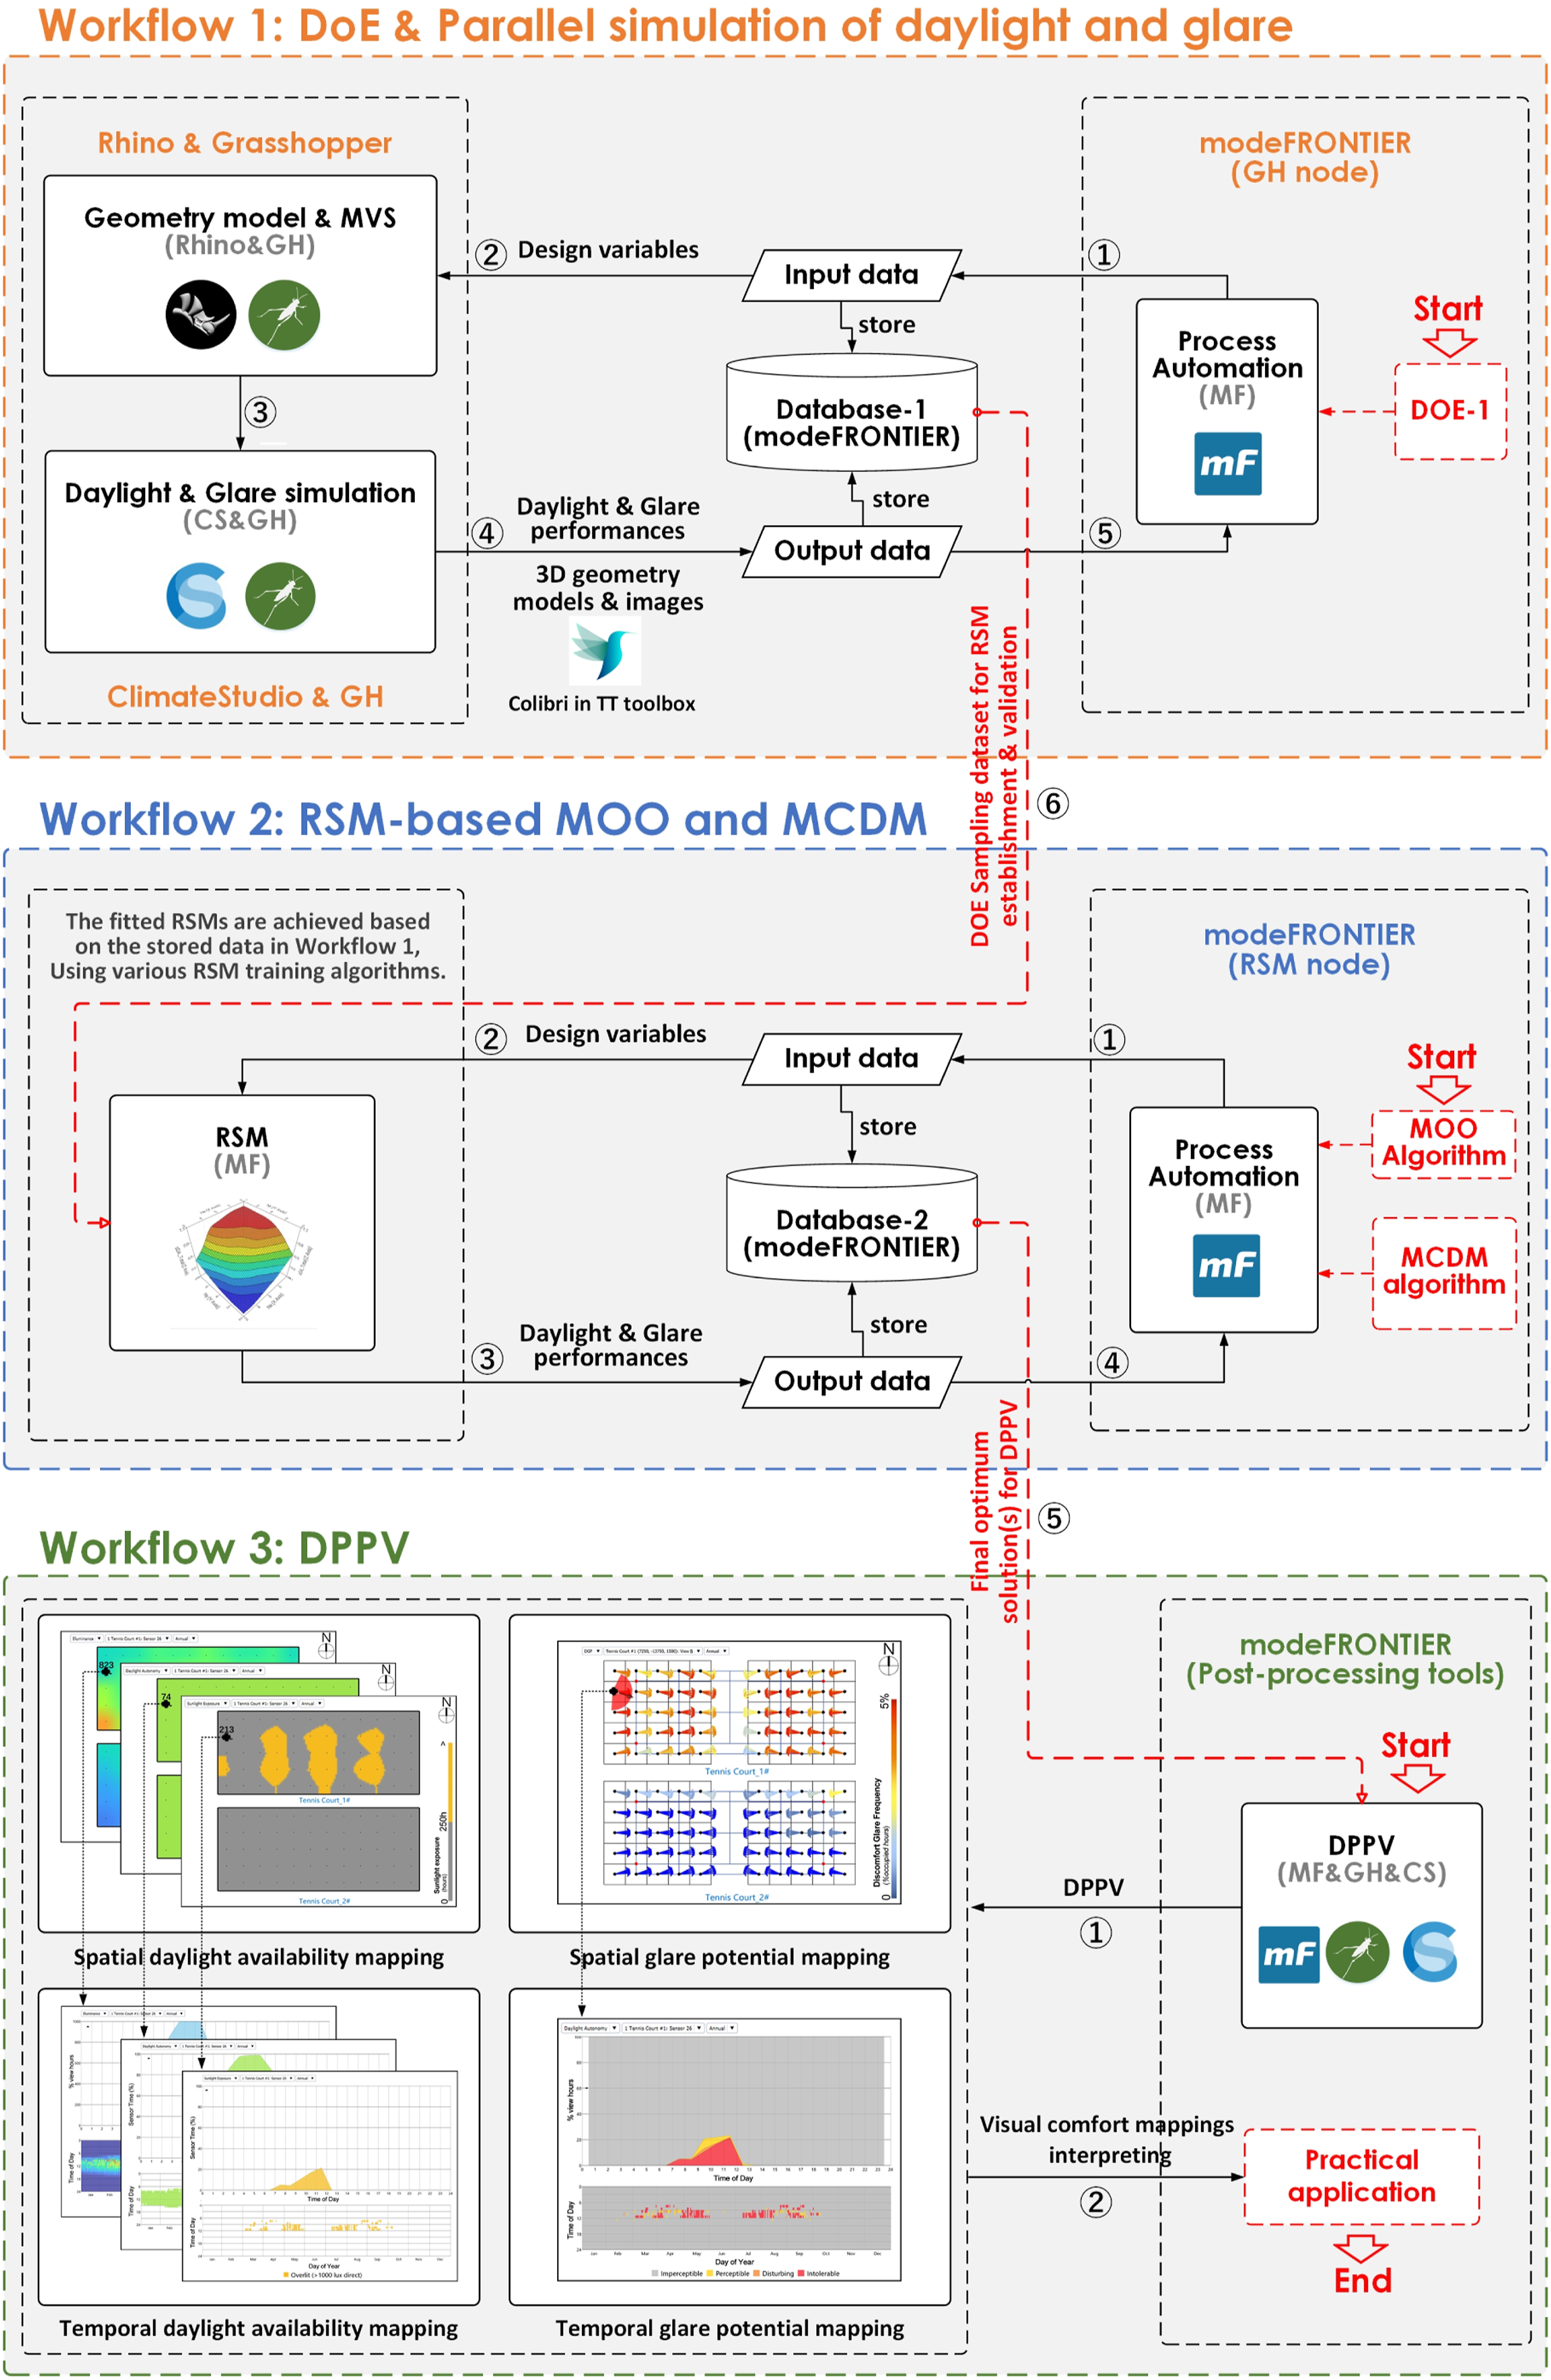
In workflow 1, (i) MF initiates the design of experiments (DoE) sampling dataset as input data, including design variables, output variables, objectives and constraints. (ii) A set of design variables were imported to GH, based on which building geometries were generated. Meanwhile, MVS were set up according to shot charts of the specific sport typology (tennis in this study); the parametric simulation model was established accordingly. (iii) ClimateStudio parallelly ran annual daylight and glare simulations using the as-generated parametric simulation model. (iv) The output variables including the calculated daylight and glare performances, 3D geometry models and images were returned back to MF as output data, which were simultaneously saved in the database. (v) The loop process continued until all DoE samples were calculated; all input and output data were saved in the database. (vi) Finally, the DoE results (pairs of input and output variables) were used for RSM training and validation. In workflow 2, the best fitted RSM combining NSGA-II algorithm was employed to quickly optimize daylight and glare performance; the whole iteration process remained the same as workflow 1, except that the physical daylight and glare simulations were replaced by the RSM approximation. After achieving the MOO results, re-simulations of those Pareto solutions were conducted to revalidate the RSM prediction results. Then, MCDM technique was applied to determine the final optimum solution from all Pareto solutions (re-simulated). In workflow 3, (i) after achieving the final optimum solution(s), the step-by-step DPPV including the spatial and temporal daylight availability and glare potential mapping were conducted; (ii) consequently, visual comfort mappings were intuitively translated into design recommendations for practical applications.
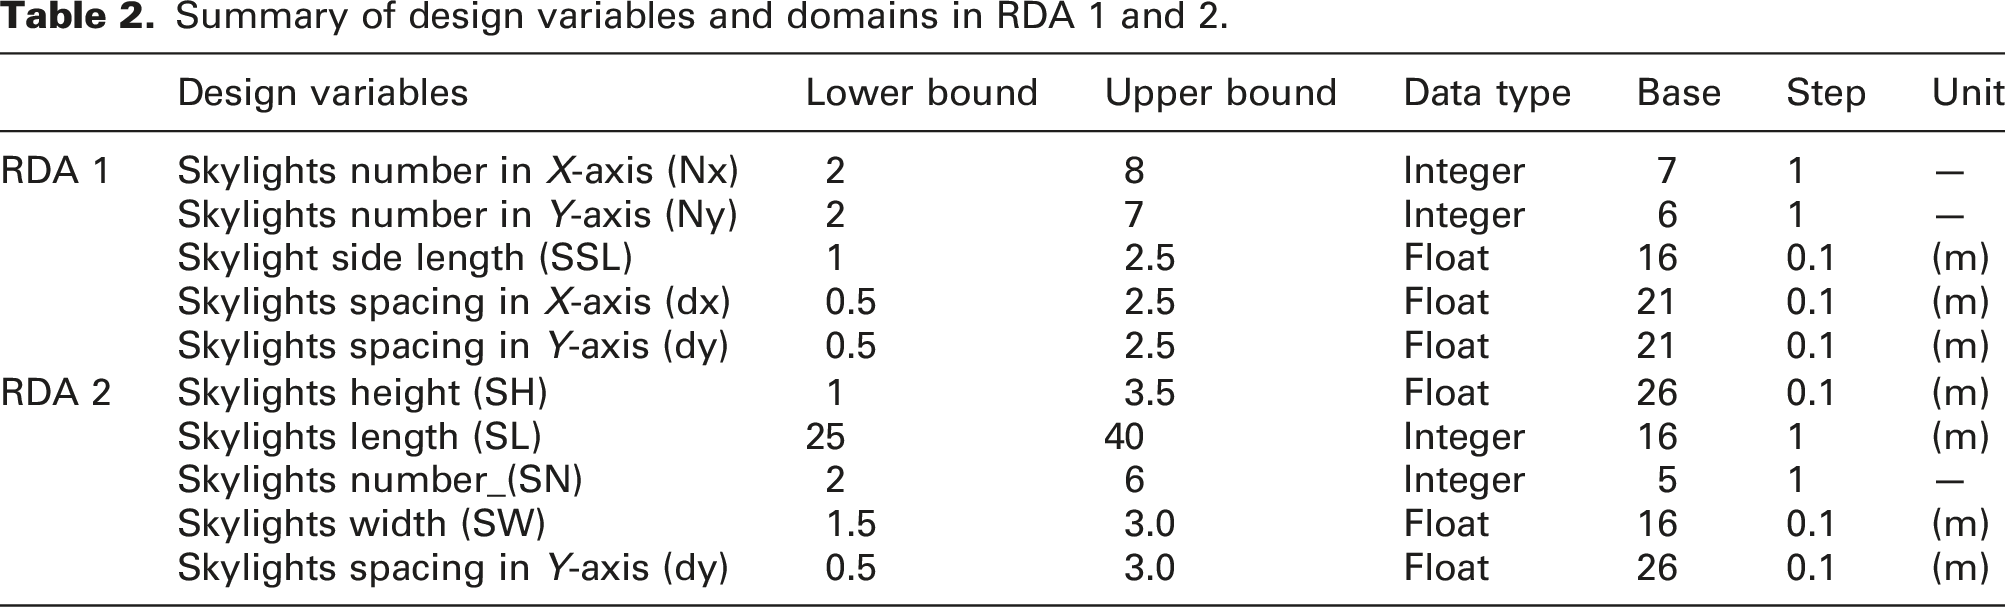
Design of Experiment
The first part of DoE was to identify the design variables. In previous studies,40–42 skylight dimensions and layouts have been found to be detrimental factors affecting indoor lighting environment in large sports spaces, which could significantly affect occupant’s visual comfort. Thus, in this study, five independent design variables that control the skylight size and layout were initially selected for two types of RDAs, namely, Design information of the RDA 1: horizontal skylights and RDA 2: vertical skylights (Unit: m). (a) RDA 1 and (b) RDA 2. Summary of design variables and domains in RDA 1 and 2.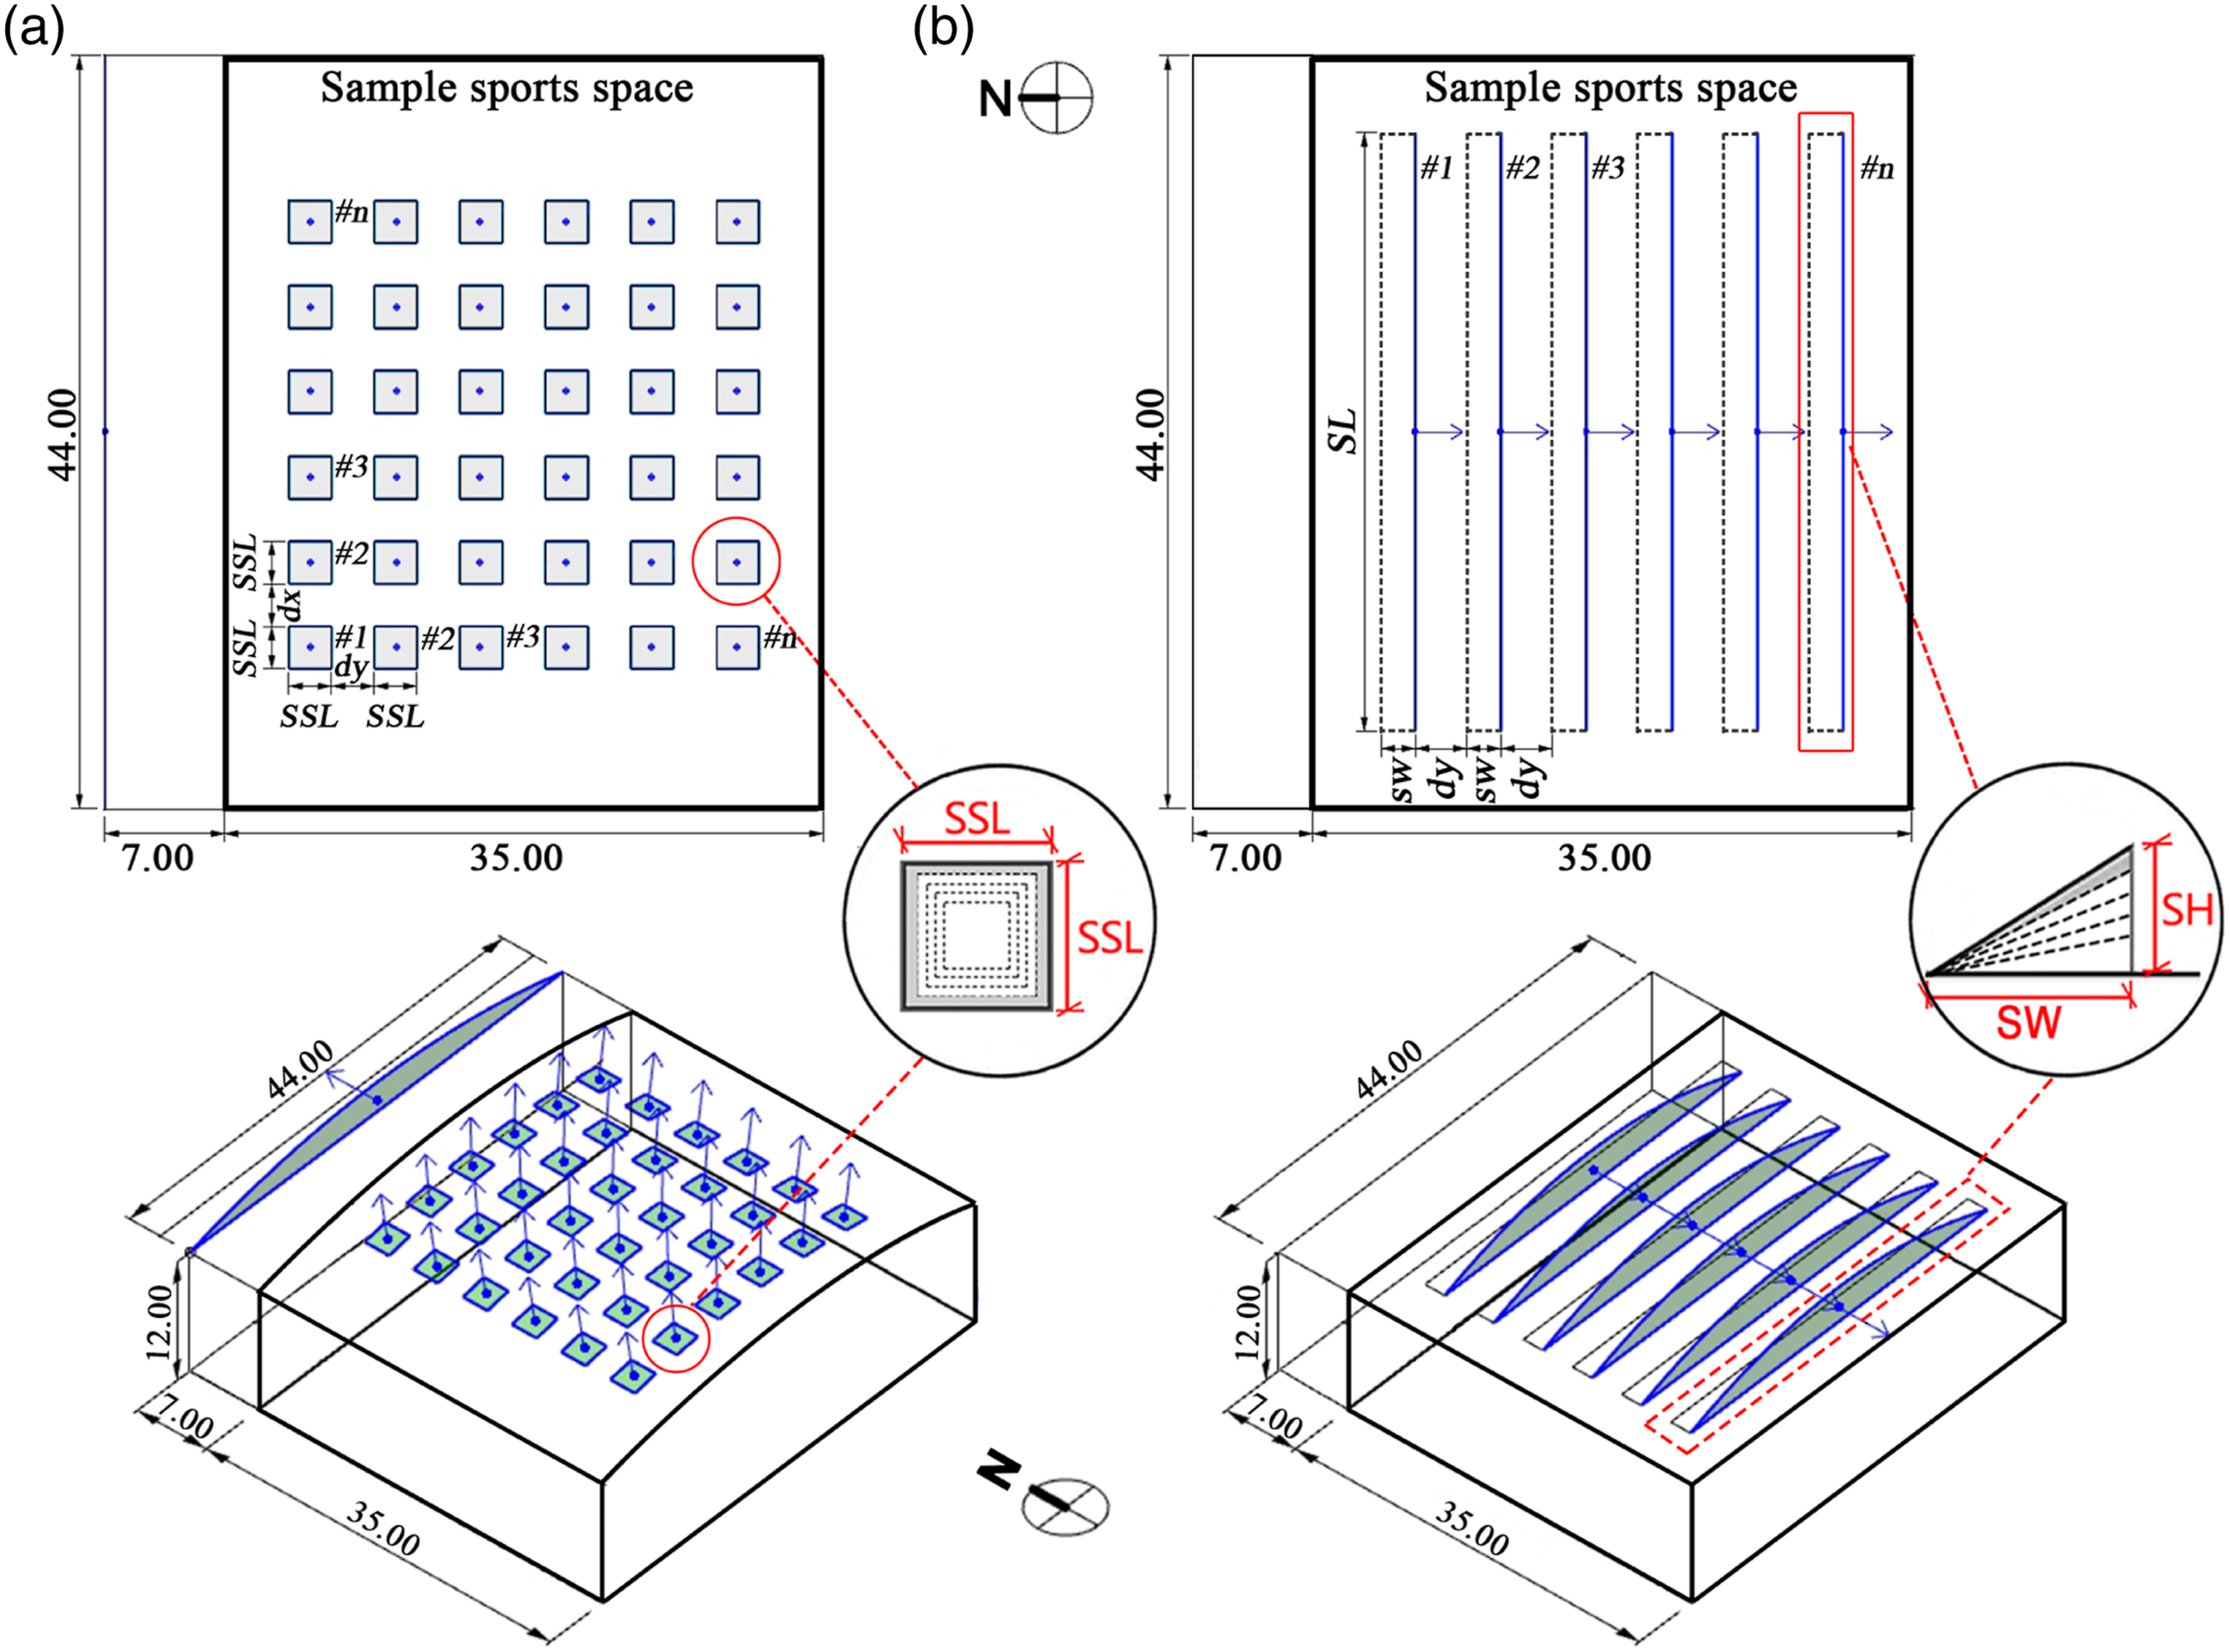
Summary of output variables and boundaries in RDA 1 and 2.
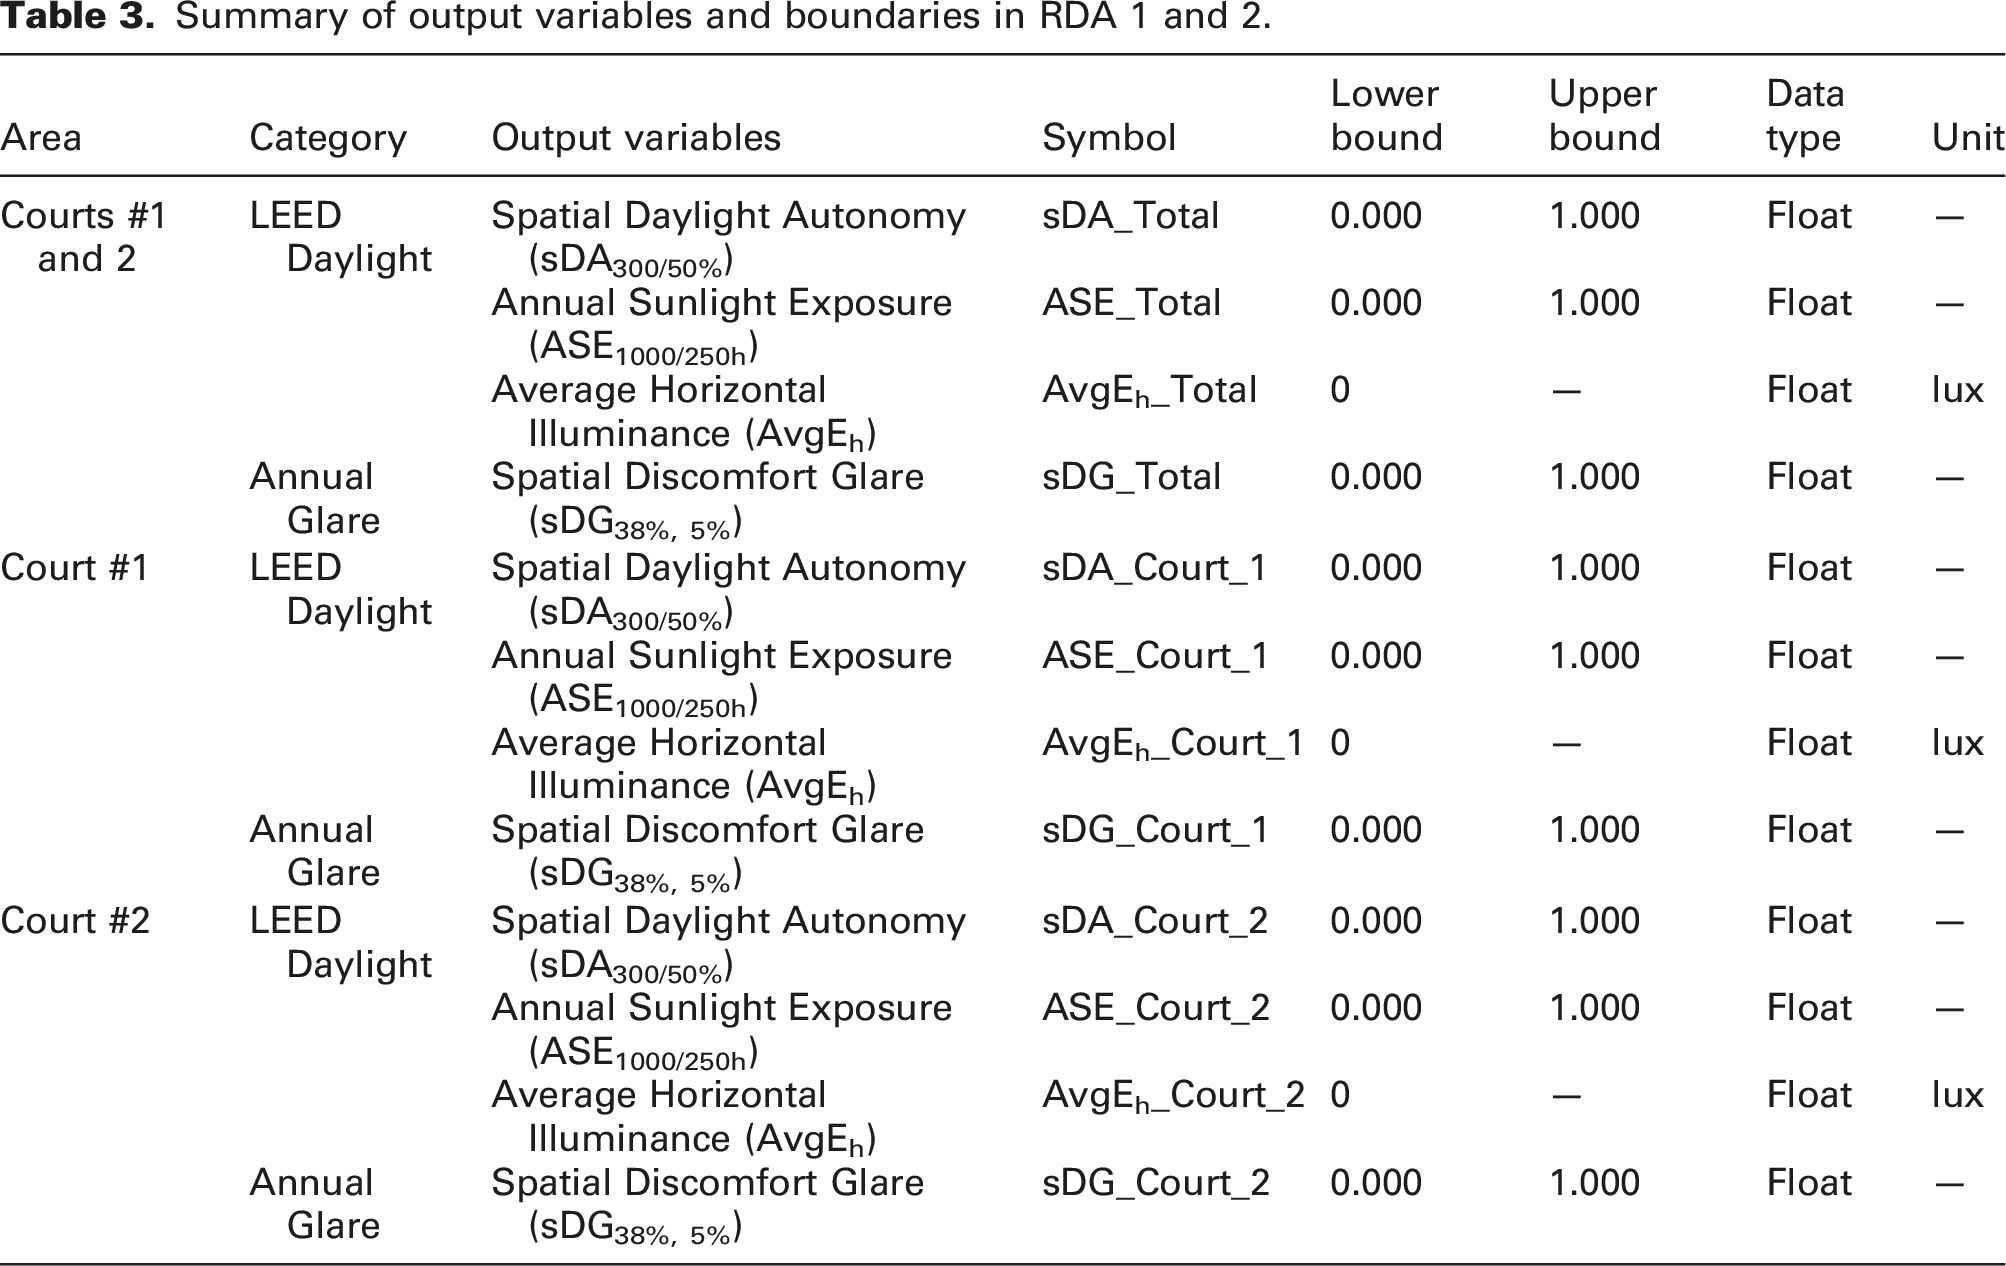
The third part of DoE was to configure the objectives and constraints. In this study, daylight and glare performances were equivalently weighted in ST-VCAO. Correspondently, three objectives, namely, max_sDA_Total, min_ASE_Total and min_sDG_Total, were determined to synthetically optimize the overall spatio-temporal visual comfort in sports spaces. The constraints of sDA, ASE and sDG are [0.55, 1], [0, 0.1] and [0, 0.5], respectively.
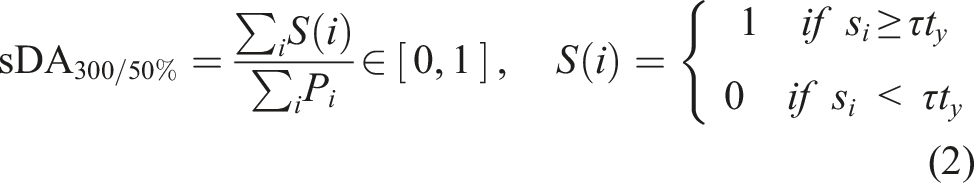
Spatial Daylight Autonomy (sDA300/50%)
The percentage of a space that receives a minimum target illuminance of 300 lx for temporal fraction threshold of 50% of annual occupied hours was calculated according to equation (2)
13
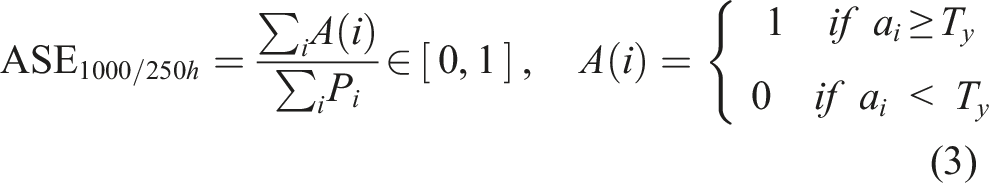
Annual Sunlight Exposure (ASE1000/250h)
The percentage of a space that receives a minimum direct sunlight of 1000 lx for absolute hour threshold of 250 h of annual occupied hours was calculated according to equation (3)
13
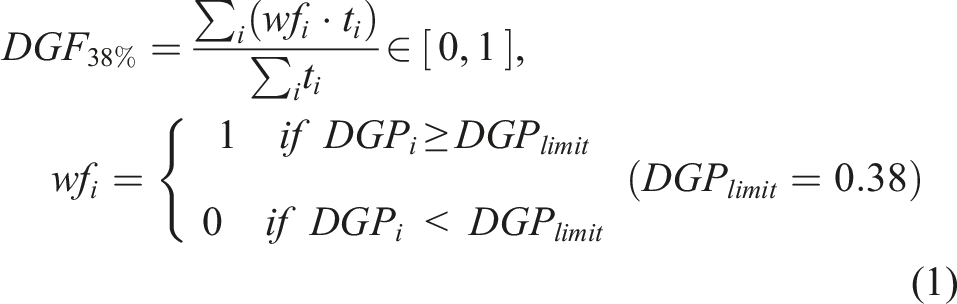
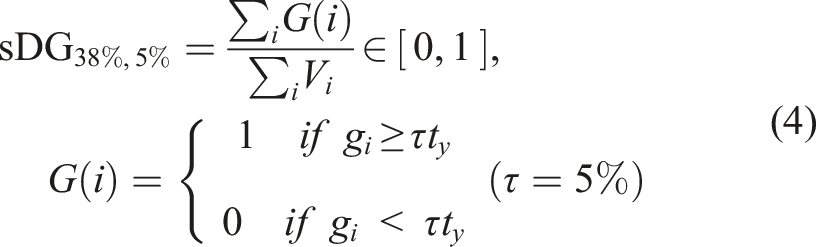
Spatial Discomfort Glare (sDG38%, 5%)
The fraction of view scenes in a space that experience discomfort glare exceeding a temporal fraction threshold of 5% of annual occupied hours was calculated according to equation (4)
14
The last part of DoE was to select the DoE scheme and generate sampling datasets. Uniform Latin Hypercube (ULH)
43
is a stochastic DoE sampling algorithm that can generate uniformly distributed designs and has been widely utilized in computational optimization designs combined with building performance simulation.37,40,44 Hence, it was employed to generate a total of 400 initial design samples in this study;36,45,46 the as-generated sampling dataset 

Occupant’s movement behaviour modelling
Sports behaviour
Sports spaces often demand critical visual tasks involving fast moving objects and players, where player’s real-time locations and movements are uncertain and uneasy to predict.
47
Moreover, various sports activities would be carried out in sports spaces, which mainly could be classified into three types: (i) VP-dominated; (ii) VD-dominated and (iii) VP and VD-dominated. For some VP-dominated sports such as tennis and badminton, players may continually look towards similar objective directions across different VPs. For some VD-dominated sports like boxing and taekwondo, players may constantly occupy similar VPs with various VDs. While for some VD- and VP-dominated sports like basketball and ice hockey, players’ VPs and VDs simultaneously change across the duration of the whole sport. Amongst them, occupants’ movement behaviour (OBm) is a leading source of uncertainty in ST-VCAO. Although various approaches have been proposed to model adaptive and non-adaptive behaviours, this is rare for the OBm.
39
Albeit it is difficult to favour a method over another a priori, a shot chart is a flexible method to understand players’ on-court behaviour which maps players’ shot patterns from particular areas of the court, as shown in Figure 5. It can reflect the occurring frequency of players’ VPs and VDs during sports, which is of particular interest for ST-VCAO. Hence, this study selected the tennis single as the investigated sports type, and the shot chart was used to model OBm concerning the player’s VPs and VDs. Shot charts from a professional tennis player (Note: This figure has been permitted to use in this paper by its copyright holder, Damien Saunder, source from: https://tennismash.com/2016/01/18/kei-nishikori-shot-charts/).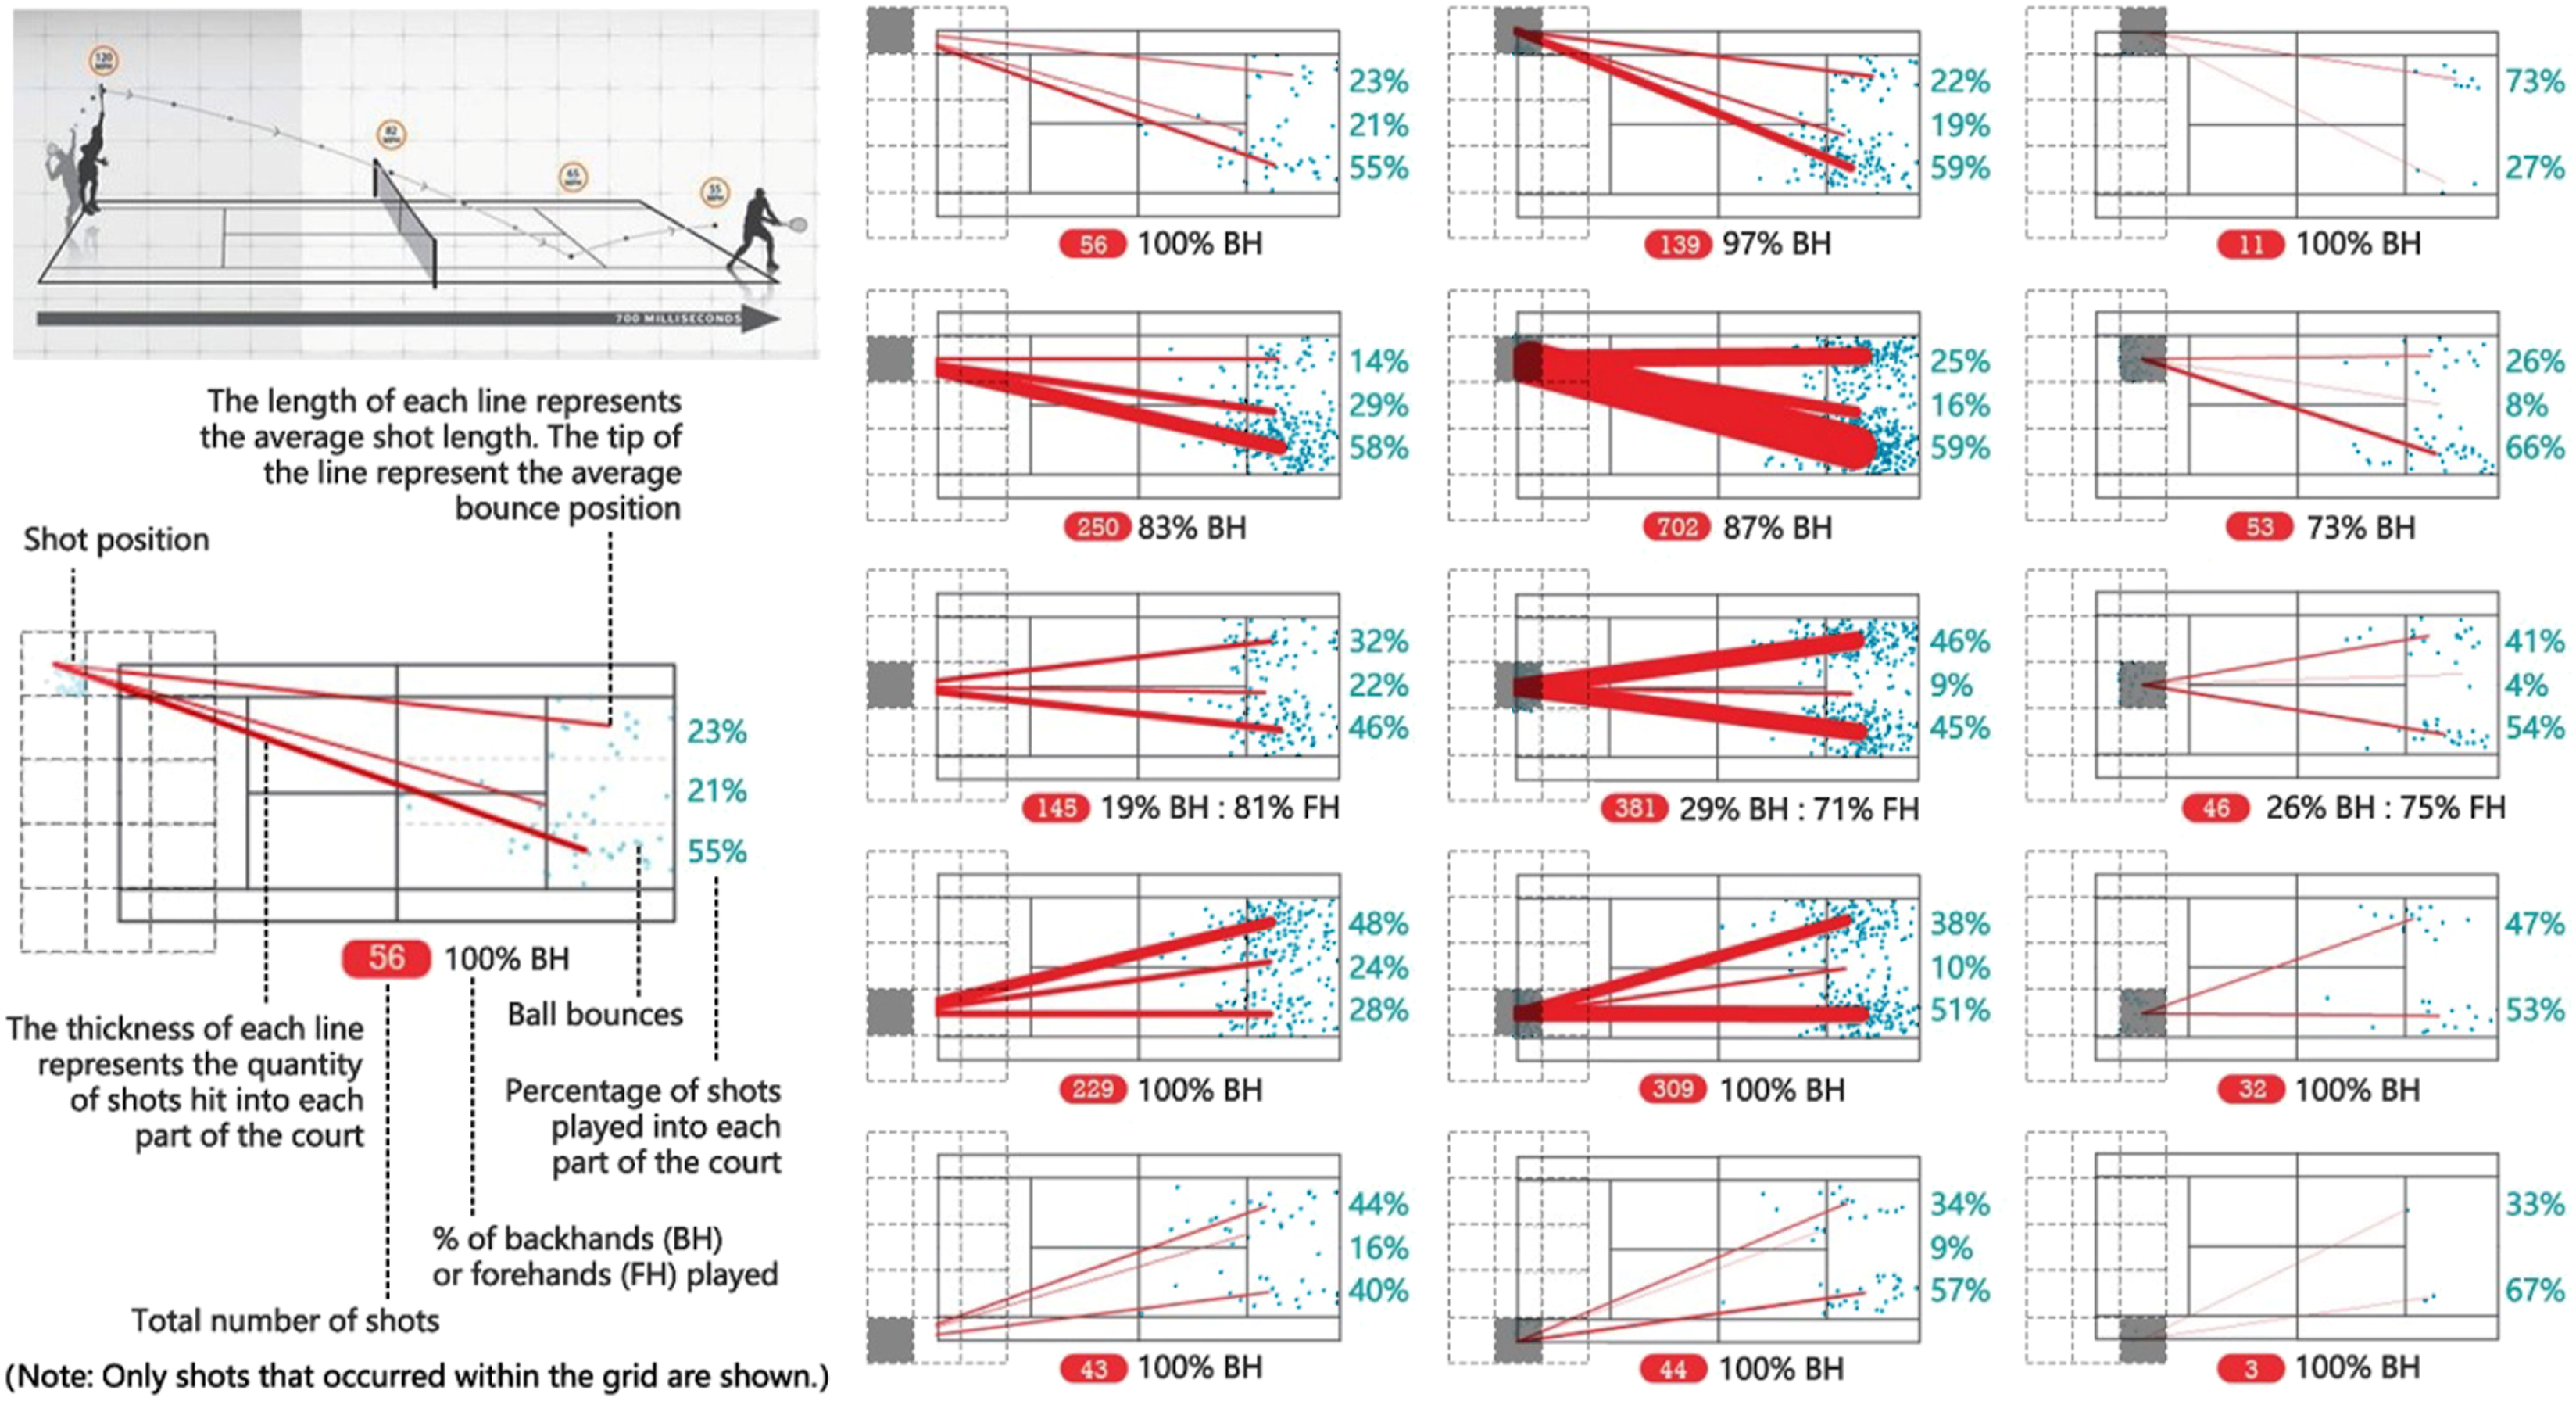
Movable view scenes
The concept of ‘Movable View Scenes’ (MVS) was initially introduced to represent player’s frequently experienced view scenes in sports spaces in this study, which represents the shiftable VPs with rotatable VDs in horizontal dimensions that typically cover the targeted area of the studied space. Figure 6 illustrates the player’s move from Pi to Pj, along with the corresponding change of Di to Dj, thus the Vi to Vj. In this study, a total of 500 MVS around two tennis courts were set up in glare simulations, at a vertical eye height of 1.5 m.48,49 The angle of rotatable VDs was dependent on the specific VP and the object points, O1 and O2 (i.e. boundary point of the court domain), and the distance of shiftable VPs was set to 2.75 m. Those MVS were derived from the shot charts of a professional tennis player that were played over a period of 6 months (see Figure 5), which is a significant amount of tennis player-tracking data. Additionally, players' tracking data in Floyd’s study was also taken into account. Illustration of the MVS and 500 total MVS in the targeted area.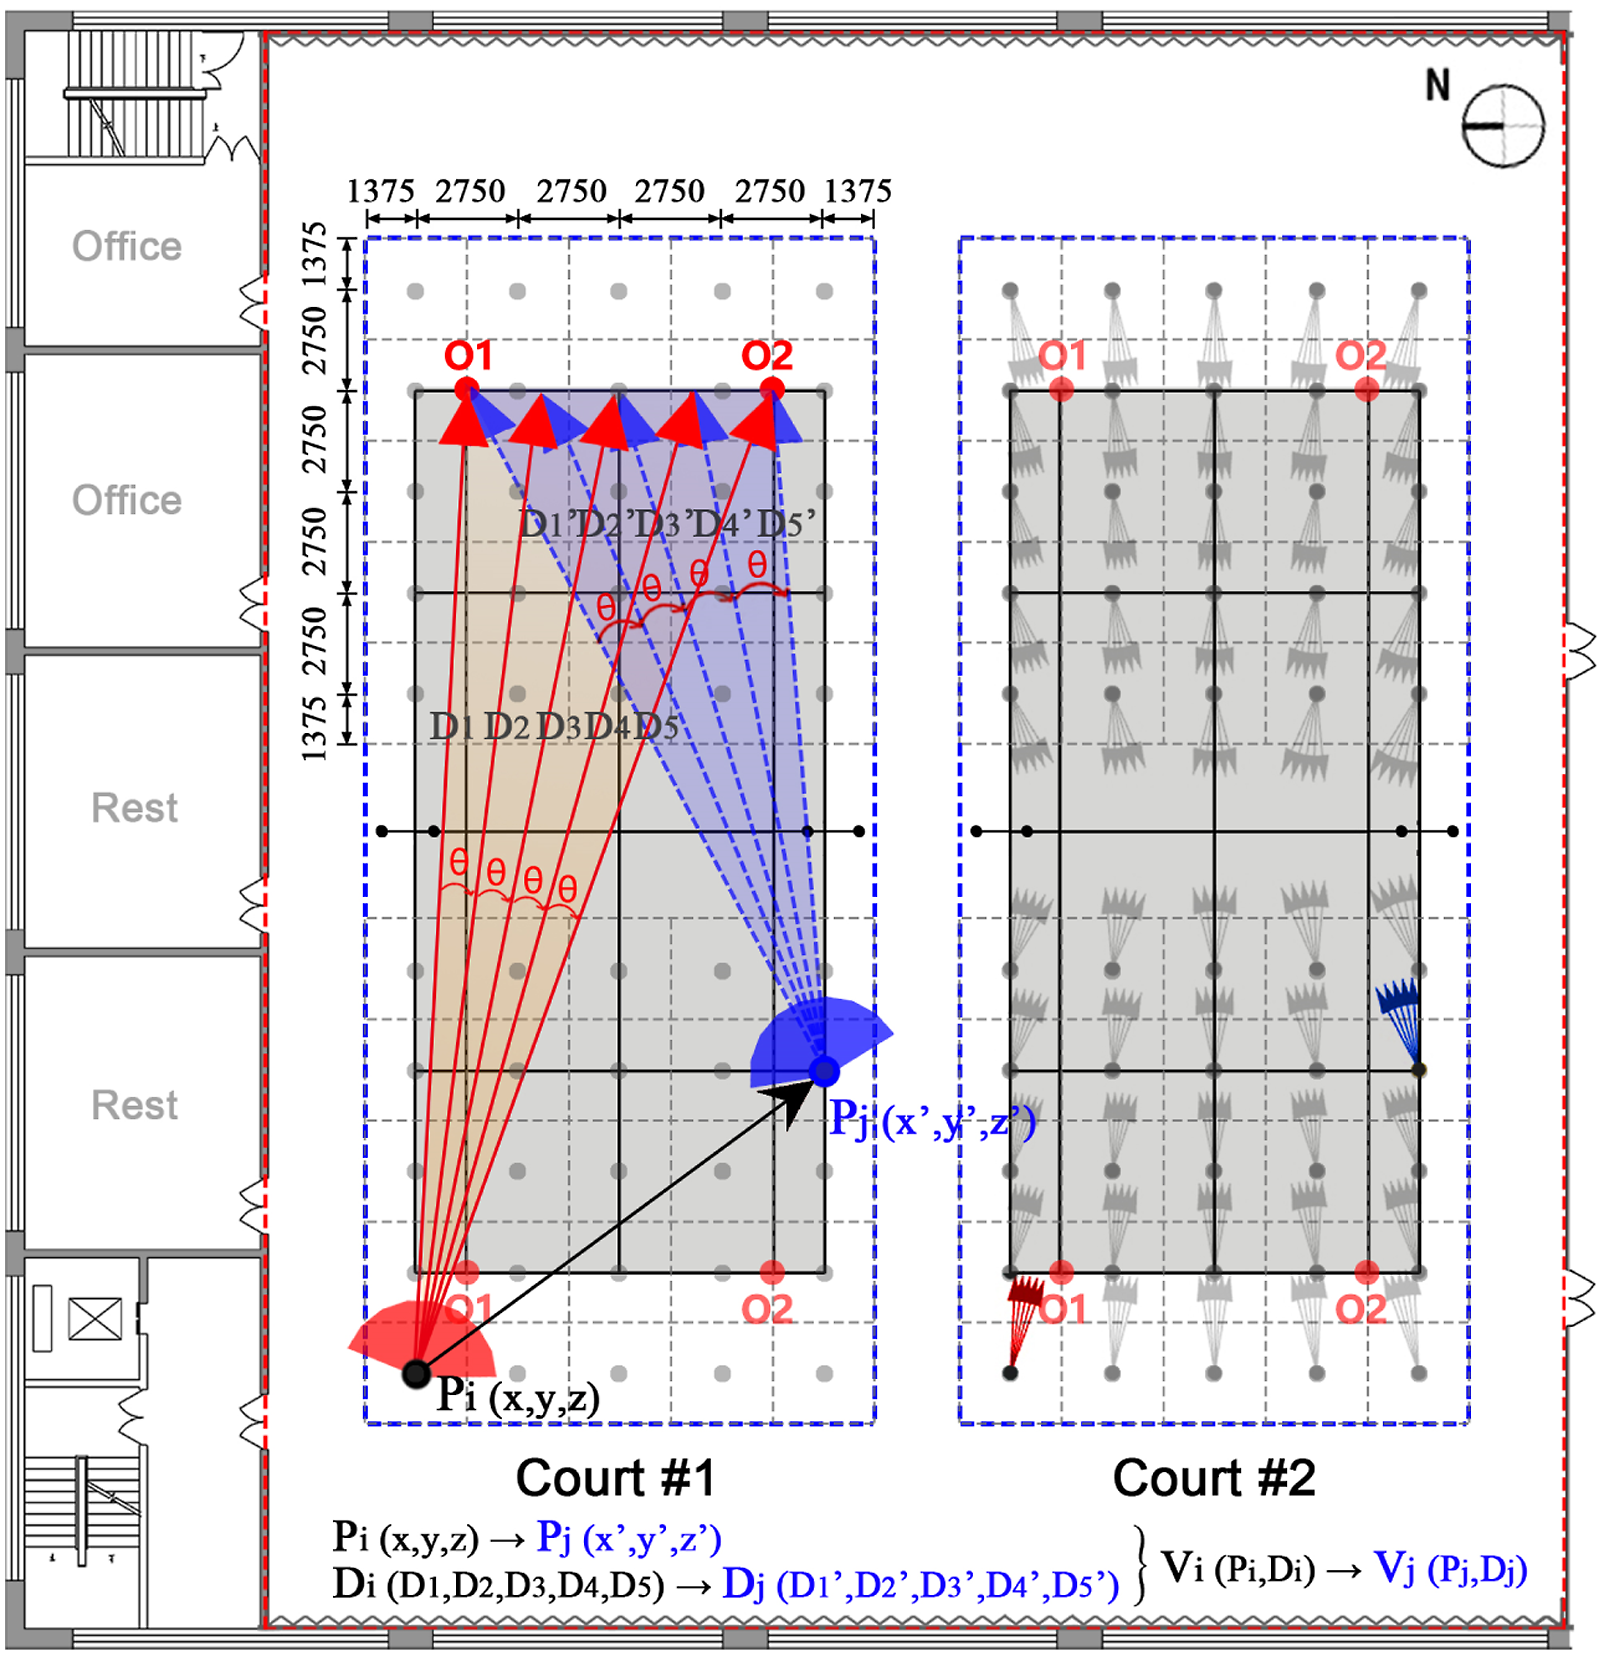
Parallel simulation
Parametric simulation model
The parametric simulation model consists of a series of correlative modules including design variables, geometry model, simulation settings, simulation model and output variables. It links the design information with environmental conditions, enabling automatic generation of various design options and performance simulations. In this study, parametric simulation models of two RDAs were established in Rhinoceros
50
and Grasshopper
51
along with ClimateStudio,
52
in which predefined MVS were specially customized. Daylight and glare simulation modules are two main parts that were run in parallel to save computational time. The parametric simulation model was linked with the MF model to automatically process the parallel simulation run, as shown in Figure 7. Parametric simulation model (GH model, top) and the integration with MF model (bottom).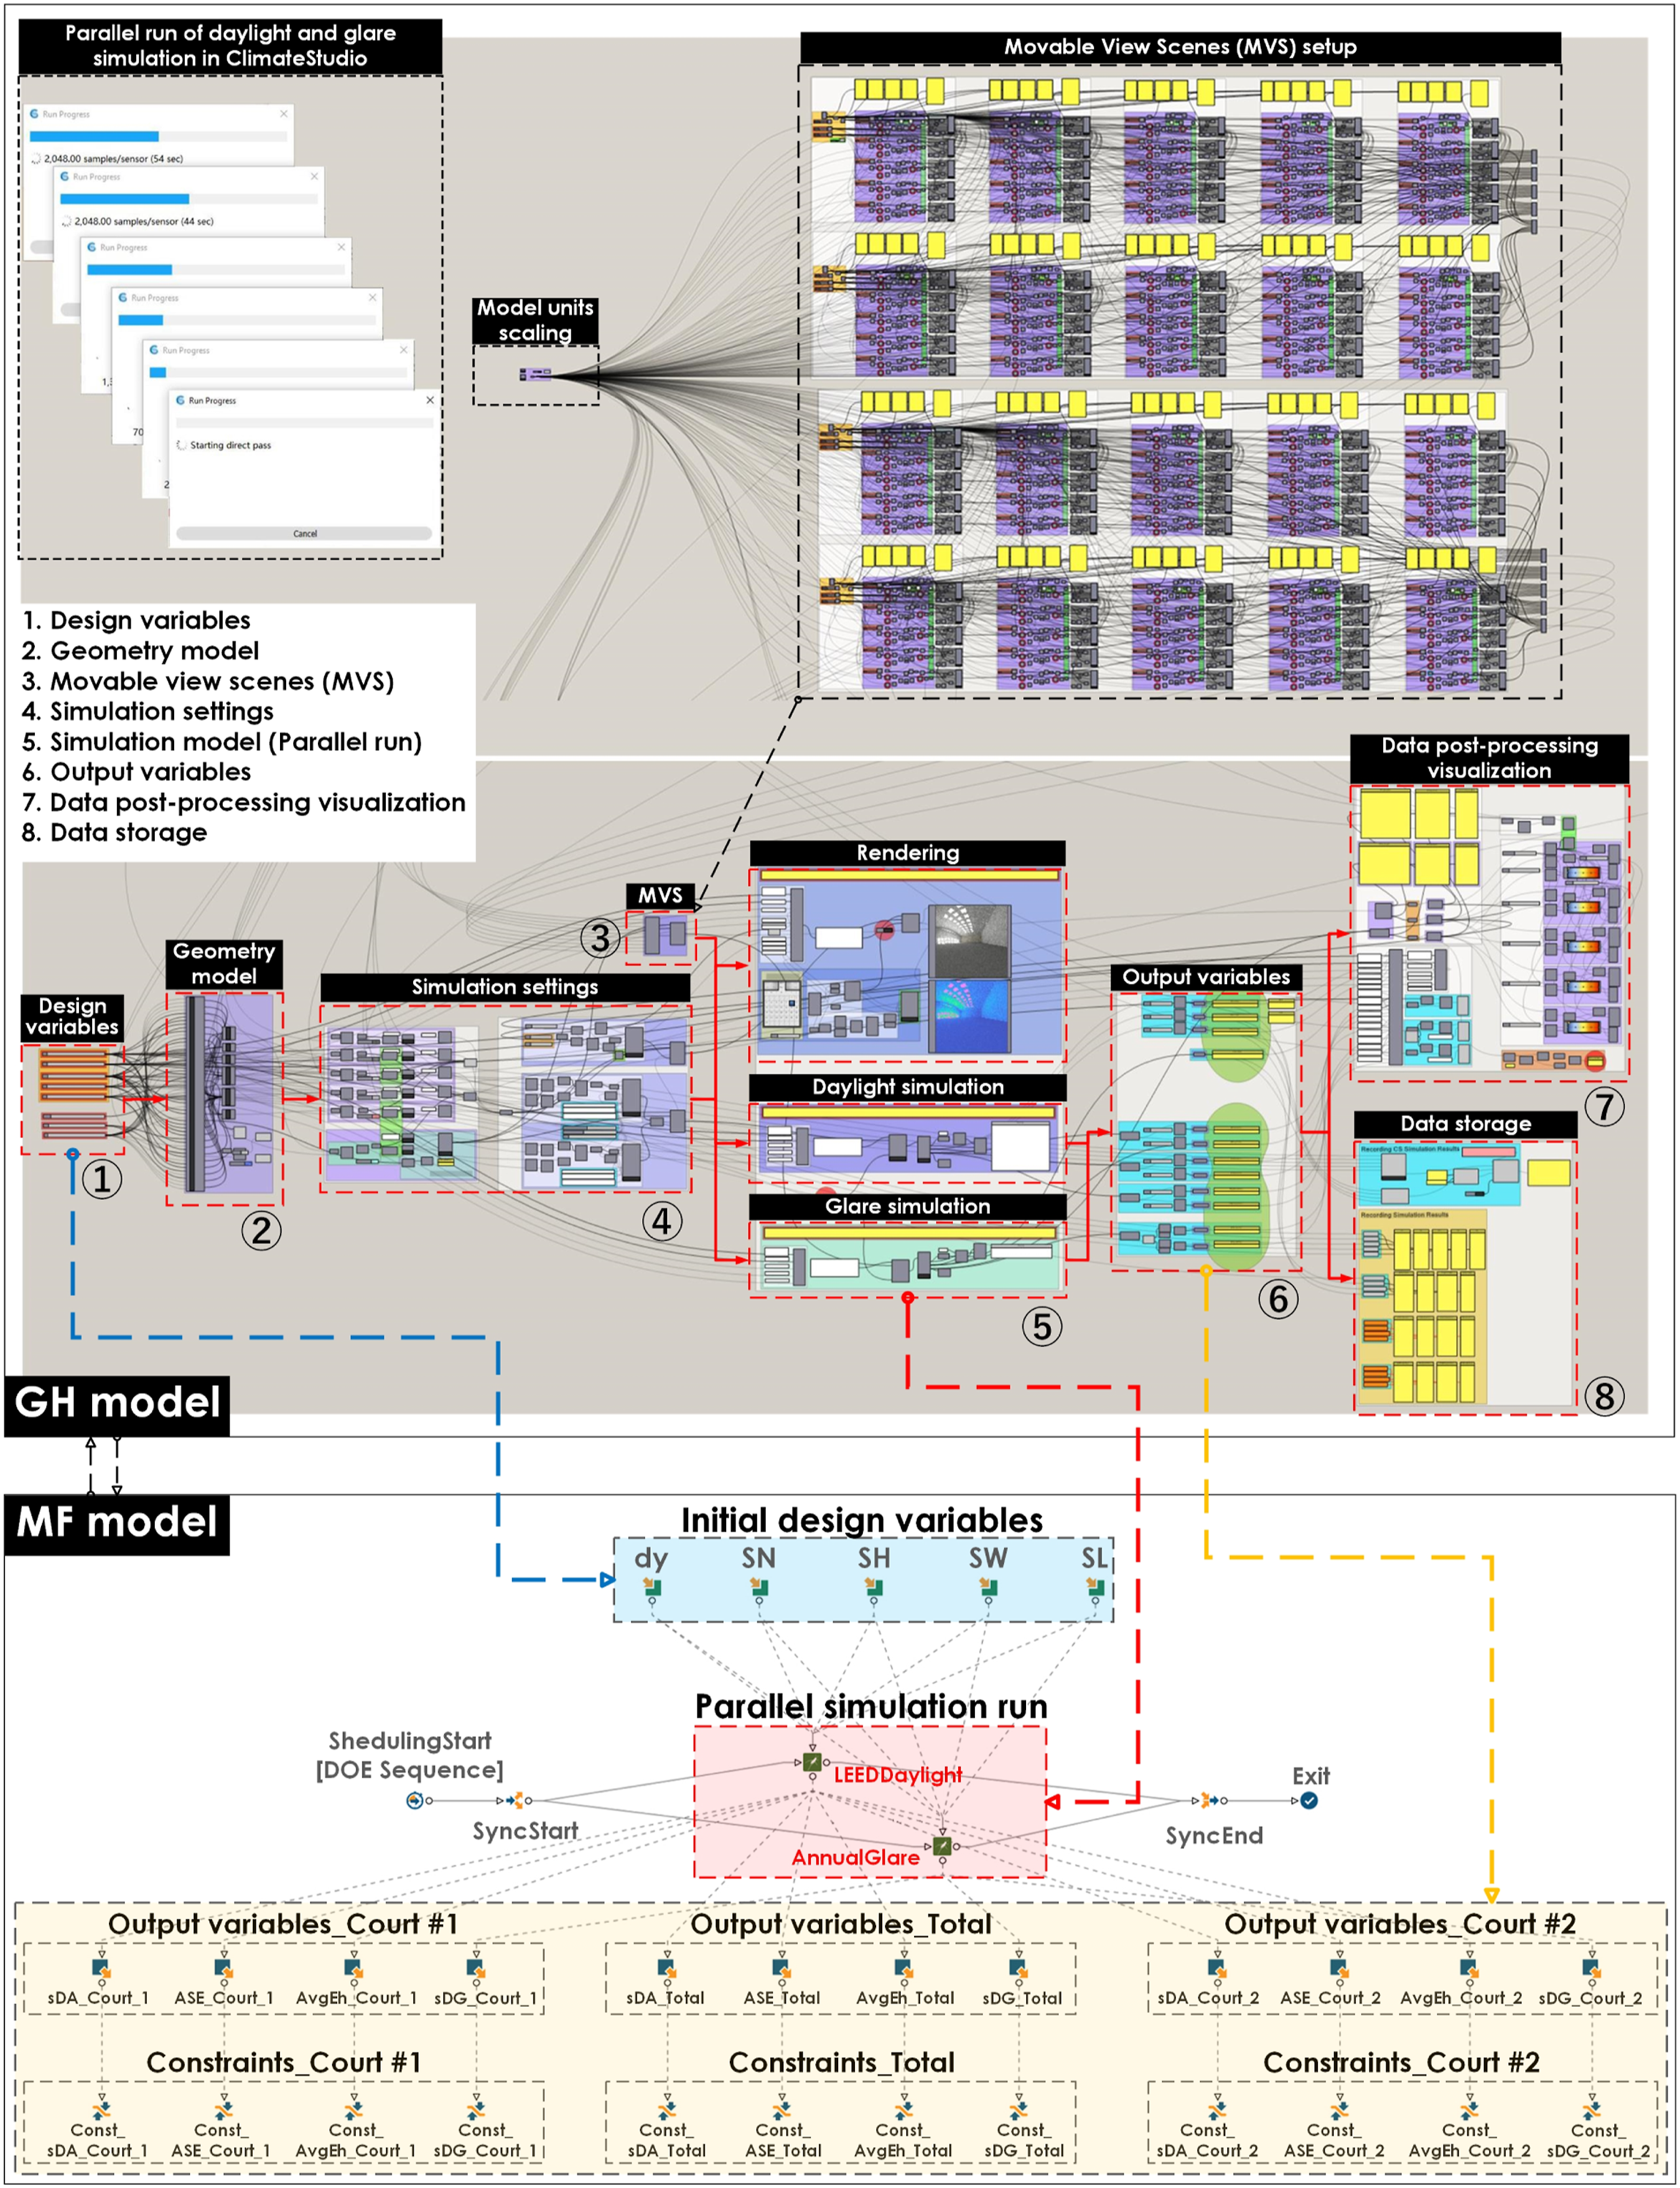
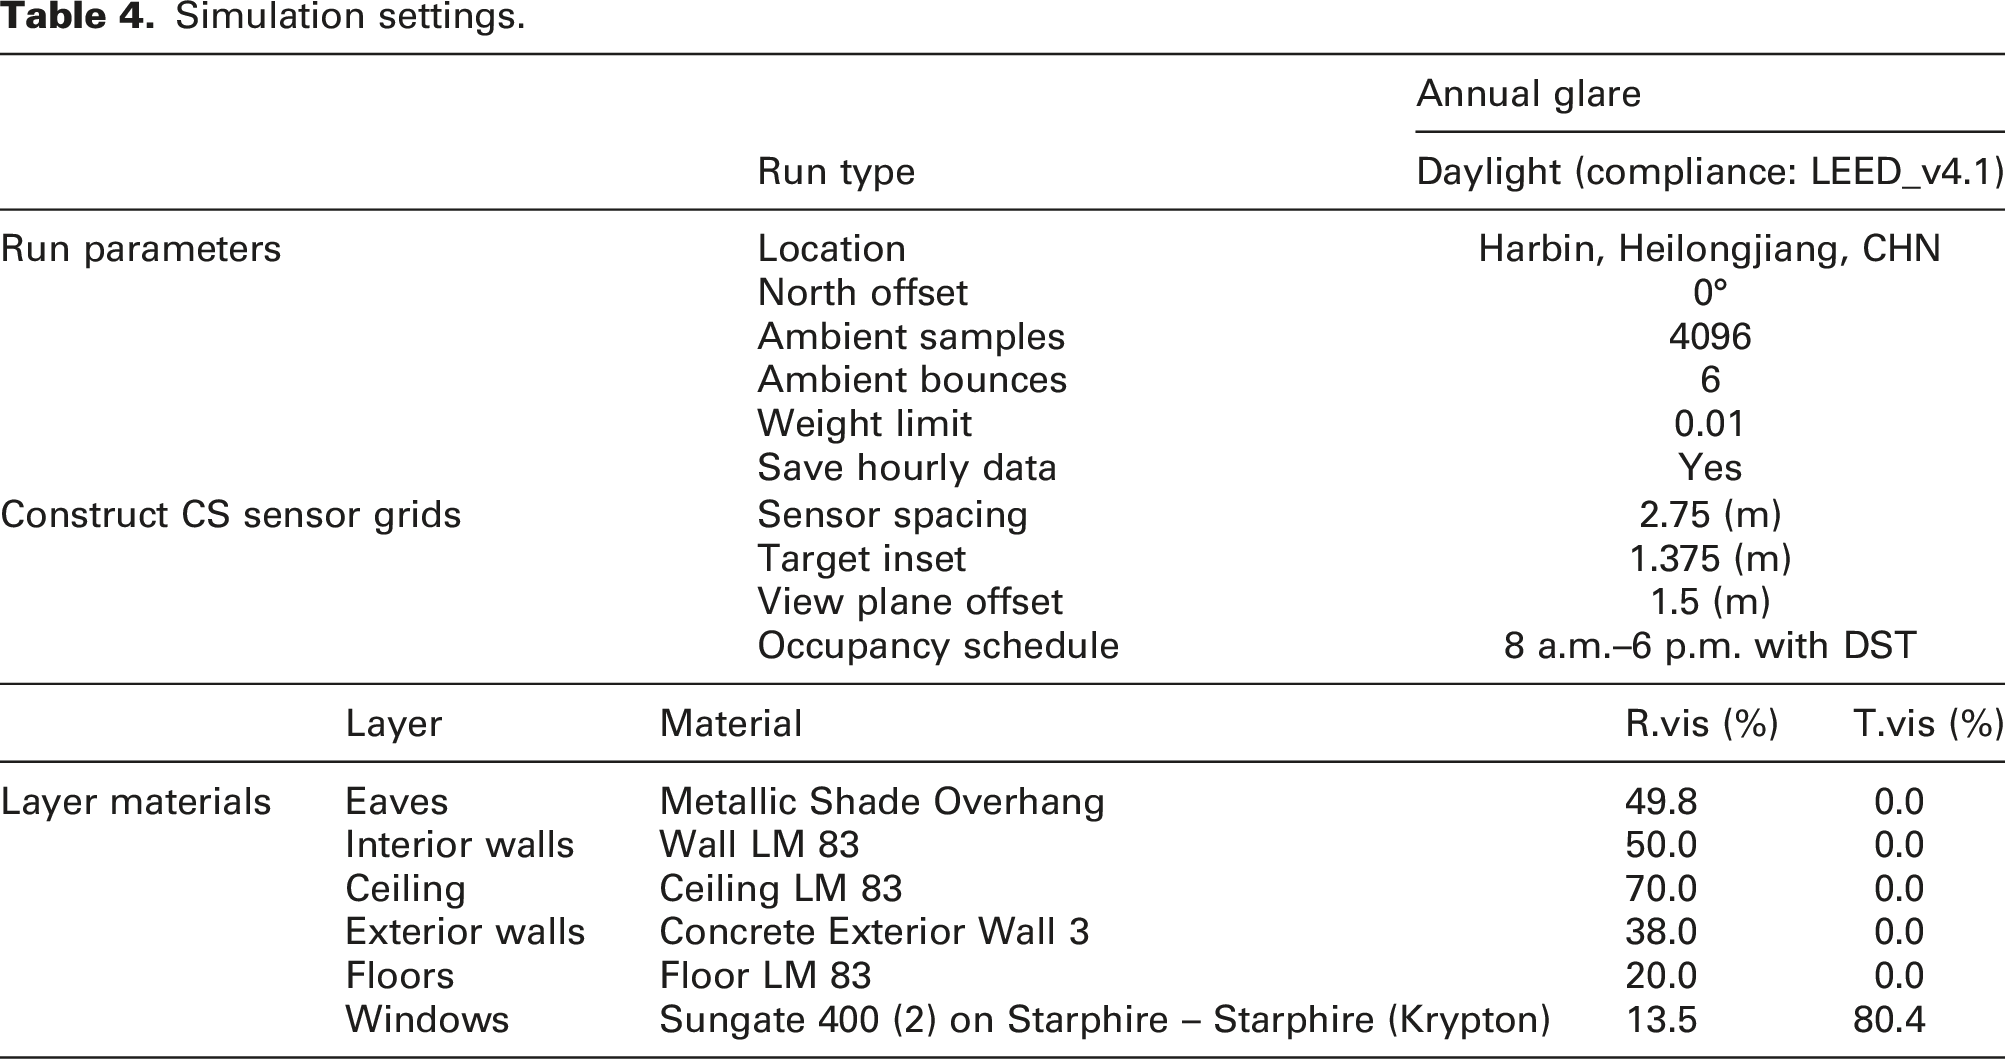
Simulation settings.
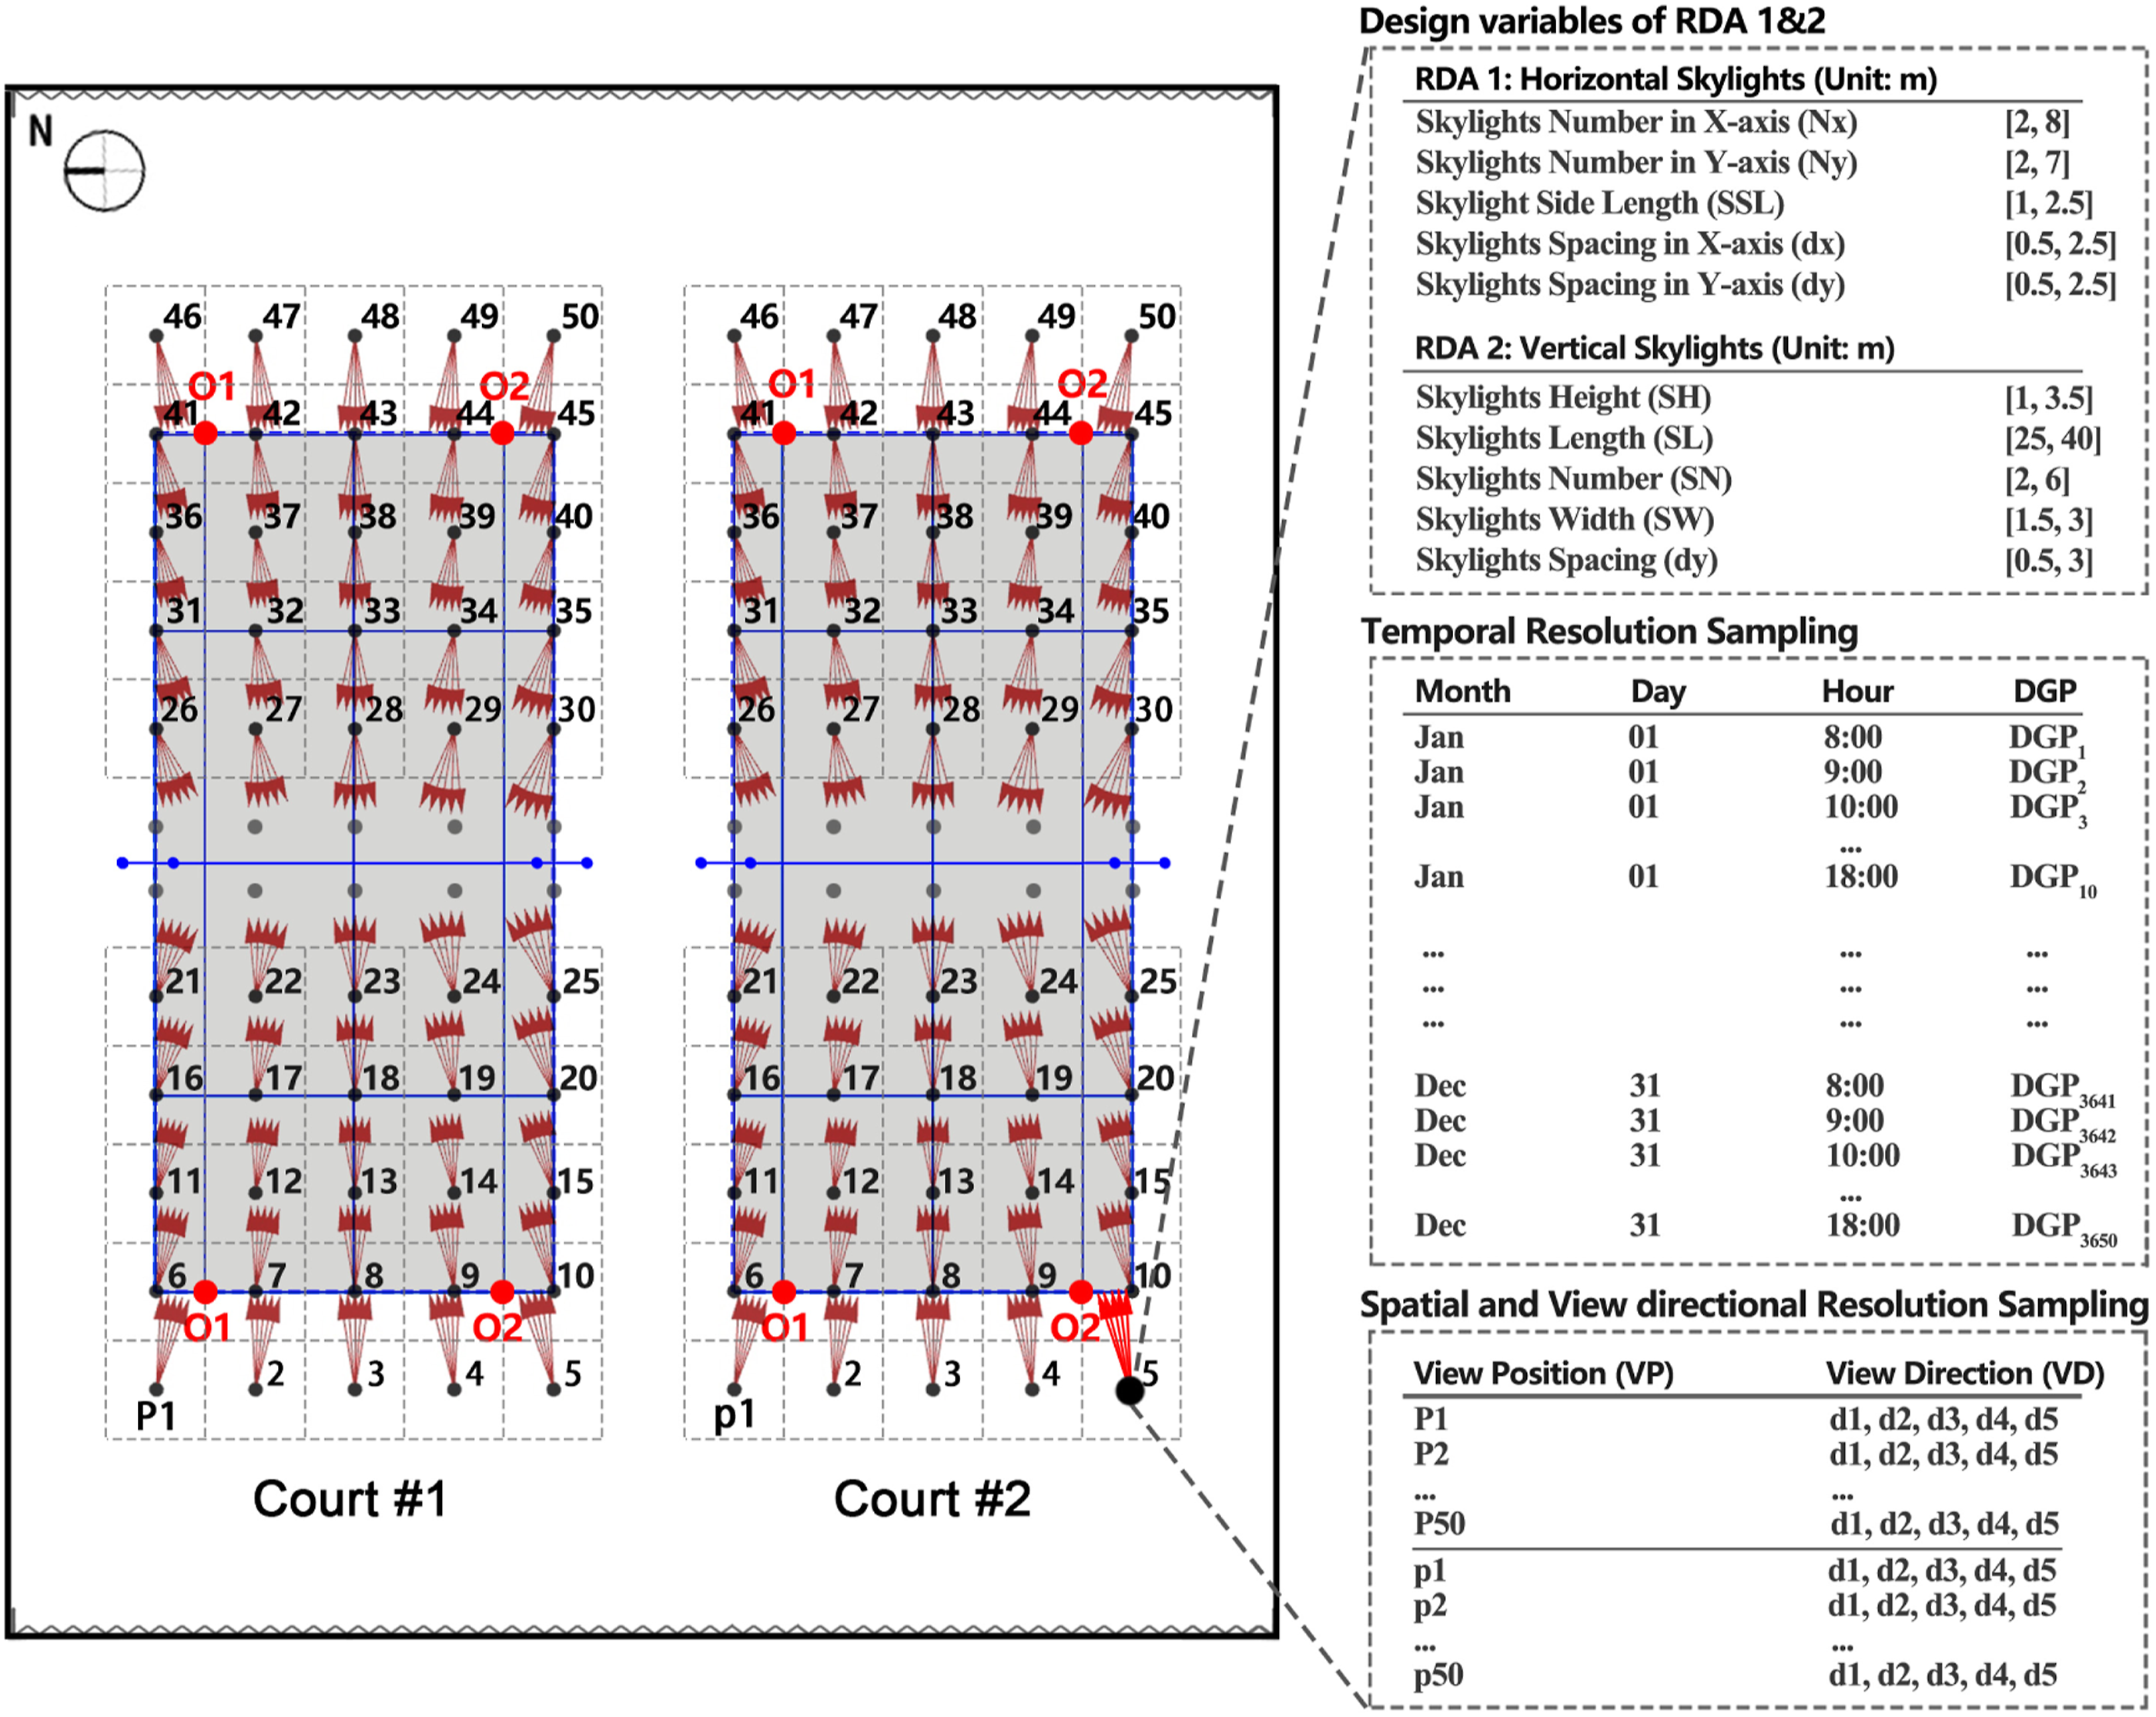
Temporal, spatial and view directional resolution sampling in two RDAs.
Parallel simulation run
By combining progressive path tracing with hardware acceleration (GPU), ClimateStudio can converge on accurate results with remarkable speed (within 2 min for running each design sample in this case study, which could vary depending on the model complexity and simulation settings). In modeFRONTIER, 53 the Synchronizer node supports parallel run of different programs, which was used to facilitate the parallel simulation of annual daylight and glare simulation in this study (see Figure 7). Moreover, the number of concurrent design evaluations could be adjusted according to DoE sample size and hardware configuration, which allows for calculating several design samples simultaneously and thus significantly saving simulation time. In this study, it was set to 4, and the total simulation time of all 400 design samples was about 4 h (some error designs may prolong the run period which would need to be carefully monitored). All simulations were run on a computer with 2.60 GHz Intel (R) Core (TM) i7-9750H processor and NVIDIA (R) GeForce RTX 2060 graphics accelerator.
Response surface methodology
Response surface models 54 are widely used surrogate models in building performance prediction and optimization, which can confidently approximate the design variable and building performance relationship. Recent studies proved that the validated RSM can effectively replace time-consuming building simulation and thus was used in this study.
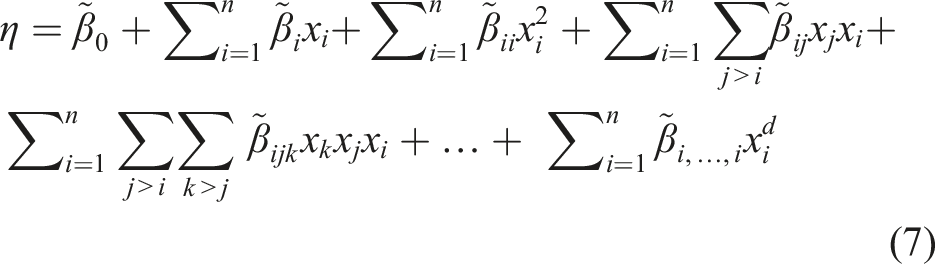
Suppose that a scientific or engineering investigation is concerned with a process or system involving a response 
Computational optimization and decision-making
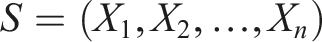
In this study, the overall visual comfort in the whole targeted area (tennis courts 1 and 2) was determined as the optimization objectives, that is, max_sDA_Total 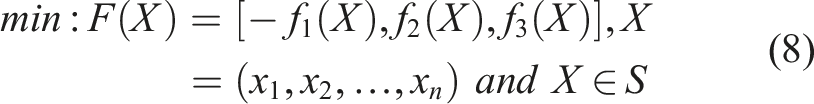


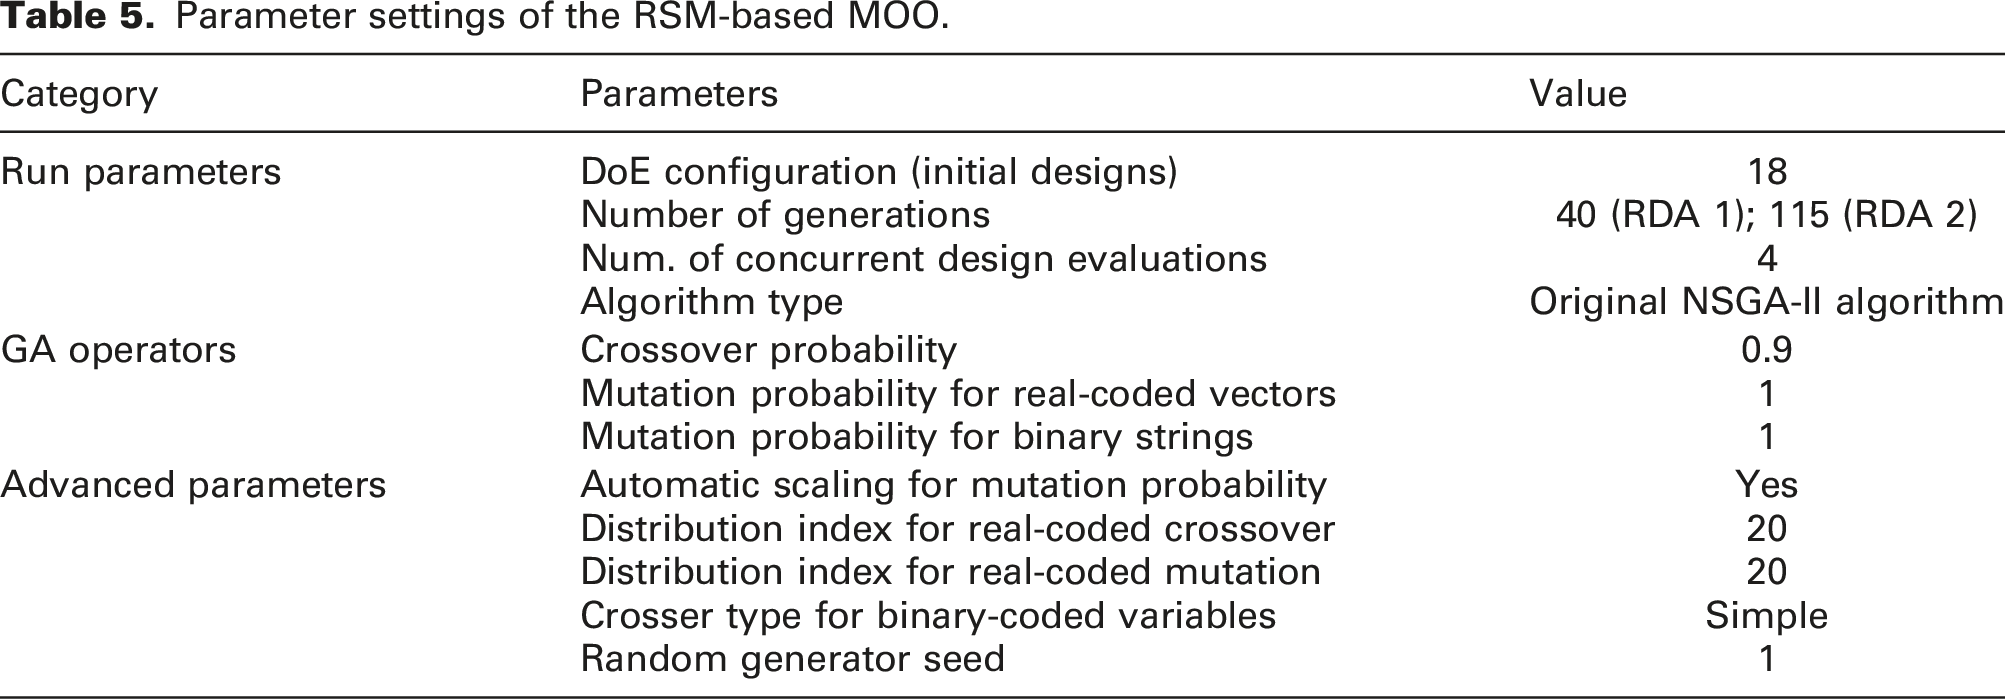
Parameter settings of the RSM-based MOO.
After achieving the Pareto solutions (predicted), re-simulation of them is requisite to revalidate the RSM prediction results. Besides, prior to decision-making, normalizing the dimensions and scales of attributes (objectives) is required using several scaling methods (such as min-max scaling and log scaling). Afterwards, a proper decision-making algorithm was adopted to rank all Pareto solutions involving multiple conflicting objectives. This study adopted the genetic algorithm multi-criteria decision-making (GA-MCDM) to value all Pareto solutions. Moreover, an equally weighted rating amongst three objectives was conducted, that is, wf (ASE) = wf (sDA) = wf (sDG) = 0.333.
Data post-processing and visualization
In order to intuitively clarify the spatial variance and temporal variation of visual comfort for the final optimum solution in this case study, a data post-process and visualization (DPPV) workflow was developed which consists of spatial and temporal daylight availability mapping and spatial and temporal glare potential mapping.
For spatial daylight availability, the DA, SE and AvgEh ( • Spatial mapping of DA in each sensor point (P1, P2, …, Pn) to depict spatial DA variances; • Temporal mapping of DA in a given sensor point (Pi) and covers all targeted area ( • Spatial mapping of SE in each sensor point (P1, P2, …, Pn) to display spatial SE variances; • Temporal mapping of SE in a given sensor point (Pi) to cover all targeted area ( • Spatial mapping of AvgEh in each sensor point (P1, P2, …, Pn) to indicate spatial AvgEh variances; • Temporal mapping of AvgEh in a given sensor point (Pi) to cover all targeted area ( Visual comfort mappings: (a) spatial and temporal daylight availability and (b) spatial and temporal glare potential.
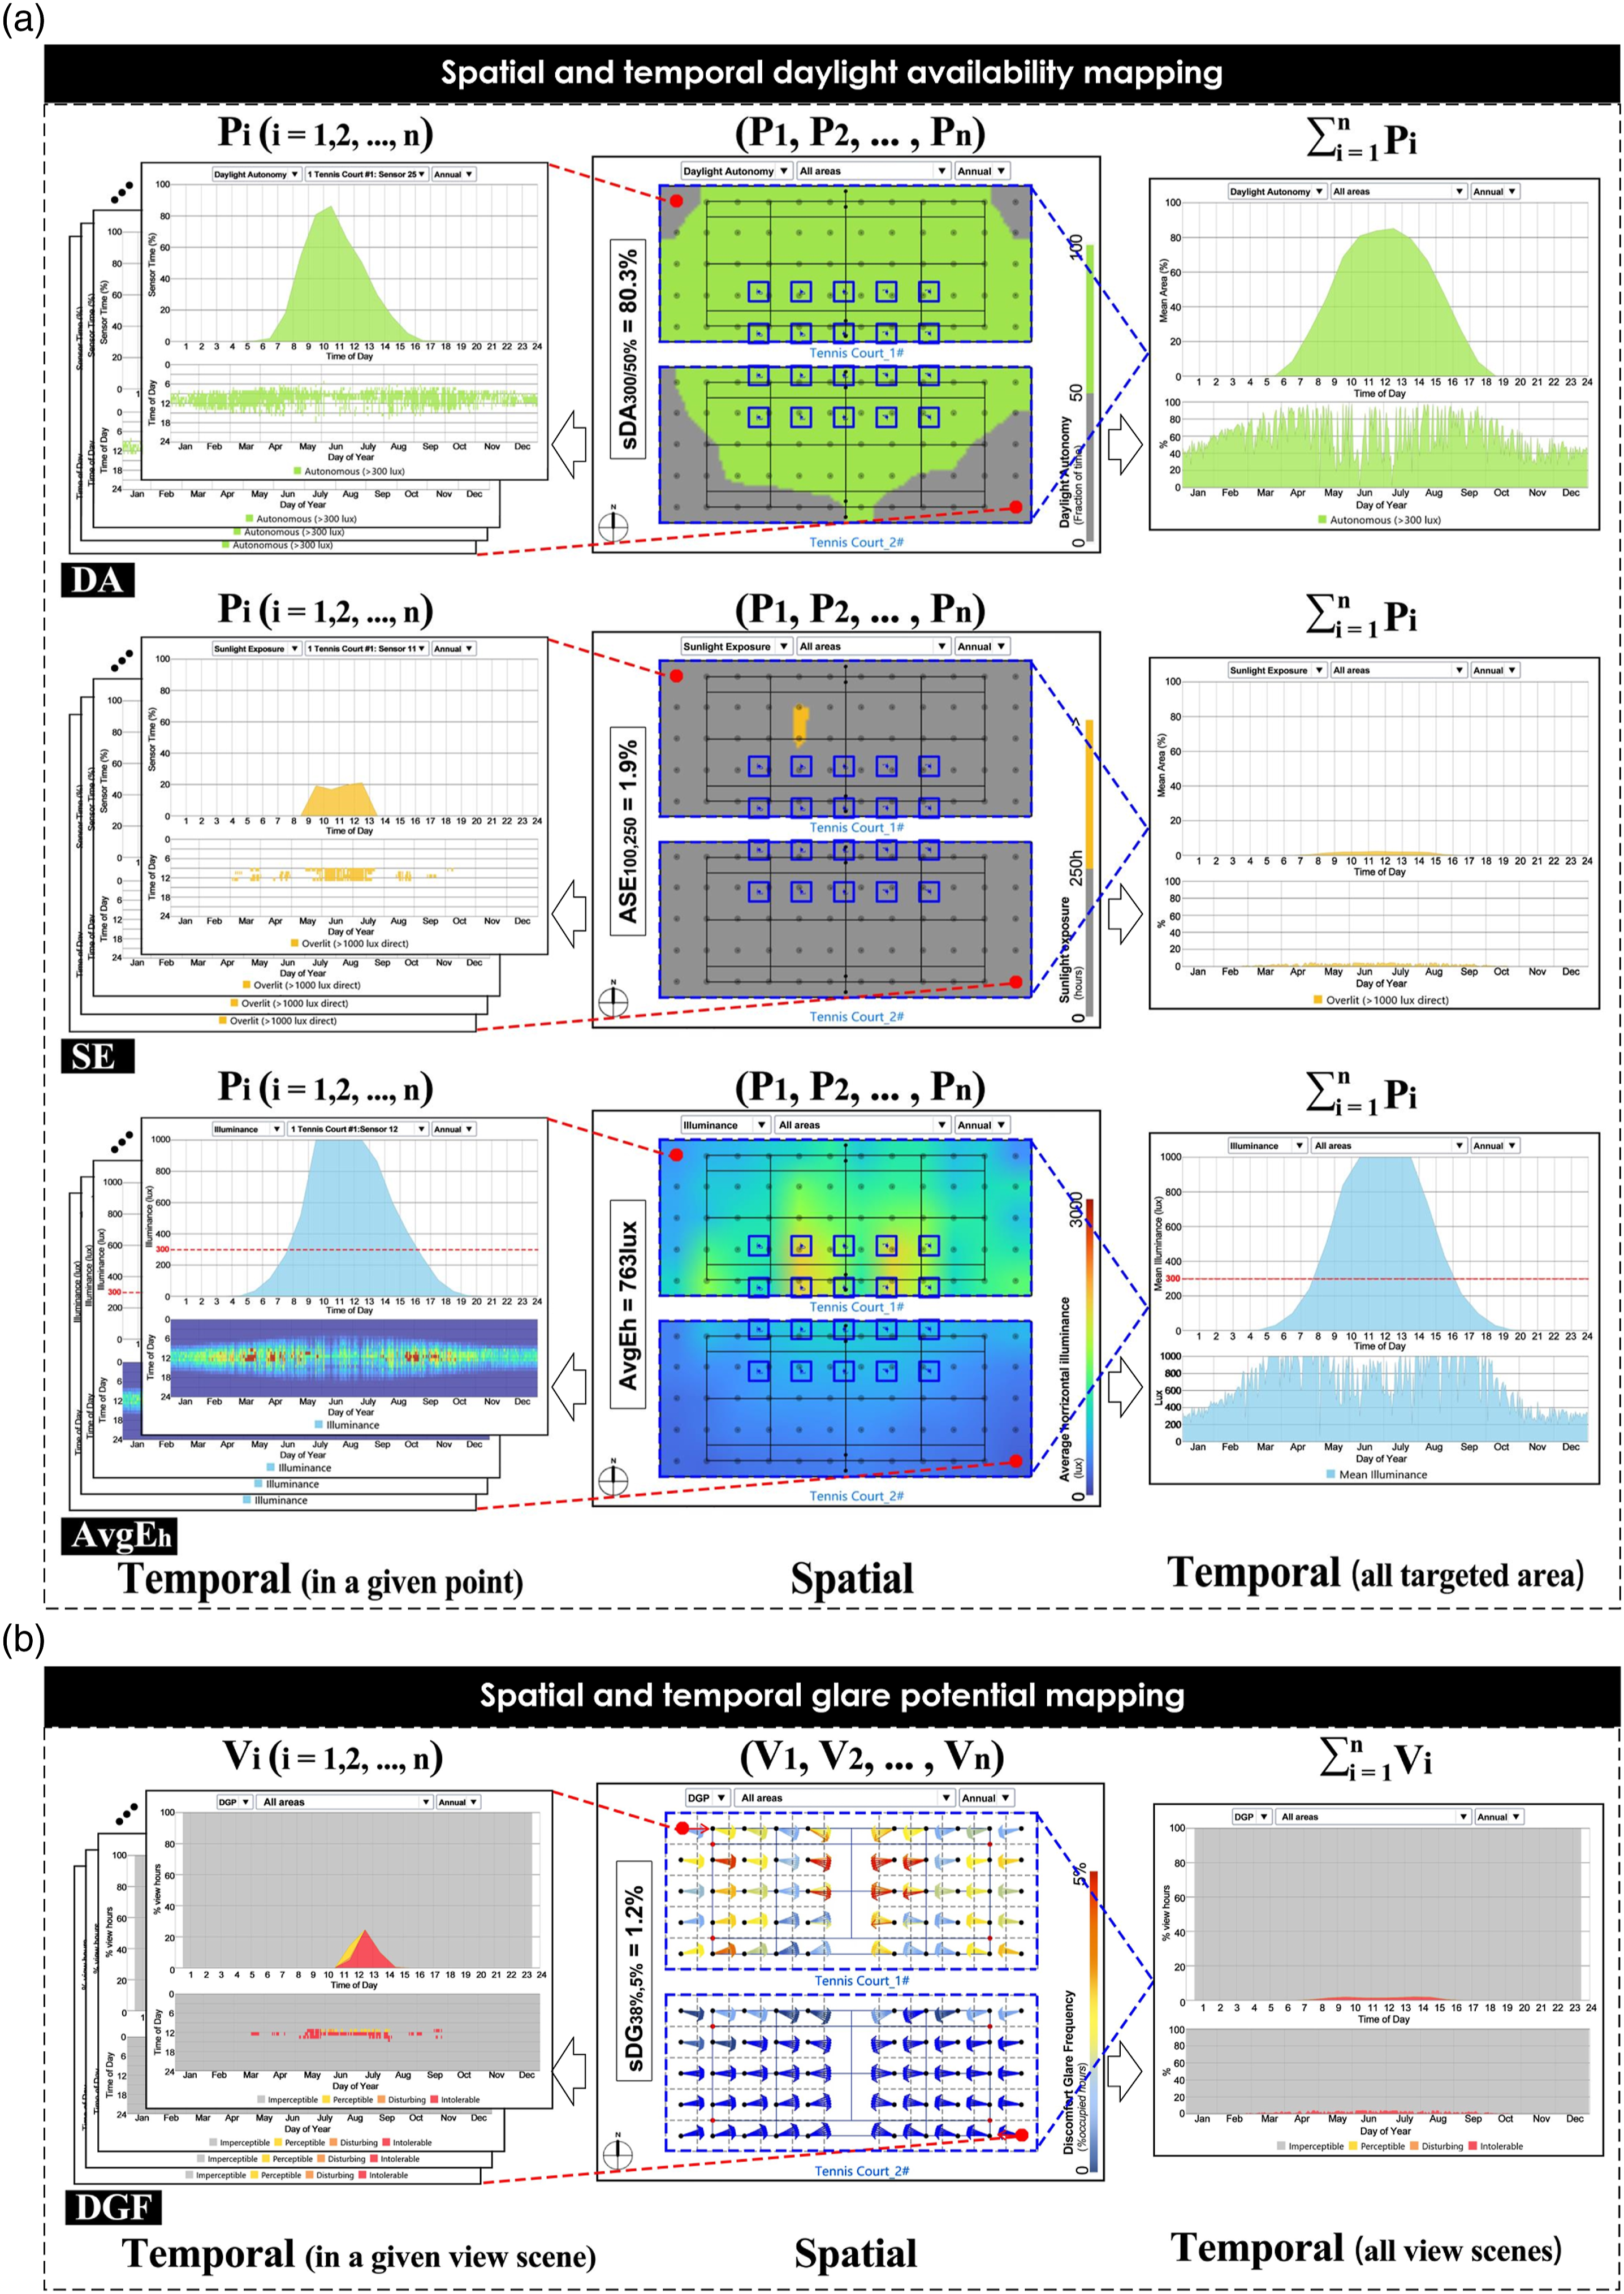
For spatial and temporal glare potential mapping, the annual hourly glare simulation results were post-processed, based on which the overall, spatial and temporal glare potential could be mapped as follows (Figure 9(b)): • Mapping of sDG to compare the overall visual comfort of various design alternatives and to clarify effects of different design variables on sDG; • Spatial mapping of DGF in each view scene (V1, V2, …, Vn) to identify spatial and directional glare potential variances and to determine the most critical view scenes with problematic glare; • Temporal mapping of the frequency of each DGP bin in a given view scene (Vi) to cover all view scenes (
Information extracted from the DPPV process could comprehensively inform design concepts and decisions, amongst which (i) Mappings of SE, DA and AvgEh (
Results
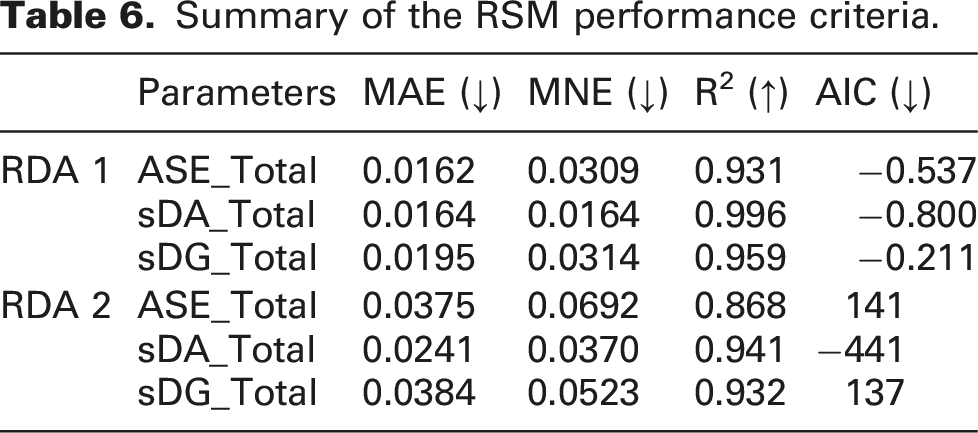
RSM development and validation results
Summary of the RSM performance criteria.
MOO and MCDM results
Pareto solutions
Through the RSM-based MOO, totally 672 (2080) designs of RDA 1 (2) were quickly evaluated, amongst which 10 (37) Pareto solutions were obtained, as shown in Figure 10. The ranges of design variables, output variables and objectives are illustrated in Figure 11(a) and (b), demonstrating that all Pareto solutions in RDA 1 and 2 achieved good visual comfort performance in terms of low ASE_Total, sDG_Total and high sDA_Total values. To revalidate RSM prediction outcomes, re-simulations of those Pareto solutions were conducted, and the comparison results indicate that RSM estimation generally agreed well with physical simulation outcomes, with an MAE of 0.0098, 0.0166, and 0.0231 (0.0101, 0.0386, 0.0593) and a RMSE of 0.0122, 0.0187, and 0.0291 (0.0125, 0.0419, 0.0688) for ASE_Total, sDA_Total and sDG_Total in RDA 1 (2), respectively. Predicted Pareto solutions of RDA 1 and 2. The orange, green and blue dots represent unfeasible designs, feasible designs and Pareto solutions, respectively. (a) RDA 1 and (b) RDA 2. Ranges of design variables, output variables and objectives in RDA 1 and 2. The orange, green and blue lines in (a) and (b) represent unfeasible designs, feasible designs and Pareto solutions, respectively. (a) RSM prediction results of all designs in RDA 1, (b) RSM prediction results of all designs in RDA 2, (c) re-simulation results of Pareto solutions in RDA 1 and (d) re-simulation results of Pareto solutions in RDA 2.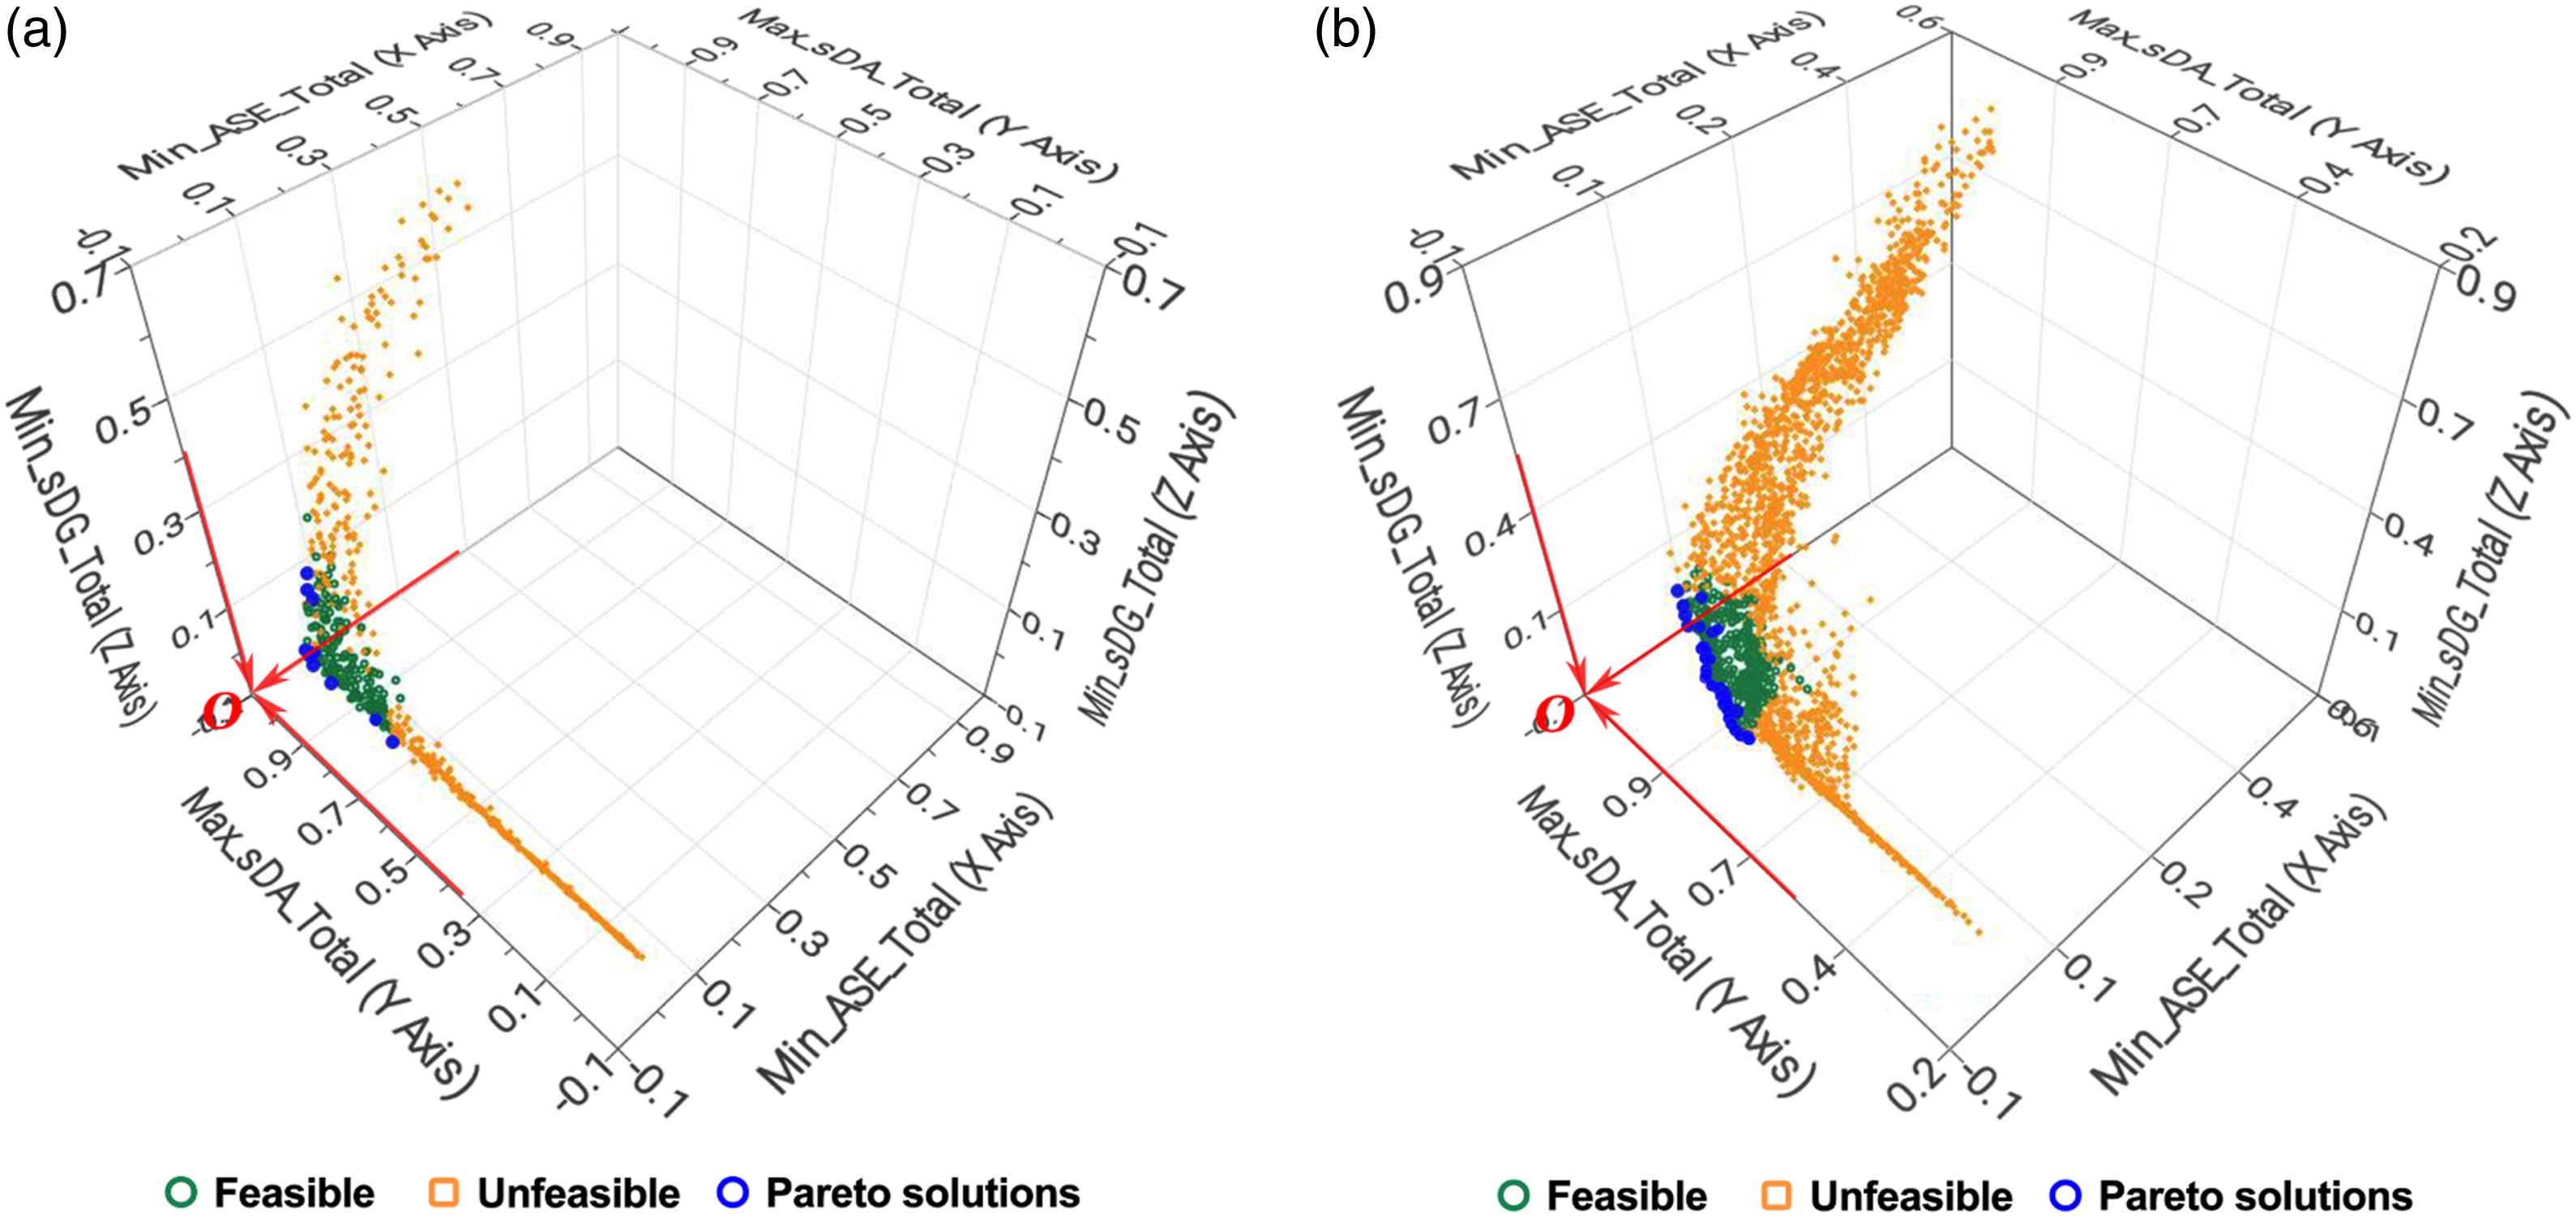
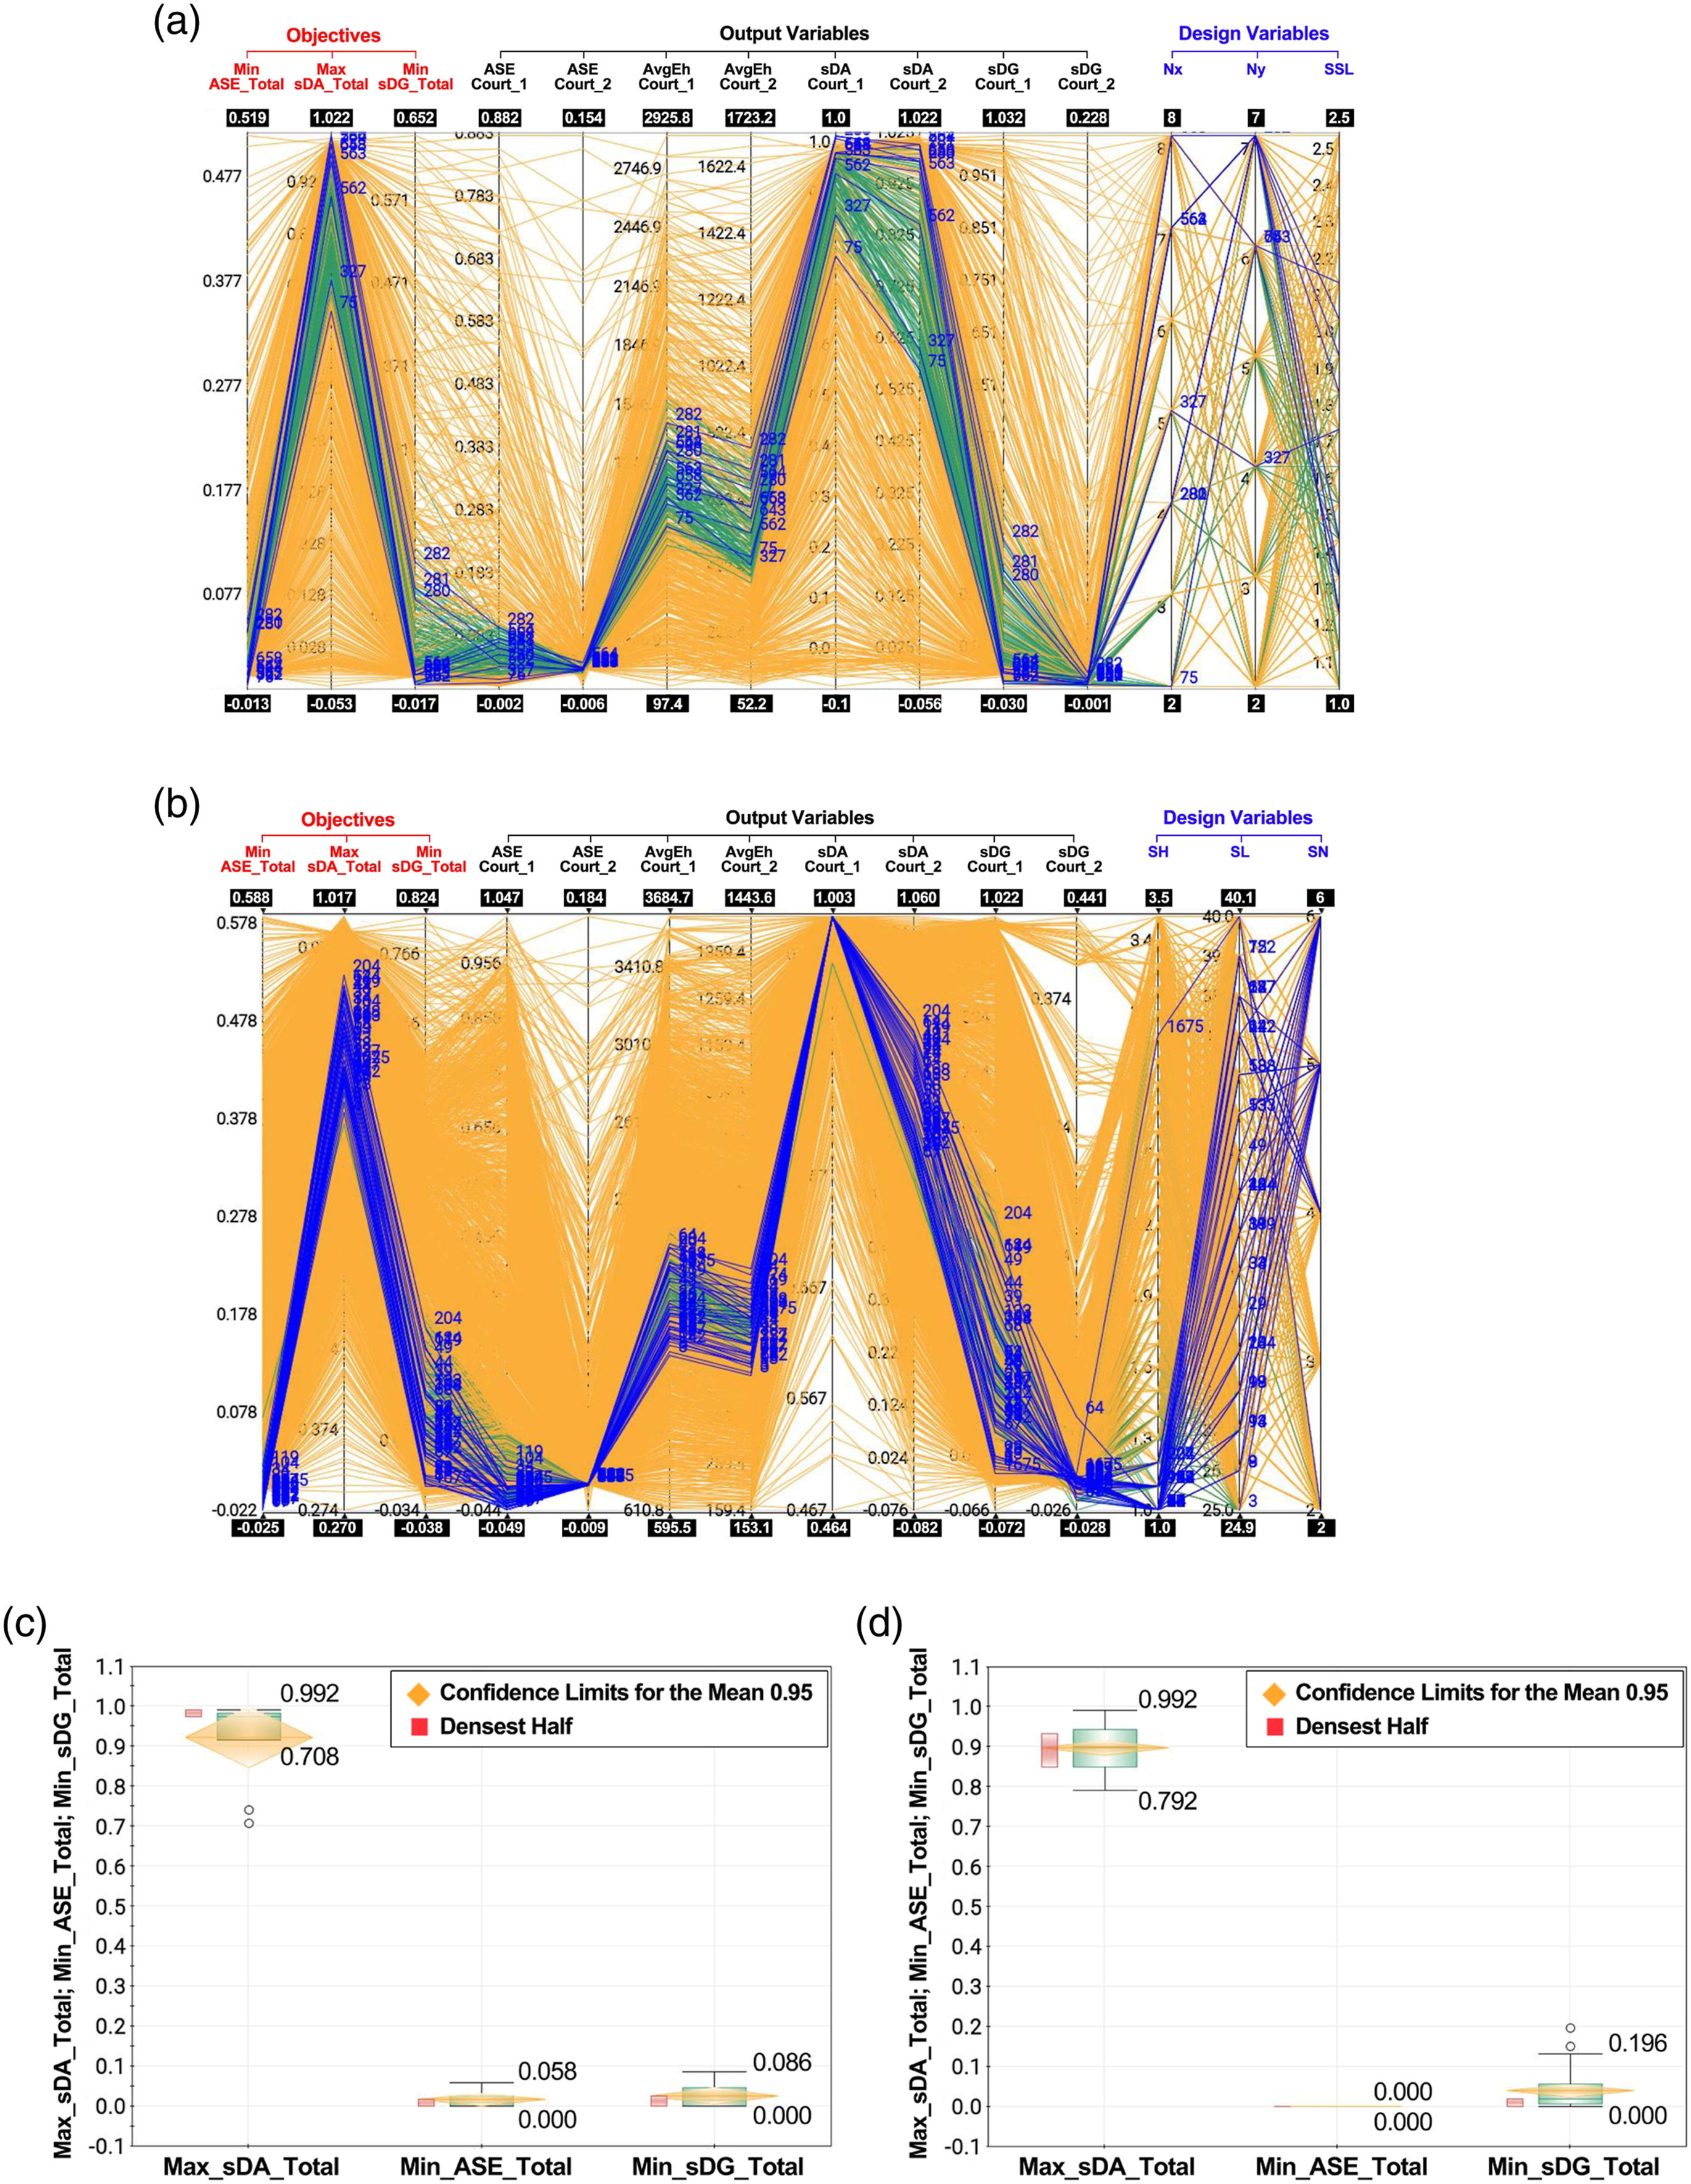
The re-simulated results of those Pareto solutions in RDA 1 and 2 are presented in Figure 11(c) and (d), where RDA 1: min_ASE_Total ∈ (0.000, 0.058), max_sDA_Total ∈ (0.708, 0.992) and min_sDG_Total ∈ (0.000, 0.086); RDA 2: min_ASE_Total ∈ (0.000, 0.000), max_sDA_Total ∈ (0.792, 0.992) and min_sDG_Total ∈ (0.000, 0.196). Moreover, it can be found that the skylight configurations shared some common features, for RDA 1: (i) SSL is within [1.2, 2.1] m; (ii) Nx ranges from 2 to 8 and Ny ranges from 4 to 7; for RDA 2: (i) SH is within [1.0, 1.2] m; (ii) SN ranges from 2 to 6 and SL is within [26.0, 40.0] m (see Figure 11(a) and (b)). Those findings could provide designers with some general recommendations in similar design scenarios and cases.
Final optimum solution
To select the final optimum solution from all available Pareto solutions, the genetic algorithm-based MCDM (GA-MCDM) was utilized to rank all Pareto solutions; the ranked Pareto solutions along with the final optimum solution of RDA 1 and 2 are shown in Figure 12. For RDA 1, No. 658 had the highest rating value among 10 Pareto solutions which met the actual design requirements and thus was determined as the final optimum solution. For RDA 2, No. 34 was identified as the best design solution. From the rank values calculated by GA-MCDM, amongst all Pareto solutions observed, the optimum alternative would improve visual comfort by 200% (RDA 1) or 50.7% (RDA 2) compared to the worst solution. GA-MCDM ranking results of Pareto solutions of RDA 1 and 2: (a) RDA 1 and (b) RDA 2.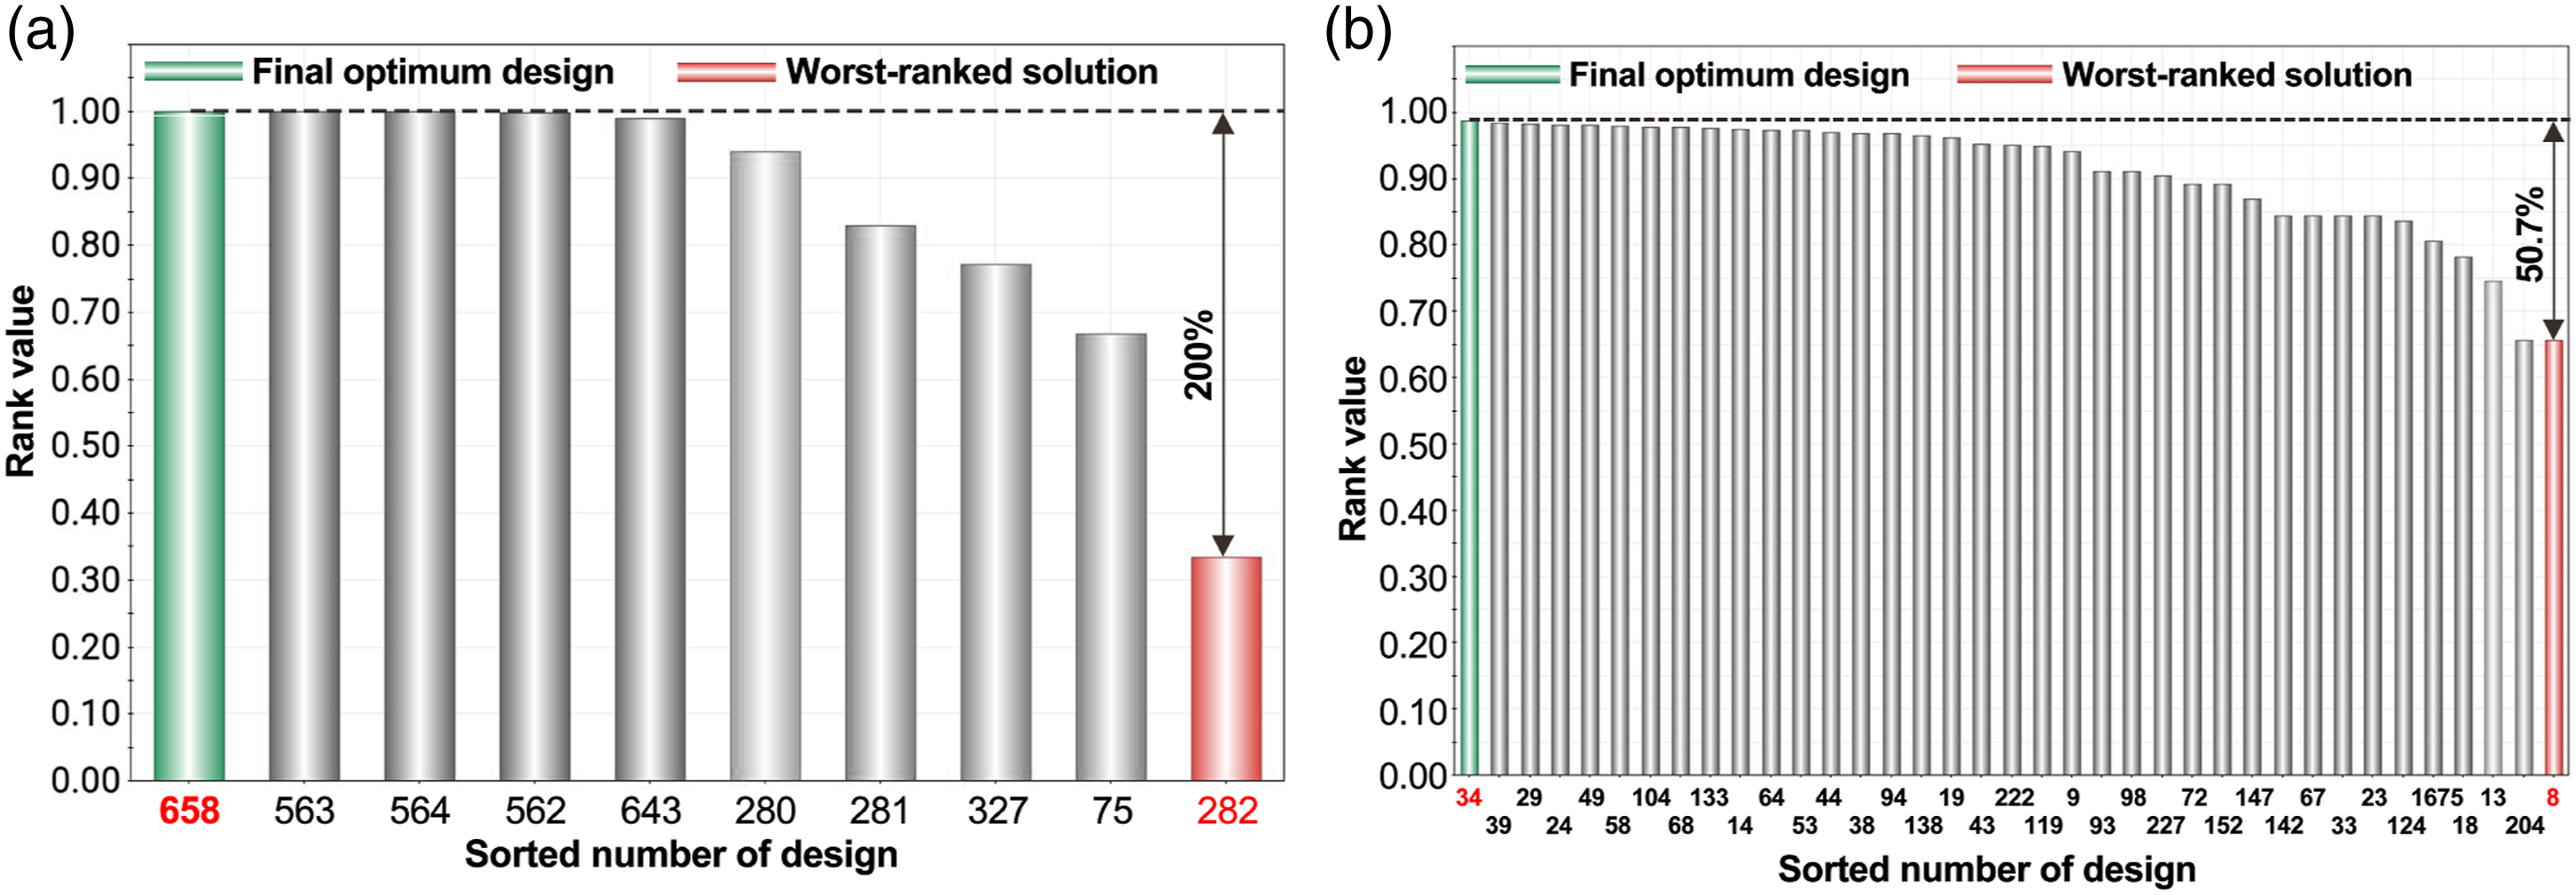
Data post-processing and visualization results
Spatial and temporal daylight availability
Figure 13 depicts the spatial and temporal mappings (calculating all targeted area, Spatial and temporal daylight availability mapping of the final optimum solution in RDA 1 and 2: (a) spatial mapping of DA300/50% – RDA 1, (b) spatial mapping of DA300/50% – RDA 2, (c) temporal mapping of DA300/50% – RDA 1, (d) temporal mapping of DA300/50% – RDA 2, (e) spatial mapping of SE1000,250h – RDA 1, (f) spatial mapping of SE1000,250h – RDA 2, (g) temporal mapping of SE1000,250h – RDA 1, (h) temporal mapping of SE1000,250h – RDA 2, (i) spatial mapping of AvgEh – RDA 1, (j) spatial mapping of AvgEh – RDA 2, (k) temporal mapping of AvgEh – RDA 1 and (l) temporal mapping of AvgEh – RDA 2.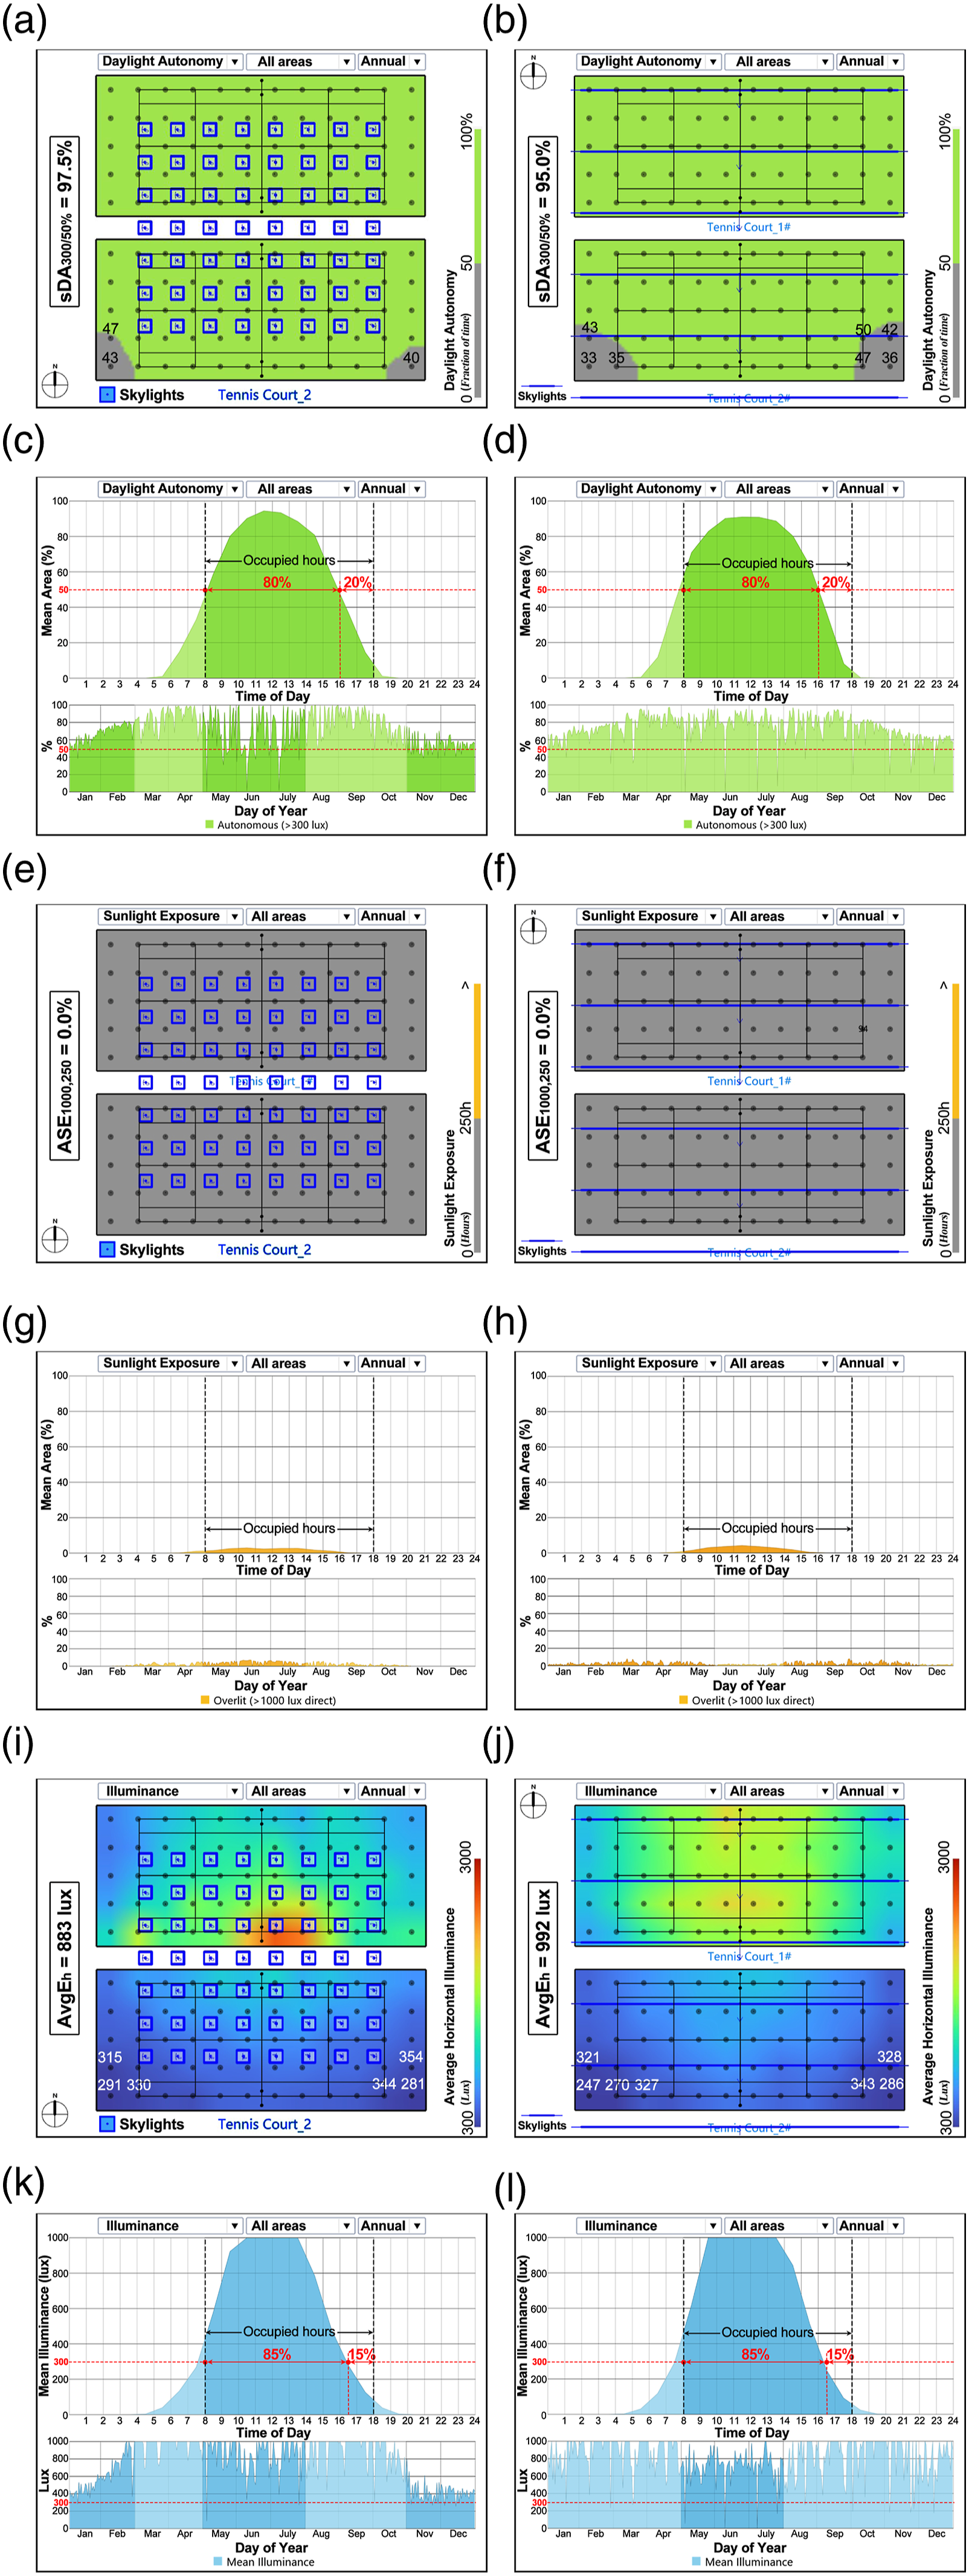
Regarding the spatial daylight availability, for both RDA 1 and 2, we found that almost all the targeted areas achieved good daylight provision in terms of satisfying DA300/50% and AvgEh values except few corner areas near the south interior wall (Figure 13(a), (b), (i) and (j)), whose DA300/50% and AvgEh values were very close to the requirements in LEED v4.1. Moreover, the whole targeted area received a minimum direct sunlight of 1000 lx for no more than 250 h of annual occupied hours, indicating good protection from direct sunlight exposure, as displayed in Figure 13(e) and (f).
Regarding the temporal daylight availability, for RDA 1, in terms of annual timespan, during October to February and May to July, lower DA300/50% and AvgEh values were found in comparison to other time periods (Figure 13(c) and (g)), which is mainly due to the very high or low solar altitude angles during these timesteps when less sunlight could penetrate into the sample sports spaces. Meanwhile, more frequent direct sunlight exposure was observed during May to July but was generally acceptable, as shown in Figure 13(g). For RDA 2, annual distributions of DA300/50% and AvgEh were steady and even. In terms of daily timespan, for both RDA 1 and 2, Figure 13(c) and (d) indicates that there were more than 80% of the occupied hours that received a minimum target illuminance of 300 lux for a spatial fraction threshold of 50% of the targeted area. Besides, from Figure 13(k) and (l), there were more than 85% of the occupied hours that received a minimum AvgEh of 300 lux across the whole targeted area, which can support player’s fitness sports and exercises within the NFH.
Spatial and temporal glare potential
Figure 14 displays the spatial mapping of DGF for the final optimum solution in RDA 1 and 2 and the temporal mapping (calculating all view scenes, Spatial and temporal glare potential mapping of the final optimum solution in RDA 1 and 2: (a) spatial mapping of DGF – RDA 1, (b) spatial mapping of DGF – RDA 2, (c) temporal mapping of the frequency of each DGP bin – RDA 1 and (d) temporal mapping of the frequency of each DGP bin – RDA 2.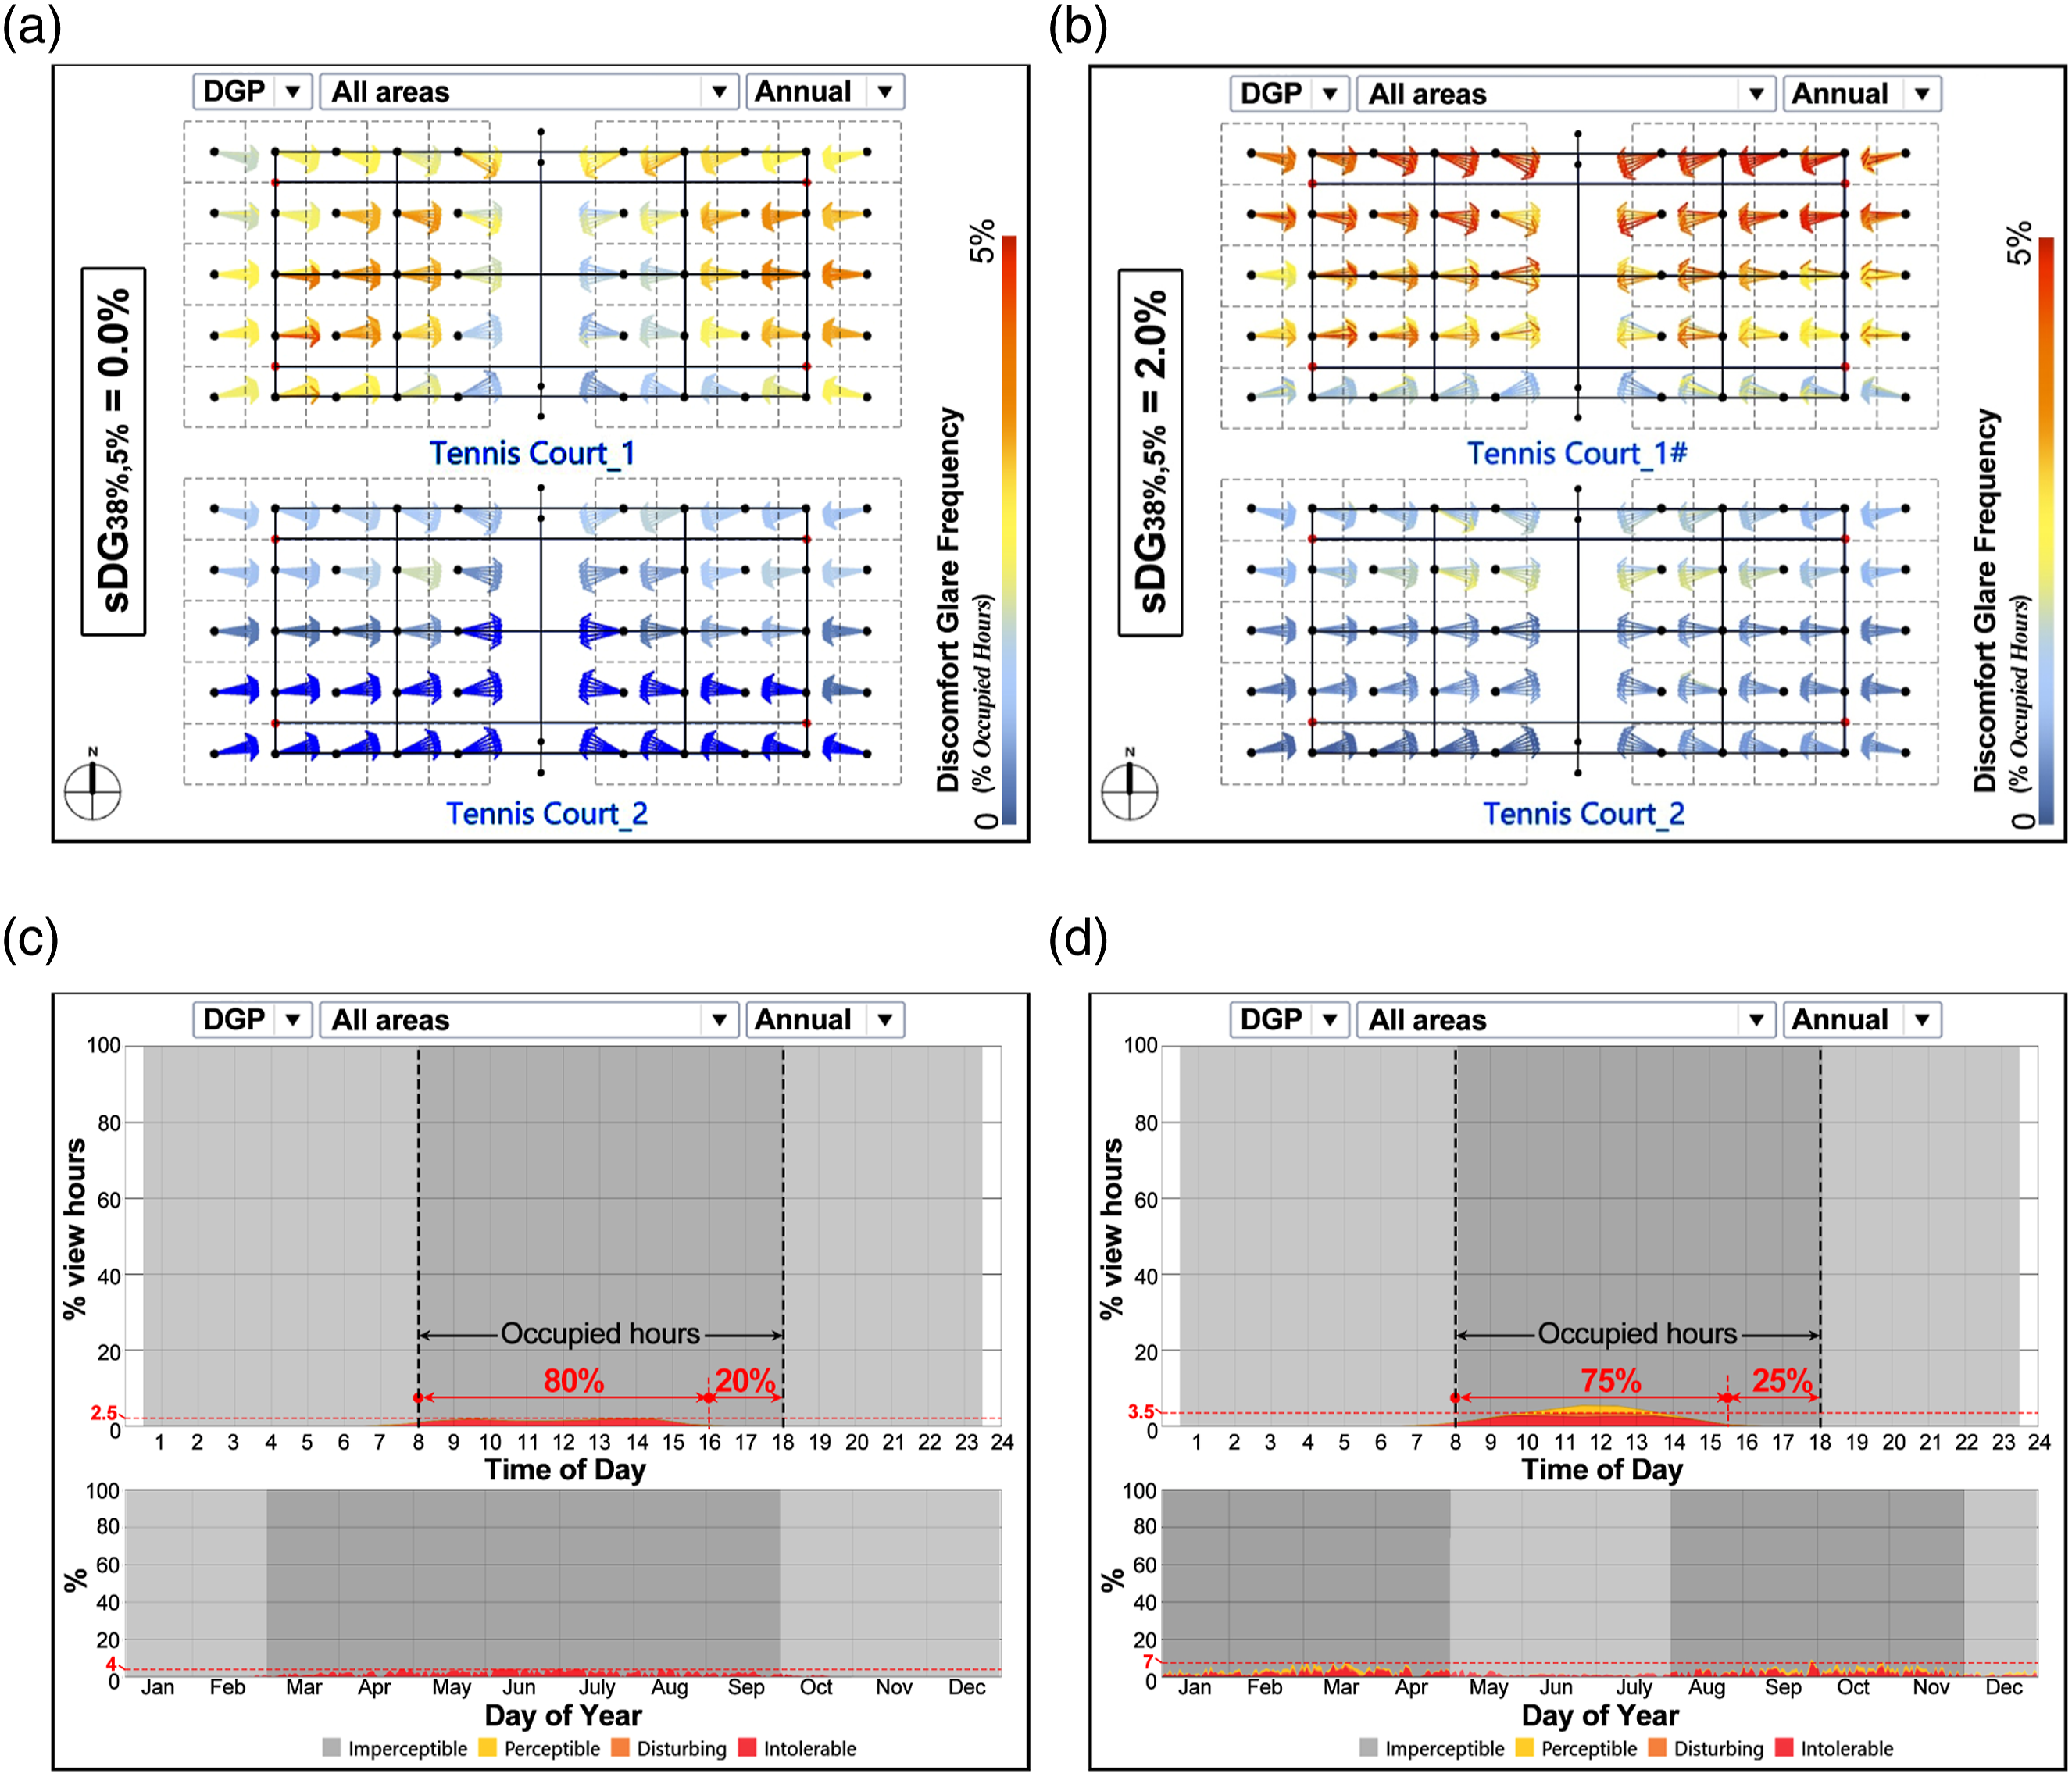
Regarding the spatial glare potential, for RDA 1, Figure 14(a) indicates a good overall glare performance in the targeted area (sDG38%,5% = 0.0%), and only a few view scenes presented a relatively severe discomfort glare with a maximum DGF of nearly 5%. Besides, the glare performance in court 2 outperformed that in court 1; all view scenes in court 2 experienced discomfort glare for less than 2% of annual occupied hours. Concerning the directional glare potential variance, this existed in court 1 but was not significant, while in court 2, there remained rare directional glare potential variances in most VPs. For RDA 2, Figure 14(b) indicates that the overall glare performance in the targeted area was also good with a sDG38%,5% of 2.0%, and the glare performance in court 2 outperformed that in court 1. Besides, the spatial and directional glare potential variances were more obvious in RDA 2 than RDA 1, which is due to the way that daylight penetrated into the studied space; for RDA 2 (vertical skylights), those view scenes facing skylights are more vulnerable to glare. However, for RDA 1 (horizontal skylights), no remarkable differences existed between view scenes facing or facing away from skylights.
Regarding the temporal glare potential, for RDA 1, in terms of annual timespan, Figure 14(c) shows that discomfort glare hours were stably within 4% during March to September; very few fluctuations were found. Moreover, glare performance was quite good during October to February when there was hardly any viewing time experiencing any disturbing or intolerable glare. In terms of daily timespan, Figure 14(c) indicates that 80% of daily occupied hours presented discomfort glare within 2.5% of each hour, and the left 20% rarely presented any discomfort glare. For RDA 2, in terms of annual timespan, there were two critical phases when the glare potential was relatively higher than other time periods (with a maximum value of 7%), namely, from January to April, and August to November. In terms of daily timespan, Figure 14(d) shows that 75% of daily occupied hours presented discomfort glare within 3.5% of each hour, and the left 15% rarely presented any discomfort glare.
Discussion
This part clarifies the benefits and limitations of the proposed ST-VCAO method based on research results. Firstly, case study results demonstrate the efficacy of the proposed approach which does yield the calculation and visualization of exact spatio-temporal daylight and glare metrics, that is, sDA, ASE, sDG and DGF. Those metrics together can provide a comprehensive clarification on the spatial variance and temporal variation of visual comfort in daylit sports spaces, based on which those Pareto solutions with satisfied visual comfort performance could be swiftly identified through the RSM-based MOO; thus, the preliminary overall visual comfort of those potential design alternatives could be judged. After selecting the final optimum solution(s) via the MCDM, designers could then have a close insight on the detailed visual comfort performance through the spatial and temporal daylight availability and glare potential mappings, thus deciding where to conduct more detailed analyses.
Secondly, the comprehensiveness of the ST-VCAO approach rests with the truthful representation of OBm in glare simulation, considering players' continuously changing view scenes. The proposed approach suggests that designers should consider VPs around the frequently occupied areas and VDs within a few degrees of the front-facing direction that objects would frequently appear (for tennis sport); the shot chart adopted in this study facilitates the modelling of OBm, based on which MVS can be established to comprehensively represent players' frequently experienced view scenes during sports. The case study proved that performing spatio-temporal glare simulations in MVS is more reliable in assessing players' actual visual comfort perception compared with traditional approaches, given the significant spatial and view directional glare variances across sports spaces. Furthermore, OBm-based MVS thoroughly expends the dimensionality of the occupancy resolution investigated in DGP-based glare studies.
Thirdly, the efficiency of the proposed approach lies in the fact that the application of ST-VCAO approach is considerably faster than traditional approaches. The reduction in the total computational time (including the RSM training and validation time) of the RSM-based MOO versus traditional physical simulation-based MOO for this case study was calculated, in a factor of 27.08% (RDA 1) or 71.25% (RDA 2), as shown in Figure 15, which would increase significantly with the design spaces becoming more complex. Better yet, the saved time could become more considerable with the intention of spatial, temporal and occupant resolutions to be investigated. Furthermore, the whole workflow of the ST-VCAO could be achieved within the integrated platform, GH-MF, greatly making it available to designers at early design stages. Comparison of total computational time of traditional and proposed approach.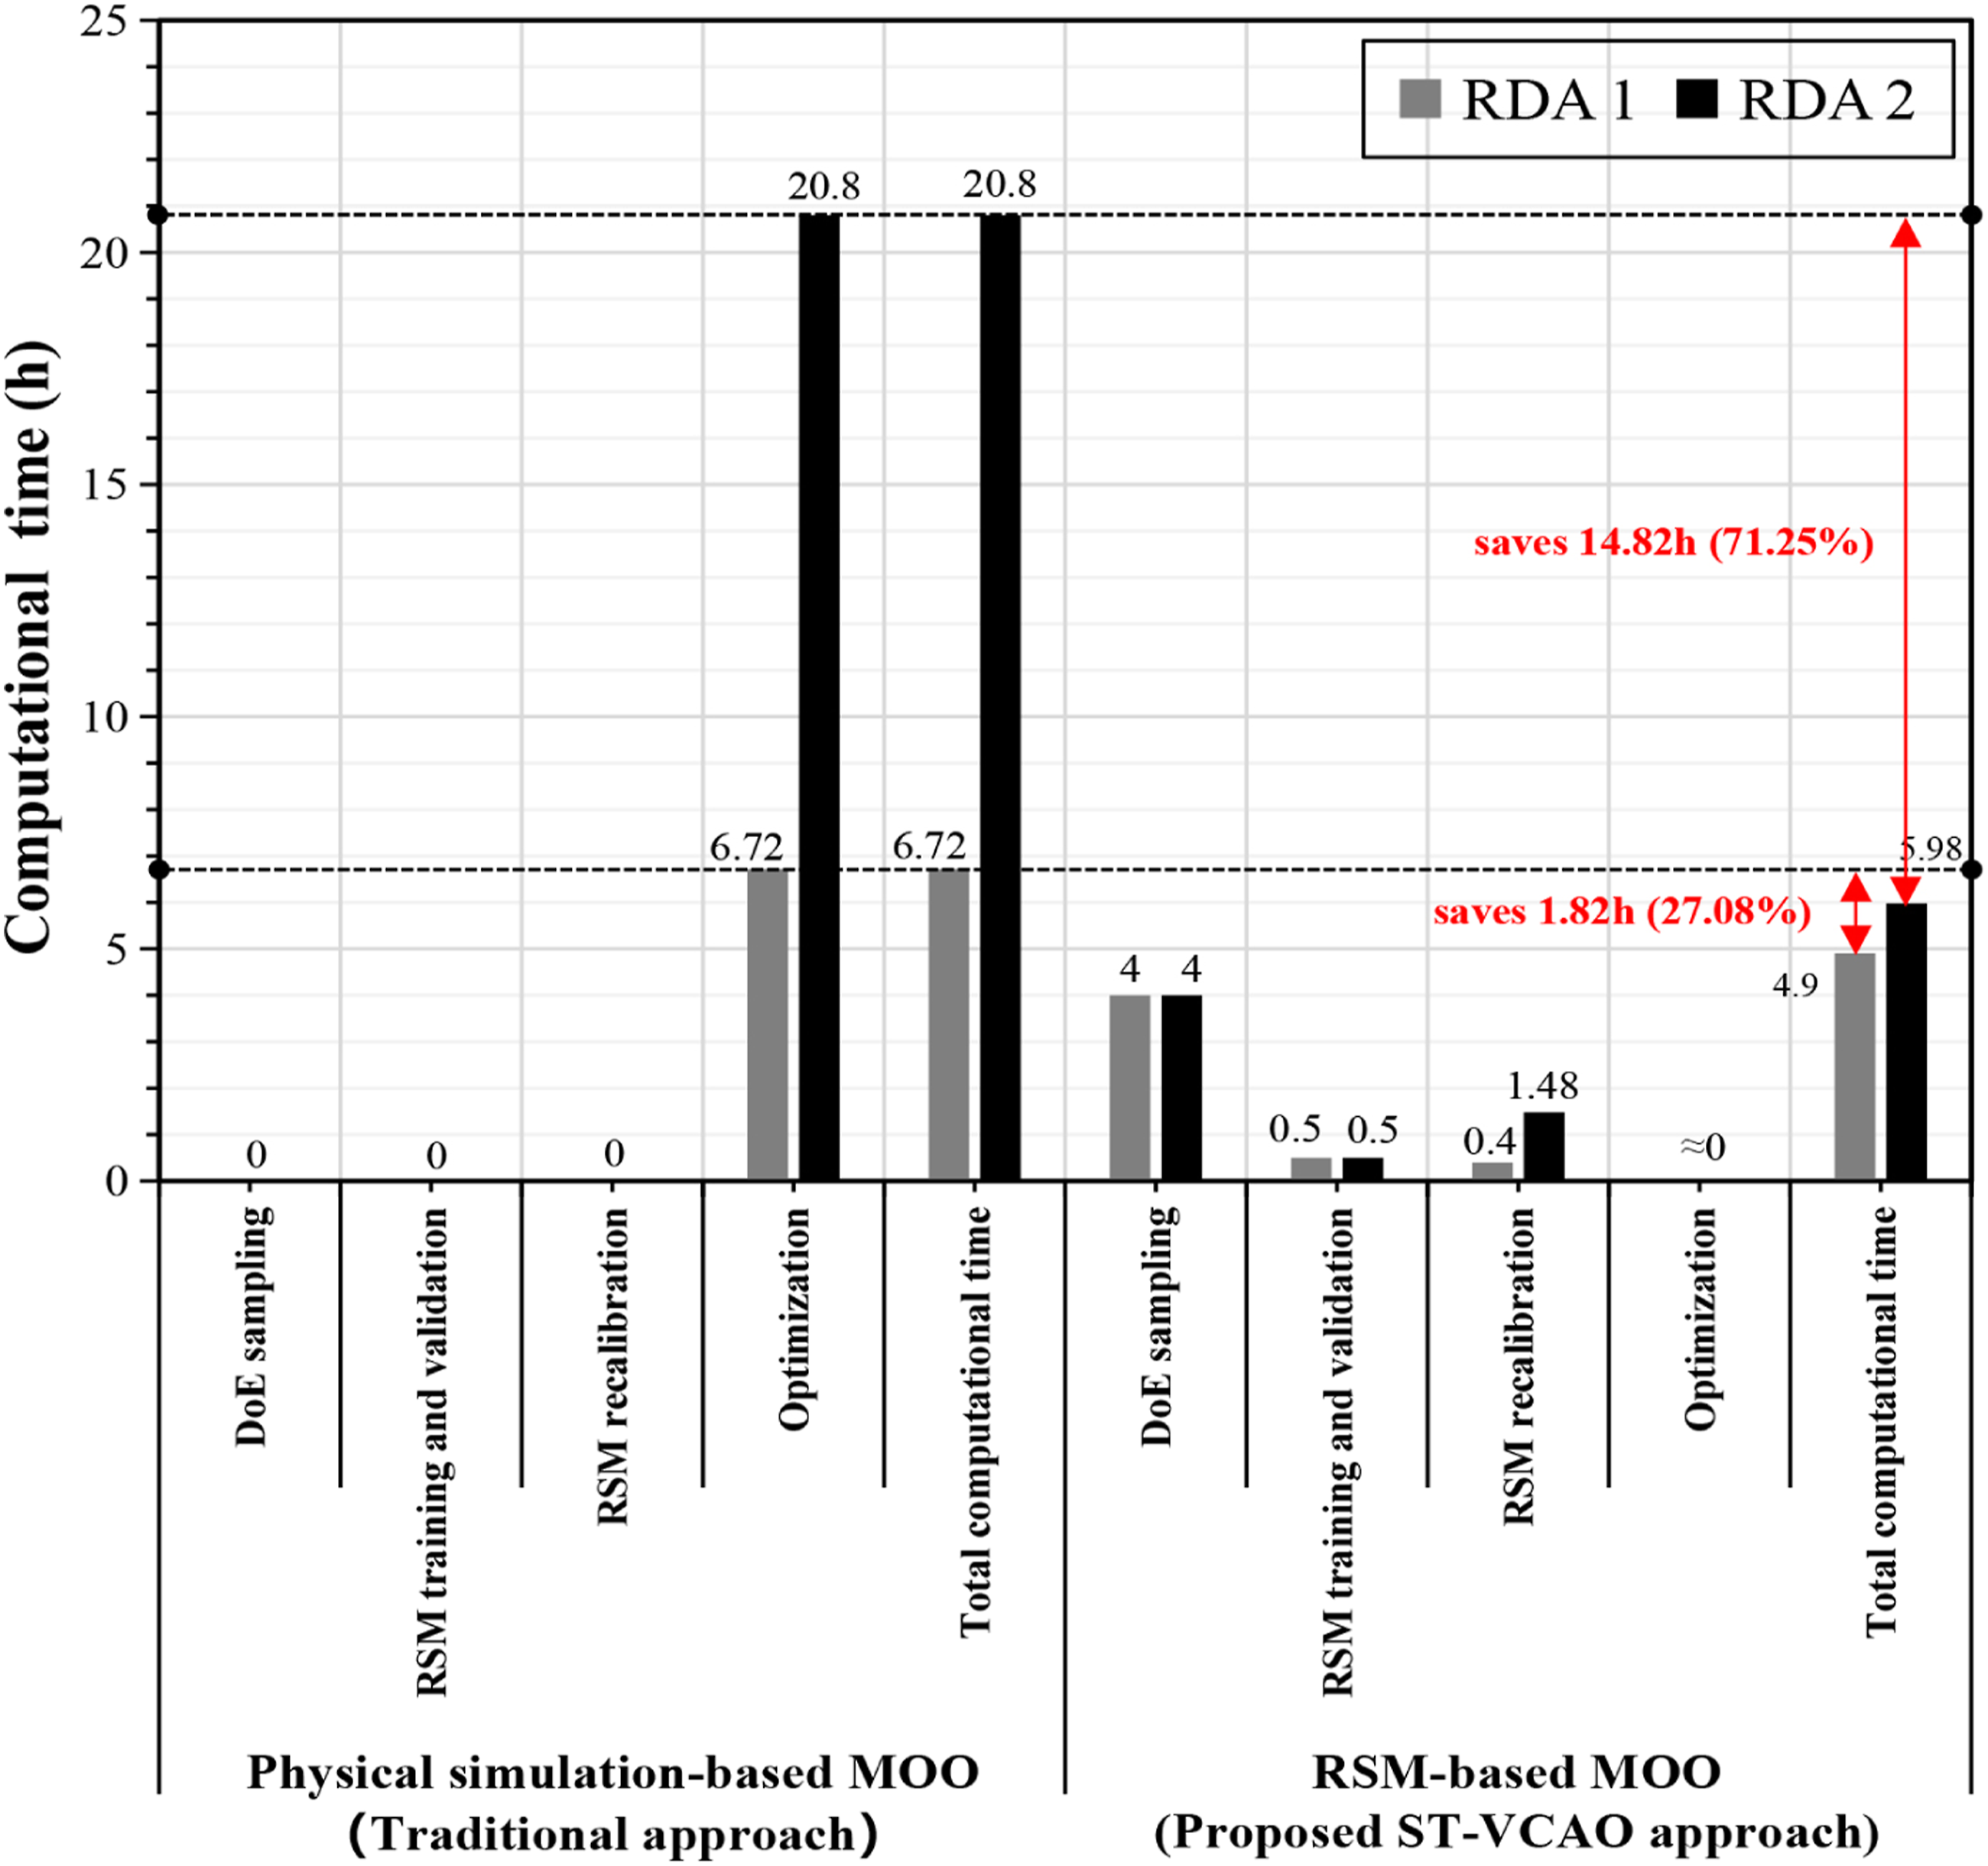
In addition, some limitations and future expectations of the ST-VCAO approach are as follows: (i) Regarding MVS, this study only investigated a simple sports type, that is, tennis single, where the player’s view scenes are relatively easy to model, while for team sports like basketball, group MVS are difficult to establish, which need to be addressed in future work. (ii) Concerning spatial and temporal visual comfort metrics utilized, for DGF, though the similar idea of ‘annual glare tolerance’ (5%) could be found in BS-EN-17037,10 it only serves as a recommendation and is not yet required for any certification. For sDG, there is a lack of specific targets in existing building codes and standards globally. Thus, evidence-based standards for daily/annual glare tolerance require more attention; future work should conduct more empirical studies combining human subject studies with field measurements. (iii) With regard to simulation scenarios, since ClimateStudio supports the modelling of blinds and tubular daylighting devices in annual daylight and glare simulations, the proposed approach is applicable in the presence of various shading devices, complex fenestration systems and redirecting daylight systems, which will be investigated in a future study. (iv) In relation to MOO methods, though RSM proved generally feasible in predicting visual comfort performance, unexpected estimation errors still exist and can be uneven amongst different output variables, which may affect the MCDM results. Hence, more accurate surrogate models along with advanced optimization algorithms are required in future work.
Conclusion
This study develops an occupant-centric approach for spatio-temporal visual comfort assessment and optimization (ST-VCAO) in daylit sports spaces considering the occupants’ movement behaviour. The feasibility of the proposed ST-VCAO approach was examined through a real case study which exhibited good practical applicability. Some remarking research outcomes are summarized as follows: • The spatio-temporal daylight and glare metrics used in this study are more compatible at revealing multi-dimensional resolutions of visual comfort performance, including the spatial variances and temporal variations of daylight availability and glare potential, which were found to be more appropriate for ST-VCAO in daylit sports spaces. • The introduction of movable view scenes (MVS) provides a reasonable idea to deal with the confusion of view scenes in glare detection of sports spaces, serving as an effective substitute to limited fixed view scenes in existing methods. • The parallel simulation combining RSM-based MOO could save 27.08% (RDA 1) or 71.25% (RDA 2) of total computational time for this case study, which provides designers with faster simulation feedback. • Amongst all Pareto solutions achieved by the proposed ST-VCAO approach, the optimum alternative upon the worst one observed 200% (RDA 1) or 50.7% (RDA 2) higher visual comfort, which gave the MCDM rank value. • The developed DPPV workflow can map the spatial and temporal daylight availability and glare potential with high-resolution, which can intuitively interpret the optimization results into more enlightening design information, showing its usefulness for practical applications.
This study formulates a generic methodological framework for ST-VCAO in sports spaces that is reproducible and could be extended to other design cases and scenarios. Future studies will investigate more types of sports in different sports buildings covering various climate zones to further expand the applicability of the proposed ST-VCAO approach.
Footnotes
Author contributions
Yu Li: conceptualization, methodology, software, data curation, formal analysis, visualization and writing – original draft. Lingling Li: review and editing and supervision. Pengyuan Shen: conceptualization, methodology, project administration, writing – review and editing and funding acquisition. Chao Yuan: review and editing.
Declaration of conflicting interests
The author(s) declared no potential conflicts of interest with respect to the research, authorship, and/or publication of this article.
Funding
The author(s) disclosed receipt of the following financial support for the research, authorship, and/or publication of this article: This work was supported by the National Natural Science Foundation of China (Grant No. 52008132), Shenzhen Science and Technology Program (Grant No. RCBS20200714114921062) and the China Scholarship Council (Grant No. 202006120376).