
Abstract
Understanding the effects of climate change on building indoor thermal conditions is of importance for providing a comfortable thermal environment for occupants. Some multi-family dwellings have already been listed as heritage in China (hereinafter referred to as heritage apartments), limiting modifications to the building envelope. However, the effect of climate change on thermal comfort in heritage apartments with a compact interior (i.e. without a living room) built before the 1980s in different Chinese climate zones has seldom been studied. This study focuses on the current and future thermal comfort in two-bedroom heritage apartments in China. The study was conducted for two different Chinese climate zones, that is, a cold climate zone (Beijing), and a hot summer and cold winter climate zone (Shanghai) and both current climate scenarios (typical meteorological years) and future climate scenarios (2050) were used. The results indicate, among other things, increases of 58%–60% and 41%–44% in the predicted average number of overheating hours in 2050 compared to the current climate for the studied bedrooms on the first floor in dwellings in Beijing and Shanghai, respectively.
Keywords
Introduction
In 2017, nearly 40% of global energy-related CO2 emissions were attributed to buildings and construction, 1 and global CO2 emissions caused by buildings have continued to increase by approximately 1% annually since 2010. 2 Moreover, the global mean surface temperature from 2046 to 2065 will be 1.0°C–2.0°C higher than in the period from 1986 to 2005 as estimated by the Intergovernmental Panel on Climate Change (IPCC). 3 The resulting increase in outdoor air temperature in the future can impact building occupants’ thermal comfort if active cooling systems are absent 4 or increase energy consumption for cooling.5–7
For China, very similar observations can be made. In 2016, buildings accounted for approximately 19.0% of China’s total energy-related carbon emissions. 8 The annual mean near-surface air temperature in China in 2018 was about 1.2°C higher than in 1901 9 and it will be 1.5°C–2.8°C higher in 2030 and 3.4°C–5.3°C higher in 2080 than the average of 1961 to 1990. 10 Consequently, the predicted trend of increased ambient air temperatures may lead to an increase in the air temperature in indoor environments, and especially summer indoor overheating can become a concern.
Indoor thermal comfort is essential for residents. In addition to possible health issues, 11 thermal discomfort can lead to sleeping problems 12 and subsequently a loss of productivity during the day. 13 Therefore, focussing on thermal comfort in residential buildings is of great importance. 14
In China, dwellings built to meet the growing population demands in the absence of energy regulations are considered to be highly energy consuming and greenhouse gas emitting. 15 The total residential building sector in China accounted for 10.3% of China’s CO2 emissions in 2012. 16 The Chinese government has prioritized building energy efficiency since the early 1980s, 17 leading to the development of building energy efficiency policies ever since. 18 Moreover, the first residential building energy code was implemented in 1986 in China, 19 and the work of insulating building walls started in China in the 1980s. 20 Therefore, it is necessary to focus on existing buildings’ energy efficiency and thermal comfort in general, and more in particular on the energy efficiency and thermal comfort of dwellings built in the period in which energy regulations were still absent, that is, before the 1980s. In Chinese urban areas, around 9% of families live in residences built before the 1980s, which currently account for 6% of the total residential floor area. 21 Due to climate change effects and the increased urban heat island effect due to increased levels of urbanization, the air temperatures in cities have increased in the last decades.22,23 This increase can lead to a decrease in thermal comfort levels in buildings and occupants might resort to active cooling systems to create comfortable indoor conditions. This would result in an increase in the building energy demand while there is a need to reduce building energy demand as much as possible.
Non-exhaustive literature review on the effect of climate change on building indoor thermal comfort.
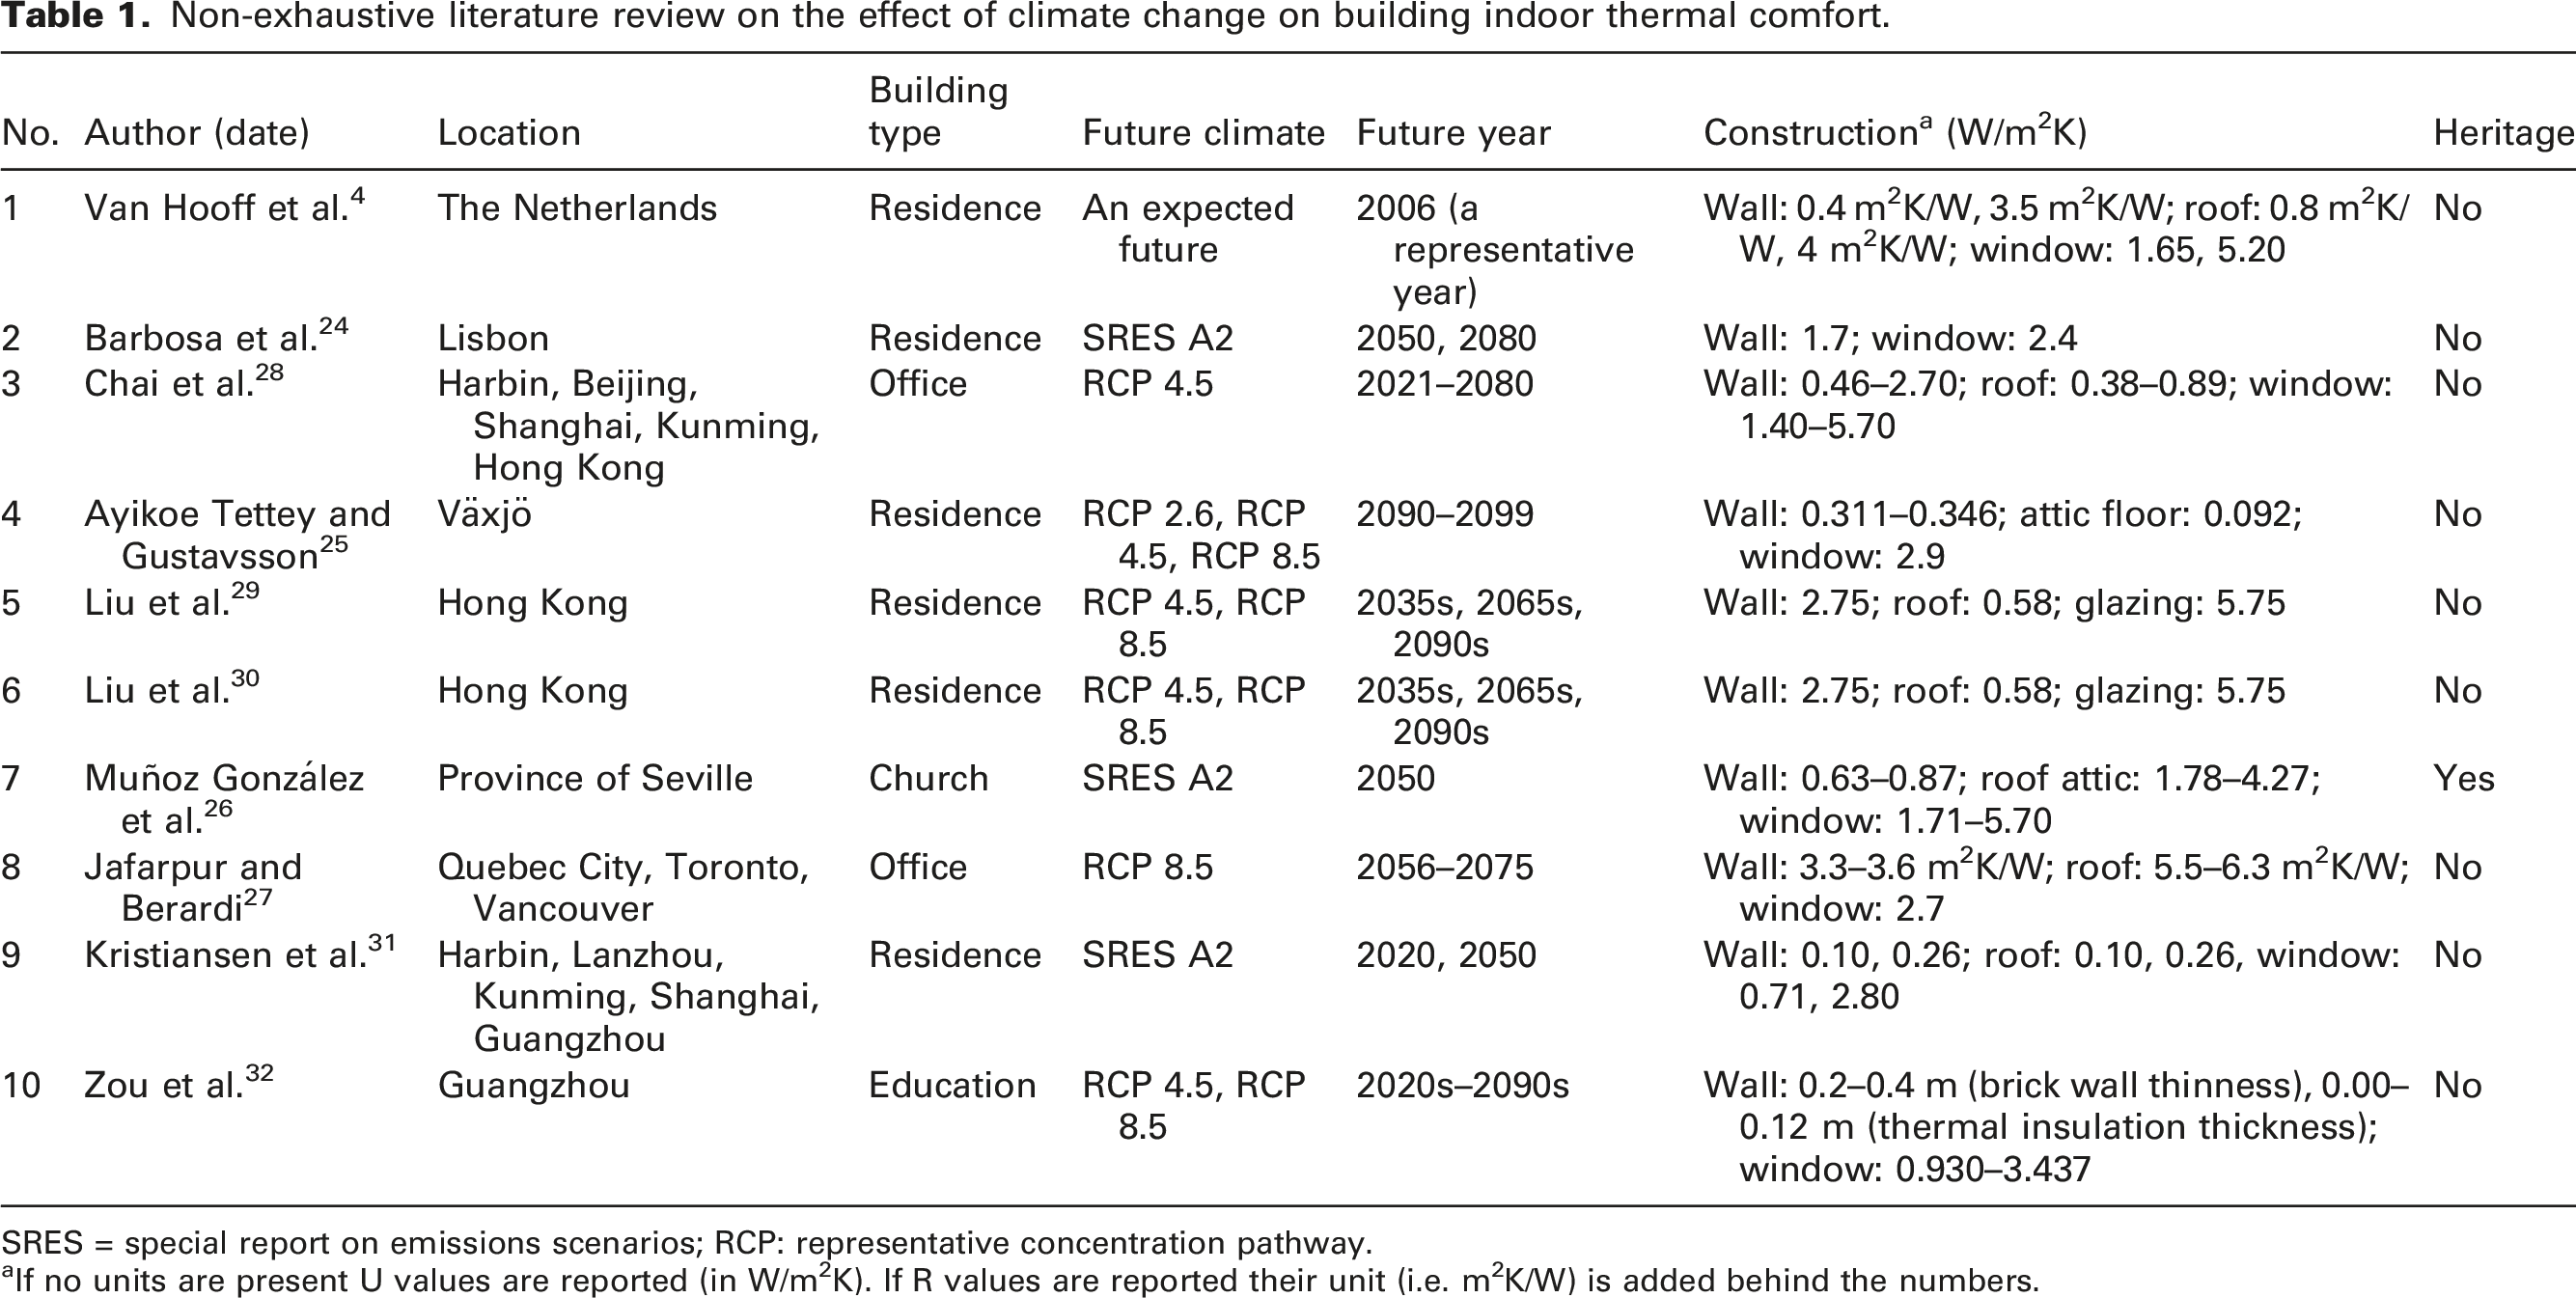
SRES = special report on emissions scenarios; RCP: representative concentration pathway.
aIf no units are present U values are reported (in W/m2K). If R values are reported their unit (i.e. m2K/W) is added behind the numbers.
Methodology
Numerical simulations were performed using the simulation program EnergyPlus (version 9.1.0)34,35 based on current and future climate scenarios in Beijing and Shanghai. The development of EnergyPlus was funded by the Department of Energy (DOE) of the USA and it has been validated extensively in the past.36–39 Adaptive thermal comfort models40,41 were selected to evaluate occupants’ thermal comfort conditions in bedrooms based on a generic apartment model.
Weather data
Two of the largest Chinese cities, that is, Beijing and Shanghai, were selected to represent climate conditions in a cold climate zone and a hot summer and cold winter climate zone in China, respectively.
Two types of weather files were studied: (1) typical meteorological years as current climate scenarios (hereinafter typical years) from the ‘International Weather for Energy Calculations’ (IWEC) dataset in the suburban area of Beijing from 1983 to 1999, 42 and in the urban area of Shanghai from 1983 to 1995; 43 (2) predicted future climate scenarios in 2050 generated by CCWorldWeatherGen 44 based on the selected IWEC typical years in Beijing and Shanghai. Note that the urban heat island effect is thus already included in the weather files. CCWorldWeatherGen version 1.9, which was developed by the Sustainable Energy Research Group of the University of Southampton, was used. 45 It is based on GCM model HadCM3, SRES A2 scenario, and is capable of transforming the present baseline EnergyPlus Weather File (EPW) into different future EPWs. 45
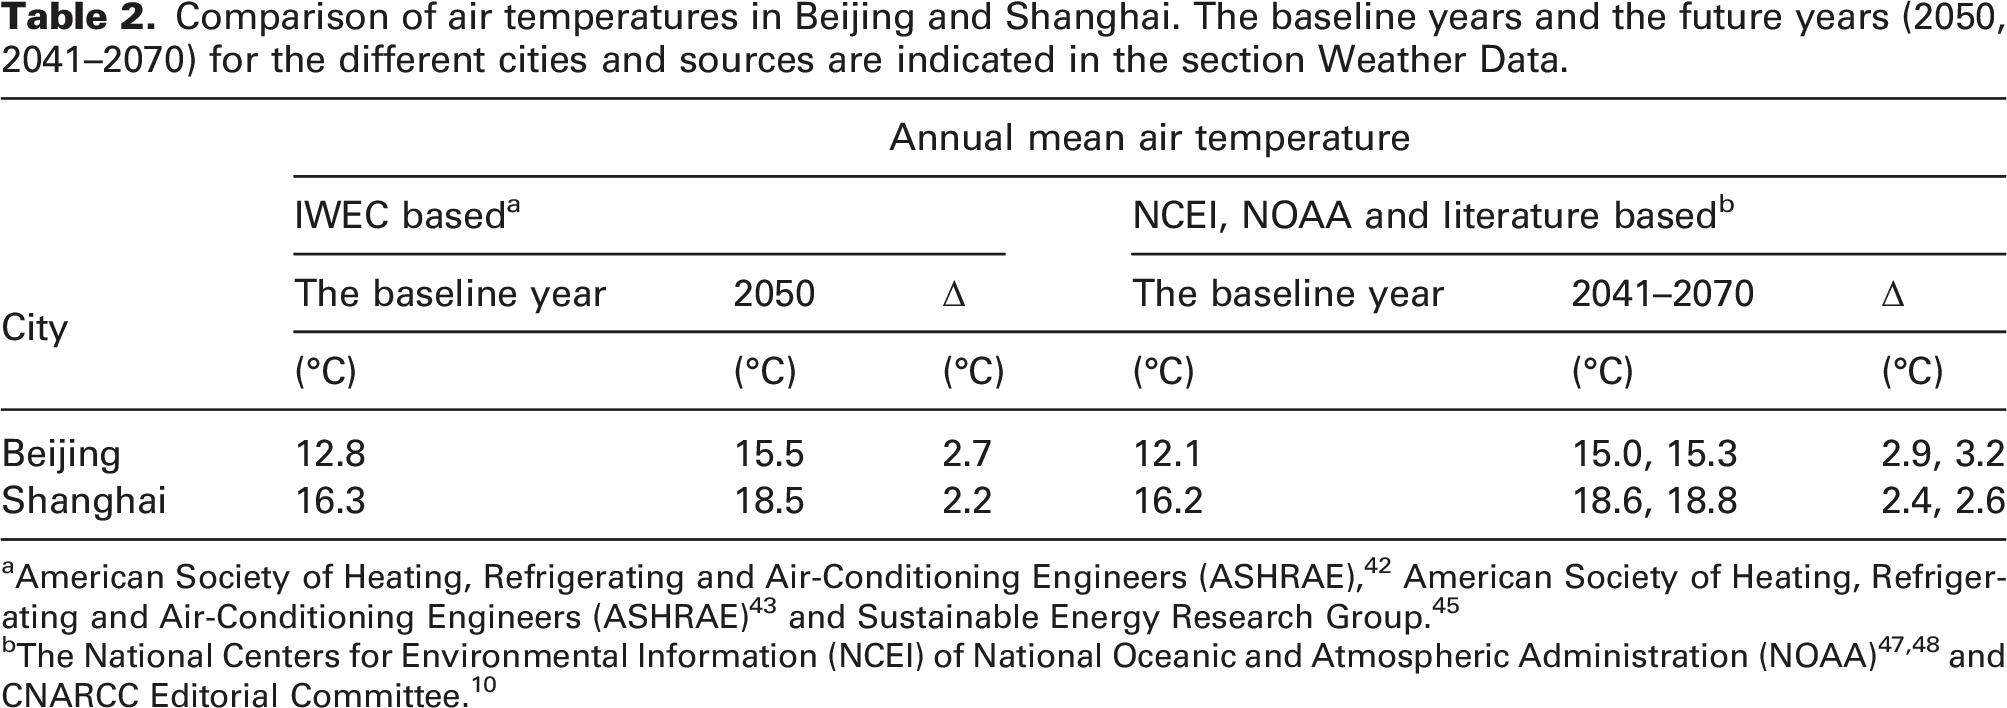
The annual mean air temperature in Beijing is 12.8°C in a typical year and will increase to 15.5°C (+2.7°C) in 2050. Similarly, the annual mean air temperature in Shanghai is 16.3°C in a typical year and will increase to 18.5°C (+2.2°C) in 2050. For the annual mean solar radiation, however, small decreases are observed in 2050, that is, −3.2% in Beijing and −2.3% in Shanghai. The reduction can be caused by the increase in atmospheric water vapour and aerosol content, as indicated by Qian et al. 46
The monthly average air temperature and hourly solar radiation for both cities are depicted in Figure 1. The monthly average air temperature in each month is higher in 2050 than in the typical year in Beijing (Figure 1(a)) and Shanghai (Figure 1(b)). In both cities, the highest monthly average air temperatures are in July (and August in Shanghai in 2050), that is, 26.4°C in Beijing and 28.2°C in Shanghai in the typical year and 29.5°C in Beijing and 30.4°C in Shanghai in 2050. The monthly average hourly solar radiation in each month is similar in the typical year and in 2050 in Beijing (Figure 1(a)) and Shanghai (Figure 1(b)). The largest monthly average hourly solar radiation in Beijing occurs in June with 231.2 Wh/m2 in the typical year and 237.9 Wh/m2 in 2050. For Shanghai, the largest monthly average hourly solar radiation occurs in August with 210.9 Wh/m2 in the typical year and 213.6 Wh/m2 in 2050.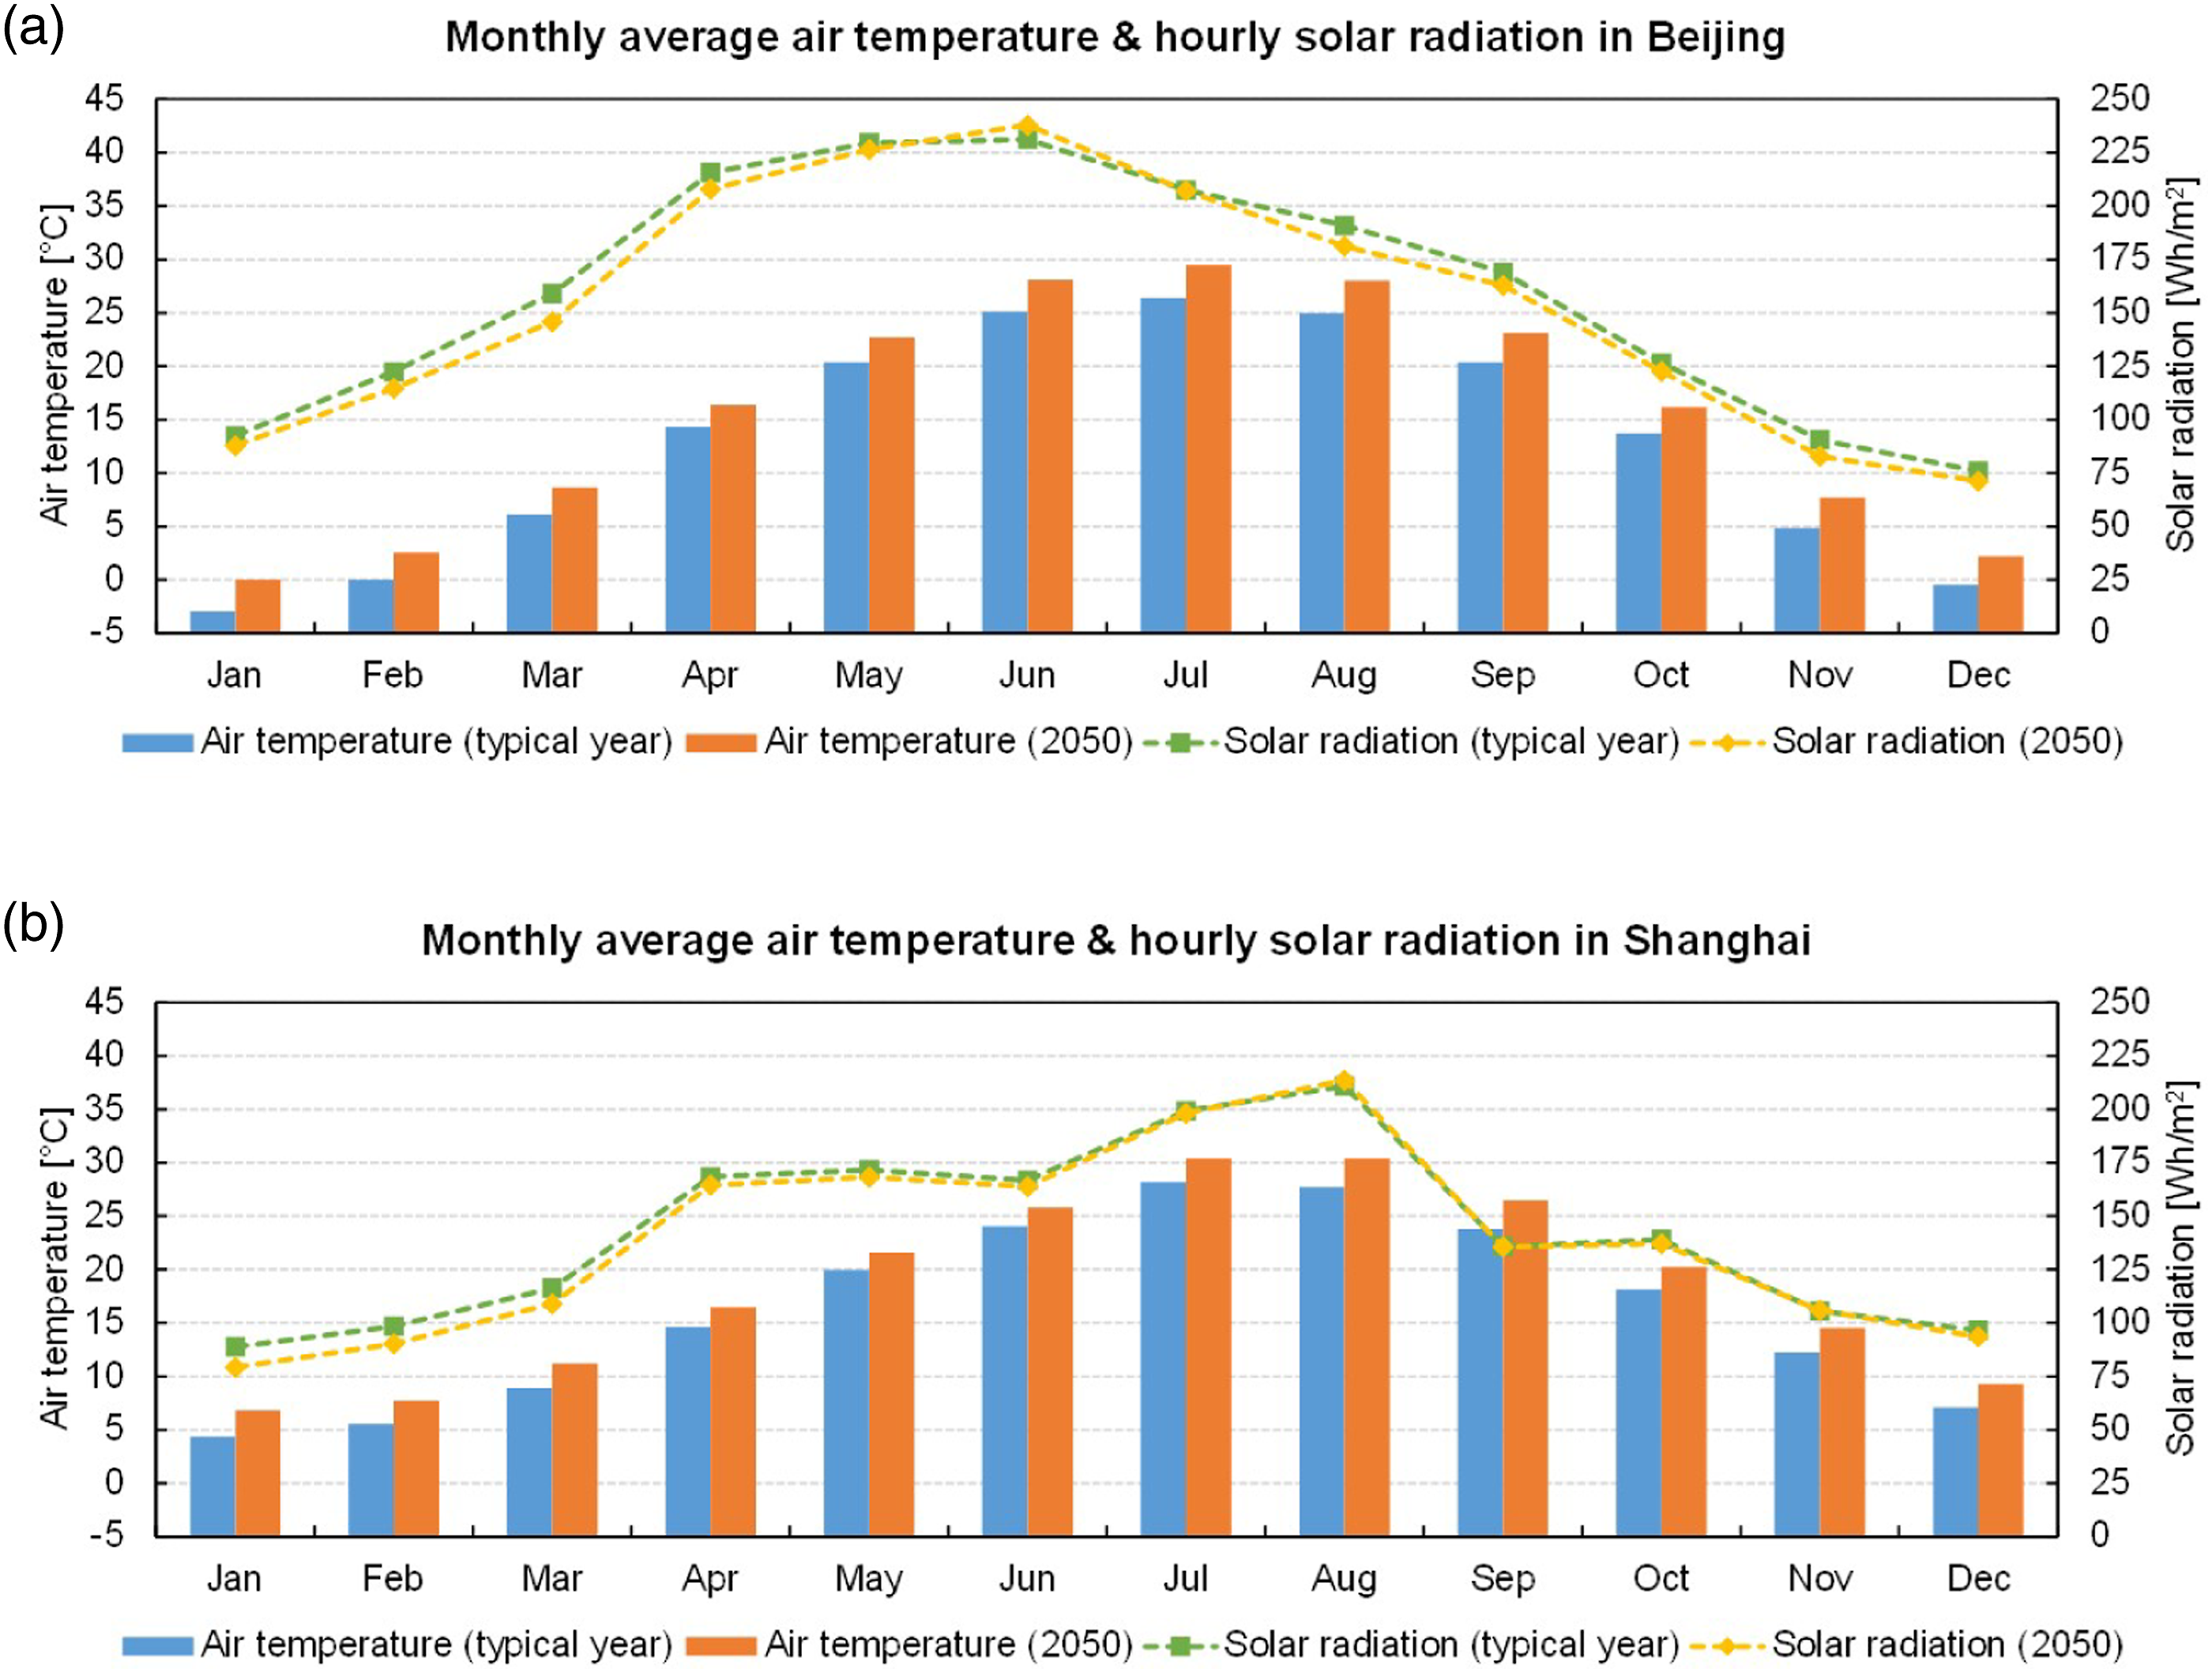
Figure 2 shows the hourly air temperature and solar radiation during July with a clear increase in the air temperatures in 2050 compared to the typical year in Beijing (Figure 2(a)) and in Shanghai (Figure 2(b)). In July, there will be an increase of 61.3% and 205.0% in hours with an air temperature above 25°C and 30°C, respectively, from the typical year to 2050 in Beijing. In Shanghai, from the typical year to 2050, there will be an increase of 13.6% and 91.1% in hours with an air temperature above 25°C and 30°C, respectively. Increases in air temperatures from the typical year to 2050 can also be observed in June and August in both cities. The monthly average hourly solar radiation during July in the typical year and in 2050 is similar for both cities, that is, 207.5 Wh/m2 in the typical year and 207.1 Wh/m2 in 2050 in Beijing, and 199.3 Wh/m2 in the typical year and 198.1 Wh/m2 in 2050 in Shanghai.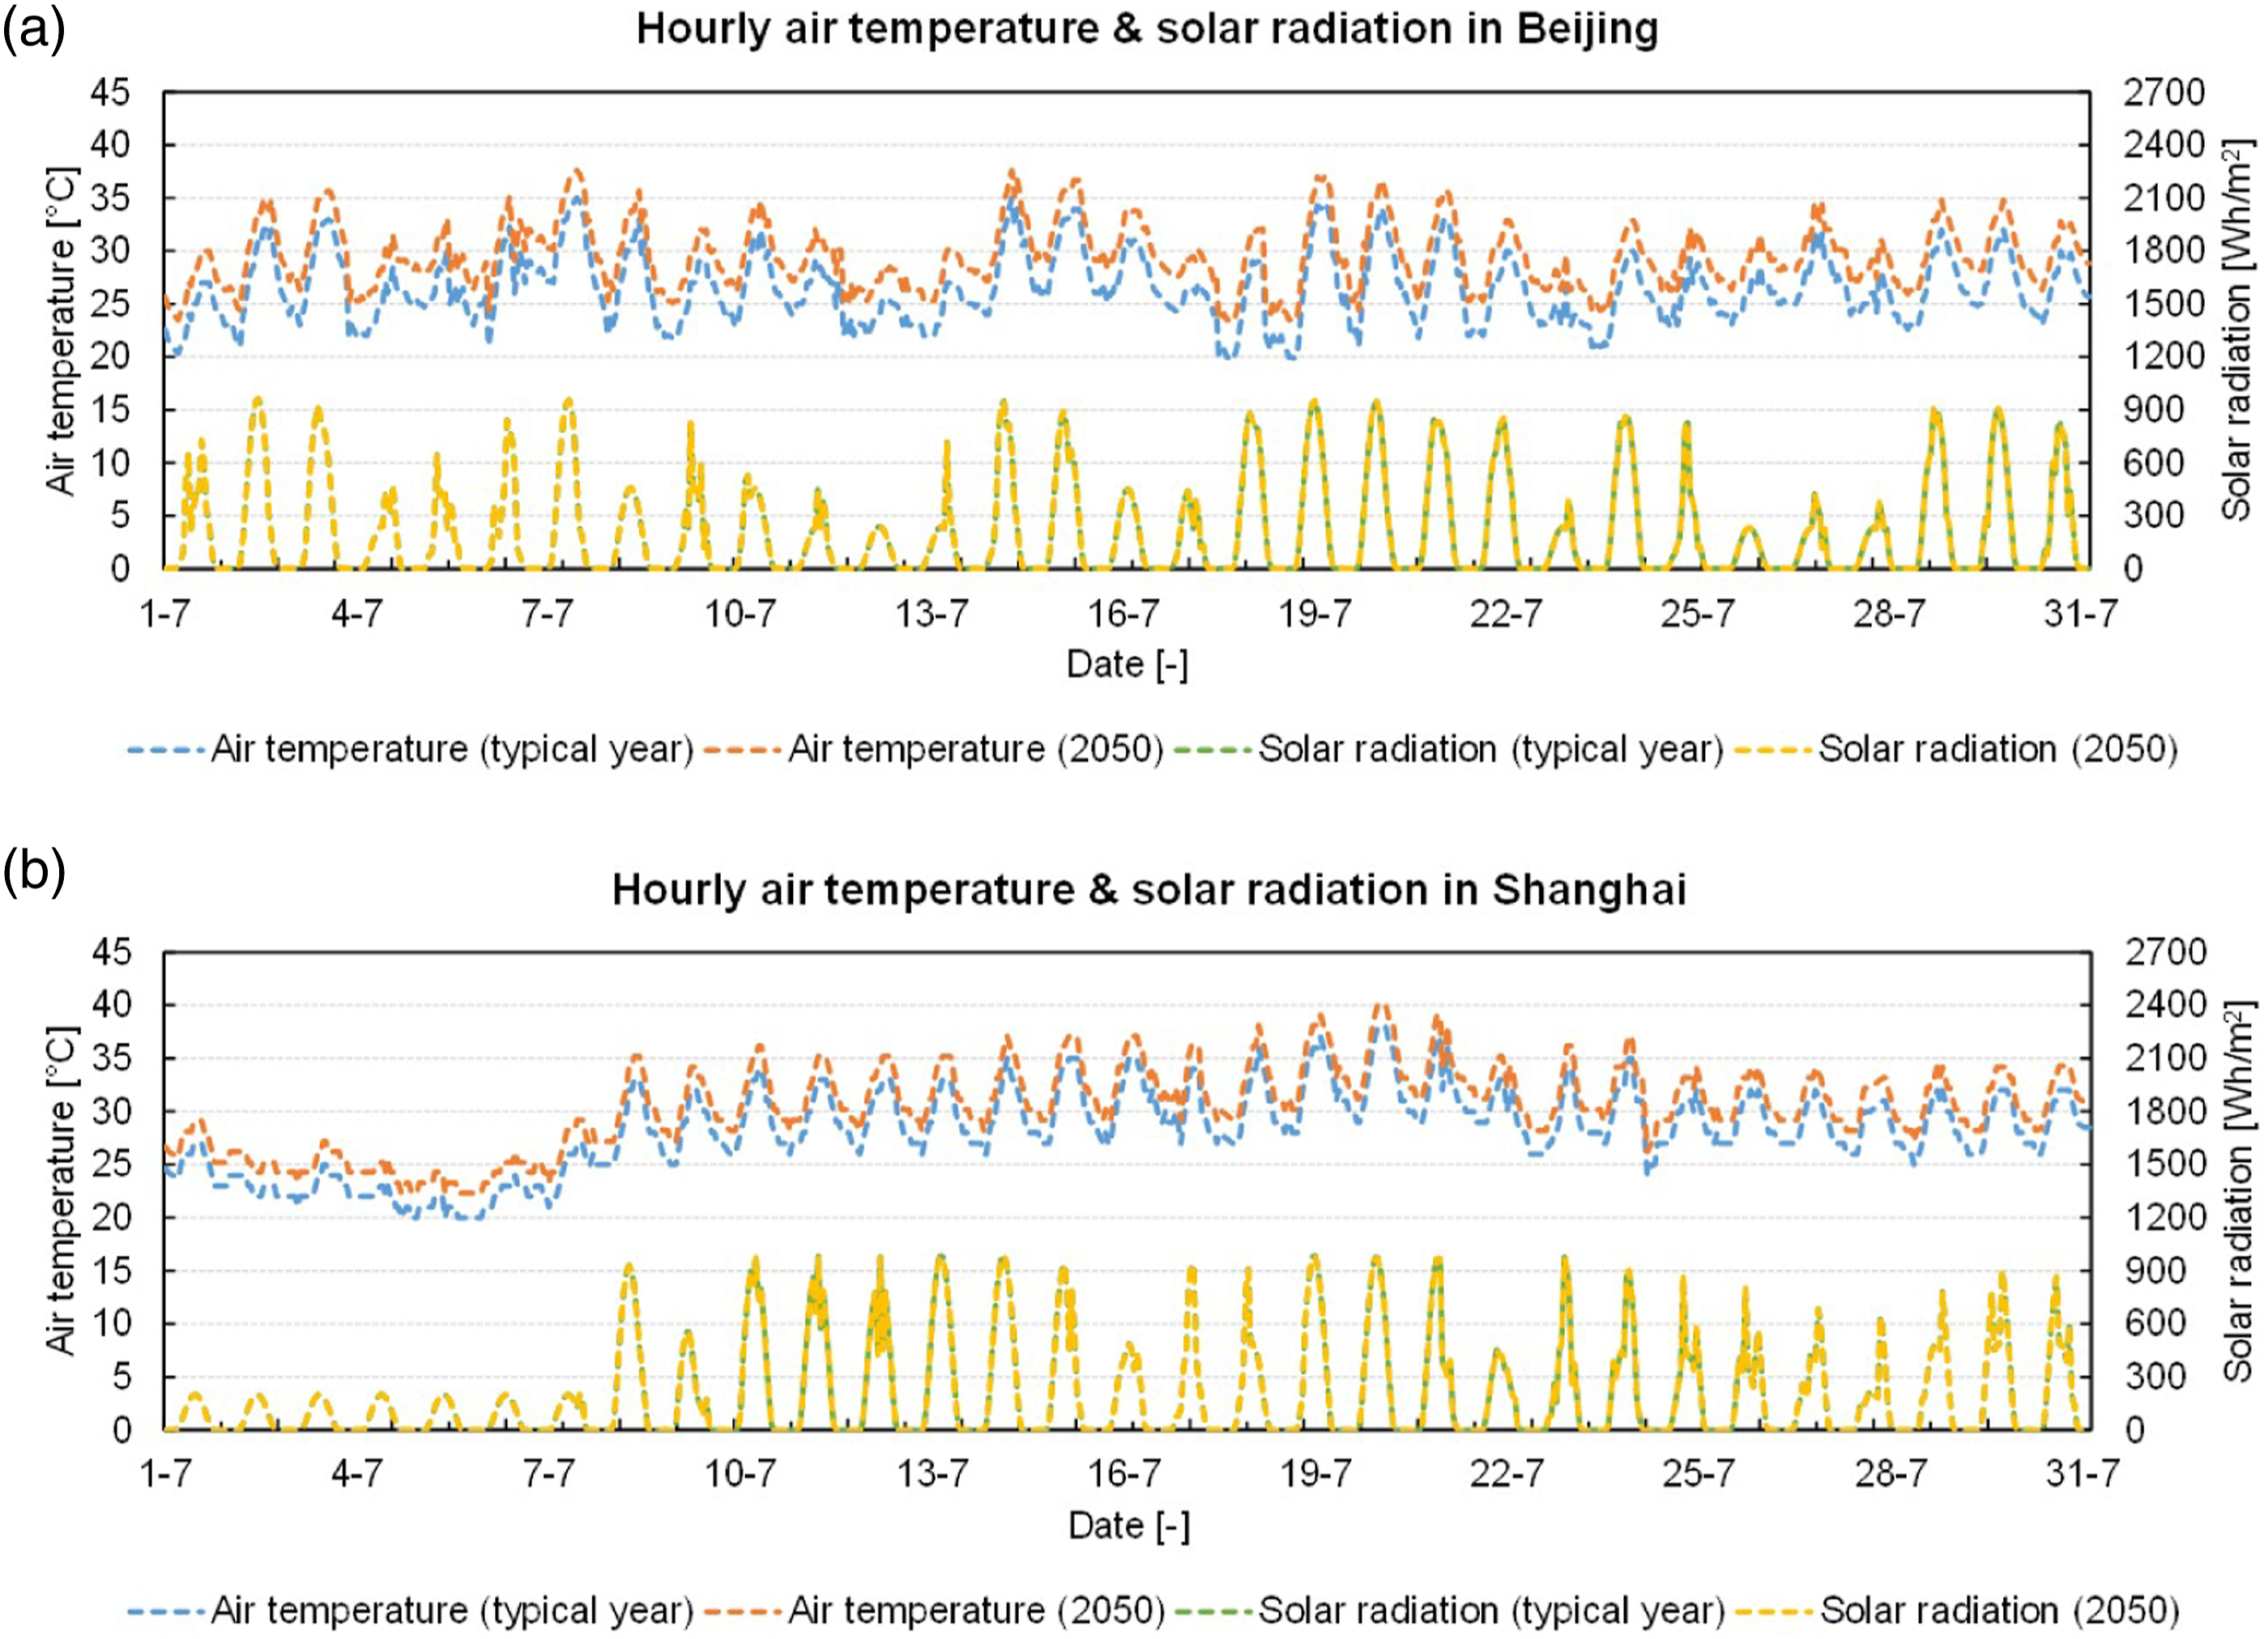
Comparison of air temperatures in Beijing and Shanghai. The baseline years and the future years (2050, 2041–2070) for the different cities and sources are indicated in the section Weather Data.
Heritage apartment model
Building geometry
In Beijing, two-bedroom apartments accommodated 40.5% of residents in 2017. 49 Moreover, the normal working class residents in Shanghai usually live in two-bedroom apartments of 80–100 square metres 50 and two-bedroom apartments with one bathroom seem to be the most typical Shanghai rental units. 51 Therefore, two-bedroom apartments were selected for the case study of multi-family dwellings due to their typical unit type and the relatively large share of residents they accommodate per square metre.
Some two-bedroom apartments have been listed as heritage. For example, in Beijing, the Baiwanzhuang neighbourhood has been listed as ‘Chinese Architectural Heritage of the 20th Century’ (second batch) 52 and is a representative of the first generation of ‘Jiefang’ (neighbourhood) style residence in China. 53 The Baiwanzhuang neighbourhood was built in the 1950s and includes two-bedroom apartments. 54 In Shanghai, there are 75 modern apartment buildings that have been listed as heritage on five Shanghai historical building preservation lists, which include two-bedroom apartments. 55 In addition, the Shanghai Yongjia New Village (Yongjia Xin Cun) that was built in 1947 56 includes two-bedroom apartments , 57 and has been listed as ‘Shanghai Heritage Architecture’ (second batch) 58 and is a typical example of an apartment style ‘Lilong’ (neighbourhood) dwelling. 59
Once a building is listed as heritage, modifications on the building envelope might be constrained by preservation requirements, 60 while the building might be in use for several more decades and may thus pose long-term effects on occupants’ thermal comfort and building energy demand. Moreover, there might be more two-bedroom apartments built in the past that will become listed as heritage in the future. Hence, considering (1) the long-term occupant thermal comfort effects posed by heritage apartments, (2) its existing diversity and (3) the future potential heritage status of two-bedroom apartments, this study focused on two-bedroom heritage apartments, selecting the aforementioned neighbourhoods as case studies: Baiwanzhuang neighbourhood in Beijing and Yongjia New Village in Shanghai.
Similarities in the building characteristics, that is, the floor number, bedroom dimensions, total floor area, interior layout (without living room) and slab-style geometry were identified in two publications54,57 and data from the online real estate platform Lianjia.com.61,62 Based on the identified data, a simplified generic two-bedroom apartment building was formulated which was assumed to be built in the 1940s–1950s, with heritage status, based on the aforementioned two heritage apartments and the similarities in their building characteristics (Figure 3). Note that only the first and second floor apartments were studied, while the ground floor was not considered to avoid ground effects on the heat balance (see Figure 3(a)). Moreover, there are some differences regarding the building characteristics, that is, a brick–concrete structure for Beijing
63
versus a brick–wood structure for Shanghai
56
and envelope surface colour (red for Beijing versus white for Shanghai53,62). The formulated generic apartment was studied in the two selected climate zones. The effect of urban surroundings with respect to the obstruction of solar radiation was not included in this study to keep the results as generic as possible. Studied generic apartment building (based on Xue and Lou,
57
Chen,
54
https://sh.lianjia.com/,
62
https://bj.lianjia.com/
61
). (a) Front facade, (b) side facade, (c) floor plan and (d) room plan. The dashed boxes in (a) and (c) indicate the location of the studied apartments. In (d), BA = Bedroom A; BB = Bedroom B; K = Kitchen; B = Bathroom and C = Corridor. The arrows in (c) and (d) indicate the north direction (bedroom windows oriented towards the south). Dimensions in mm.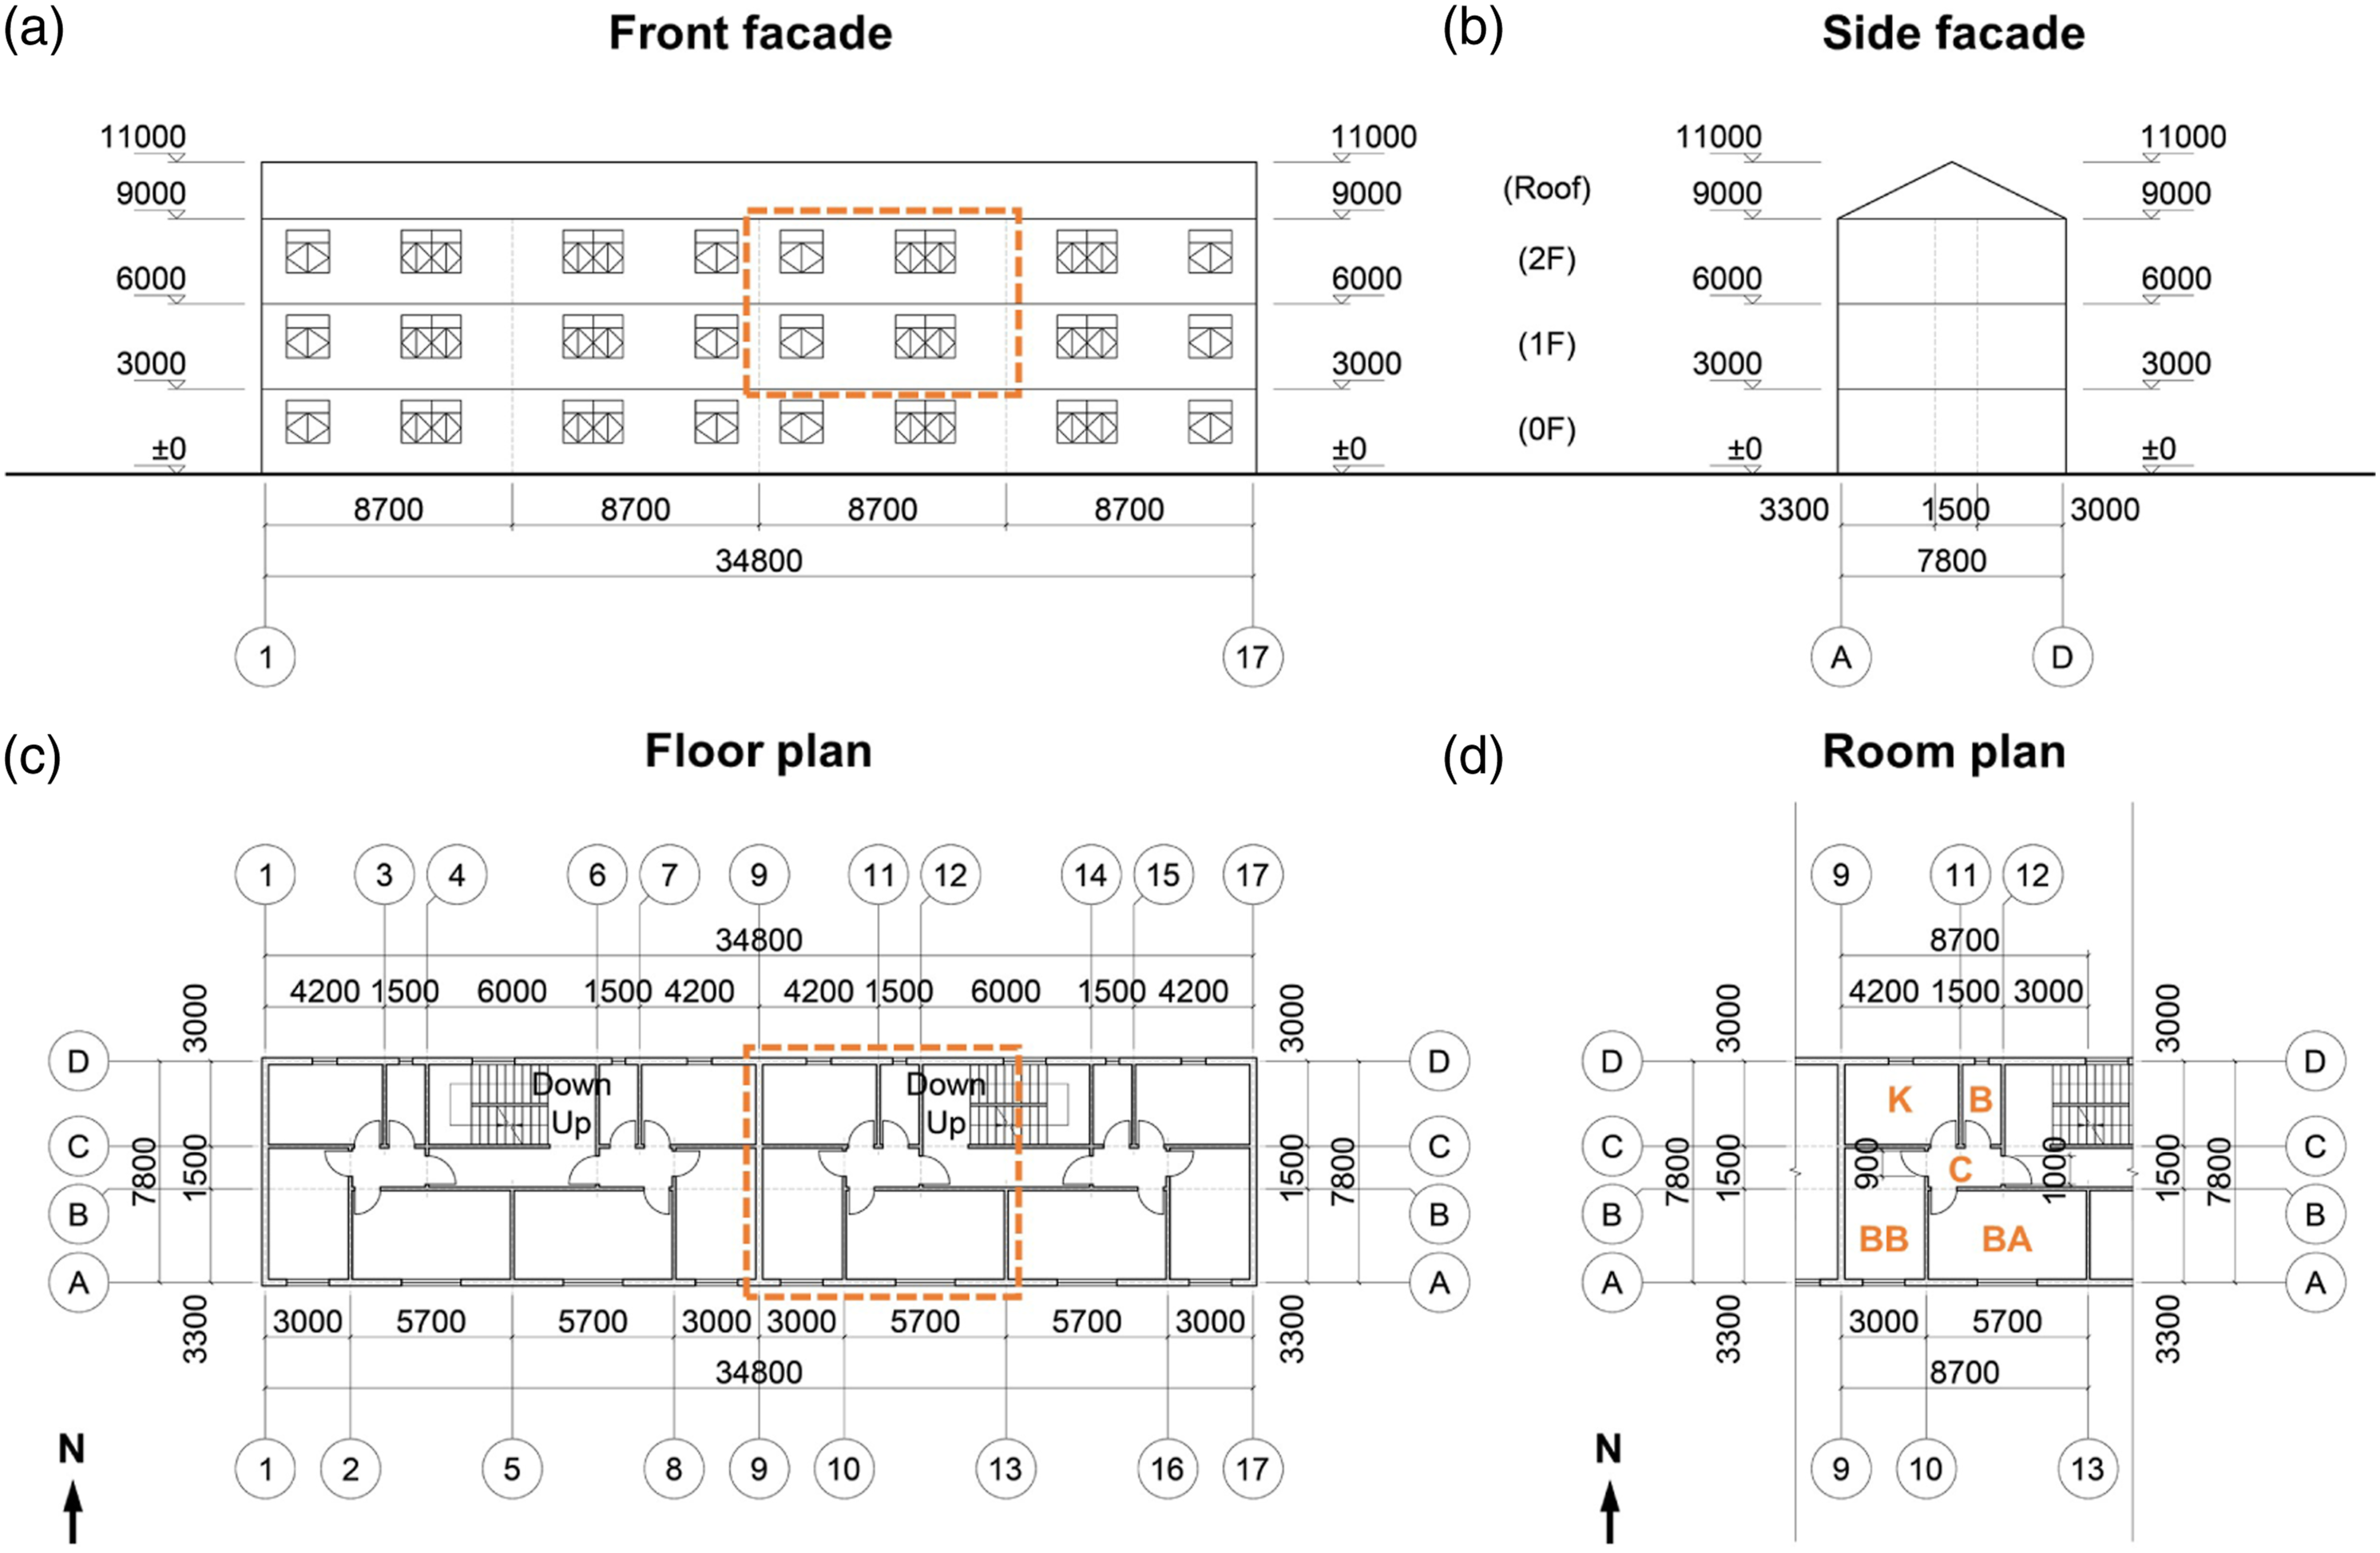
Building construction and materials
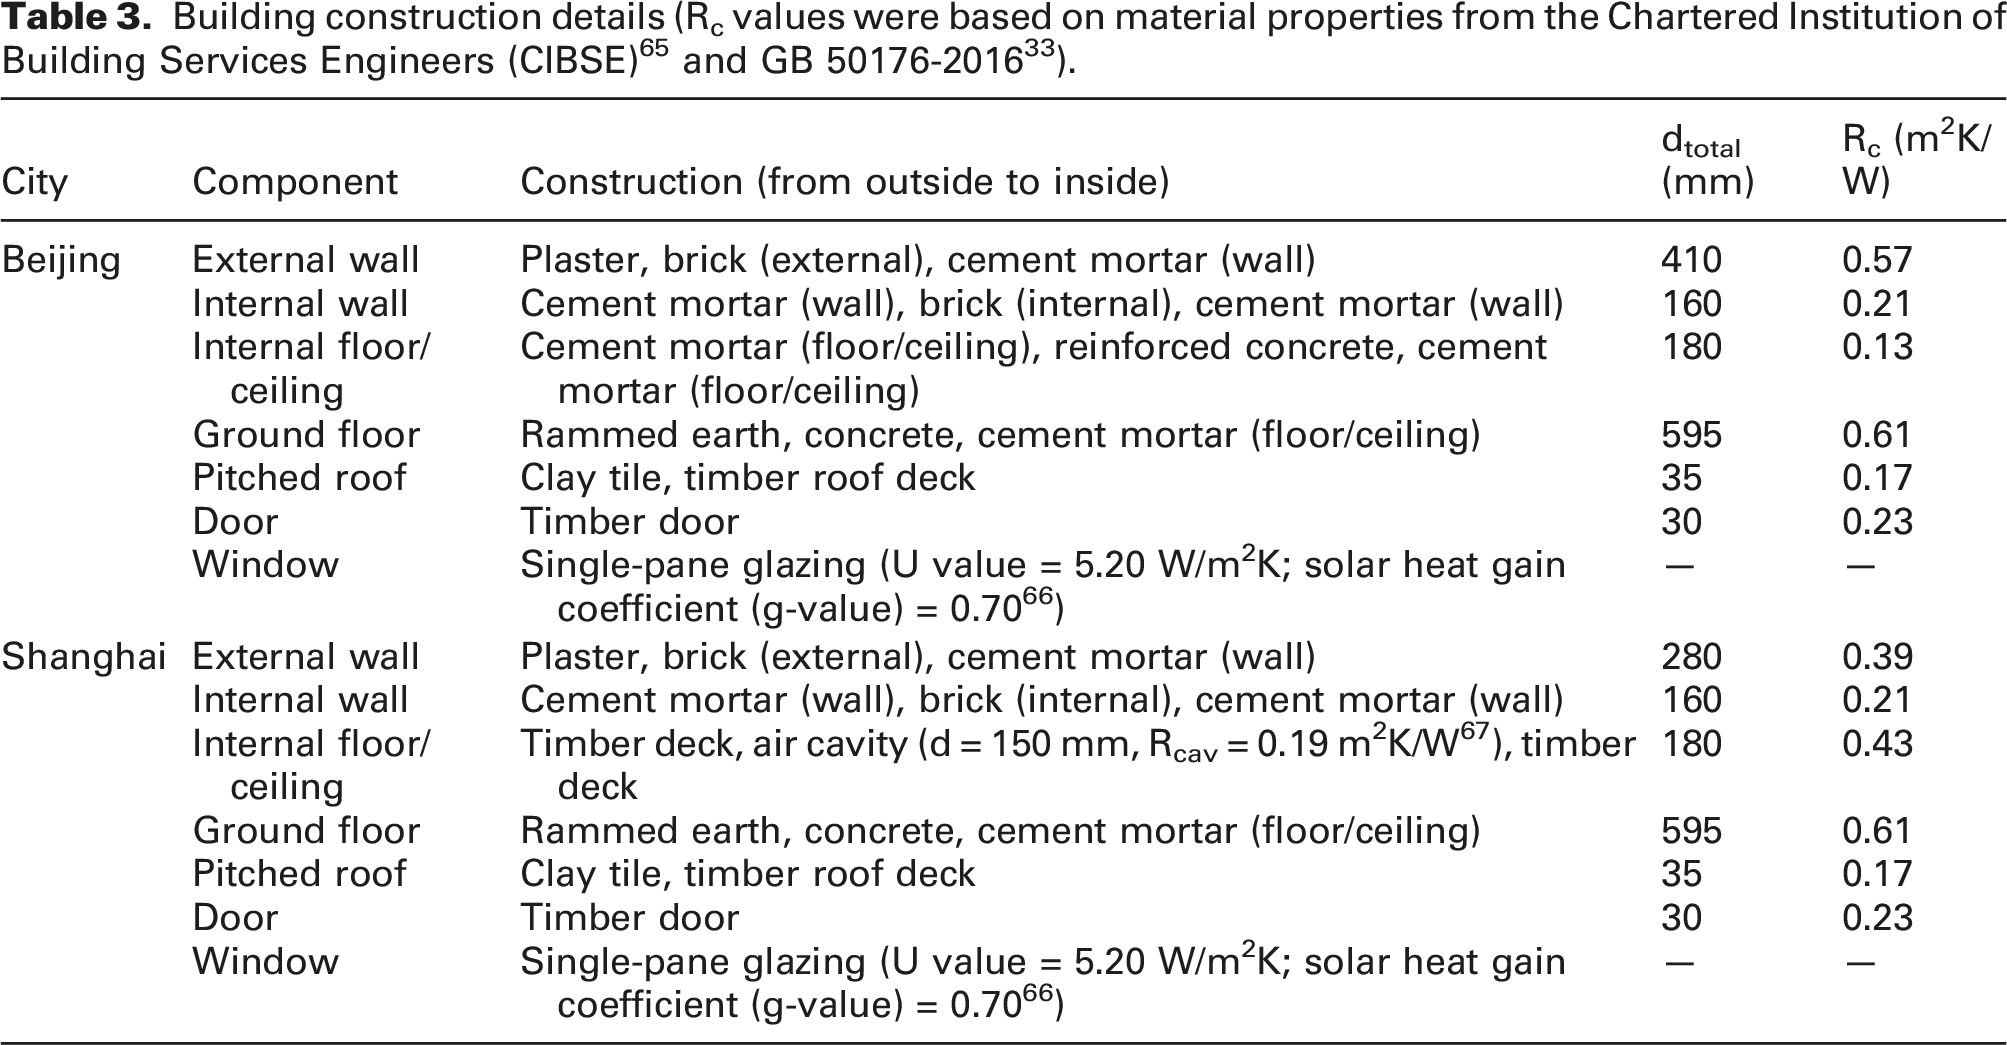
The values for solar reflectivity and thermal emissivity were set to 0.3 and 0.9, respectively, for all opaque materials, except for the plaster for the Shanghai case (white plaster), for which the solar reflectivity value (albedo) was increased to 0.9. 68
Internal heat gains
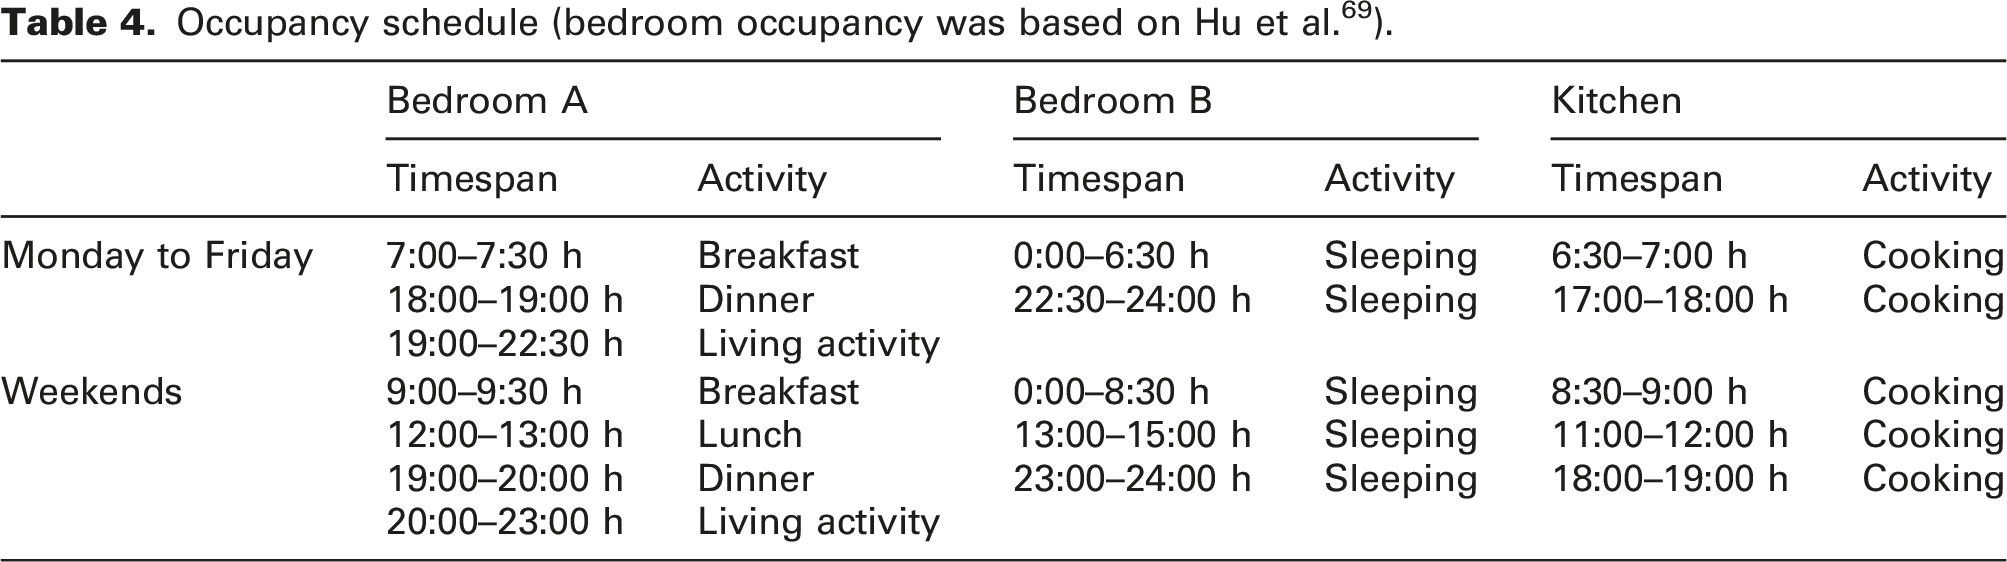
Occupancy schedule (bedroom occupancy was based on Hu et al. 69 ).
Internal heat gains.
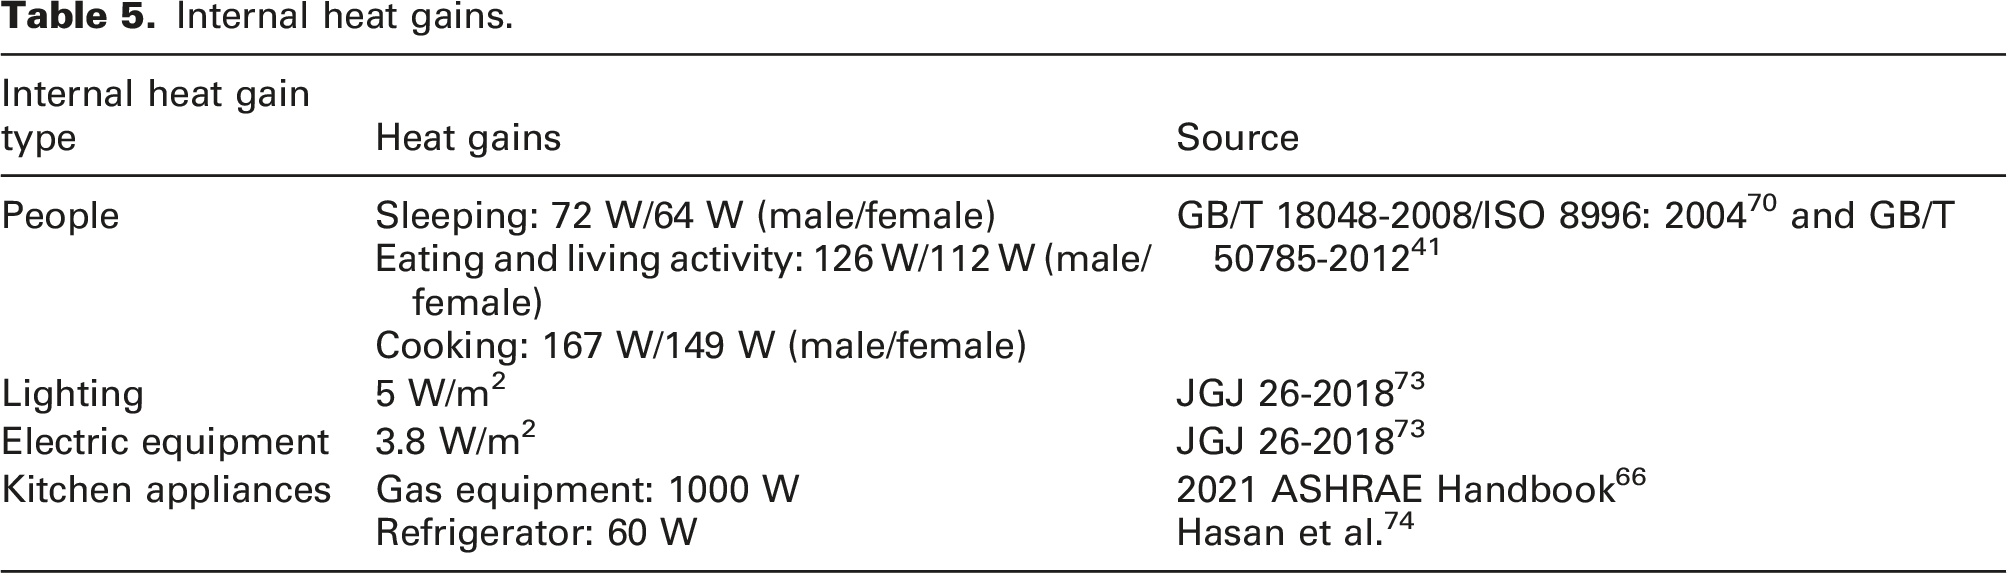
The skin surface areas of an adult male and female were taken equal to 1.8 m2 and 1.6 m2, respectively. 70 The heat gain due to lighting was present in Bedroom A during dinners and living activities and in the Kitchen during cooking for dinners. Heat gain from the electric equipment was present during the occupancy of Bedroom A, Bedroom B and the Kitchen. However, for Bedroom B, only 10% of the electric equipment load was applied. 71 For the kitchen appliances, the heat gain from the gas equipment in the kitchen was only present during cooking, and the heat gain from the refrigerator was assumed to be constant throughout a day. The fractions of radiant heat for all heat sources were based on Rea 72 and 2021 ASHRAE Handbook. 66
Further simulation settings
EnergyPlus version 9.1.034,35 was used in the present study for the numerical simulations. The number of simulation time steps was set to 6 per hour. Although this study focused on the non-heating periods, the space heating systems (ideal air systems) were included for the heating periods. Heating is available from 15th November to 15th March of the next year for Beijing, 75 whereas heating for Shanghai is available from 1st December to 28th February of the next year, 76 irrespective of the studied climate scenario. Therefore, the non-heating period in Beijing runs from 16th March until 14th November (5856 h), and in Shanghai from 1st March until 30th November (6600 h). The number of overheating hours and degree hours is only evaluated during the non-heating periods. During the heating period, the space heating is provided for all rooms during the entire day for Beijing, 73 while it is only provided when the occupants are present in Bedroom A (the living room) for Shanghai.77,78 The walls between the studied apartments and the neighbourhood apartments were assumed to be adiabatic. TARP and DOE-2 were used for the interior and exterior surface convections, respectively.79–81 Natural ventilation with fresh air supply through openings in the building façade was present, which was assumed to be relatively constant in practice, and therefore in the simulations, constant average ventilation rates were imposed with 0.6 h−1 for Beijing and 1.0 h−1 for Shanghai for the bedrooms.76,82 Moreover, a mechanical ventilation rate of 450 m3/h was provided for the kitchen during cooking only. 83 The infiltration rate was set to 0.645 h−1 for all of the rooms and the roof attic, which was an average of values found in two publications for Beijing84,85 and it was assumed the same for Shanghai. Ground reflectivity values were set to 0.2 for all 12 months. Monthly average ground temperatures at 0.5 m depth from the IWEC weather files for Beijing and Shanghai were used.42,50
Indoor thermal comfort evaluation
Overheating hours
The indoor thermal conditions in the studied apartments were evaluated based on the Chinese standard, GB/T 50785-2012, 41 adaptive thermal comfort models for free running civil buildings in the Chinese cold climate zone (e.g. Beijing) and the Chinese hot summer and cold winter climate zone (e.g. Shanghai).
The selected thermal comfort models use the running mean outdoor temperature (T
rm
), which was calculated using equation (1)
41
Category II of the Chinese standard GB/T 50785-2012
41
corresponding to 75%–90% acceptability
40
was used to determine the occupants’ thermal comfort upper threshold, that is, the upper limit (T
upper
) of the indoor operative temperature (T
o
).
66
In the Chinese cold climate zone (e.g. Beijing), the upper threshold of Category II was calculated using equation (2)
41

In the Chinese hot summer and cold winter climate zone (e.g. Shanghai), the upper threshold of Category II was calculated using equation (3)
41

In the studied apartments, an overheating hour was recorded when the indoor operative temperature T o is higher than the upper limit T upper .
Degree hours
The number of degree hours was selected as the other thermal comfort indicator for an indication of the degree of overheating based on the operative temperature (T
o
) and the upper limit (T
upper
). Degree hours (dhr) was calculated by equation (4). The degree hours are only included, when T
o
> T
upper

Results
The simulation results for Beijing and Shanghai are presented below in two sections, followed by a discussion on the results and a comparison with results from the literature.
Beijing
Effect of climate change on indoor overheating
This section presents the effect of climate change on indoor overheating by comparing the number of overheating hours and degree hours in Bedroom A and Bedroom B in the typical year and 2050 in Beijing based on bedroom windows oriented towards the south. Compared to the typical year, an increase in the number of overheating hours was illustrated by the model from 1922 to 3042 (+58%) and an increase in the number of degree hours was also shown from 2222 to 8667 (+290%) in 2050 in Bedroom A on the first floor (Figure 4(a) and (b)). The number of overheating hours was increased from 1858 to 2979 (+60%) and the number of degree hours was increased from 1878 to 8177 (+335%) in 2050 in bedroom B on the first floor (Figure 4(c) and (d)). Number of overheating hours and degree hours on the first floor in Beijing in Bedroom A in (a) the typical year and in (b) 2050, and in Bedroom B in (c) the typical year and in (d) 2050. Windows of the bedrooms are oriented towards the south. In each graph, the dots represent hourly indoor operative temperatures during the non-heating period and the black solid line represents the upper limit of the thermal comfort threshold.
41
The number of overheating hours and degree hours is shown in the bar chart in each subgraph.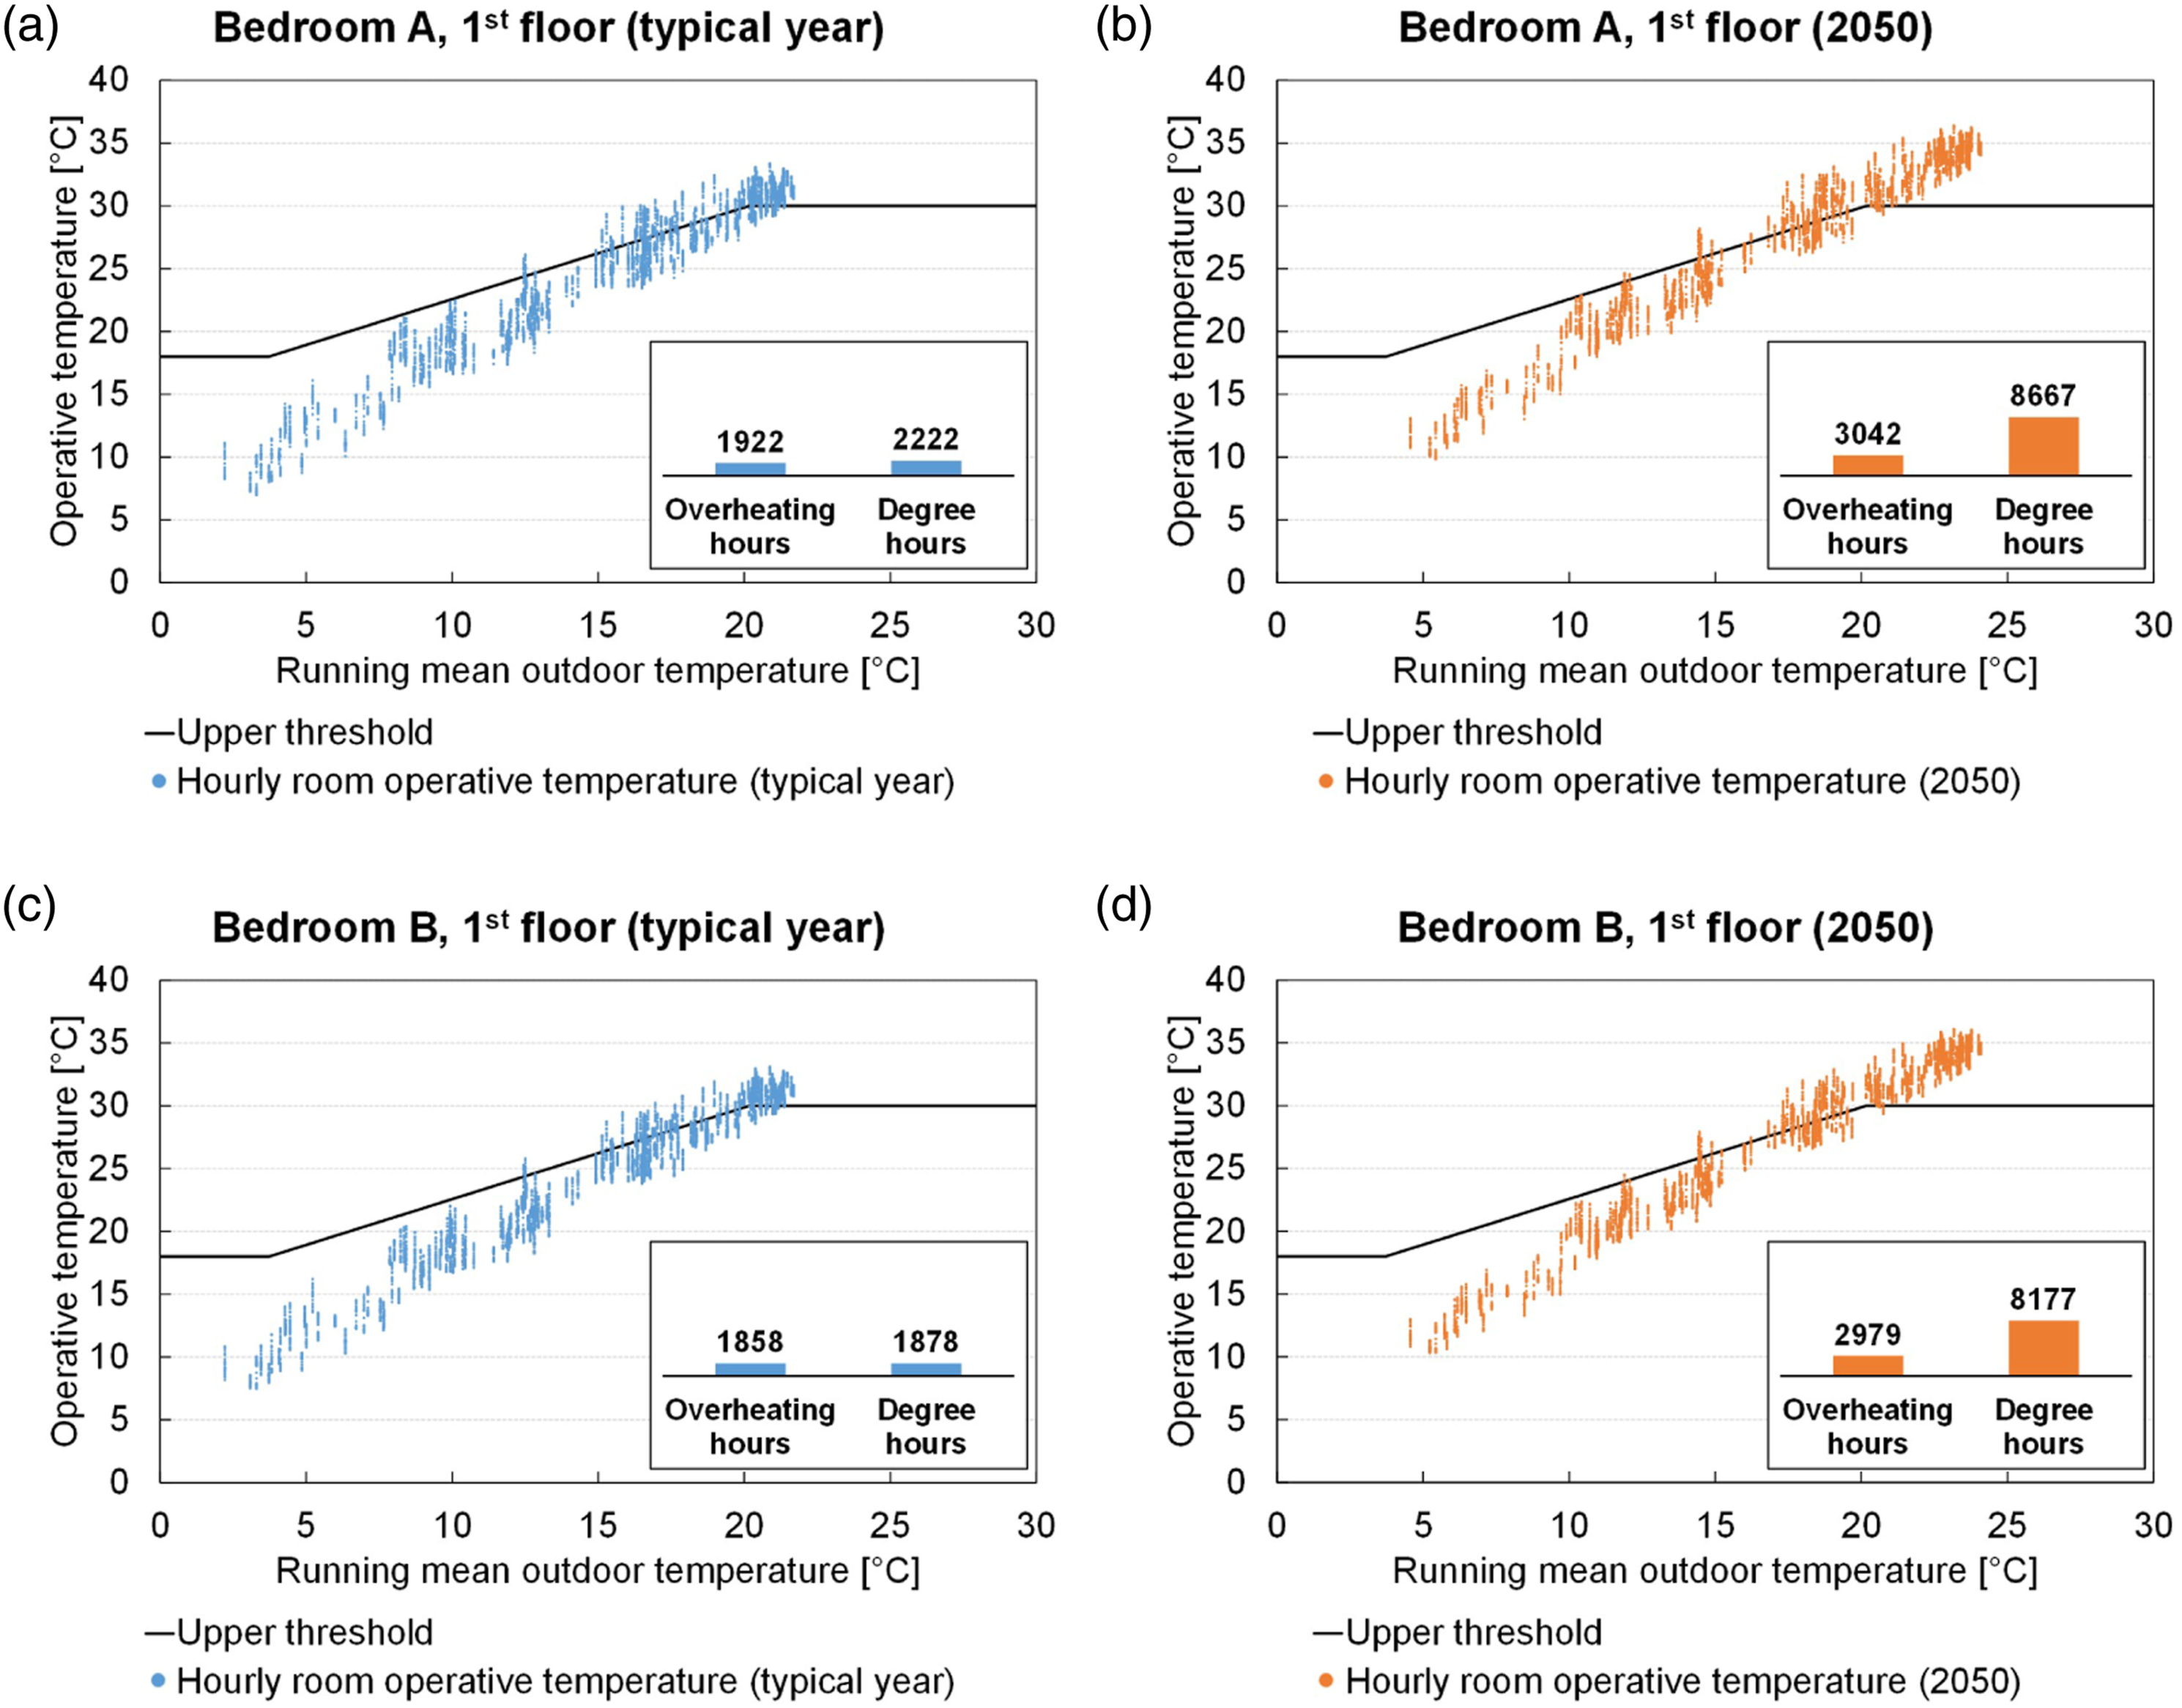
The increase in the number of overheating hours and degree hours from the typical year to 2050 can also be observed in both Bedroom A and Bedroom B on the second floor (detailed numbers are not presented here for the sake of brevity). The reason for the increase in 2050 is the elevated air temperature in each month in 2050 compared to the typical year.
Effect of apartment location on indoor overheating
In this section, the number of overheating hours and degree hours in Bedroom A and in Bedroom B on the first and on the second floor were compared to study the effect of apartment location on indoor overheating, and the analysis, as in the previous section, was based on an orientation in which the bedroom windows are oriented towards the south. Figure 5 shows increases in the number of overheating hours in Bedroom A from 1922 to 2066 (+7%) and increases in the number of degree hours from 2222 to 2841 (+28%) when the bedroom is located on the second floor in the typical year (Figure 5(a) and (b)). Similarly, in Bedroom B, increases in the number of overheating hours from 1858 to 2006 (+8%) and the number of degree hours from 1878 to 2630 (+40%) were found when the bedroom is located on the second floor in the typical year (Figure 5(c) and (d)). Number of overheating hours and degree hours in Bedroom A on (a) the first floor and on (b) the second floor, and in Bedroom B on (c) the first floor and on (d) the second floor in the typical year in Beijing. Windows of the bedrooms are oriented towards the south. In each graph, the dots represent hourly indoor operative temperatures during the non-heating period and the black solid line represents the thermal comfort upper threshold.
41
The number of overheating hours and degree hours is shown in the bar chart in each subgraph.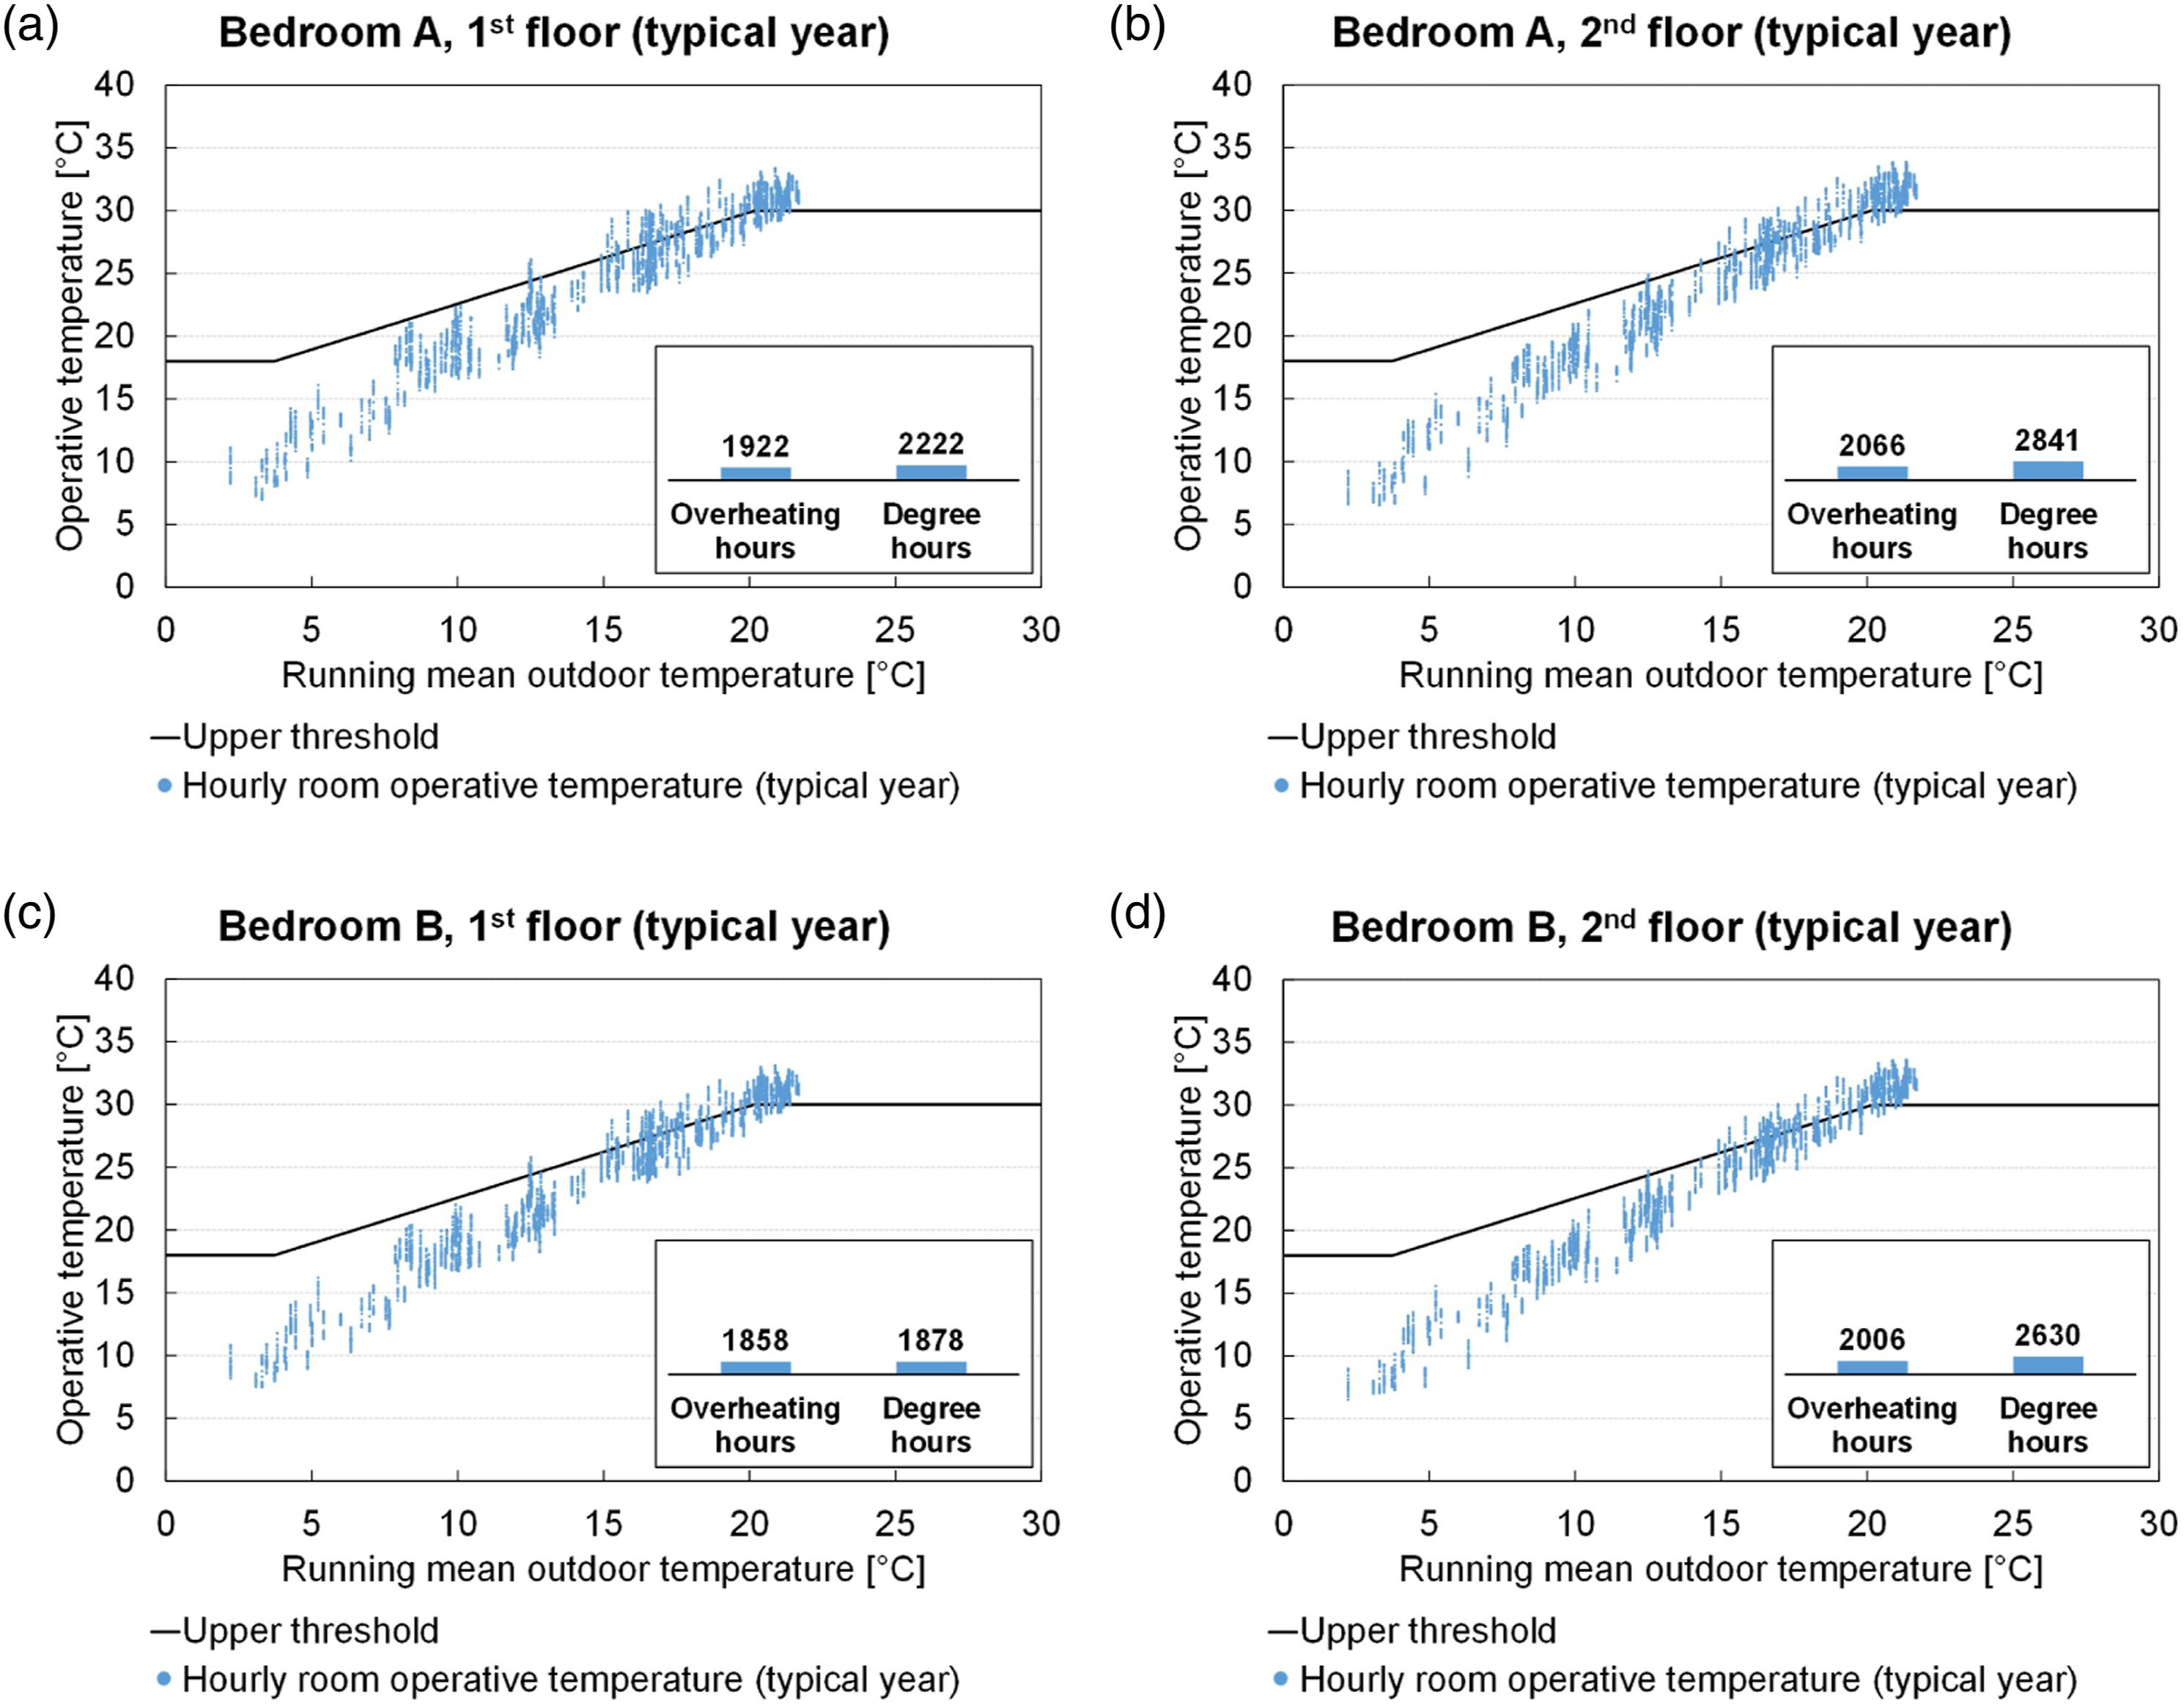
Similar increasing trends can also be observed in the bedrooms in 2050; however, the detailed numbers are not presented here for the sake of brevity. The increased number of overheating hours and degree hours is caused by the higher air temperature in the attic due to solar radiation on the roof surface resulting in an additional heat gain in the apartment on the second floor, which is directly located underneath the attic.
Effect of building orientation on indoor overheating
The results presented in the previous sections only consider an orientation with the bedroom windows oriented towards the south. Therefore, this section presents an analysis of the effect of eight different orientations (bedroom windows orientated towards the south (S), southwest (SW), west (W), northwest (NW), north (N), northeast (NE), east (E) and southeast (SE)) on the number of overheating hours and degree hours as indicated in Figure 6. The largest and smallest number of overheating hours and degree hours were compared to the average over the eight orientations and the percentage differences are reported in the text below. Numbers of (a) overheating hours and (b) degree hours in Bedroom A, and the numbers of (c) overheating hours and (d) degree hours in Bedroom B in the typical year and 2050 with eight different orientations of an apartment in Beijing.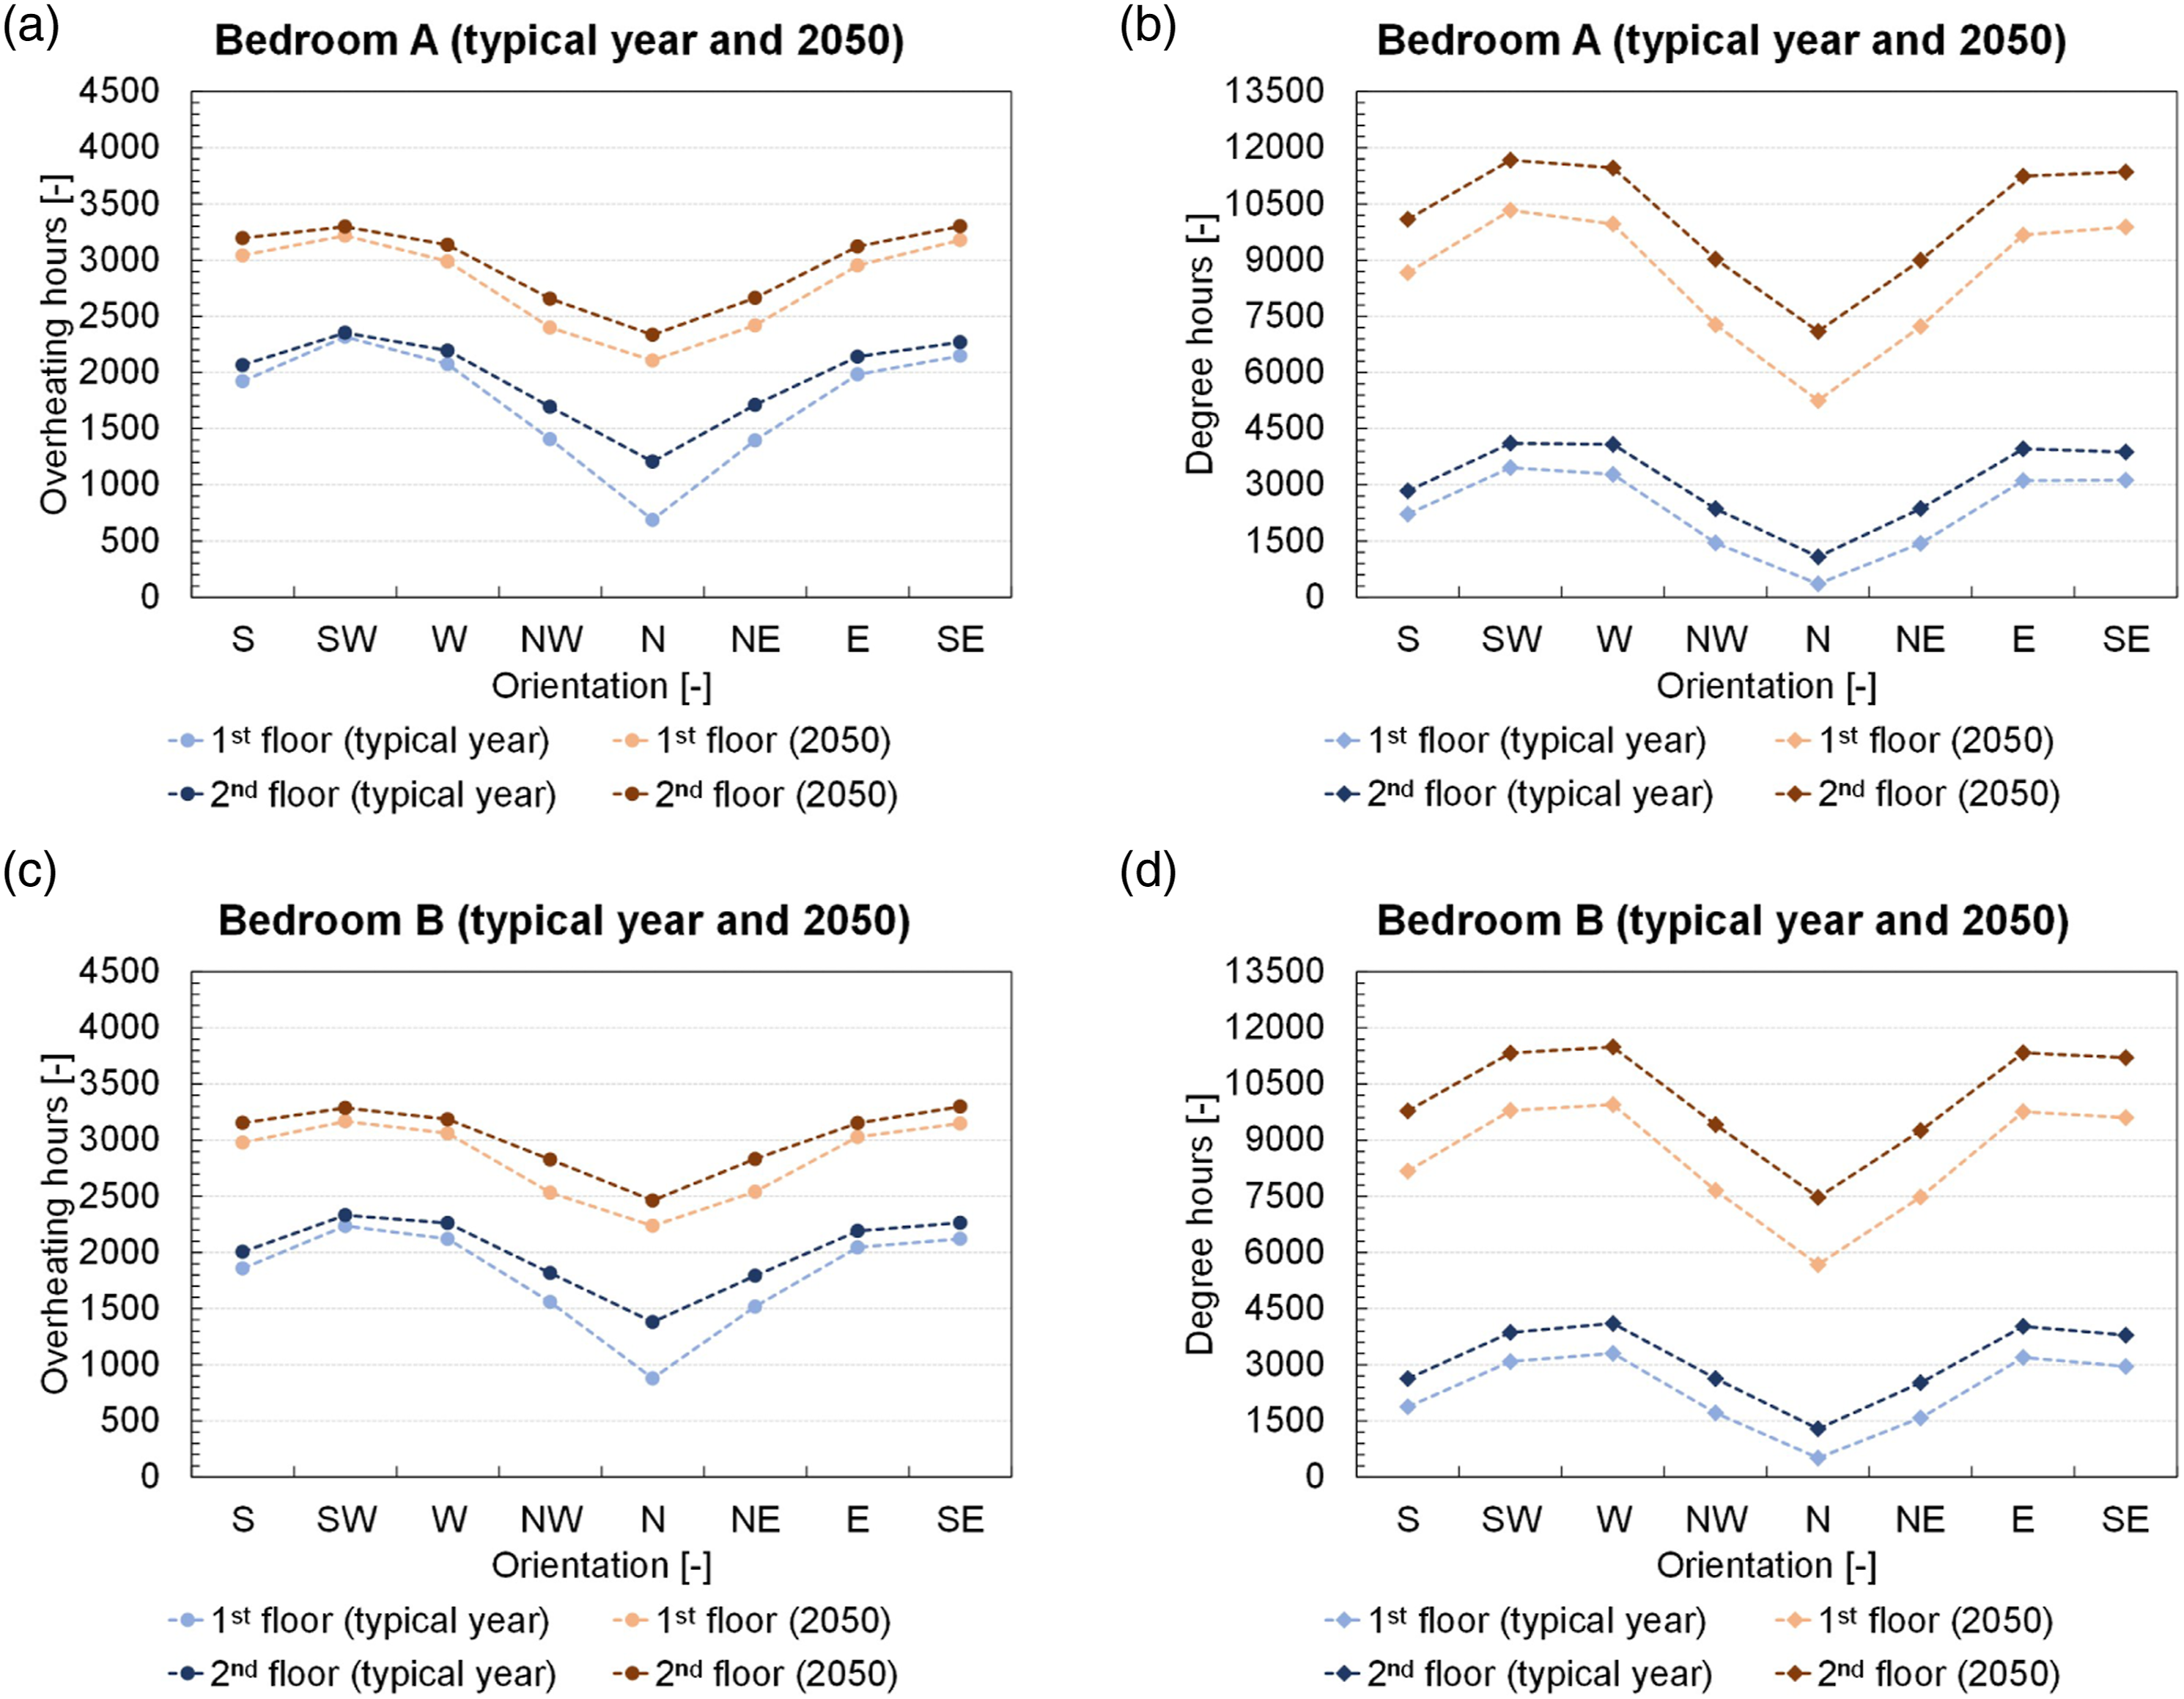
In the typical year, in Bedroom A on the first floor, the largest number of overheating hours (2318, +33%) and degree hours (3462, +50%) occurs when the bedroom window is oriented towards SW, while the smallest number of overheating hours (689, −60%) and degree hours (358, −84%) occurs, as to be expected, when it is oriented towards N (Figure 6(a) and (b)). In Bedroom B on the first floor, the largest number of overheating hours (2236, +25%) occurs when the bedroom window is oriented towards SW, and the largest number of degree hours (3305, +45%) occurs when the bedroom window is oriented towards W. The smallest number of overheating hours (879, −51%) and degree hours (511, −78%) occurs again when it is oriented towards N (Figure 6(c) and (d)). Bedroom A and Bedroom B on the second floor show similar results with respect to the largest and smallest number of overheating hours and degree hours (Figure 6).
In 2050, the orientations with the largest and smallest number of overheating hours and degree hours in Bedroom A and Bedroom B on the first floor are the same as in the typical year (Figure 6). Bedroom A and Bedroom B on the second floor show the same orientations with the largest and smallest number of overheating hours and degree hours as on the first floor in 2050, except for the largest number of overheating hours, which occurs when the bedroom windows are oriented towards SE (Figure 6).
In addition, for each orientation, and on average, a larger number of overheating hours and degree hours in a bedroom is present in 2050 than in the typical year, and the number of hours is larger on the second floor than on the first floor. For example, in Bedroom A on the first floor, the average number of overheating hours will be increased from 1742 in the typical year to 2788 (+60%) in 2050, and the average number of degree hours will be increased from 2308 in the typical year to 8536 (+270%) in 2050. For Bedroom A in the typical year, the average number of overheating hours will be increased from 1742 on the first floor to 1955 (+12%) on the second floor, and the average number of degree hours will be increased from 2308 on the first floor to 3086 (+34%) on the second floor.
Shanghai
Effect of climate change on indoor overheating
Figure 7 shows the number of overheating hours and degree hours in Bedroom A and Bedroom B with the bedroom windows oriented towards the south in the typical year and in 2050 in Shanghai. An increase in the number of overheating hours and degree hours in 2050 compared to in the typical year was illustrated in Bedroom A and in Bedroom B, irrespective of the studied floor level. Number of overheating hours and degree hours on the first floor in Shanghai in Bedroom A in (a) the typical year and in (b) 2050, and in Bedroom B in (c) the typical year and in (d) 2050. Windows of the bedrooms are oriented towards the south. In each graph, the dots represent hourly indoor operative temperatures during the non-heating period and the black solid line represents the upper limit of the thermal comfort threshold.
41
The number of overheating hours and degree hours is shown in the bar chart in each subgraph.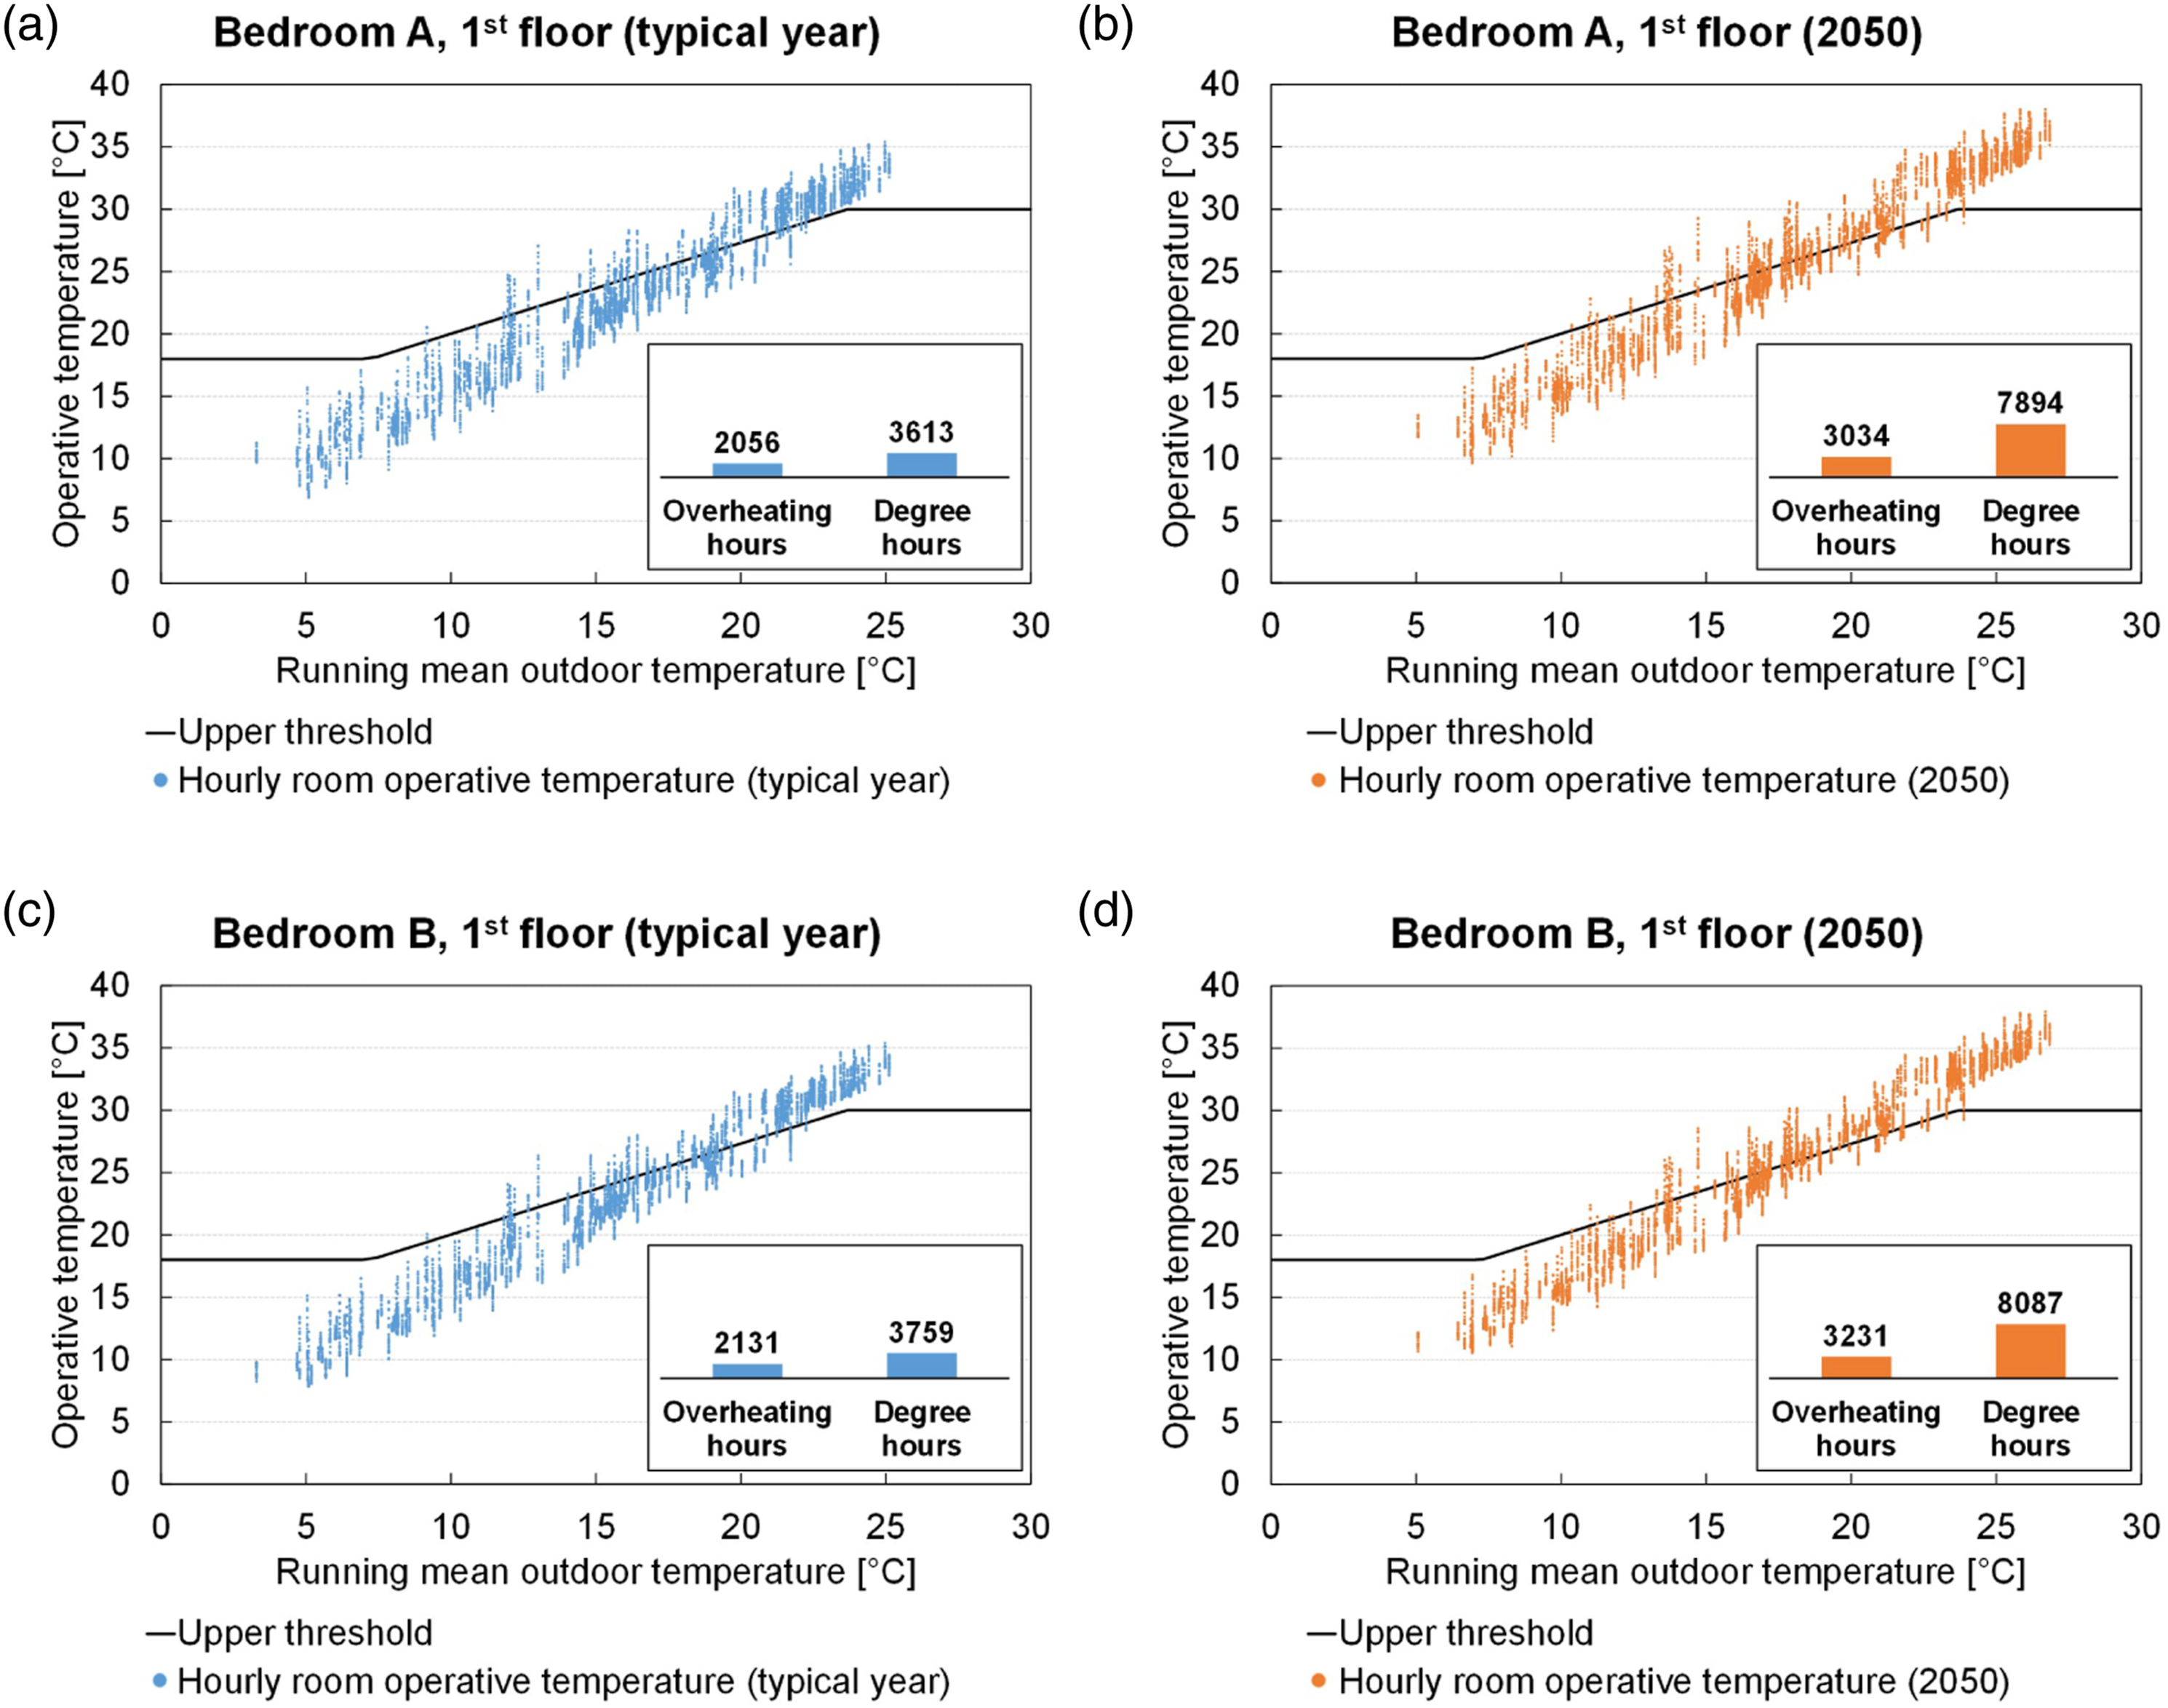
For Bedroom A on the first floor, the number of overheating hours was illustrated to have increased from 2056 in the typical year to 3034 (+48%) in 2050, and an increase in the number of degree hours from 3613 in the typical year to 7894 (+118%) in 2050 was also shown by the model (Figure 7(a) and (b)). For Bedroom B on the first floor, an increase in the number of overheating hours was illustrated by the model, from 2131 in the typical year to 3231 (+52%) in 2050, and the number of degree hours will be increased from 3759 in the typical year to 8087 (+115%) in 2050 (Figure 7(c) and (d)).
A larger number of overheating hours and degree hours is predicted in 2050 in comparison to the typical year is present in Bedroom A and Bedroom B on the second floor as well (detailed numbers are not presented here for the sake of brevity). The increase in 2050 can be explained by the higher ambient air temperatures in 2050, as was the case for Beijing.
Effect of apartment location on indoor overheating
This section presents a comparison of the predicted results for Bedrooms A and B on the second floor with those for the bedrooms on the first floor. In all cases, the bedroom windows are oriented towards the south. For Bedroom A in the typical year, the number of overheating hours was predicted to have increased from 2056 on the first floor compared to 2248 (+9%) on the second floor. The number of degree hours was predicted to have increased from 3613 on the first floor compared to 4873 (+35%) on the second floor (Figure 8(a) and (b)). For Bedroom B in the typical year, the number of overheating hours was predicted to have increased from 2131 on the first floor compared to 2318 (+9%) on the second floor. The number of degree hours was predicted to have increased from 3759 on the first floor compared to 5049 (+34%) on the second floor (Figure 8(c) and (d)). Number of overheating hours and degree hours predicted for Bedroom A on (a) the first floor and on (b) the second floor, and for Bedroom B on (c) the first floor and on (d) the second floor in the typical year in Shanghai. Windows of the bedrooms are oriented towards the south. In each graph, the dots represent hourly indoor operative temperatures during the non-heating period and the black solid line represents the thermal comfort upper threshold.
41
The number of overheating hours and degree hours is shown in the bar chart in each subgraph.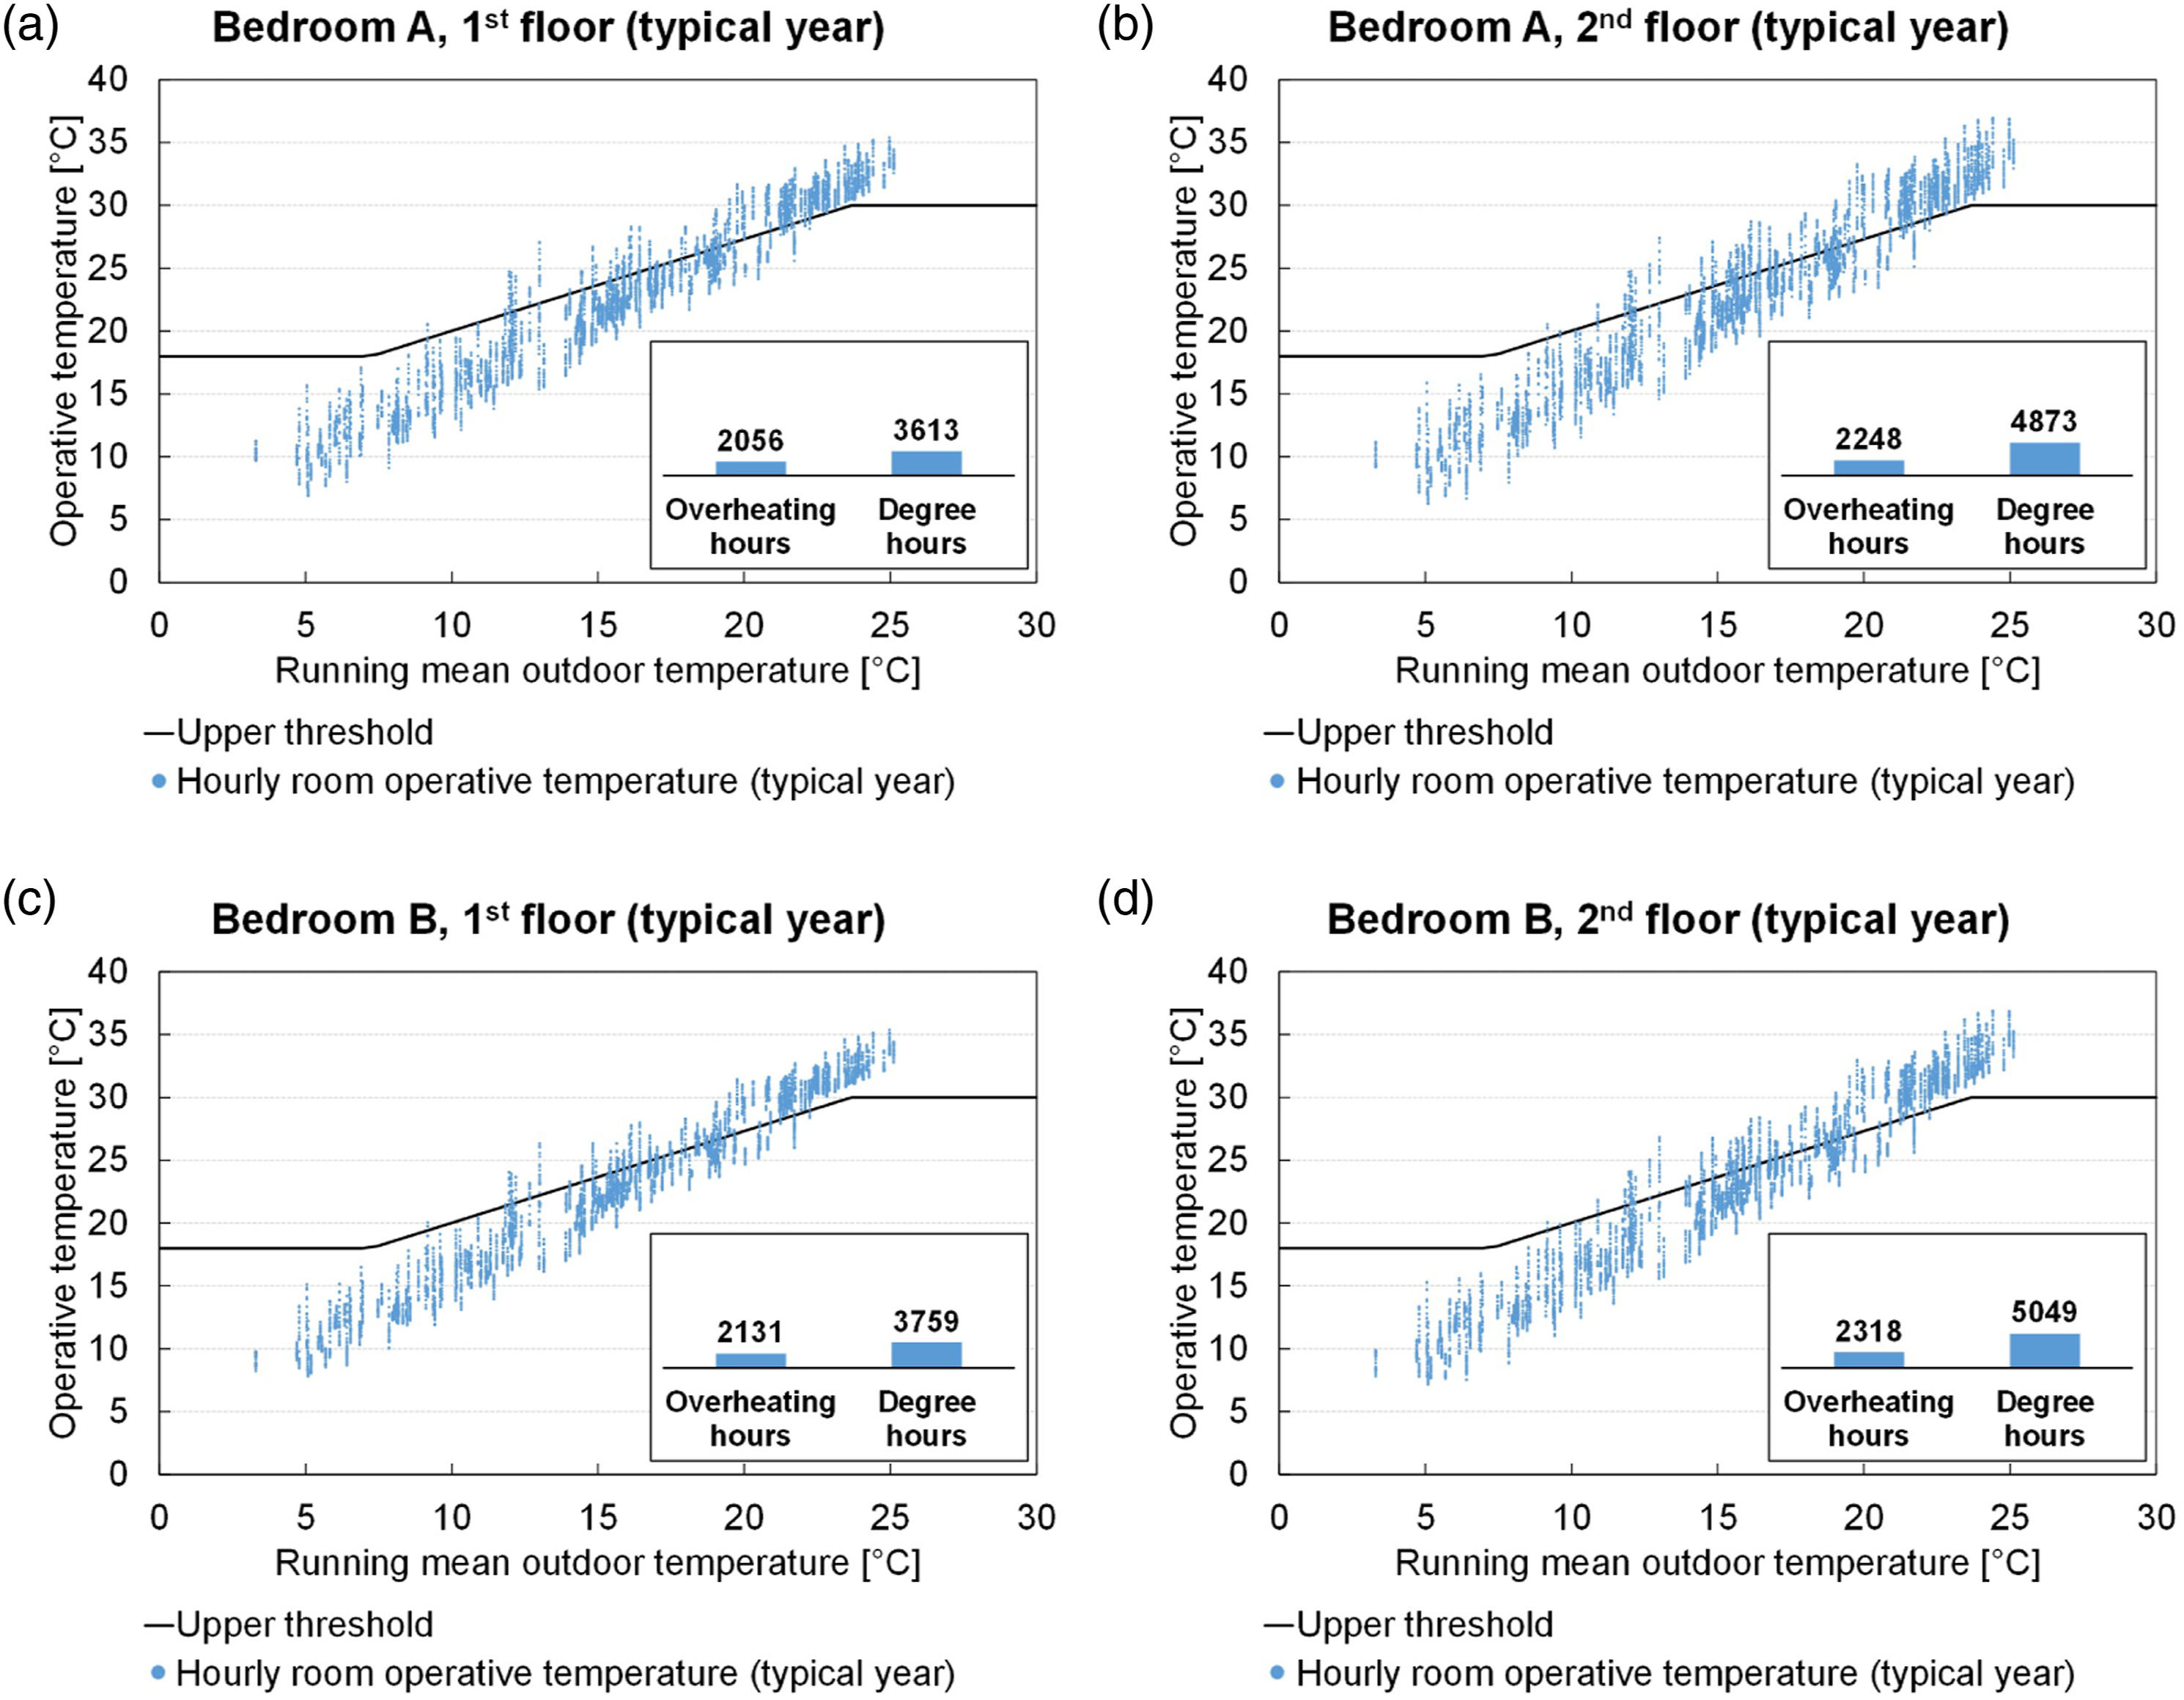
Similar increasing trends are illustrated by the model for 2050. However, the detailed numbers are not presented here for the sake of brevity. Again, the additional heat gain in the apartment on the second floor can be explained by the increased air temperature caused by heat gain in the adjacent attic due to solar radiation on the roof.
Effect of building orientation on indoor overheating
The effect of eight different orientations on the number of overheating hours and degree hours is presented in Figure 9. The largest and smallest number of overheating hours and degree hours and their percentage differences from the average over the eight orientations are reported in the text below. Numbers of (a) overheating hours and (b) degree hours in Bedroom A, and the numbers of (c) overheating hours and (d) degree hours in Bedroom B, predicted in the typical year and in 2050 for the eight different orientations in Shanghai.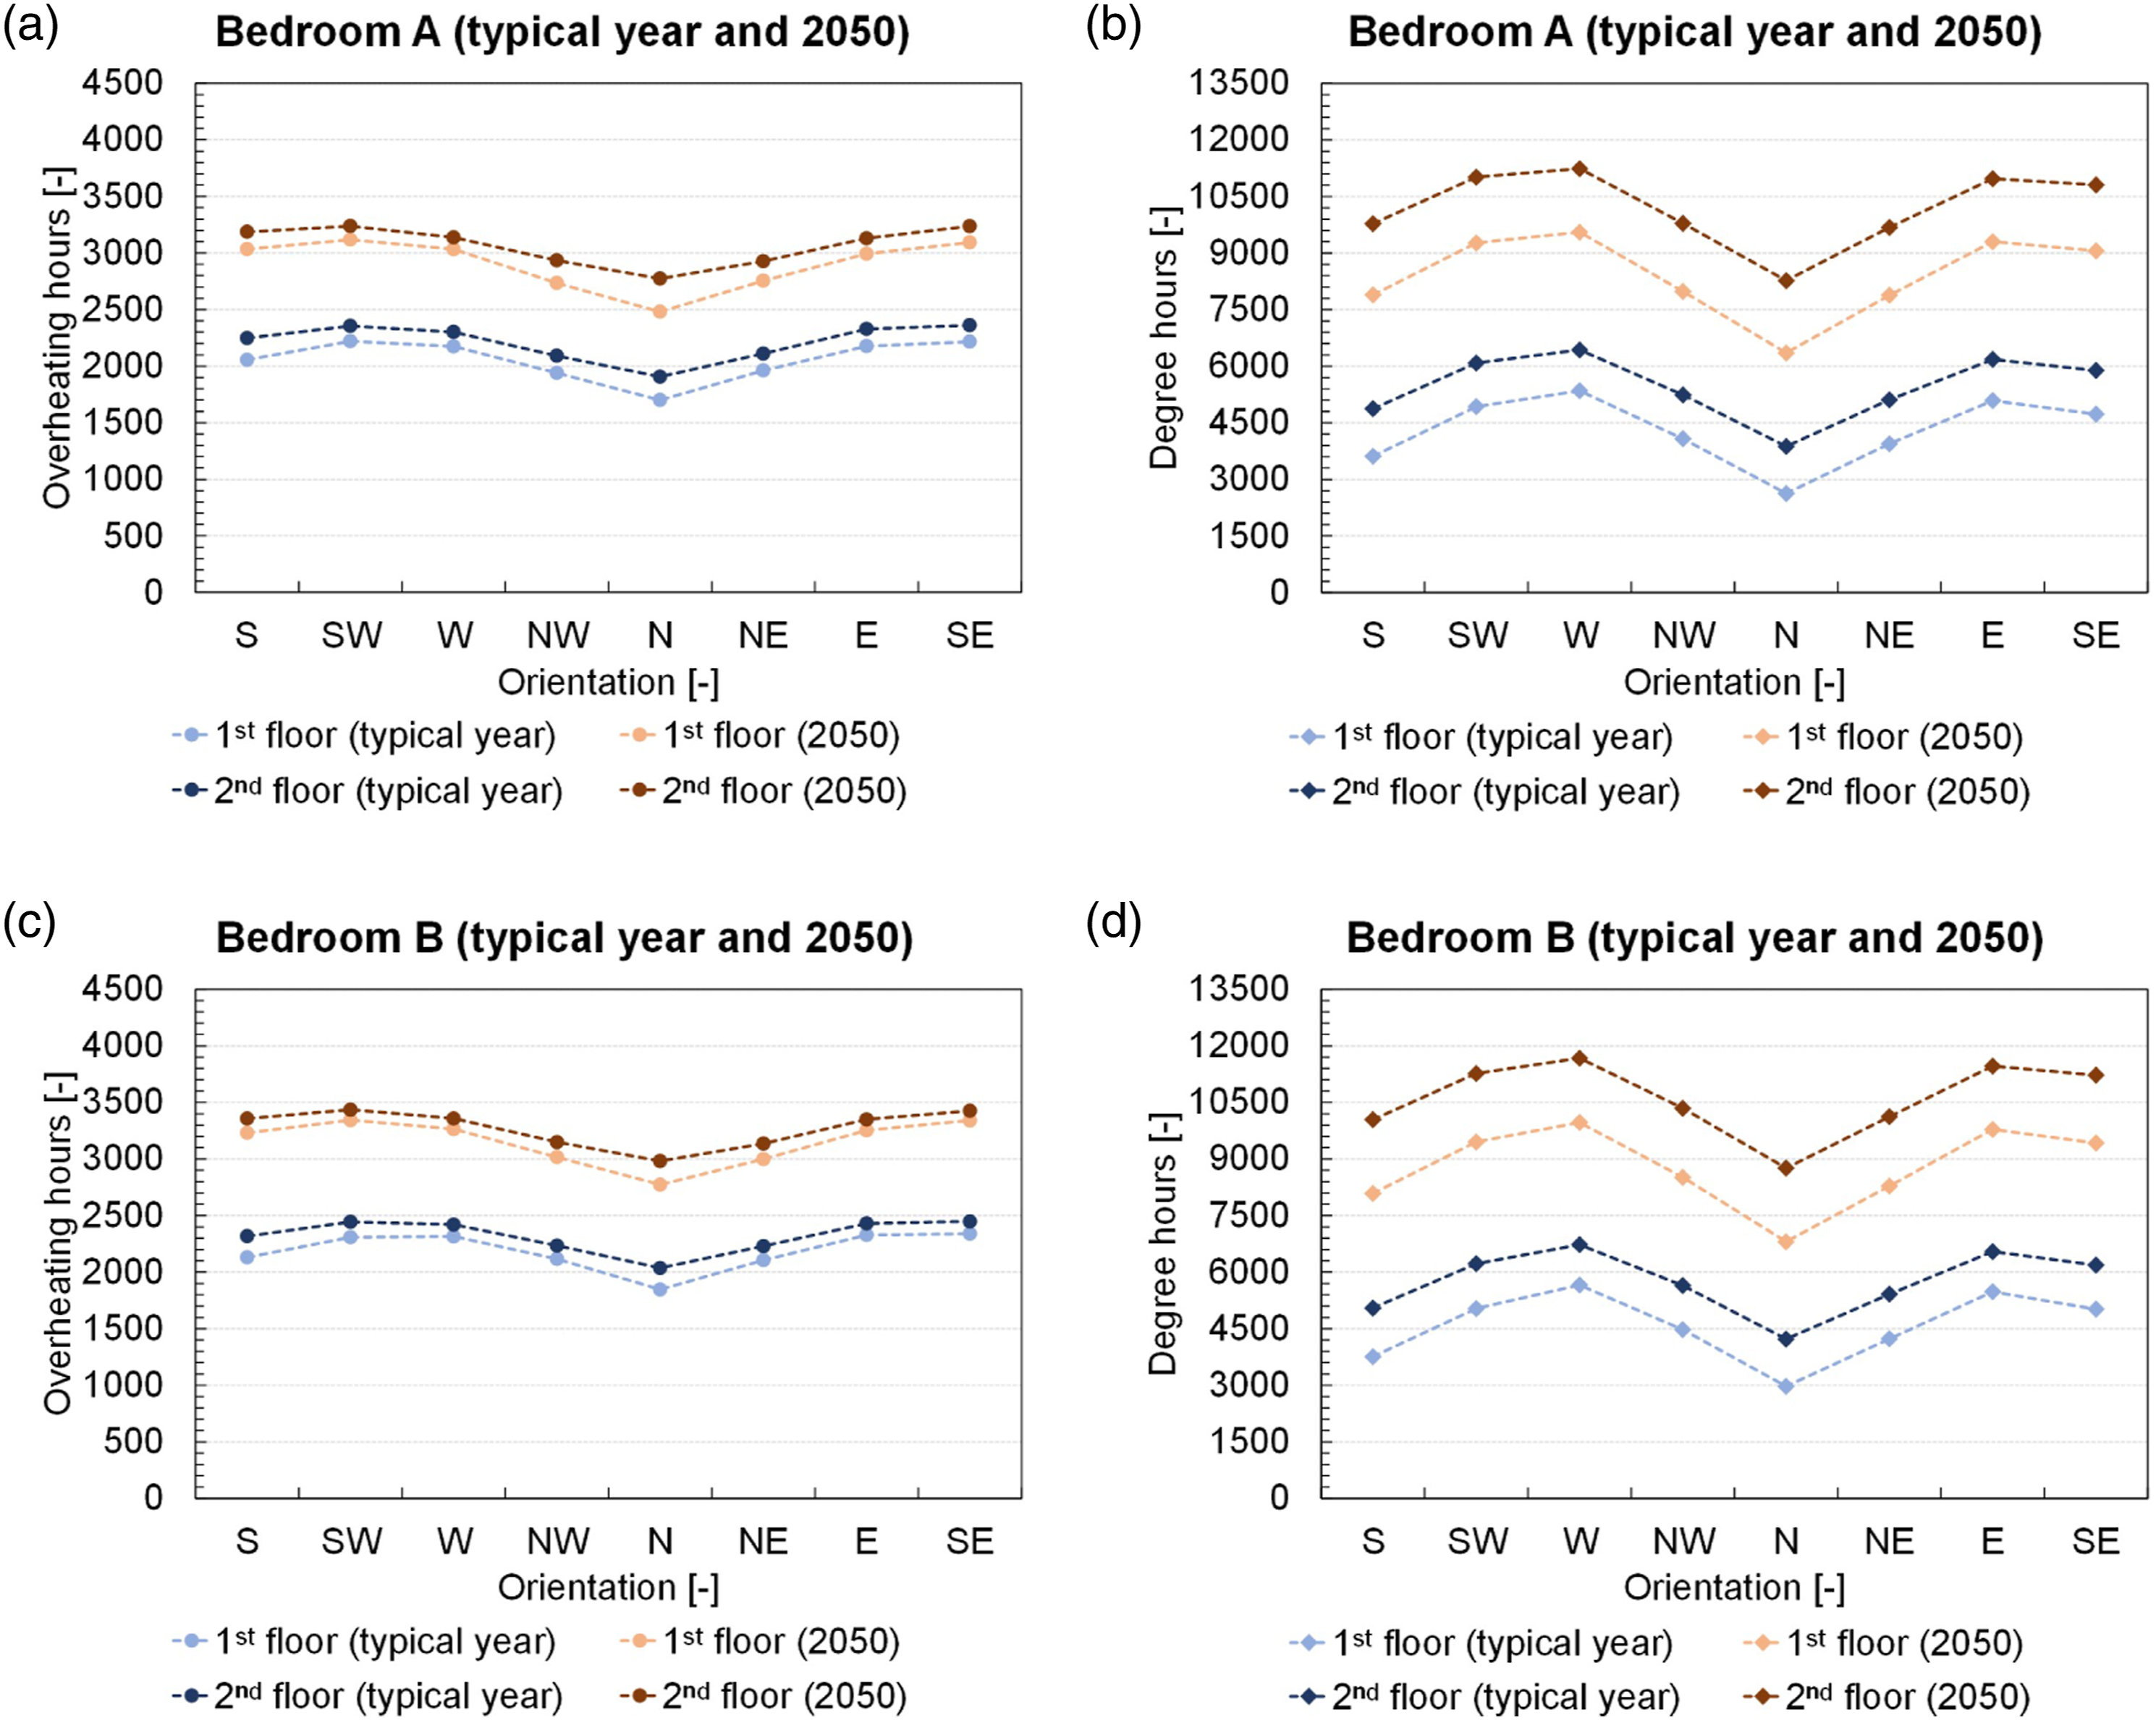
In the typical year, in Bedroom A on the first floor, the largest number of overheating hours (2221, +8%) occurs when the bedroom window is oriented towards SW, while the largest number of degree hours (5350, +25%) occurs when the bedroom window is oriented towards W. As expected, the smallest number of overheating hours (1700, −17%) and degree hours (2628, −39%) occurs when it is oriented towards N (Figure 9(a) and (b)). In Bedroom B on the first floor, the largest number of overheating hours (2340, +7%) occurs when the bedroom window is oriented towards SE, while the largest number of degree hours (5660, +24%) occurs when the bedroom window is oriented towards W. The smallest number of overheating hours (1847, −16%) and degree hours (2973, −35%) again occurs when it is oriented towards N (Figure 9(c) and (d)). Bedroom A and Bedroom B on the second floor show similar results with respect to the largest and smallest number of overheating hours and degree hours as on the first floor, except for the largest number of overheating hours for Bedroom A on the second floor, which occurs when the bedroom window is oriented towards SE (Figure 9).
In 2050, the largest number of overheating hours and degree hours occurs in Bedroom A and Bedroom B, when the bedroom windows are oriented towards SW and W, respectively, while the smallest number of overheating hours and degree hours occurs when they are oriented towards N, irrespective of the floor at which the apartment is located (Figure 9).
Results in Shanghai show similar increasing trends as the results in Beijing showing the larger numbers of overheating hours and degree hours for each orientation and on average in bedrooms in 2050 and on the second floor.
Discussion of results
Climate change
The numbers of overheating hours and degree hours for each studied orientation and on average over the eight orientations are significantly larger in 2050 than in the typical year in a bedroom in Beijing and in Shanghai. Since the monthly average hourly solar radiation is similar in the typical year and in 2050, the predicted increases in air temperature for each month in 2050 compared to the typical year in Beijing and Shanghai (see the Weather Data section) are the main reason for the increasing number of overheating hours and degree hours in 2050.
Apartment location
The results indicate that the numbers of overheating hours and degree hours for each studied orientation and on average over the eight orientations in a bedroom on the second floor are larger than on the first floor, irrespective of the studied climate scenario and climate zone. This difference can be caused by the heat transfer from the attic to the room below the attic. Solar radiation on the roof surface can lead to higher air temperatures in the attic, and due to the very limited thermal resistance of the ceiling between the attic and the apartment, this can result in an increased air temperature in the apartment on the second floor.
Building orientation
For all the studied bedrooms, irrespective of climate zone and climate scenario, the largest numbers of overheating hours occur when the bedroom windows are oriented towards SW or SE. The similar solar elevation angle resulting in the comparable solar heat gain 86 could be a reason that these two orientations result in the largest number of overheating hours. The largest numbers of degree hours, however, occur in the cases in which the windows of studied bedrooms are oriented towards the western side (SW or W). This can be attributed to higher air temperatures in the afternoon, in addition to the heat gain by solar radiation through the window. The smallest numbers of overheating hours and degree hours occur when the bedroom windows are oriented towards N, as to be expected, since this is the orientation with the lowest solar heat gain through the windows.
Comparison of overheating results
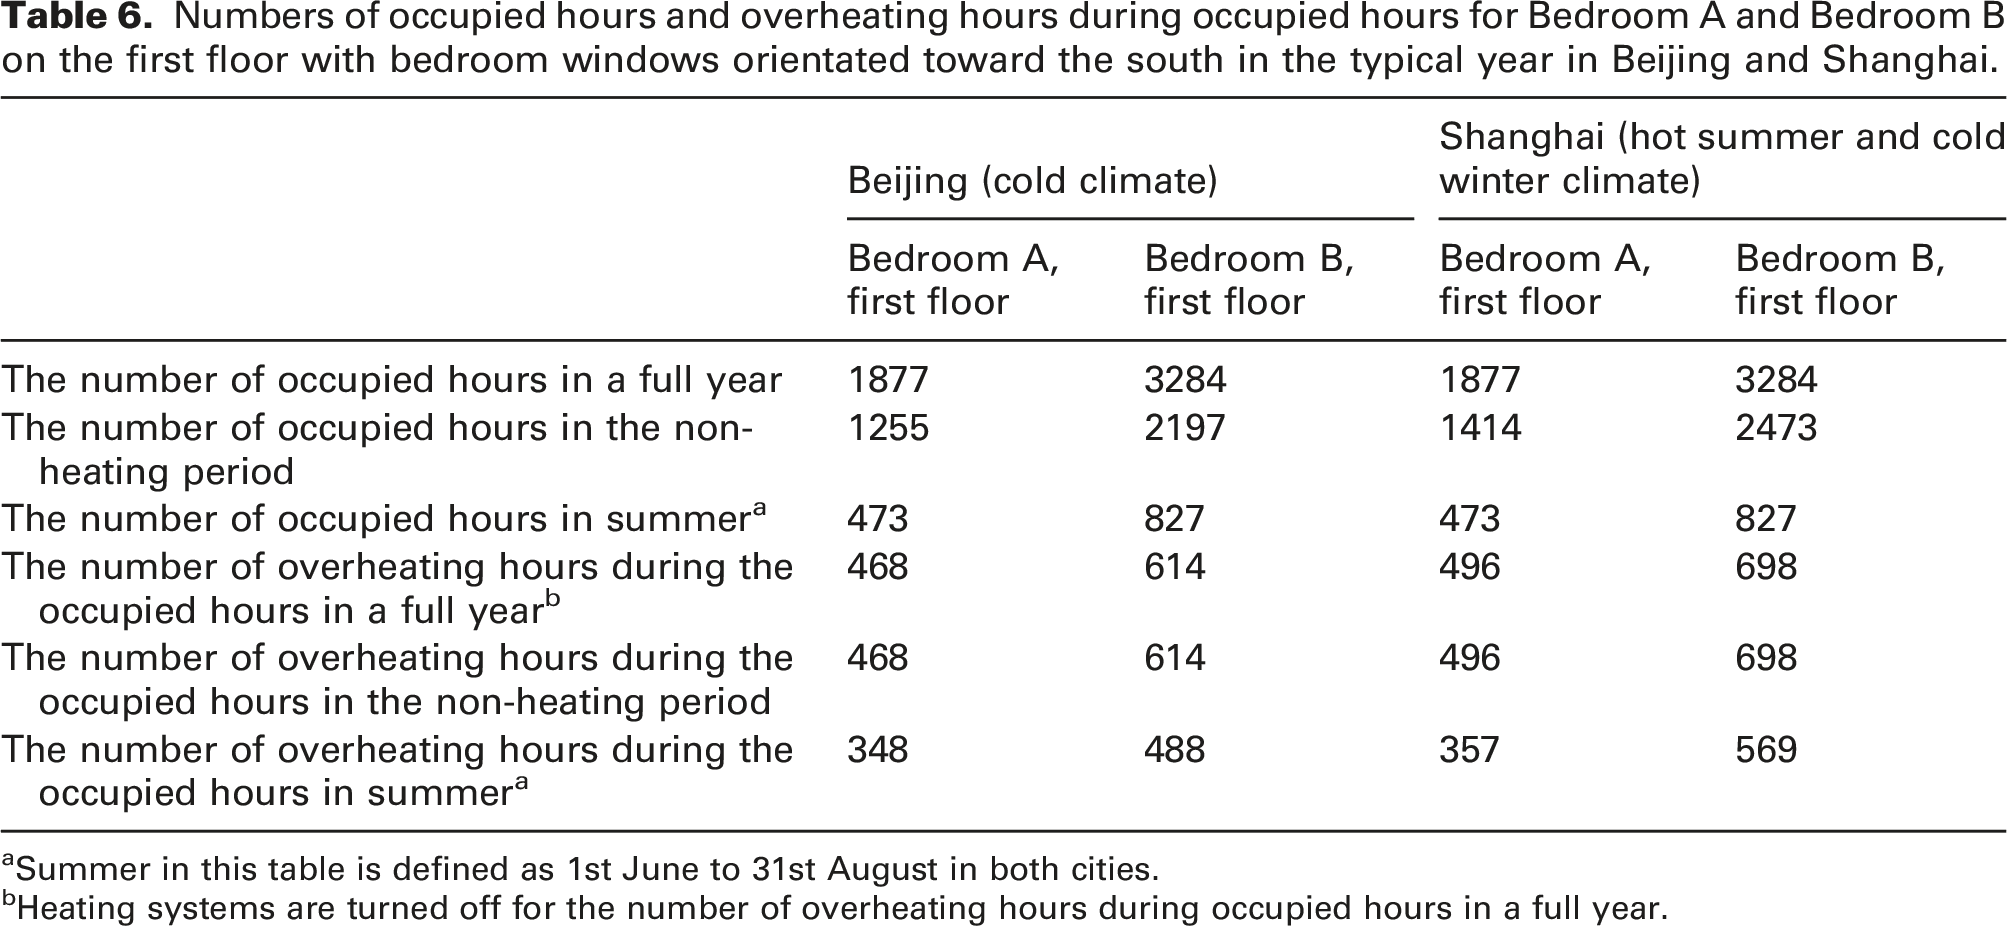
Whereas the heating systems were active in the previous analyses, the heating systems are turned off if the overheating results are reported for a full year to allow a fair comparison with results identified from literature (with similar thermal properties of the building envelope). The percentages as shown in Figure 10 were determined from the number of occupied hours and the number of overheating hours during the occupied hours, as summarized in Table 6. The results were considered for the bedrooms on the first floor with bedroom windows orientated towards the south in the typical years (results for the bedrooms on the second floor are not presented here for the sake of brevity). Percentages of overheating hours during occupied hours in Bedroom A and Bedroom B on the first floor with bedroom windows orientated toward the south in the typical year in (a) Beijing and (b) Shanghai. Percentages are based on values from Table 6. Numbers of occupied hours and overheating hours during occupied hours for Bedroom A and Bedroom B on the first floor with bedroom windows orientated toward the south in the typical year in Beijing and Shanghai. aSummer in this table is defined as 1st June to 31st August in both cities. bHeating systems are turned off for the number of overheating hours during occupied hours in a full year.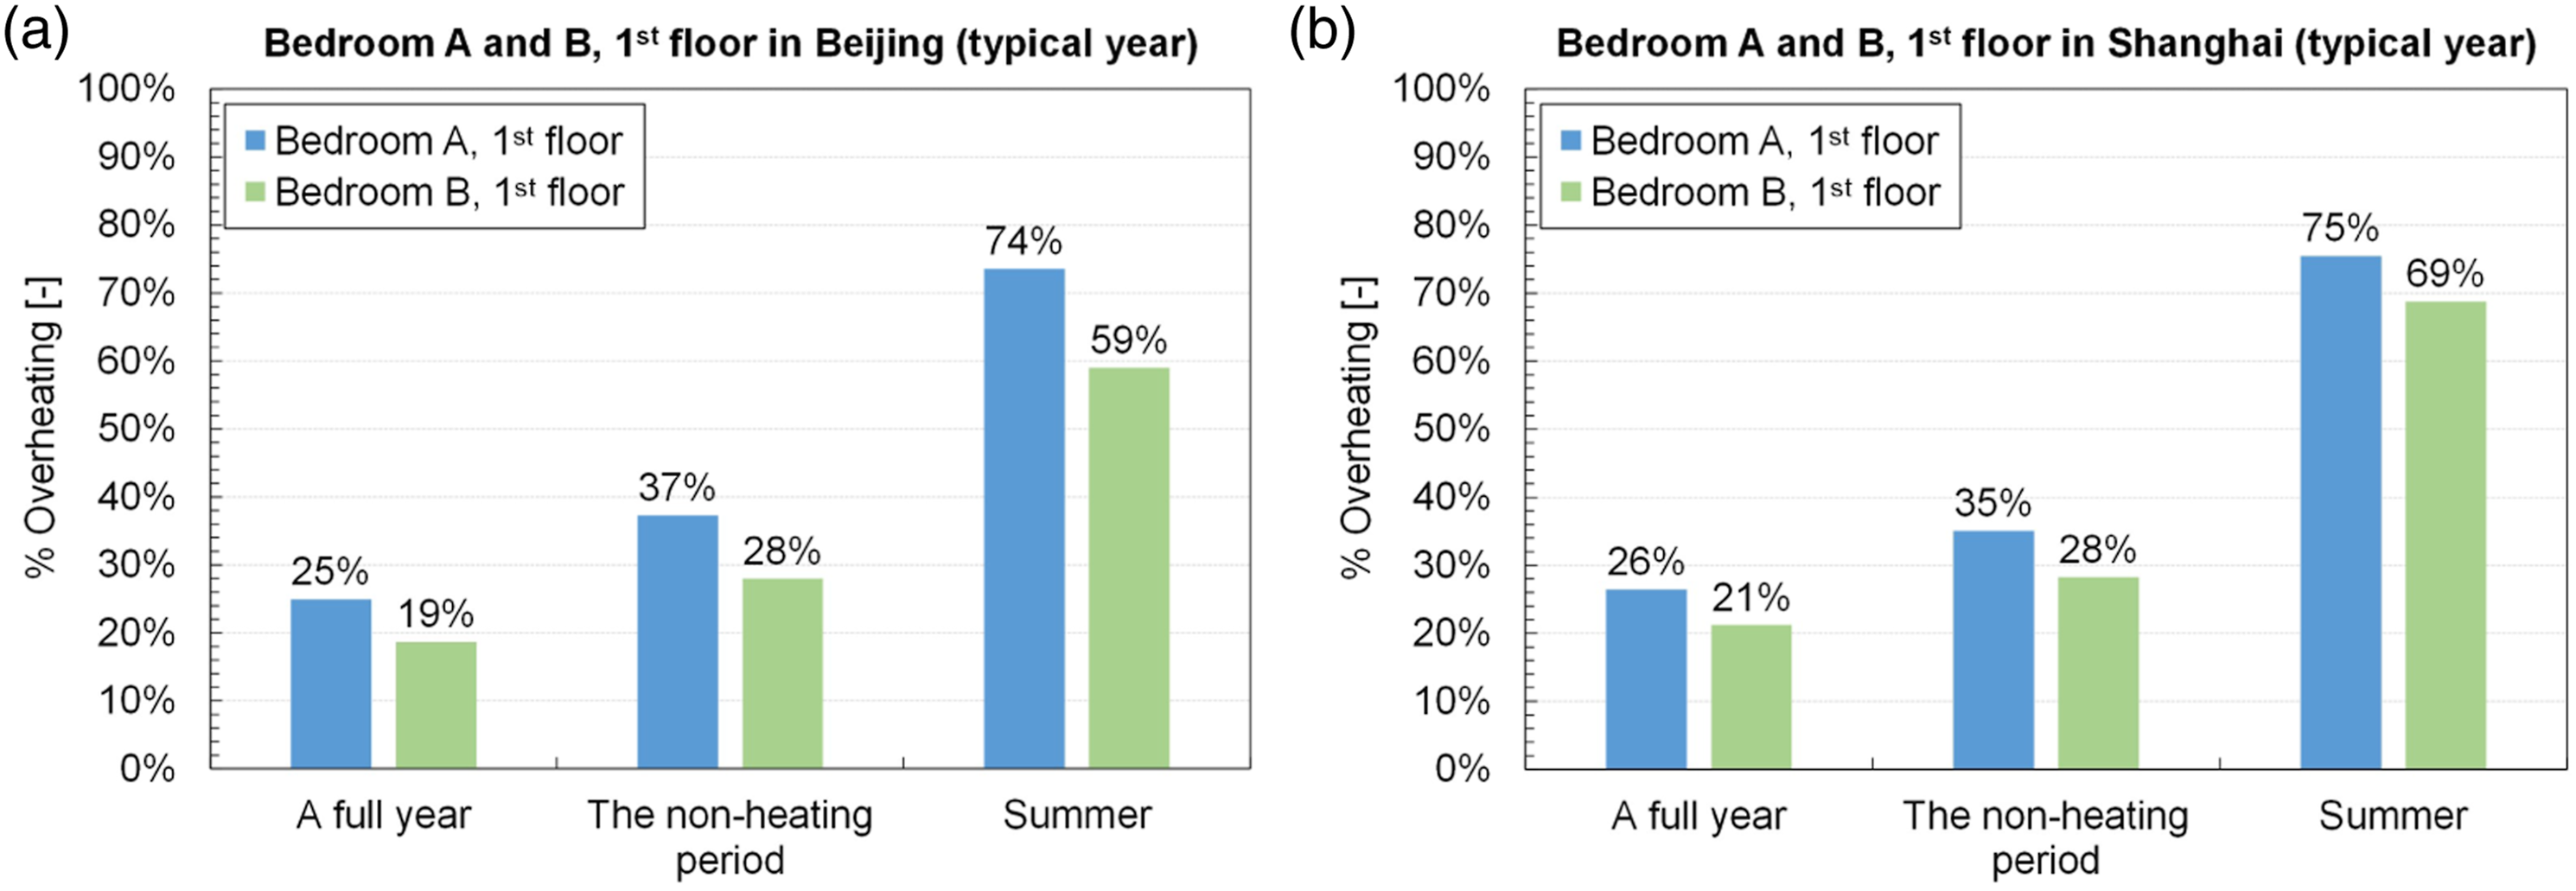
In Beijing, the numbers of overheating hours in a full year from the present study, that is, 1922 and 1858 predicted for Bedroom A and Bedroom B, respectively, are smaller than the 2600–3300 h from the simulation study of Zou and Du
87
(Figure 11(a)). This difference can mainly be explained by the different air flow rate used, that is, 1.25 h−1 air changes per hour (ACH) in the present study and 0.1–0.7 h−1 ACH in the study of Zou and Du.
87
When the simulation of the present study was conducted with ACH values (ACH = 0.1 and 0.7 h−1) similar to those in Zou and Du,
87
the number of overheating hours in the present building would be between 2424 and 3537 with ACH = 0.7 and 0.1 h−1, respectively, which is in very good agreement with the number of overheating hours reported in Zou and Du.
87
In addition, the percentage of overheating during occupied hours in summer predicted by the present study, that is, 74% (see Figure 10(a)) is very similar to 72.7% from the survey reported by Gen and Du
88
(Figure 11(a)). Comparison of the results from the present study with results from the literature for similar cases. (a) Beijing and (b) Shanghai. In (a), the values of 2424 and 3537 are from the adjusted ventilation rates, that is, air changes per hour = 0.7 and 0.1 h−1, respectively.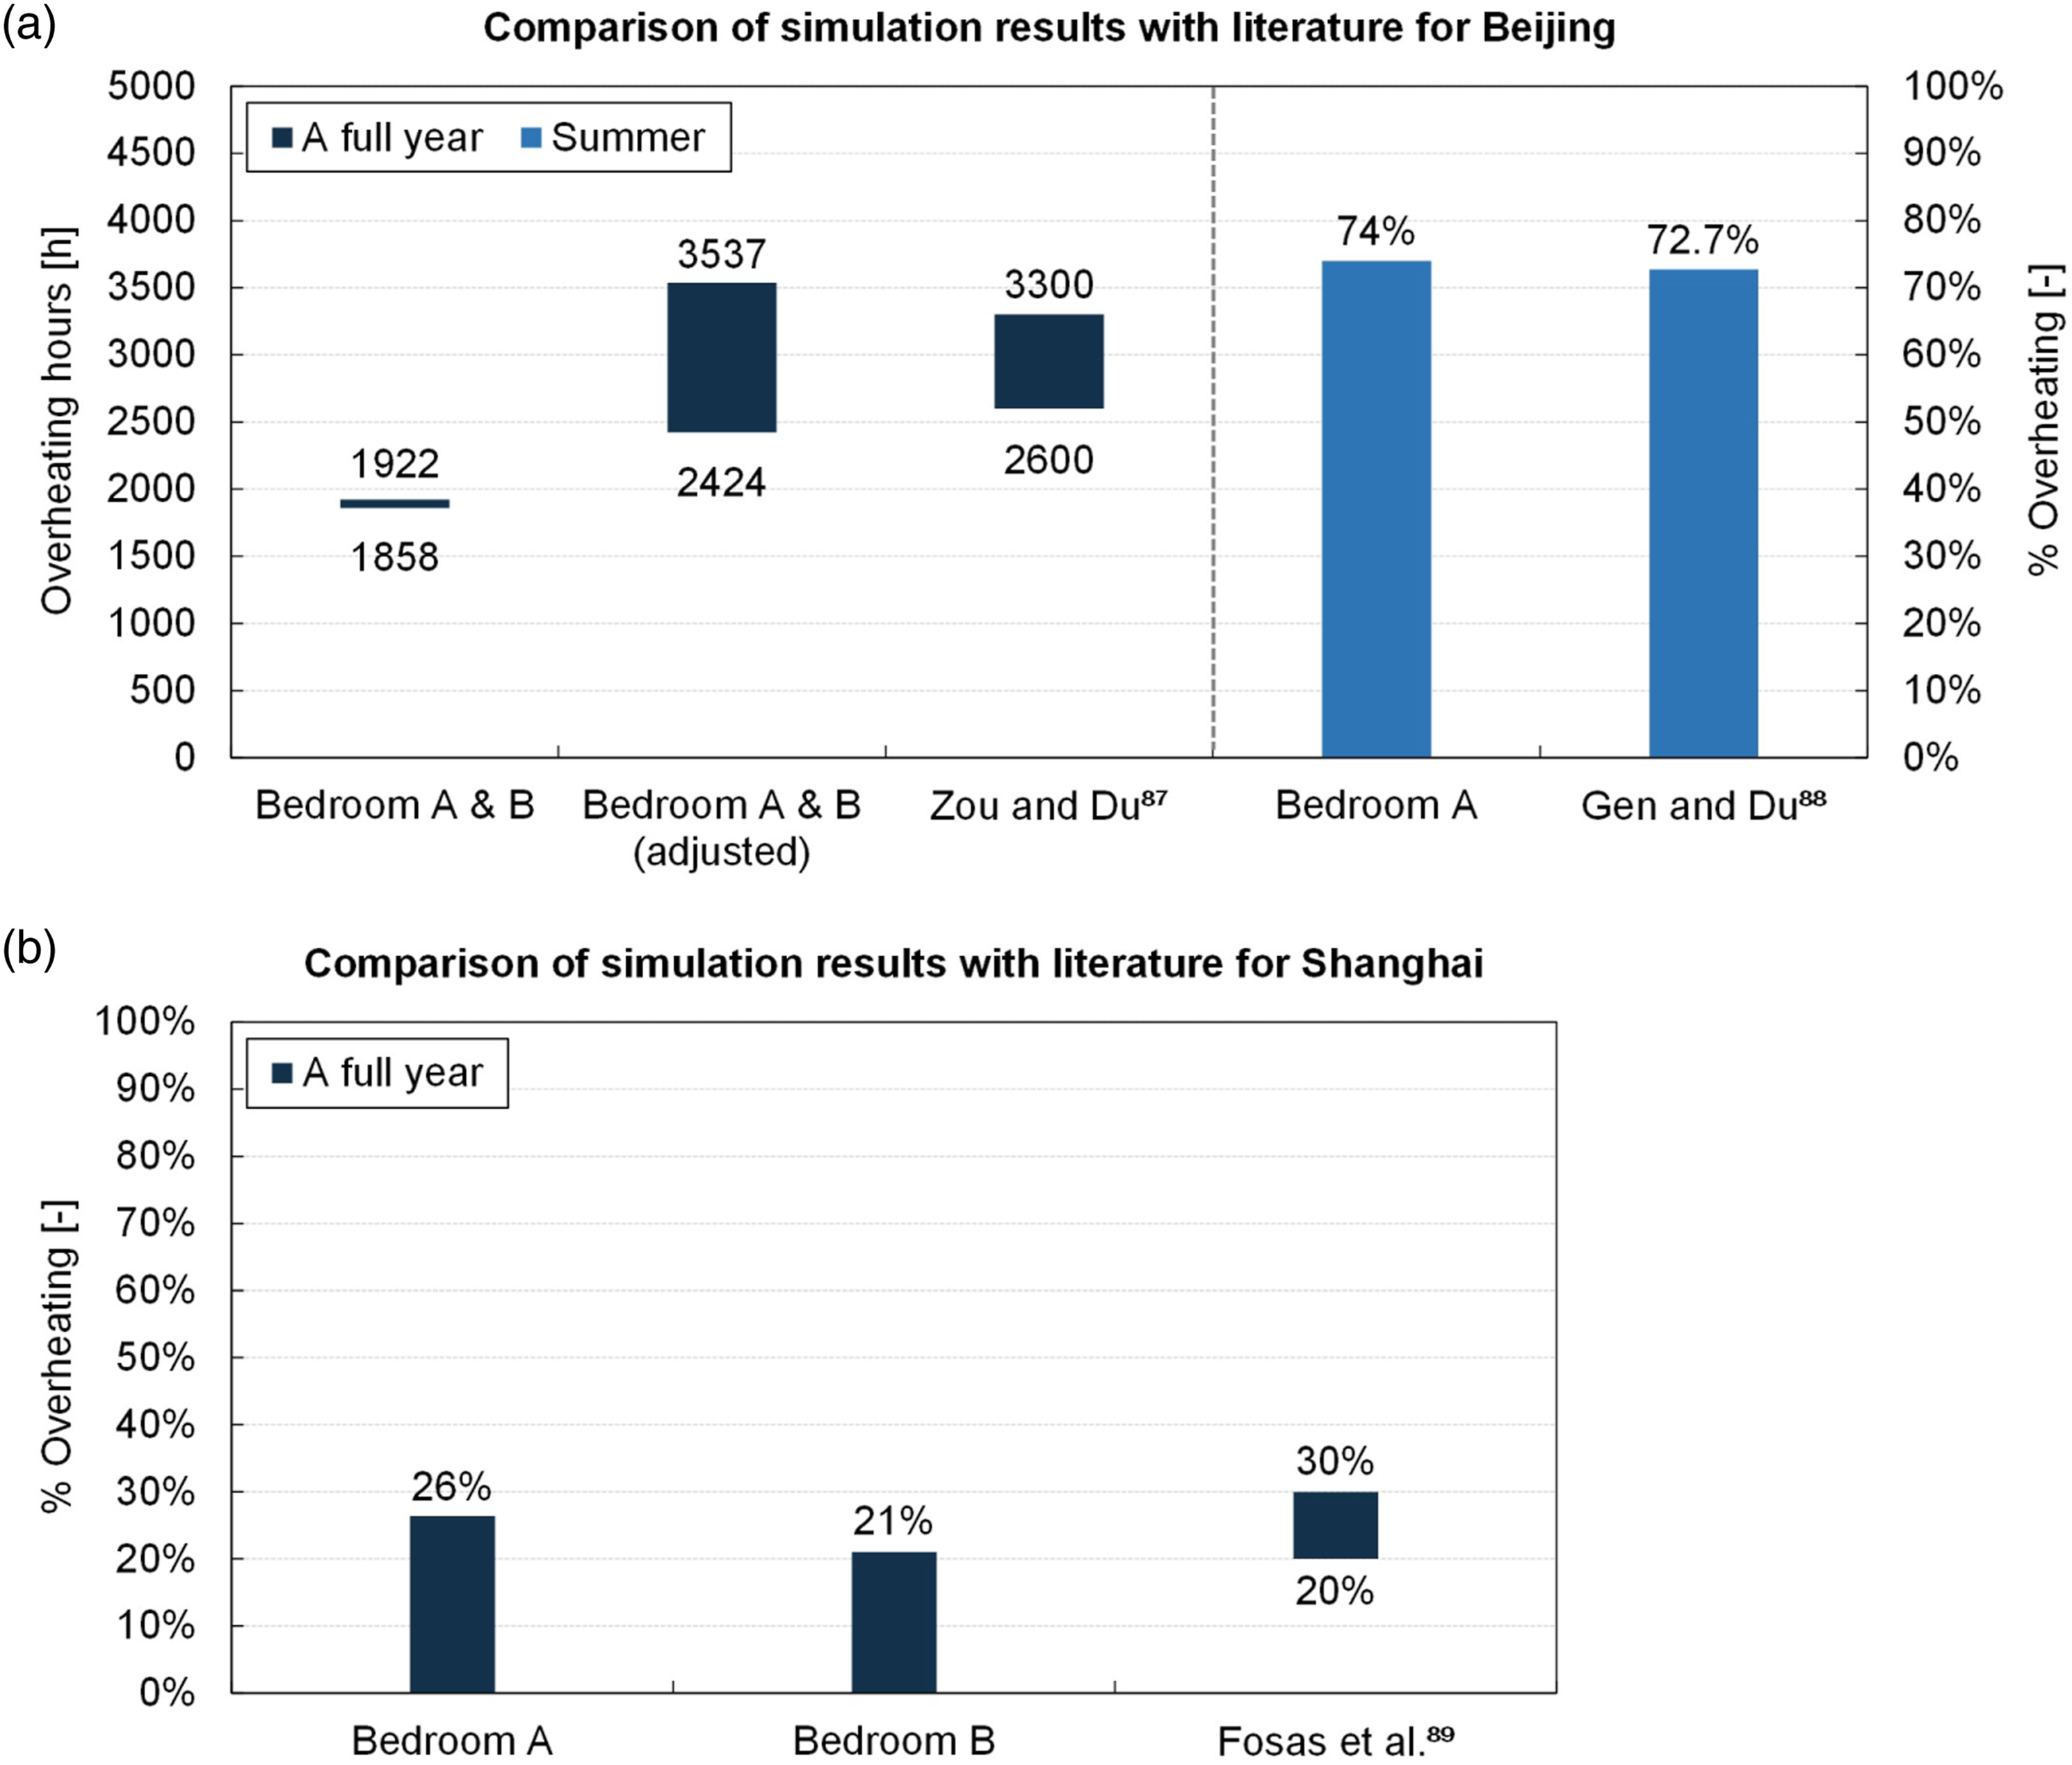
In Shanghai, the percentages of overheating during occupied hours in a full year predicted by the present study, that is, 26% (Bedroom A) and 21% (Bedroom B) (see Figure 10(b)) are very comparable to the interquartile range of 20%–30% from the simulations by Fosas et al. 89 (Figure 11(b)). Although the thermal transmittance of the external wall in Fosas et al. 89 was smaller, an additional simulation showed that this difference does not have a large effect on the percentage of overheating and thus still shows a good agreement. The results are not included here for the sake of brevity.
Limitations and future work
Apart from the presented results and findings, there are several topics that could be studied in the future. 1. Only two Chinese climate zones and one building geometry (slab geometry) were considered in this study. Future work could study other Chinese climate zones, and study other building geometries, for example, L-shape geometry and courtyard. 2. This study was based on one specific emission scenario and one future timespan, while additional emission scenarios (including RCPs (representative concentration pathways) from the IPCC (Intergovernmental Panel on Climate Change) Fifth Assessment Report
3
) and future timespans could be considered to assess the uncertainty in the predictions with respect to the effect of climate change on indoor thermal comfort and energy demand. Ongoing work focuses on an analysis of different climate change scenarios and their effect on future building thermal comfort and energy demand. 3. Future work could focus on other age groups, such as an older population with likely different thermal comfort sensations. Moreover, other thermal comfort models, for example, aPMV which was also included in the Chinese standard GB/T 50785-2012,
41
can be considered in future studies. In addition, other occupancy schedules can be used in future studies to include a wider variation of building usage. 4. Based on the assessment of indoor thermal comfort in the current and future climates, climate change adaptation measures are currently studied to increase indoor thermal comfort and simultaneously reduce building energy demand in heritage apartments in different climate zones in China. These measures include, but are not limited to, solar shading and passive cooling.
Conclusions and implications
The indoor thermal comfort in apartments with a compact interior (without a living room) built before the 1980s was studied by numerical simulations to understand the effects of climate change (typical meteorological years and 2050) on indoor overheating, which has, according to the best knowledge of the authors, not been done before. In addition, the effect of apartment location (first floor and second floor) and eight different orientations on indoor overheating are presented. Heritage apartments in Beijing and Shanghai were selected as case studies, using the number of overheating hours and degree hours as the performance indicators of occupant thermal comfort.
The following detailed conclusions are made: 1. In 2050, considerably increase in the numbers of overheating hours and degree hours for each studied orientation and on average for all the studied bedrooms in Beijing and Shanghai were predicted by the model compared to the typical years, as a consequence of the predicted climate change. 2. Compared to the typical years, the average numbers of overheating hours are predicted to be at least 50% and around 40% higher in 2050 for the studied bedrooms in Beijing and Shanghai, respectively. Moreover, compared to the typical years, the average number of degree hours are predicted to be more than triple and nearly double in 2050 for the studied bedrooms in Beijing and Shanghai, respectively. 3. The number of overheating hours and degree hours for each studied orientation and their average values are larger for a bedroom on the second floor than on the first floor, irrespective of the studied climate scenario and climate zone. This is due to the influence of heat gains from the roof/attic, that is, due to the elevated air temperatures in the attic caused by the solar radiation on the roof surface and the minimal thermal resistance of the ceiling between the apartment and the attic. 4. For a studied bedroom, irrespective of climate zone and climate scenario, the largest number of overheating hours occurs when its bedroom window is oriented towards either SW or SE, due to the similar solar elevation angle with comparable solar heat gain from two orientations. The largest number of degree hours, however, occurs when the window of the bedroom is oriented towards the west (SW or W), which could be attributed to the simultaneous occurrence of the higher ambient air temperature in the afternoon and the solar radiation heat gain. As to be expected, the smallest number of overheating hours and degree hours occurs when the bedroom window is oriented towards N, due to the lowest solar heat gain through the window.
The study can be used as a starting point to determine proper renovation strategies for heritage apartments. The study also shows that the possible increase in the number of overheating hours is considerable and should be a point of consideration alongside the other more common considerations regarding climate change mitigation measures, that is, increased insulation levels and less infiltration to reduce energy demand and CO2 emissions.
Footnotes
Acknowledgements
The financial support from the China Scholarship Council is acknowledged.
Authors’ contribution
Muxi Lei and Twan van Hooff contributed 50% and 30%, respectively, and Bert Blocken and Ana Pereira Roders each contributed 10% in the preparation of this manuscript.
Declaration of conflicting interests
The author(s) declared no potential conflicts of interest with respect to the research, authorship, and/or publication of this article.
Funding
The author(s) disclosed receipt of the following financial support for the research, authorship, and/or publication of this article: This study was financially supported by the China Scholarship Council [Grant No. 201606130059].