
Abstract
Herein, a method is proposed to predict the infection probability distribution rather than the room-averaged value. The infection probability is predicted by considering both airborne and droplet transmissions based on CO2 concentration and the position of the occupants in a room. The proposed method was used in an actual office setting, and the results confirmed that it could provide a quantitative prediction of the infection probability by integrating the ventilation efficiency and the distance between occupants (i.e. social distancing). We verified the ability of the method to analyse the relative effectiveness of countermeasures for airborne and droplet transmissions. The proposed strategies can be implemented by a facility manager and can enable facility users to check the infection probability distribution in real-time to select a seat with the minimum risk of infection.
Introduction
COVID-19 has spread worldwide since 2020. The World Health Organization (WHO) 1 assessment in March 2020 declared COVID-19 to be a pandemic. According to the WHO, 2 over 100 million people had been infected by January 2021, and approximately 1.75 million people had died. The damage caused by the pandemic was not only medical but also economical owing to travel restrictions and lockdowns. Infectious disease epidemics have occurred repeatedly in the history of humanity, and it is conceivable that a new virus with the same infectious power as SARS-CoV-2 might reappear in the future and cause yet another pandemic. 3 Isolating infected and susceptible individuals could prevent the spread of COVID-19. However, COVID-19 is transmitted by asymptomatic patients.4,5,6 Therefore, it is always better to assume that (an) infected persons/people are everywhere and to implement countermeasures for preventing the spread of the infection.
According to the U.S. Centers for Disease Control and Prevention (CDC), 7 the modes of COVID-19 transmission include contact, droplet and airborne transmissions. Because airborne infectious particles remain suspended for a longer time, dilution of the air by ventilation is an effective way to prevent infection. Infection through the deposition of droplets only occurs when an infector and a susceptible individual are close to each other. 8 Therefore, the countermeasures against airborne transmission and droplet transmission could vary. The quantitative risk of infection due to airborne transmission and droplet transmission must be evaluated separately to consider strategies for infection control.
The Wells–Riley model9,10 is often used to provide quantitative predictions of the probability of infection by airborne transmission. Harrichandra et al. 11 used the Wells–Riley model to predict the probability of infection in a nail salon. Miller et al. 12 used an improved model developed by Gammaitoni and Nucci 13 to predict the probability of infection during a choral event. However, droplet transmission differs from the airborne transmission, wherein the droplets have a high falling speed and fall to the floor in a short time. Therefore, the quantitative risk of droplet transmissions cannot be predicted using the same methods used for airborne transmissions.
To date, several examples of predicting infection probability using the Wells–Riley method and other methods based on the aforementioned method have been proposed. However, most of these methods assume that the room is perfectly mixed and that the infectious particles are uniformly dispersed. However, rooms that have non-uniform ventilation is dependent on the location of air outlets and inlets, and levels of pollution could vary from place to place.14,15
In this study, we proposed a method for predicting the infection probability distribution rather than the room-averaged value. We predicted the probability of infection by considering both airborne transmission and droplet transmission based on CO2 concentration and occupant positions. The term ‘airborne transmission’ refers to the transmission by airborne particles suspended in the air for a long time, and the term ‘droplet transmission’ refers to the transmission by large droplets that descend to the floor in a short time. This study is unique because it predicts (1) the distribution of the infection probability, rather than the room-averaged value, and (2) the infection probability considering both airborne transmission and droplet transmission.
Mathematical model
The equation for predicting the infection probability and number of disease cases
Airborne transmission
The term ‘airborne transmission’ refers to the transmission of airborne particles suspended in the air for a long time, such as microdroplets and droplet nuclei. This also includes larger droplets that have become small after evaporation. The Wells–Riley equation is widely used to predict the probability of infection caused by airborne transmission.16,17,18 Rudnick and Milton extended the Wells–Riley equation9,10 and proposed a method to determine the average number of quanta inhaled by occupants as suspended particles based on the CO2 concentration of a target space. 19 They based this method on the principle that, as exhaled air is the only source of CO2, the CO2 concentration can be used as a marker for particles that remain suspended in the air for a long time. CO2 is a gaseous scalar, whereas the infectious particles are aerosols, which are multiphase mixtures. However, they can be approximated to be transported in almost a similar manner indoors.20,21 However, the method developed by Rudnick and Milton 19 assumes that the target room is in a state of perfect mixing and calculates the infection probability averaged over the entire room. Qian et al. 22 proposed a method for determining the distribution of the infection probability based on computational fluid dynamics (CFD) results using the Wells–Riley equation. Guo et al. 23 proposed a method that combines the Wells–Riley equation and spatial flow impact factor (SFIF) to determine the optimal placement of occupants and air purifiers based on results of a single CFD analysis. However, these methods require CFD analysis. When performing calculations using CFD, it is necessary to assume the operating conditions of the heating, ventilation and air conditioning (HVAC) system and positions of occupants in advance. Nonetheless, the actual conditions often differ from the assumptions, and it is preferable to perform real-time monitoring, based on measurements of the actual conditions.
In this study, the target space was discretized horizontally, and equations (1–4) were proposed to predict the distribution of the infection probability, rather than the room-averaged value, based on the CO2 concentration in each grid. By using the CO2 concentration distribution to predict the infection probability distribution, the airflow distribution and ventilation efficiency distribution can be considered


Droplet transmission
The term ‘droplet transmission’ refers to the transmission by droplets that descend to the floor in a short amount of time. The Wells–Riley equation is designed in terms of the infection probability caused by airborne particles that are suspended in the air for a long time. Thus, a separate method is required to represent the infection probability owing to the droplets that fall to the floor in a short time.
Sun and Zhai 24 included the effect of falling droplets in the Wells–Riley method and predicted the infection probability in various buildings and transportation systems. According to this method, the probability of infection caused by droplet transmission can be reduced by increasing the amount of outdoor air supply. However, in nature, airflow has a minor effect on the distance covered by large droplets, and the probability of infection does not change even when the outdoor air supply varies. Therefore, this method is not suitable for predicting the infection probability of droplet transmission.
Considering these facts, equations (5–8) are proposed to predict the probability of infection by droplet transmission. The assumptions of the proposed equations are: (1) the outdoor air supply is not related to the infection probability caused by droplet transmission; (2) the distribution of the infection probability, rather than the room-averaged value, can be predicted; (3) the droplets from every single occupant can be considered and (4) the probability of droplet transmission (


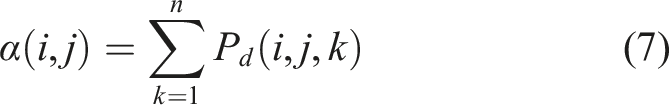
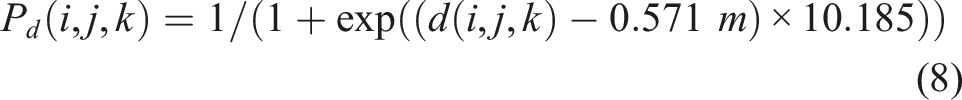
Using the variables other than
We developed equation (8) to express the probability of droplet arrival ( Relationship between the horizontal distance and droplet transmission probability.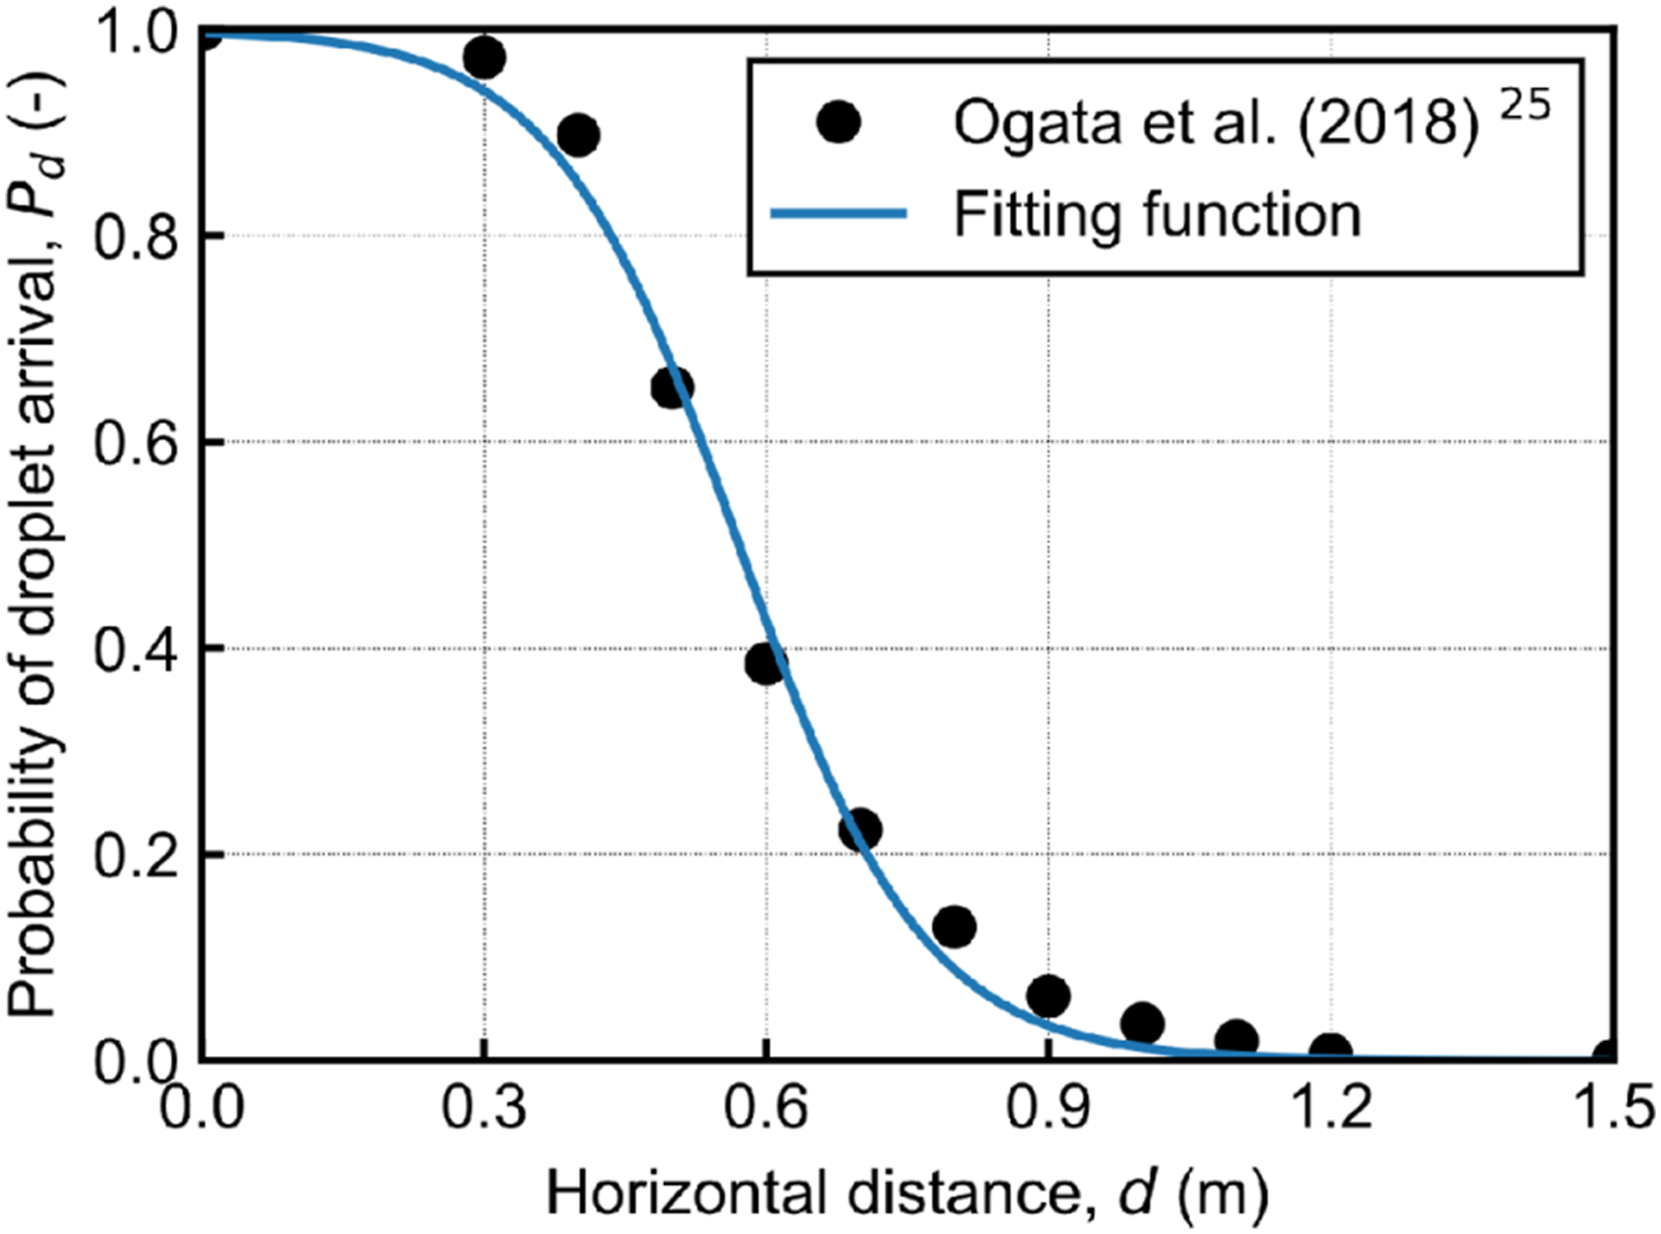
Combined airborne and droplet transmission
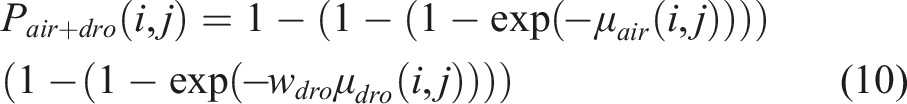
In this study, the probability of infection was predicted for airborne and droplet transmissions separately. Therefore, the probability of infection due to airborne and droplet transmission at the grid point

Using equations (1) and (5), equation (9) is reduced as equations (10) and (11) as follows

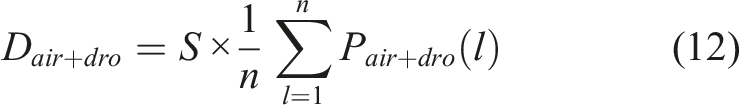
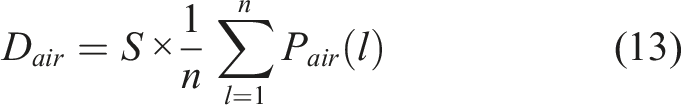
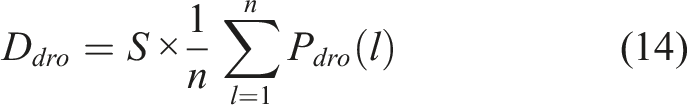
The predicted number of disease cases is expressed by equations (12–15)

Estimation of parameters required for the proposed method
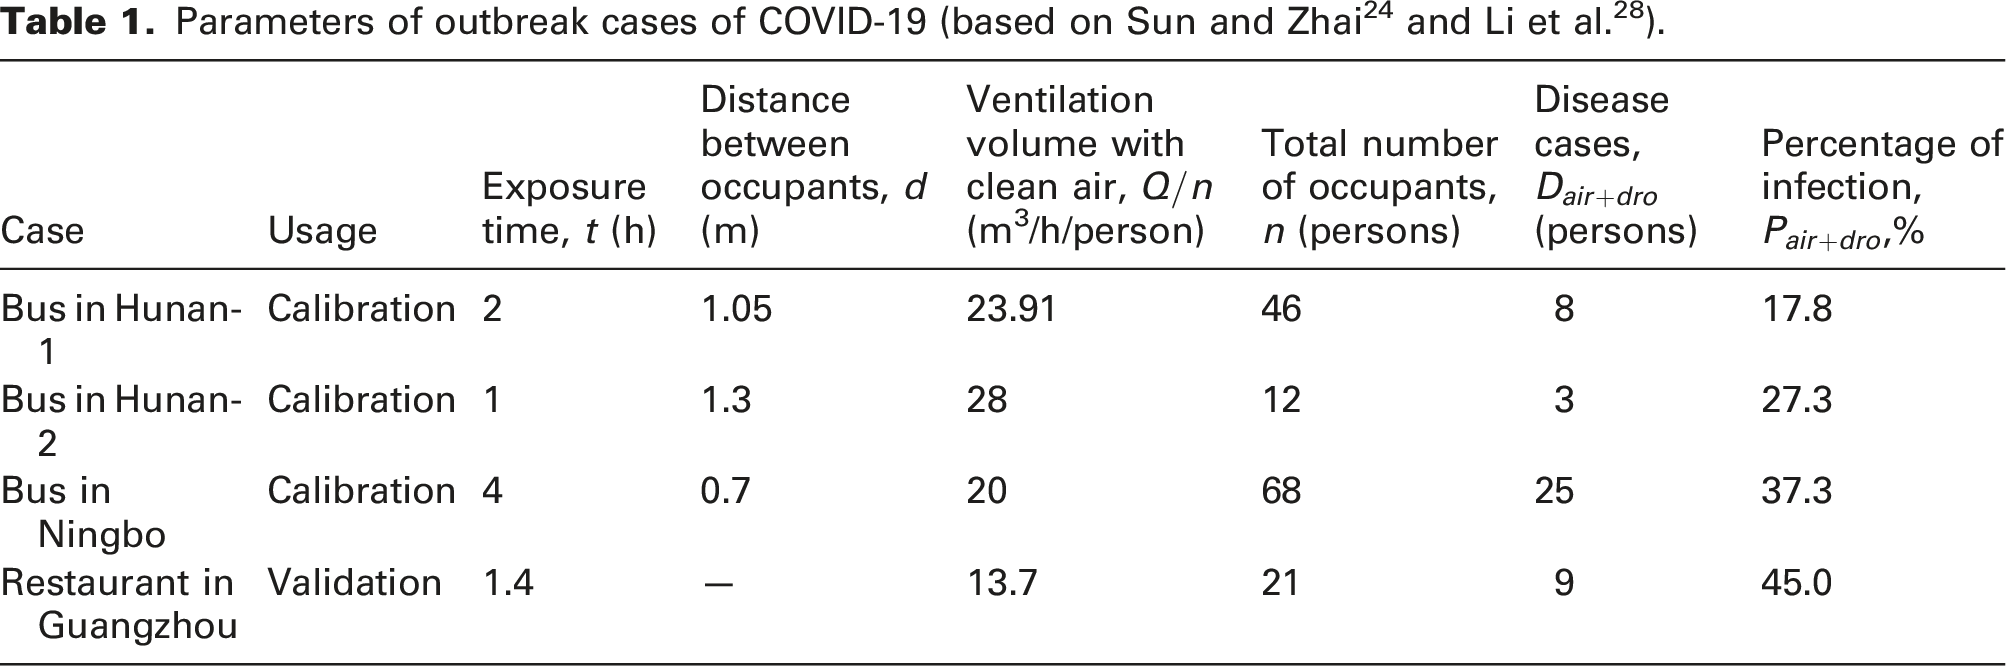
Estimated parameters and error between the predicted and actual infection percentage.
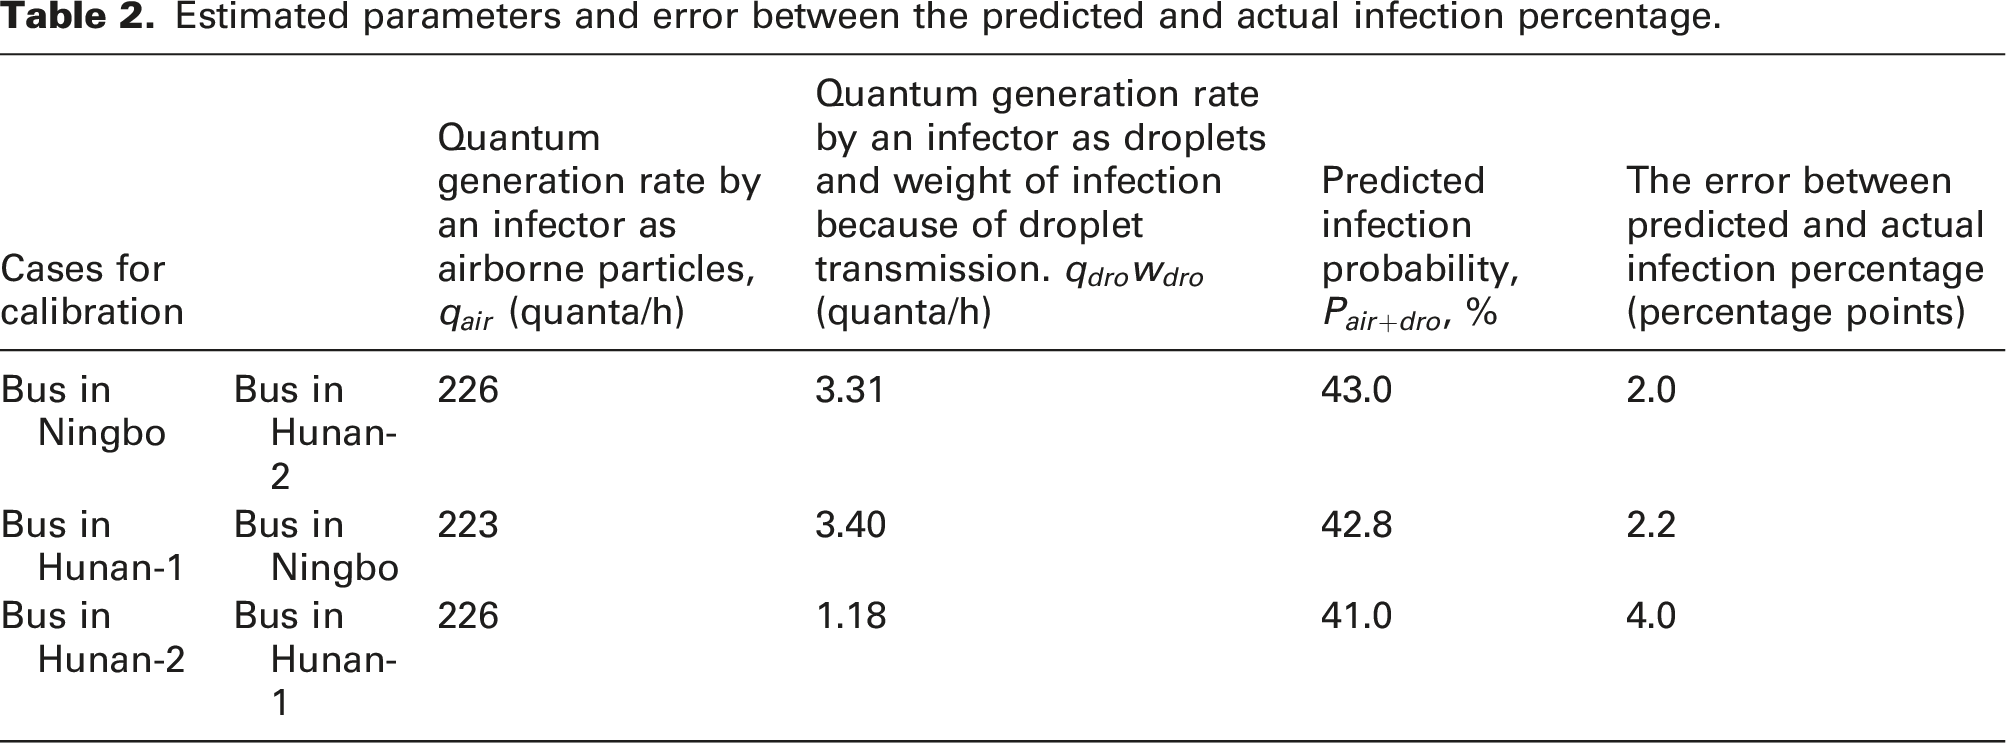
Currently, the amount of ventilation and the distance between people are known for only a few outbreak cases of infection. Therefore, in this study, we used only four outbreak cases for the calibration and validation of parameters. Thus, there is large uncertainty in the estimation of parameters (i.e.
Application in an actual space
Outline
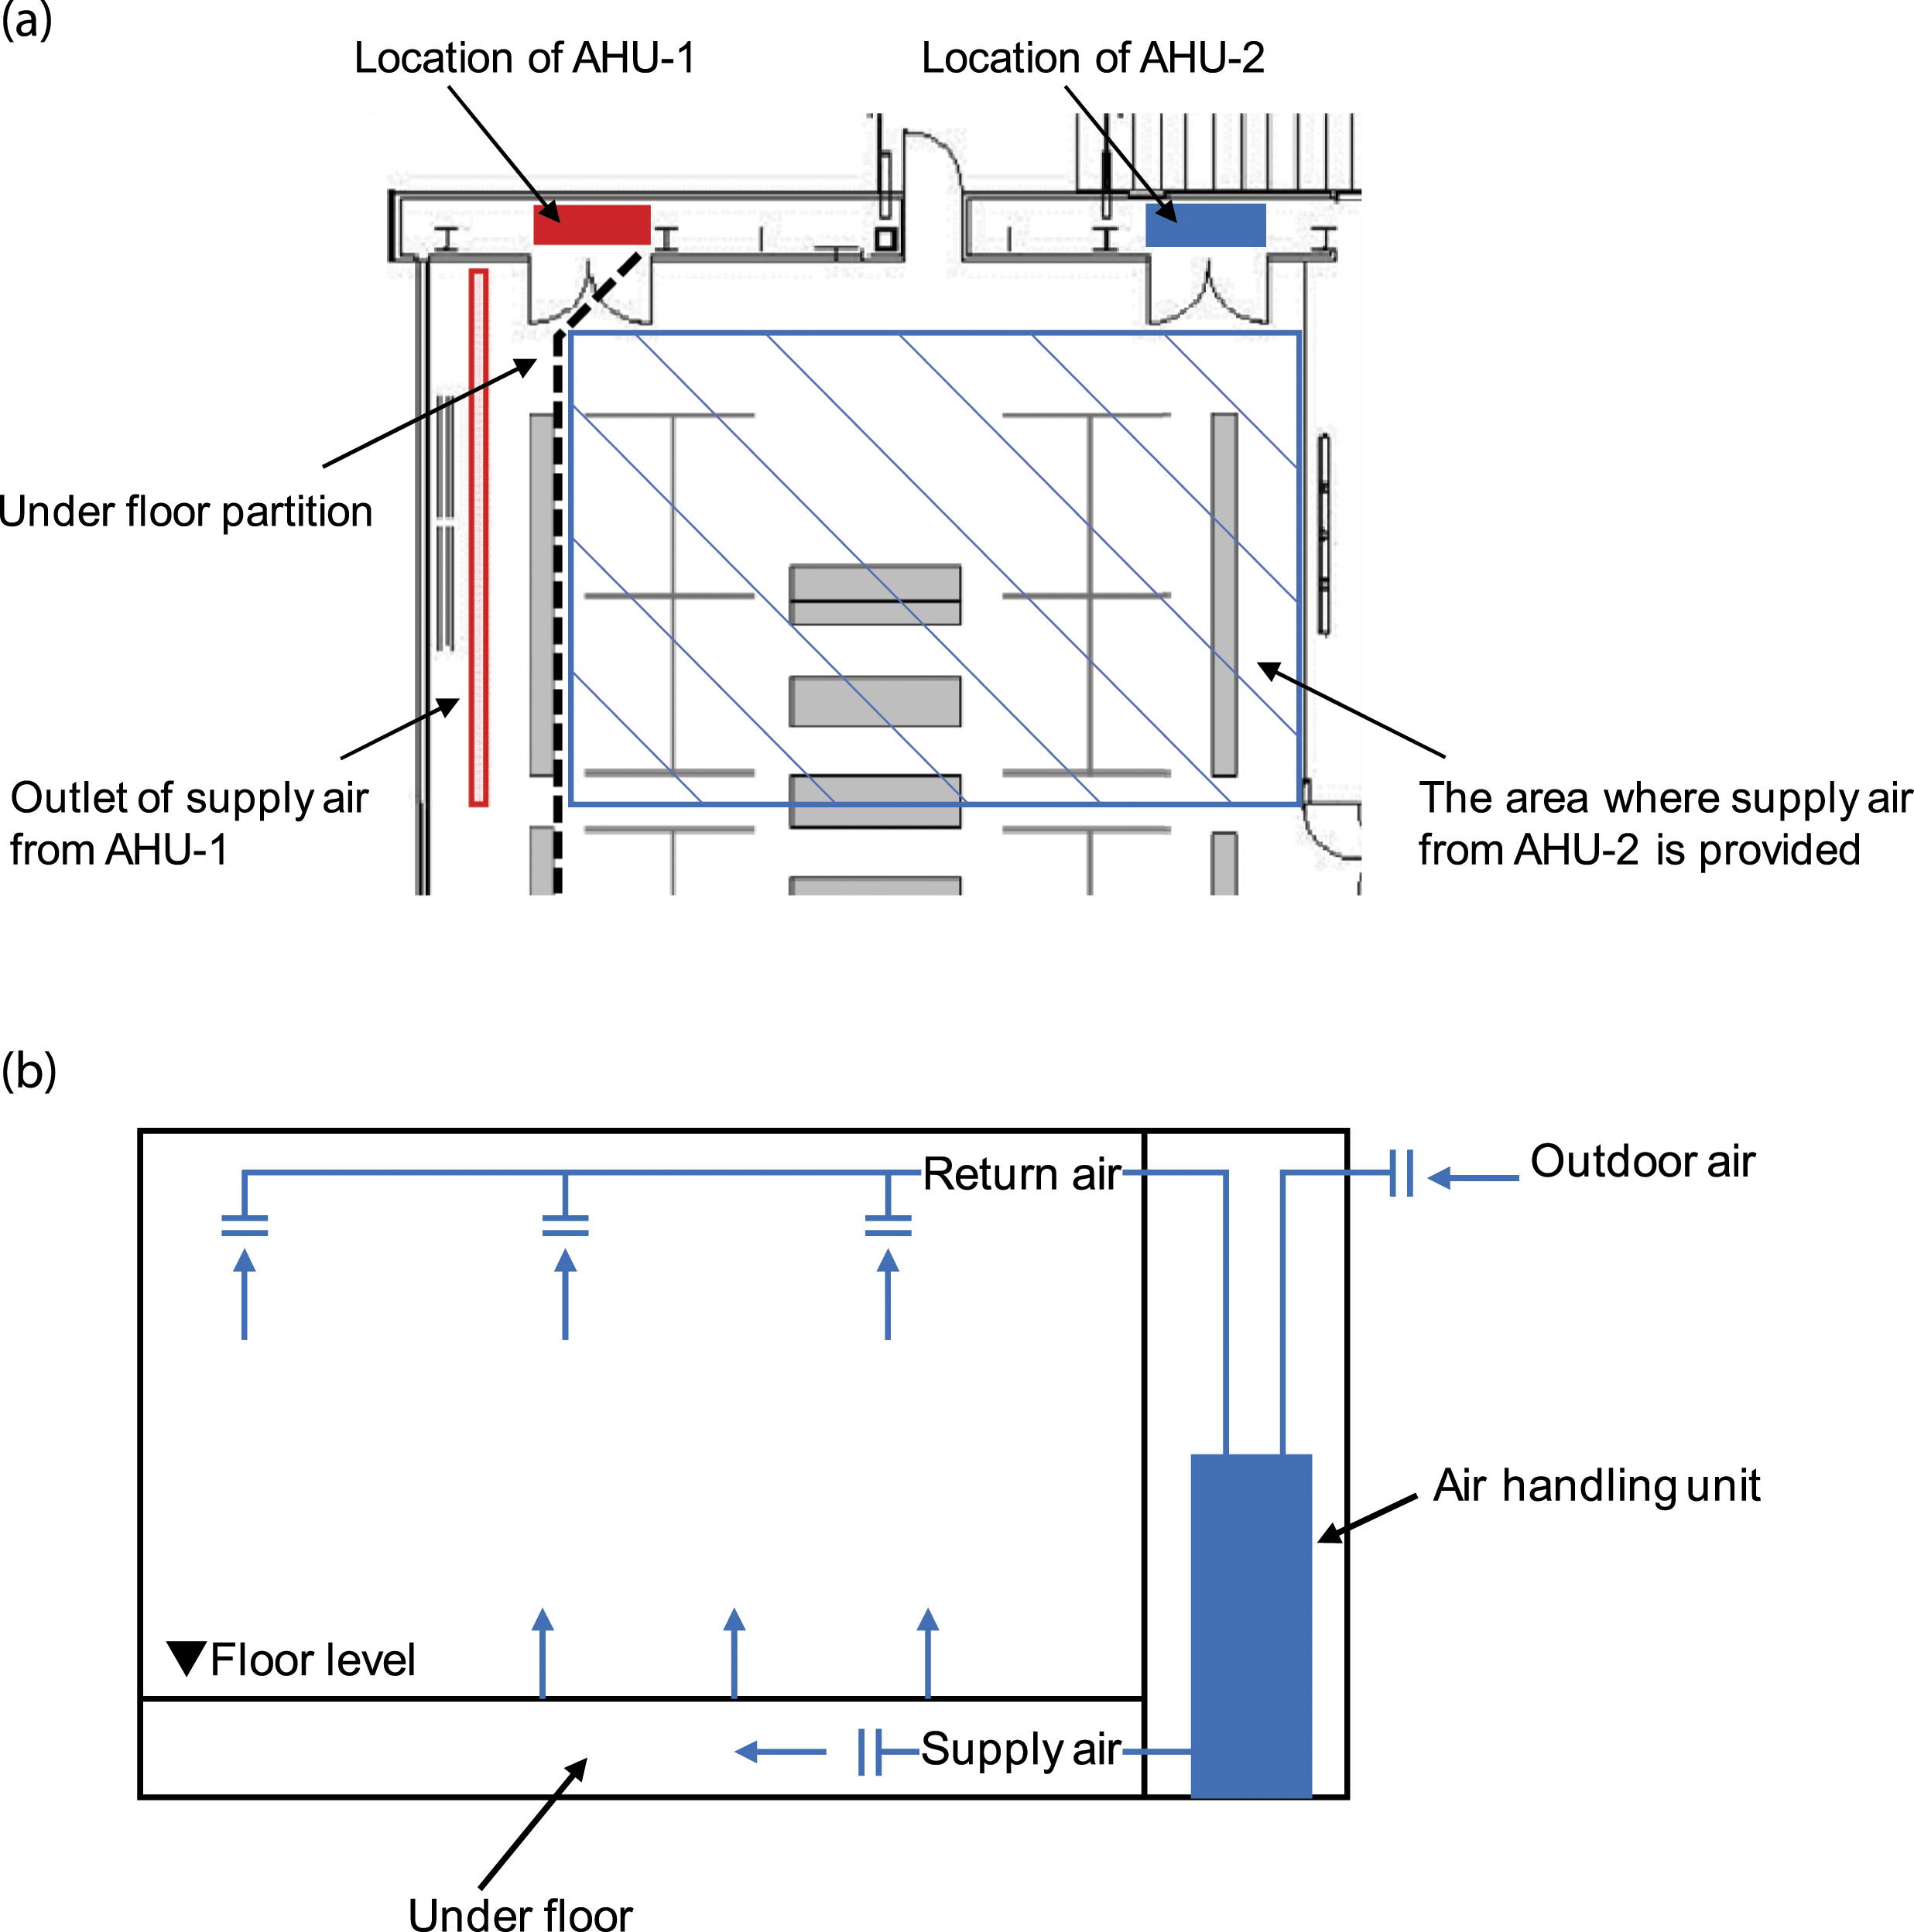
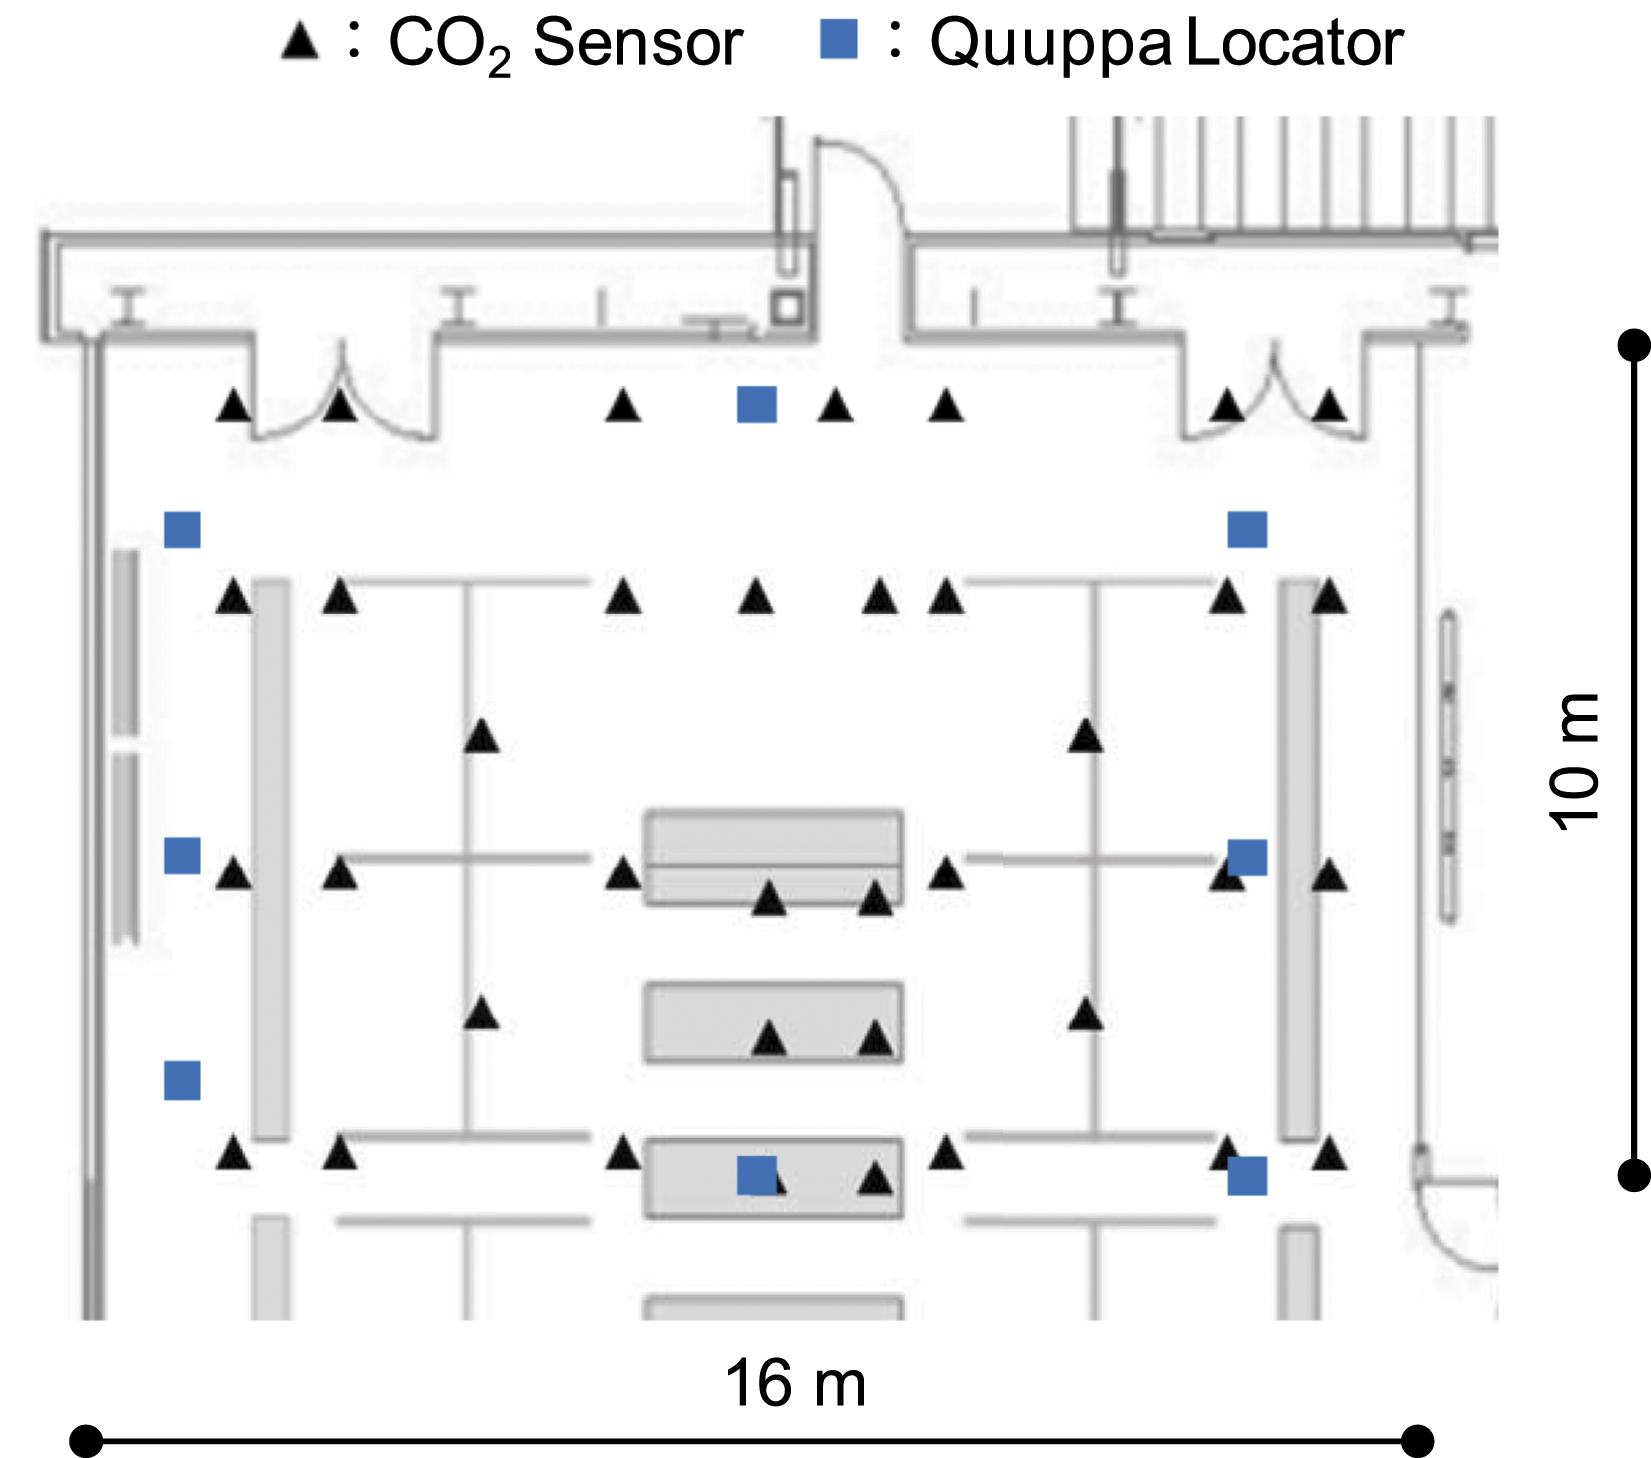
We evaluated the feasibility of the proposed method by applying it to an actual environment. We measured the CO2 concentration and the occupant position information in the target space and used the data as input for the proposed method. We show the procedure for predicting the infection probability distribution and the number of disease cases based on the measurement results in Figure 2. The target space for the prediction was part of the Shimizu Corporation offices in Tokyo, Japan. An outline of the air conditioning system is shown in Figure 3. The supply air from AHU-1 was provided by linear slot diffusers on the floor, and the supply air from AHU-2 was provided by seepage through the entire carpet in the target area. Figure 4 shows the arrangement of the measurement points. The measurements were carried out on March 18–19, 2021. The HVAC system was heated during the measurement period. Procedure for predicting the infection probability distribution and the number of disease cases based on the measurement results. Outline of the air conditioning system: (a) plan view and (b) sectional view. Plan view of the measurement positions.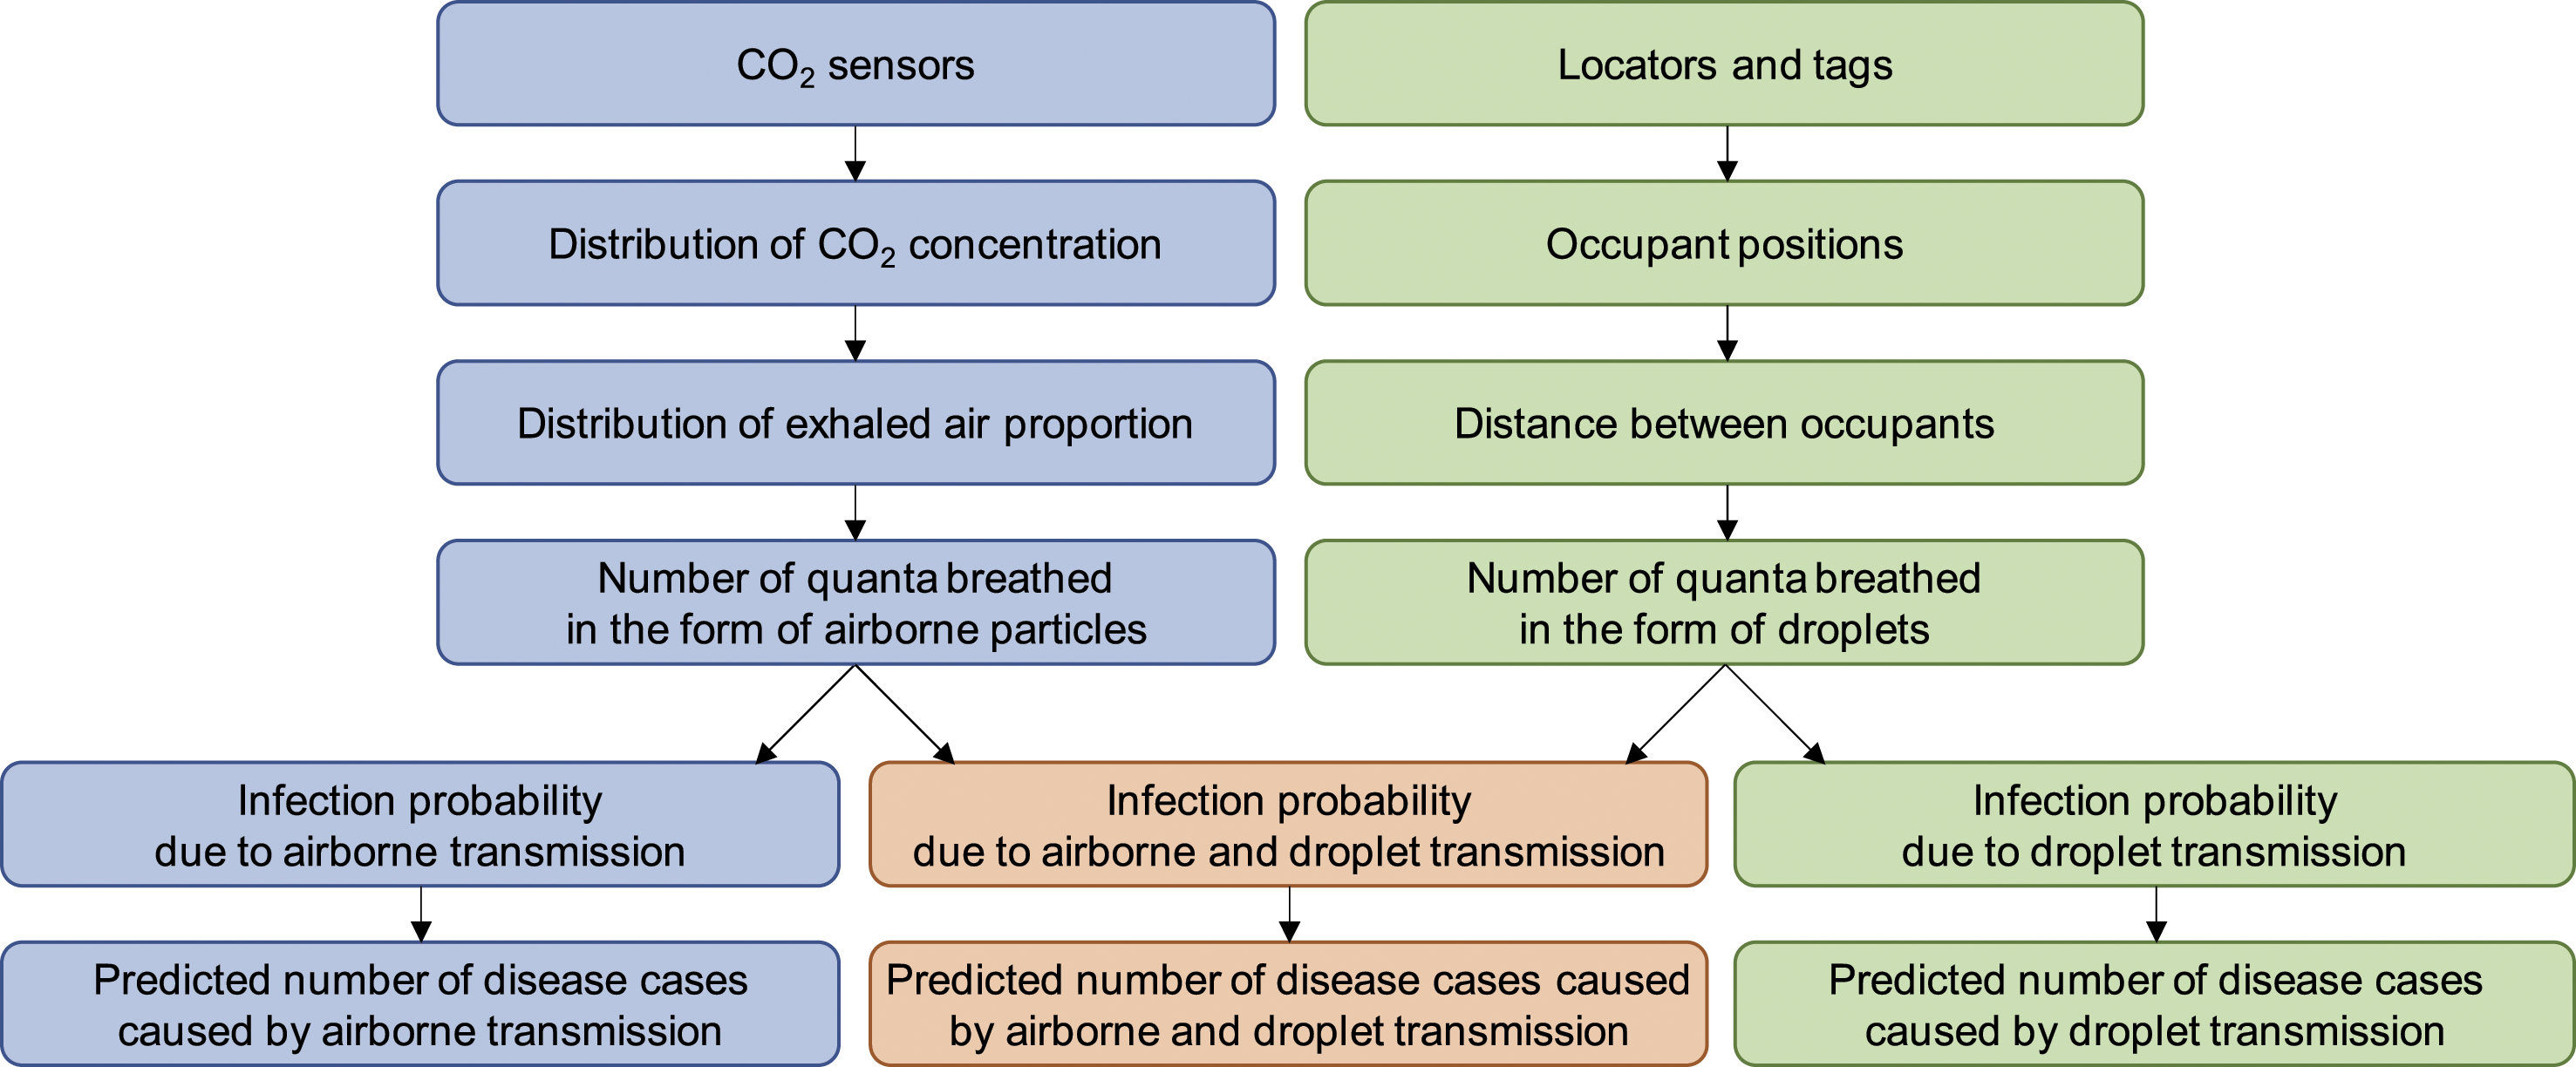
Measurement methods
CO2 concentration
We measured the CO2 concentration using a ‘TR-76Ui’ thermo-hygro-CO2 meter (T&D). We calibrated the sensor with the outdoor air before we placed the sensor. The arrangement of the sensors among the 37 measurement points is shown in Figure 4. The height of the sensors (Figure 5) was 1.2–1.5 m above the floor. In the method proposed in this study, to ensure a high spatial resolution of the CO2 concentration distribution, as many CO2 sensors as feasible should be installed, at least at the four corners of the targeted space. We obtained the horizontal distribution of the CO2 concentration by spline interpolation based on the values that were obtained at the 37 measurement points. The target space was discretized using a 10 cm × 10 cm mesh. The width of the discretization should not exceed 1 m because each seating position should be resolved. Installed CO2 sensor.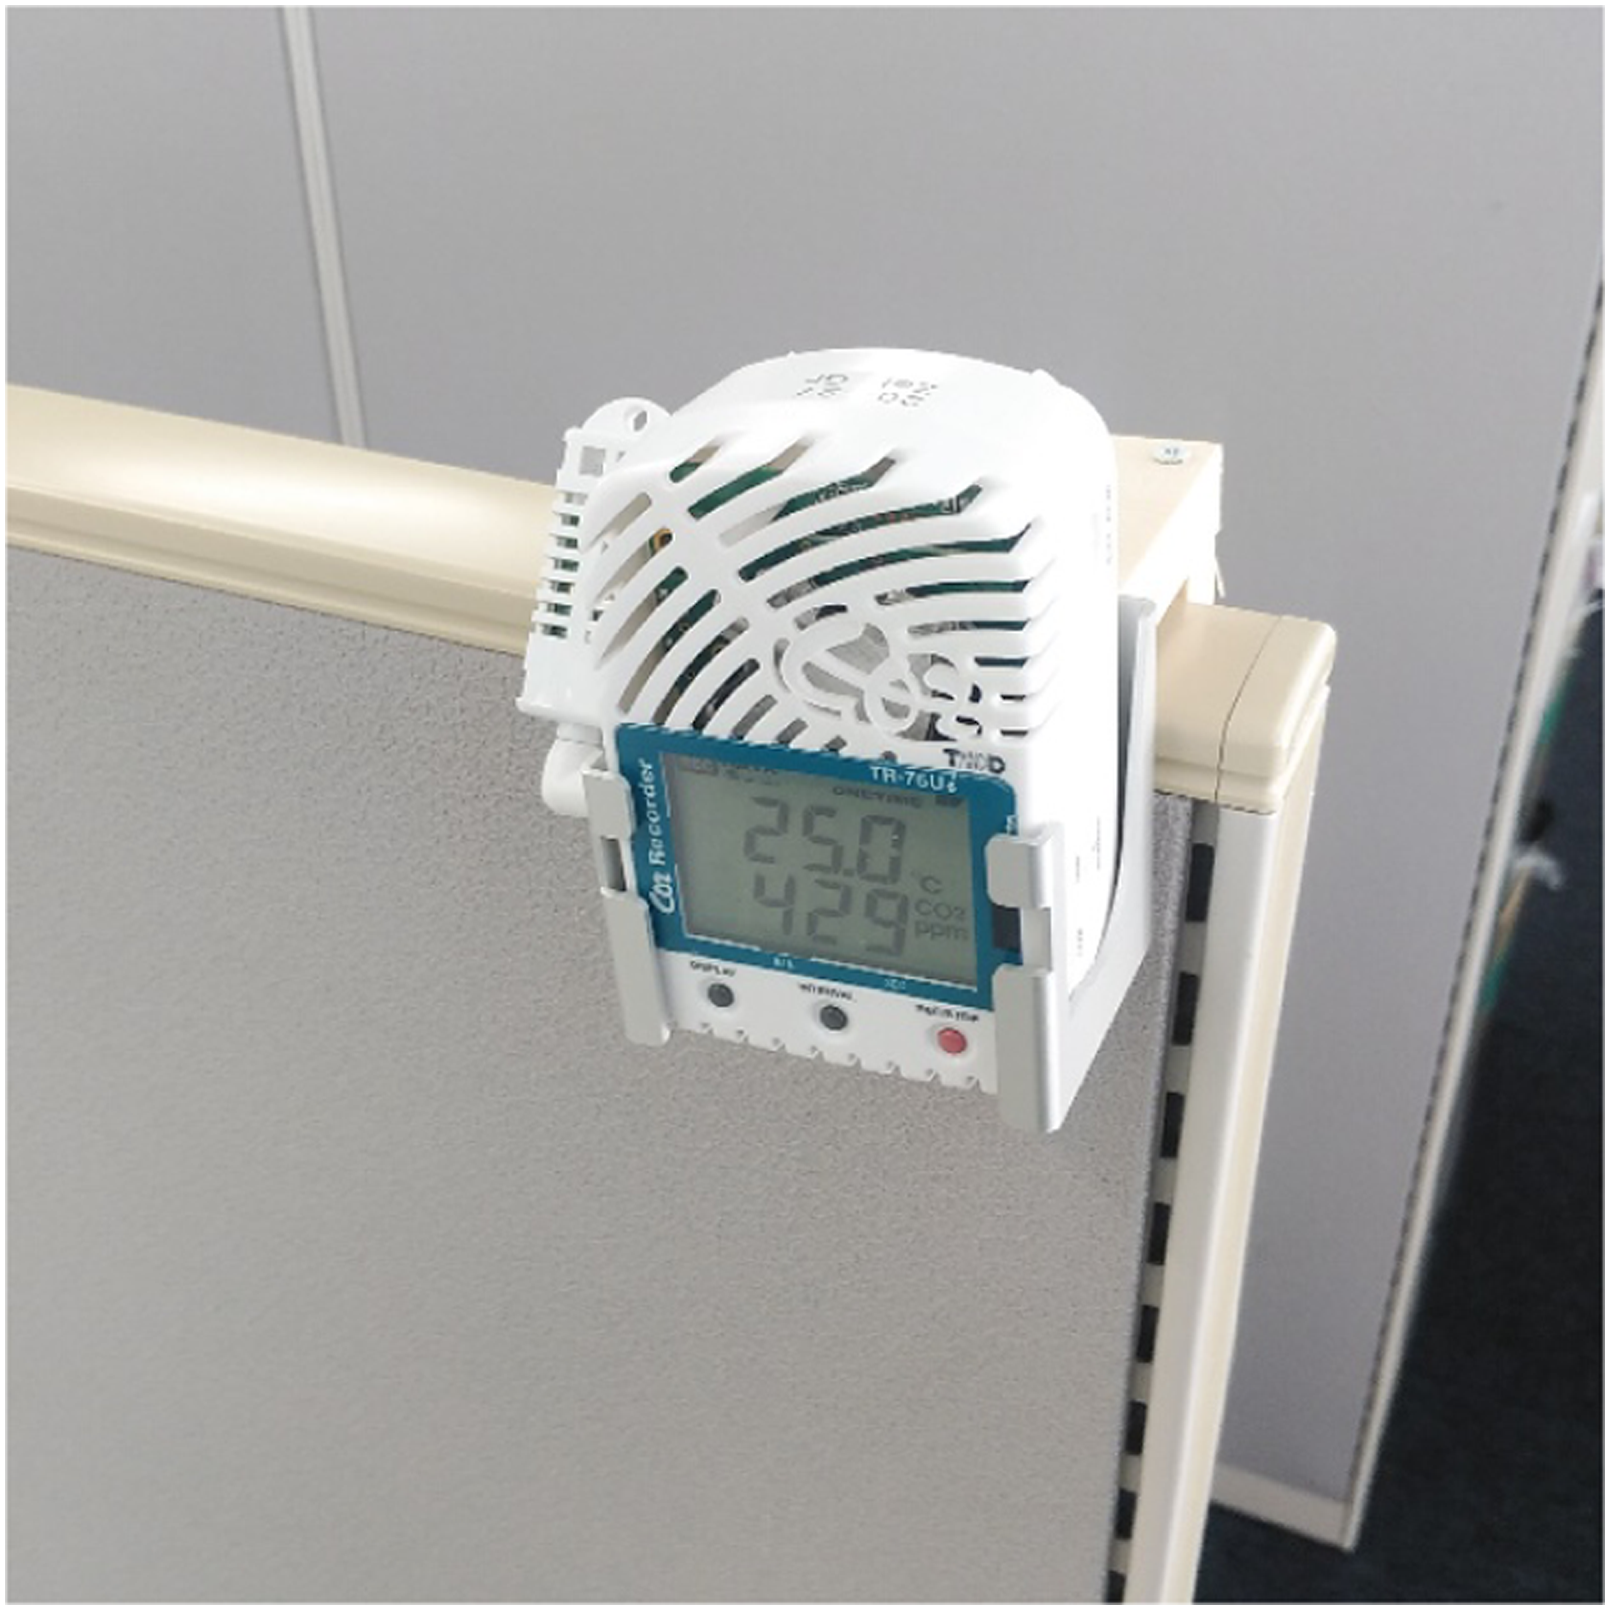
Occupant position information
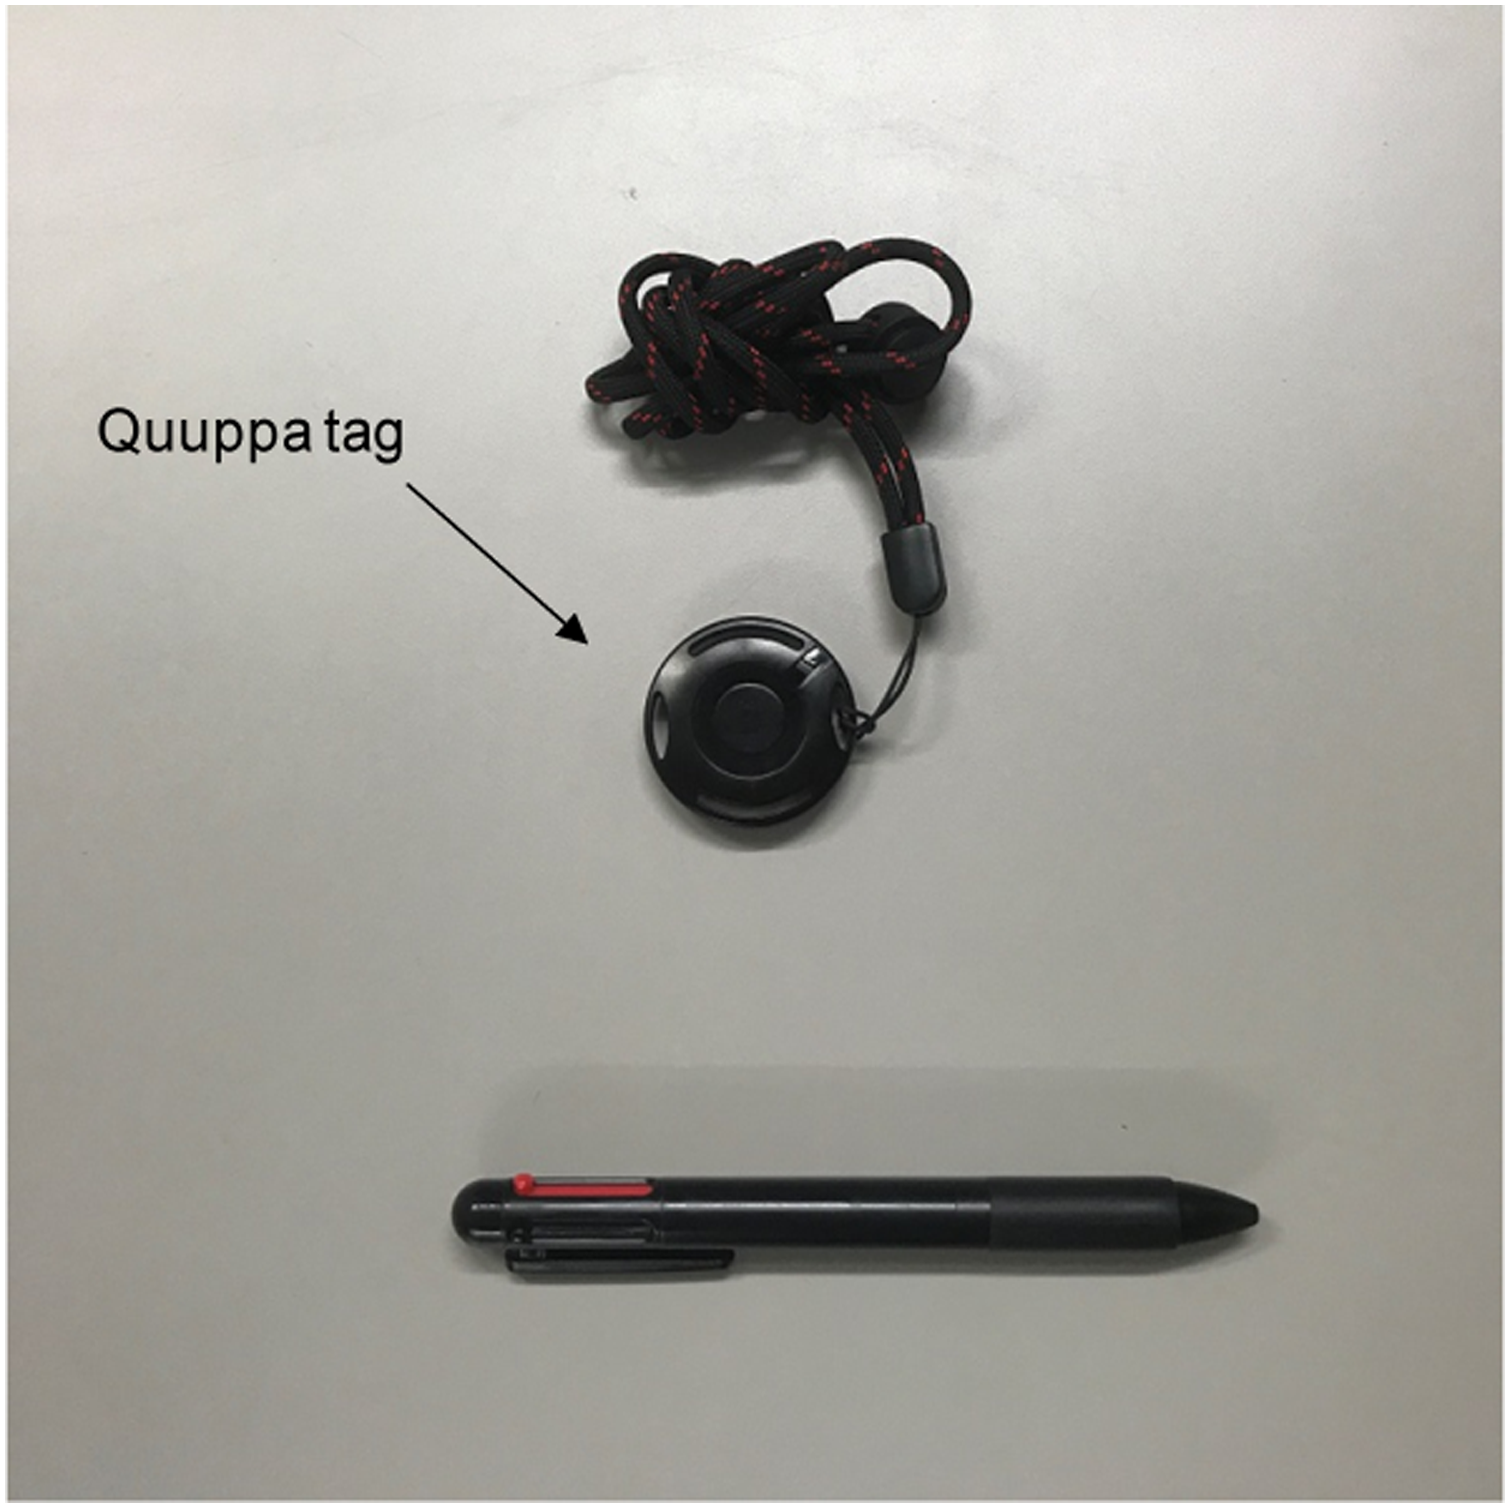
The ‘Quuppa Intelligent Locating System™’ was used to measure the positions of occupants in the room. The Quuppa system measures the position of tags using locators whose positions are known. We can identify the positions of the tags through Bluetooth communication of tags with multiple locators. ‘Quuppa LD-7L’ was used as the locator. The arrangement of the eight locators is shown in Figure 4. The installation conditions of the locators are illustrated in Figure 6. We installed all locators at a height of 2.6 m above the floor. Quuppa QT1-1 tags were used, as shown in Figure 7, and the participants always carried the tags. The participants in the experiment were employees who usually work in the targeted space. We explained the experimental procedure to the participants and obtained their consent in advance. There were nine subjects, and no one except the subjects was in the targeted space. During the measurement period, the personnel in the room worked as usual, with no restrictions on movement during the experiment. Therefore, subjects entered and exited the targeted space owing to their work. Installed Quuppa locator. Quuppa tag.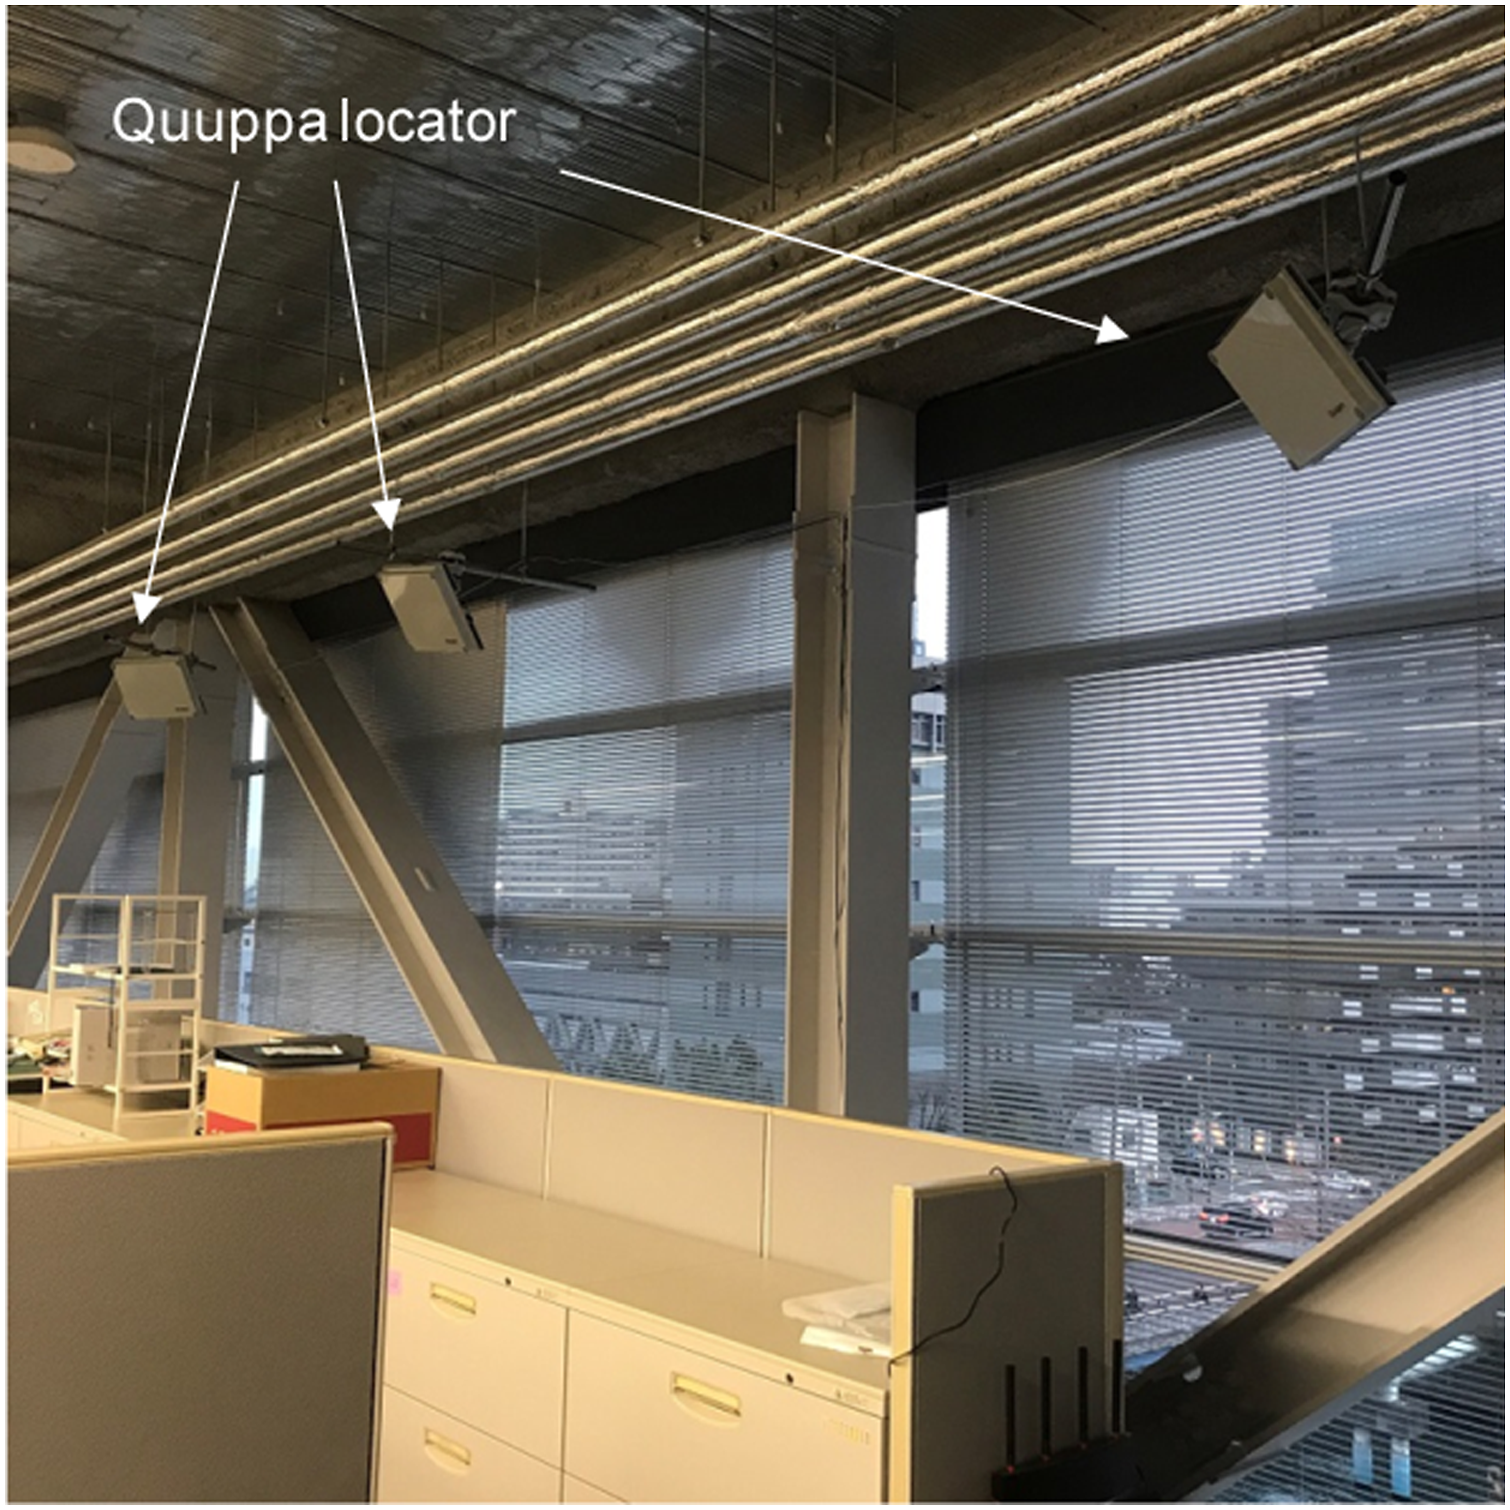
Results and discussion
Measurements of CO2 concentration and occupant positions
The CO2 concentrations measured by each sensor are shown in Figure 8. We corrected the results to remove any bias between sensors. For the correction, the average CO2 concentration measured by all sensors at 3:00 on 19 March was used as the true value when the CO2 concentration in the room was considered to be uniform. The difference between the true and measured values at 3:00 on 19 March was assumed to be the sensor bias, and the corresponding correction was applied to the entire data. Before the correction, the difference between the maximum and minimum CO2 concentrations measured at 3:00 on 19 March was 27.1 ppm. The accuracy reported by the manufacturer was 50 ppm +5% of the value, which is within the expected margin of error. Notably, the measured CO2 concentration may contain errors of the aforementioned order of magnitude. CO2 concentrations measured by each sensor. The biases between sensors were corrected.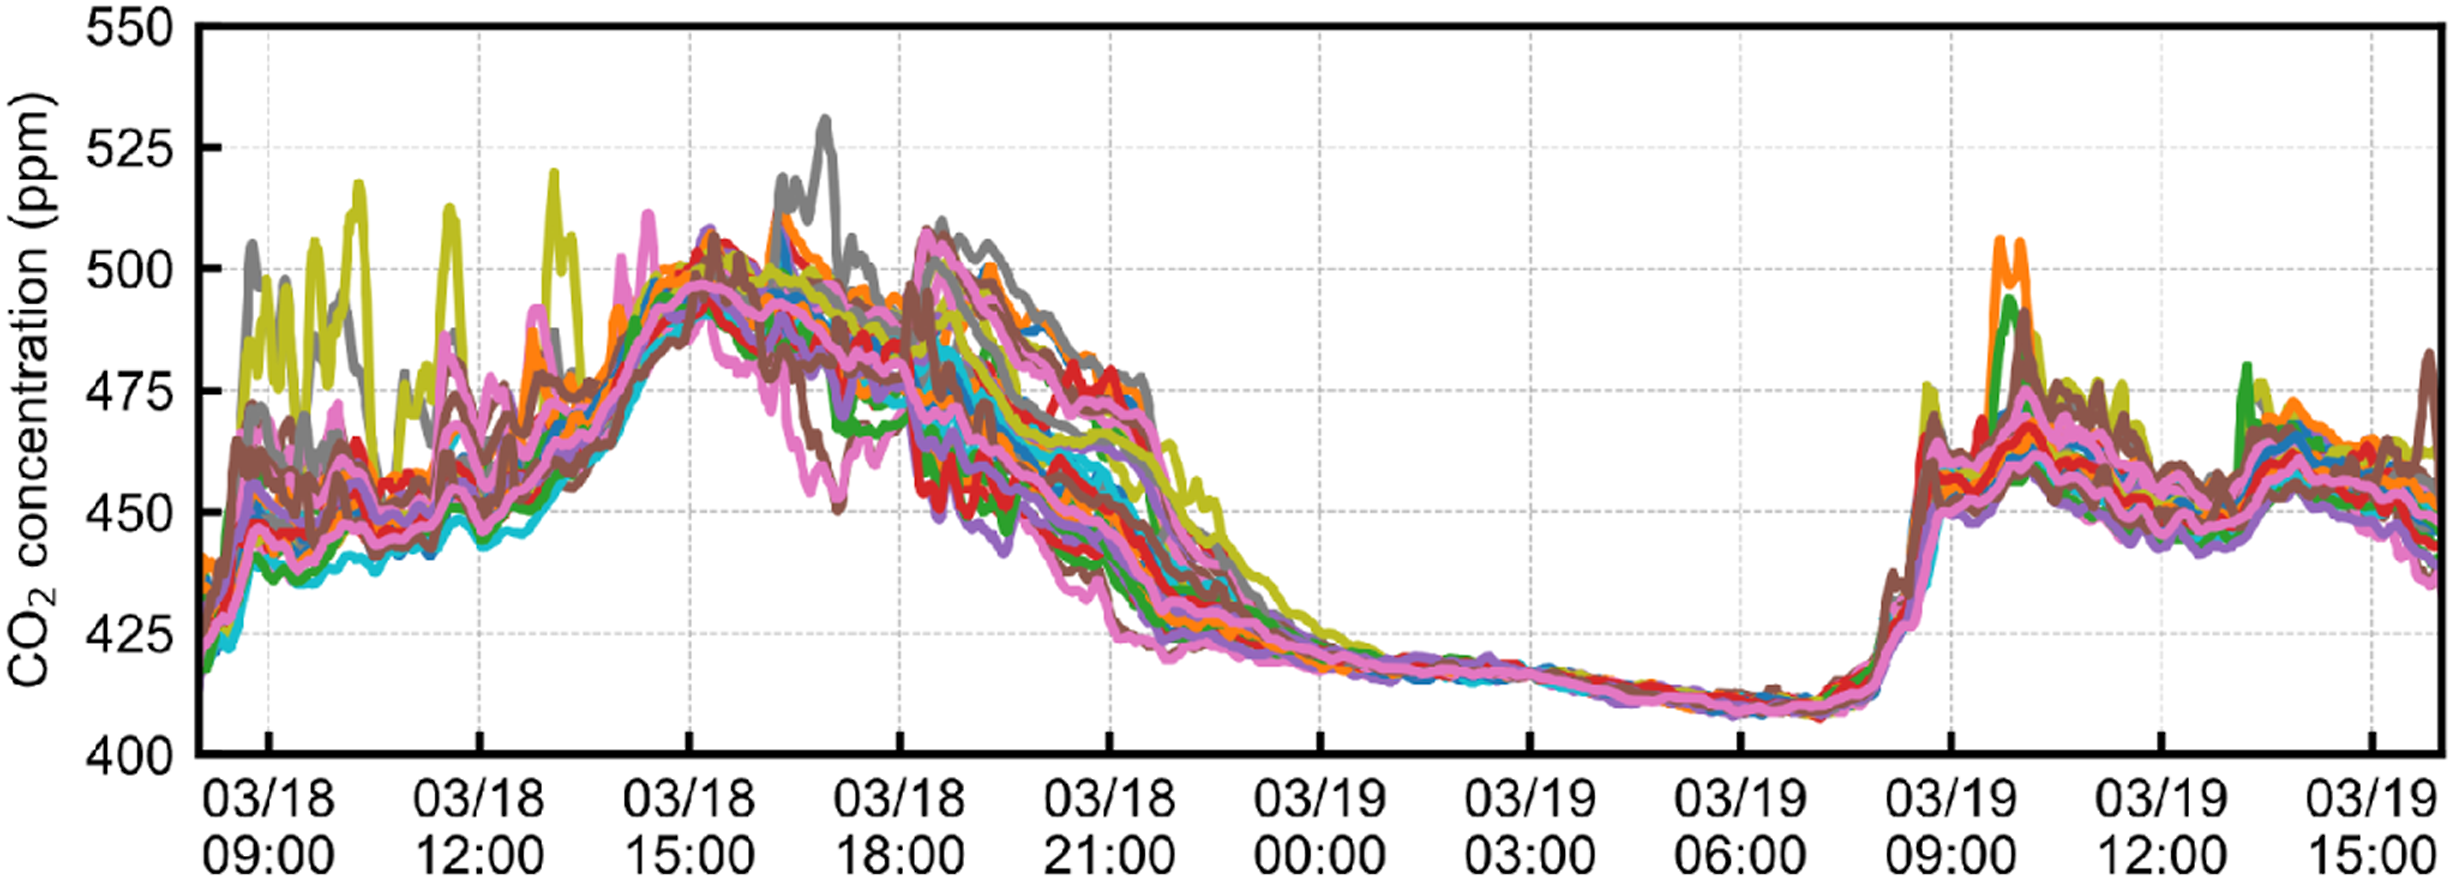
The CO2 concentration was higher during the day than that at night because there were occupants in the office during the day but not at night. The differences in the measured CO2 concentrations between the sensors were small at night but large during the day because of the presumably non-uniform CO2 generation by the occupants during the day. The CO2 concentration in the afternoon of 18 March was higher than that in the morning because of a presumable decrease in the amount of outside air introduced in the afternoon of 18 March . We denoted results at 9:30 on 18 March as a ‘well-ventilated office’ and the results at 16:50 on 18 March as a ‘poorly ventilated office’.
The CO2 concentration distributions in the ‘well-ventilated office’ and ‘poorly ventilated office’ are shown in Figure 9, where the measured positions of occupants are shown as circles. The spatial average CO2 concentration was higher in the ‘poorly ventilated office’ than the ‘well-ventilated office’. The CO2 concentration was lower on the right side than on the left side of the room. This may be because the amount of outdoor air supplied on the right side near the AHU-2 was higher than that on the left side far from the AHU-2 (Figure 3(a)). Distribution of measured CO2 concentration in the (a) ‘well-ventilated office’ and (b) ‘poorly ventilated office’. Circles show the measured positions of occupants.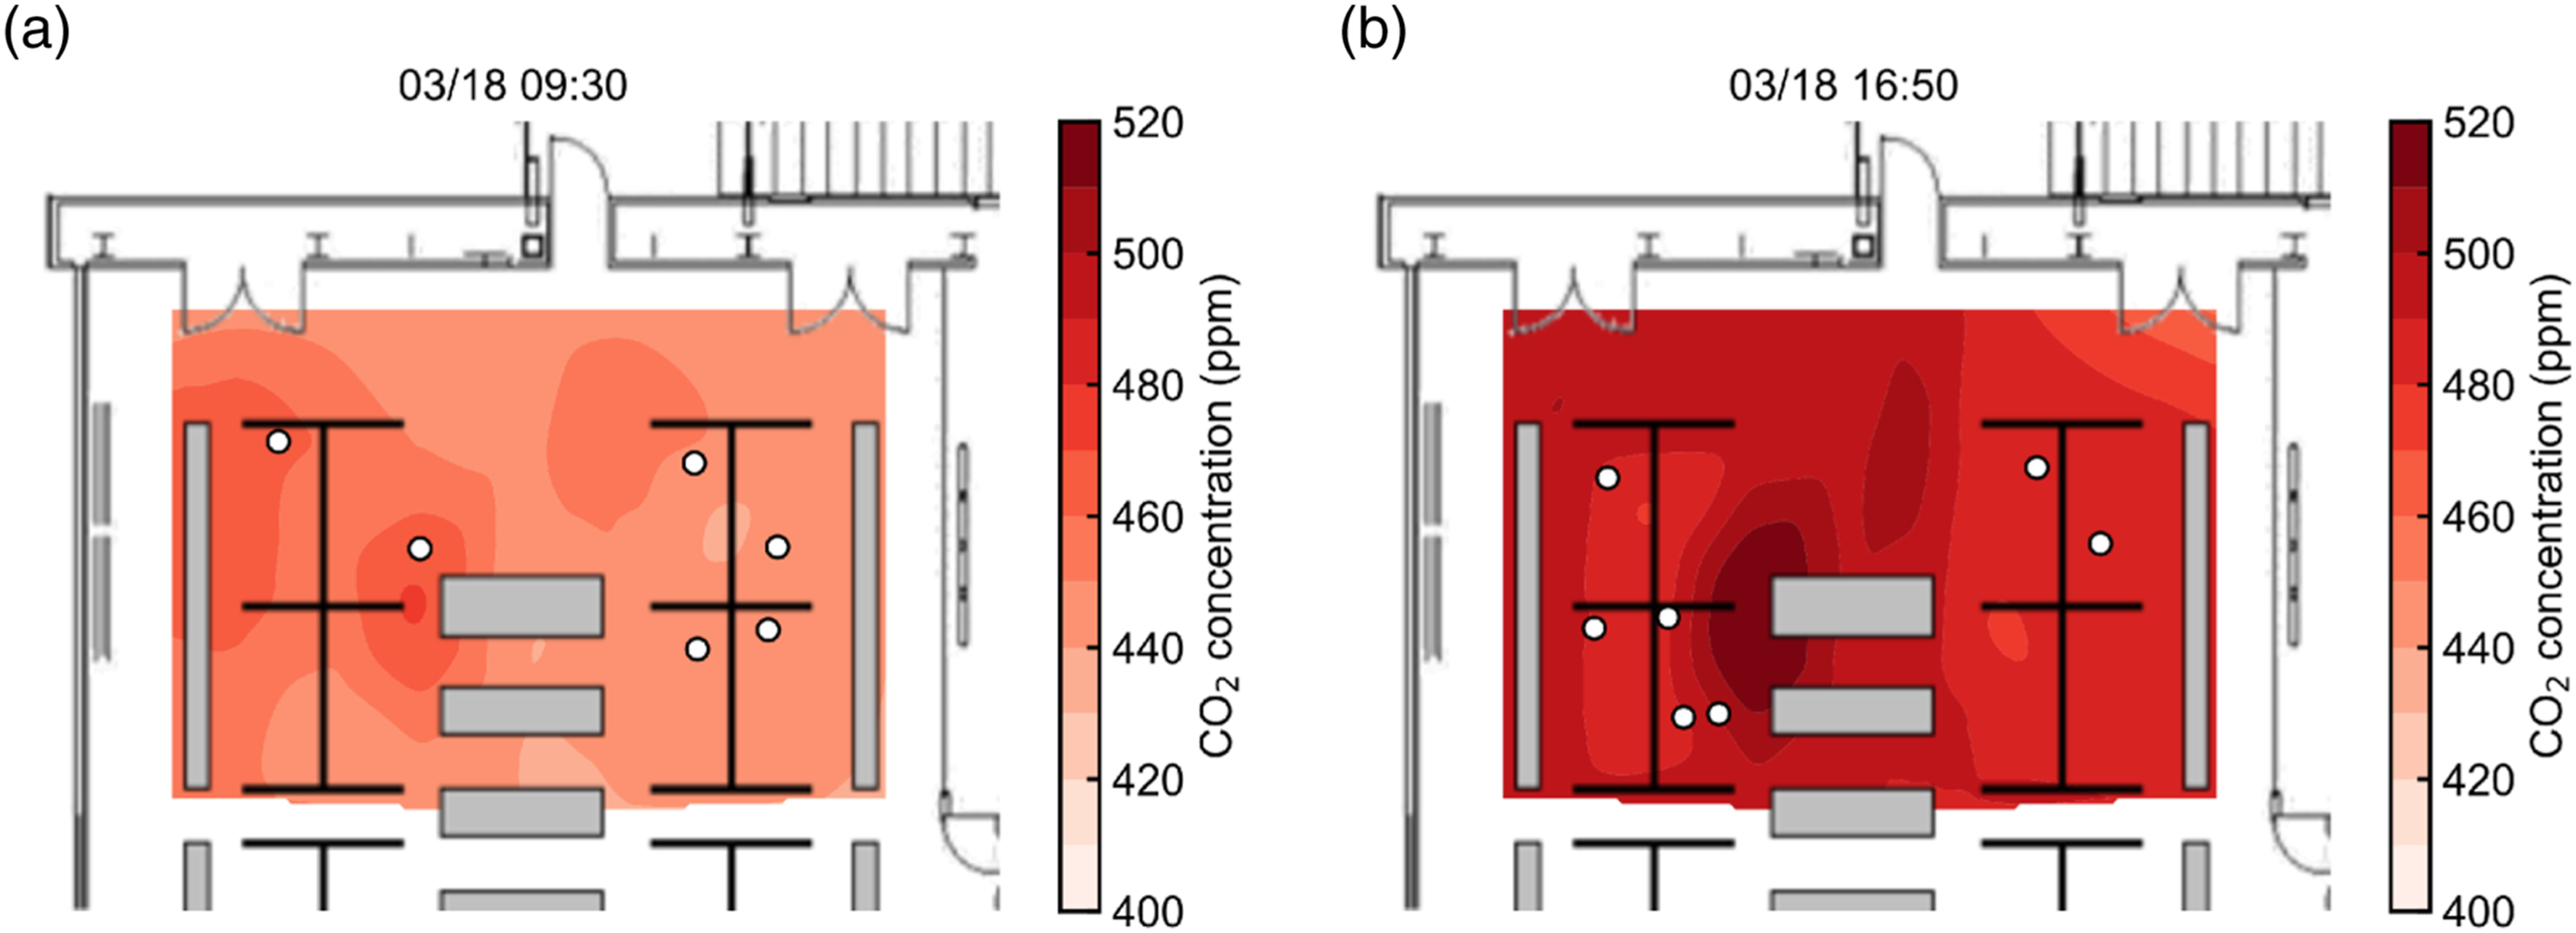
Prediction of infection probability
We predicted the probability of infection using the measured CO2 concentrations and occupant positions. The probability of infection by airborne transmission (
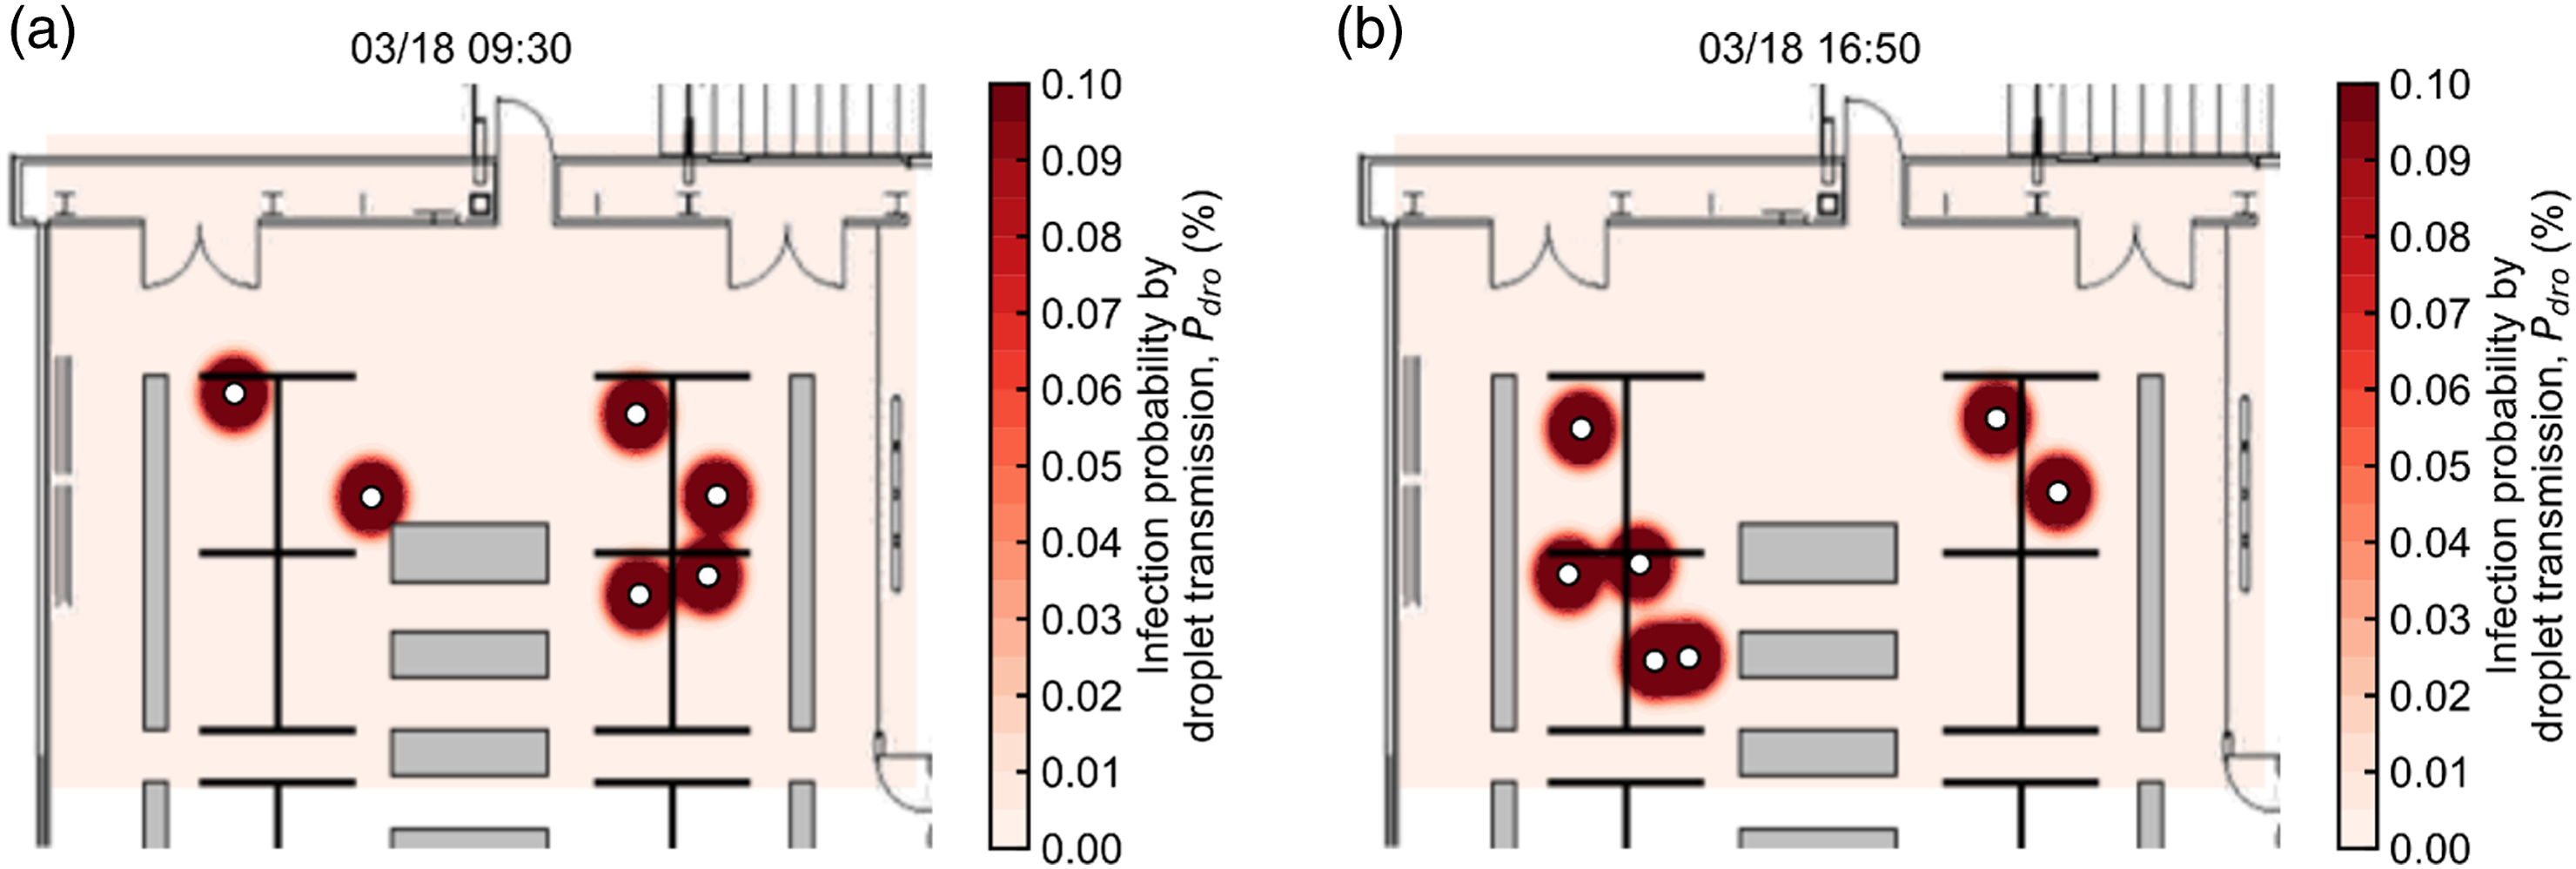
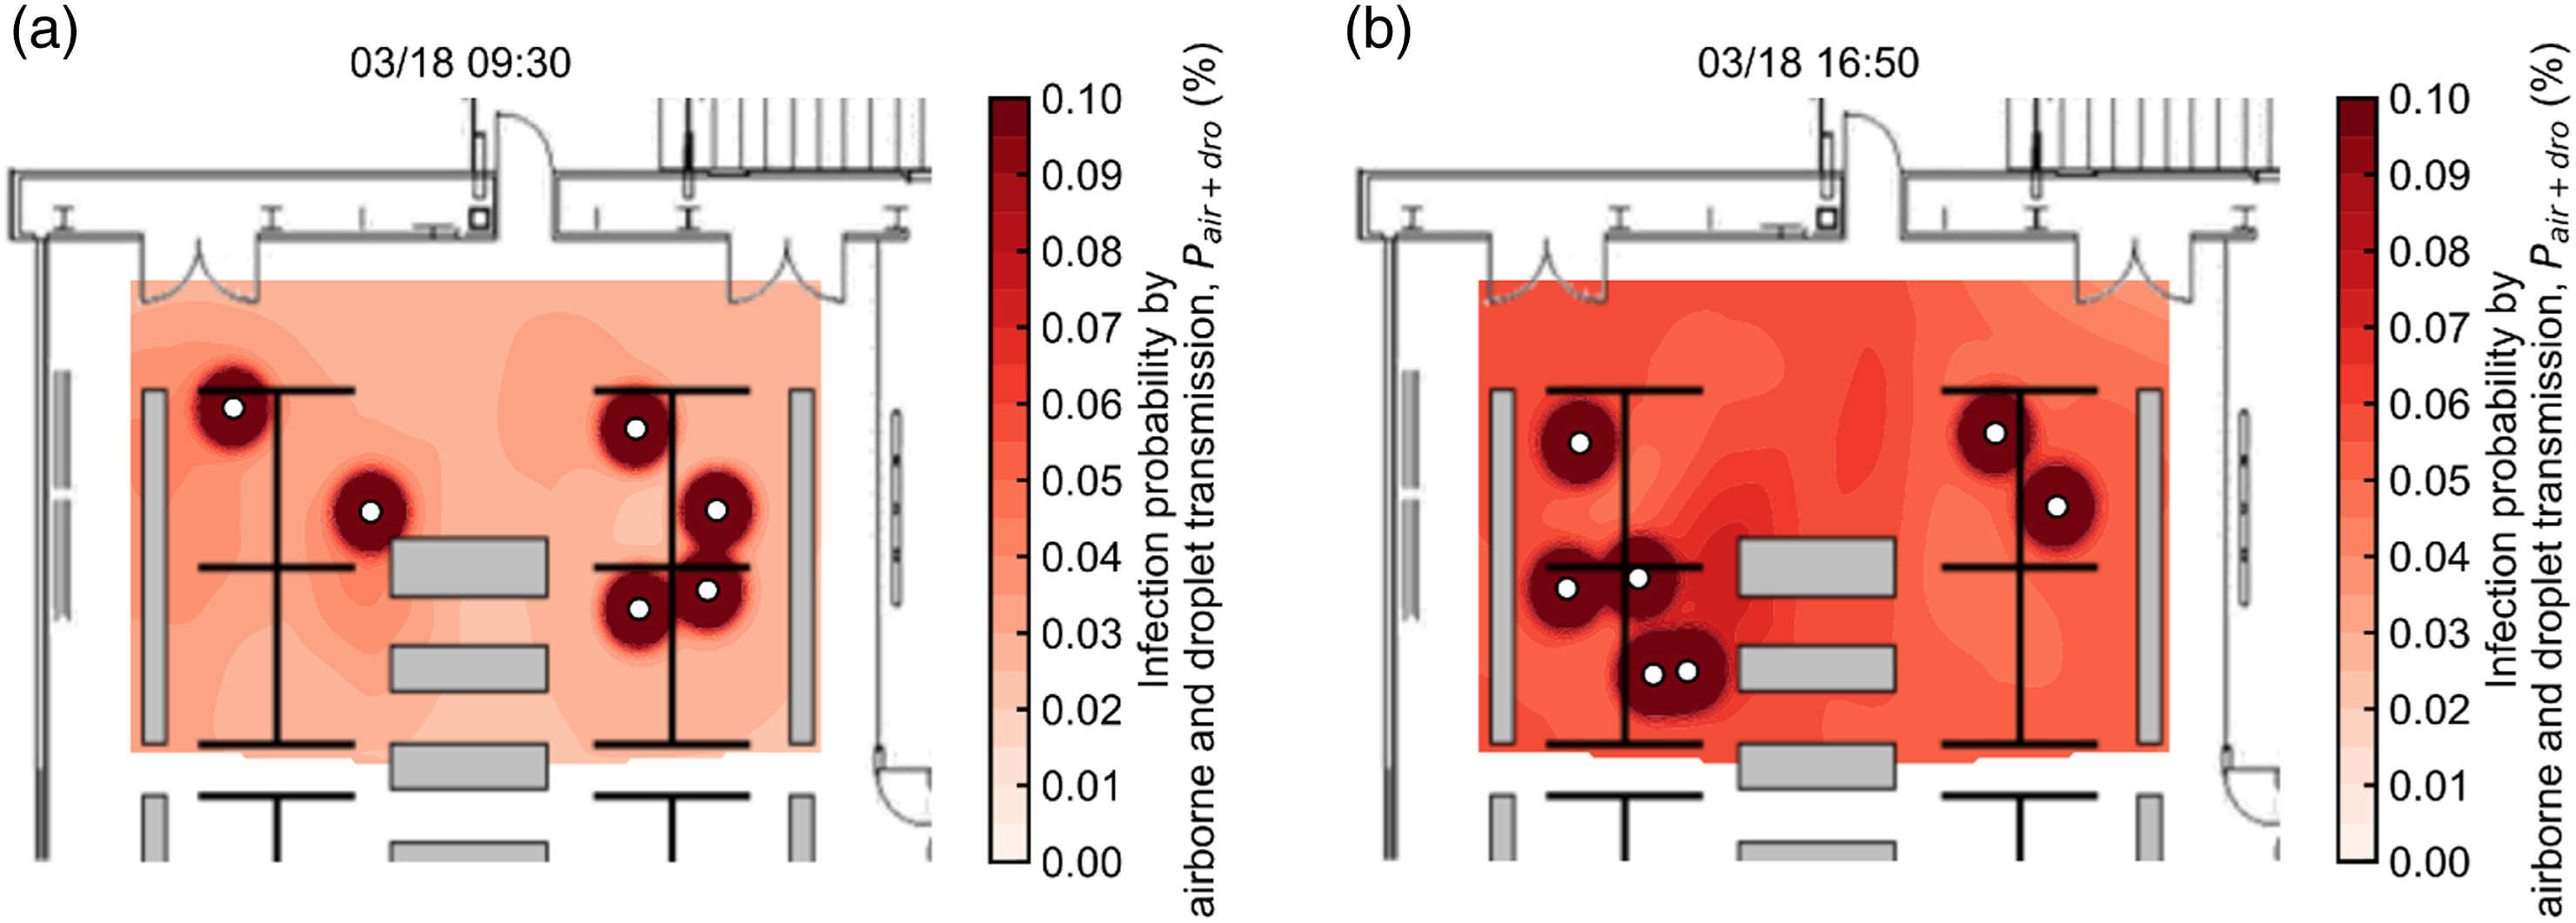
The predicted infection probabilities in the ‘well-ventilated office’ and the ‘poorly ventilated office’ are shown in Figures 10–12. Figure 10 shows that the probability of infection by airborne transmission Probability of infection by airborne transmission Probability of infection by droplet transmission Probability of infection by airborne and droplet transmission 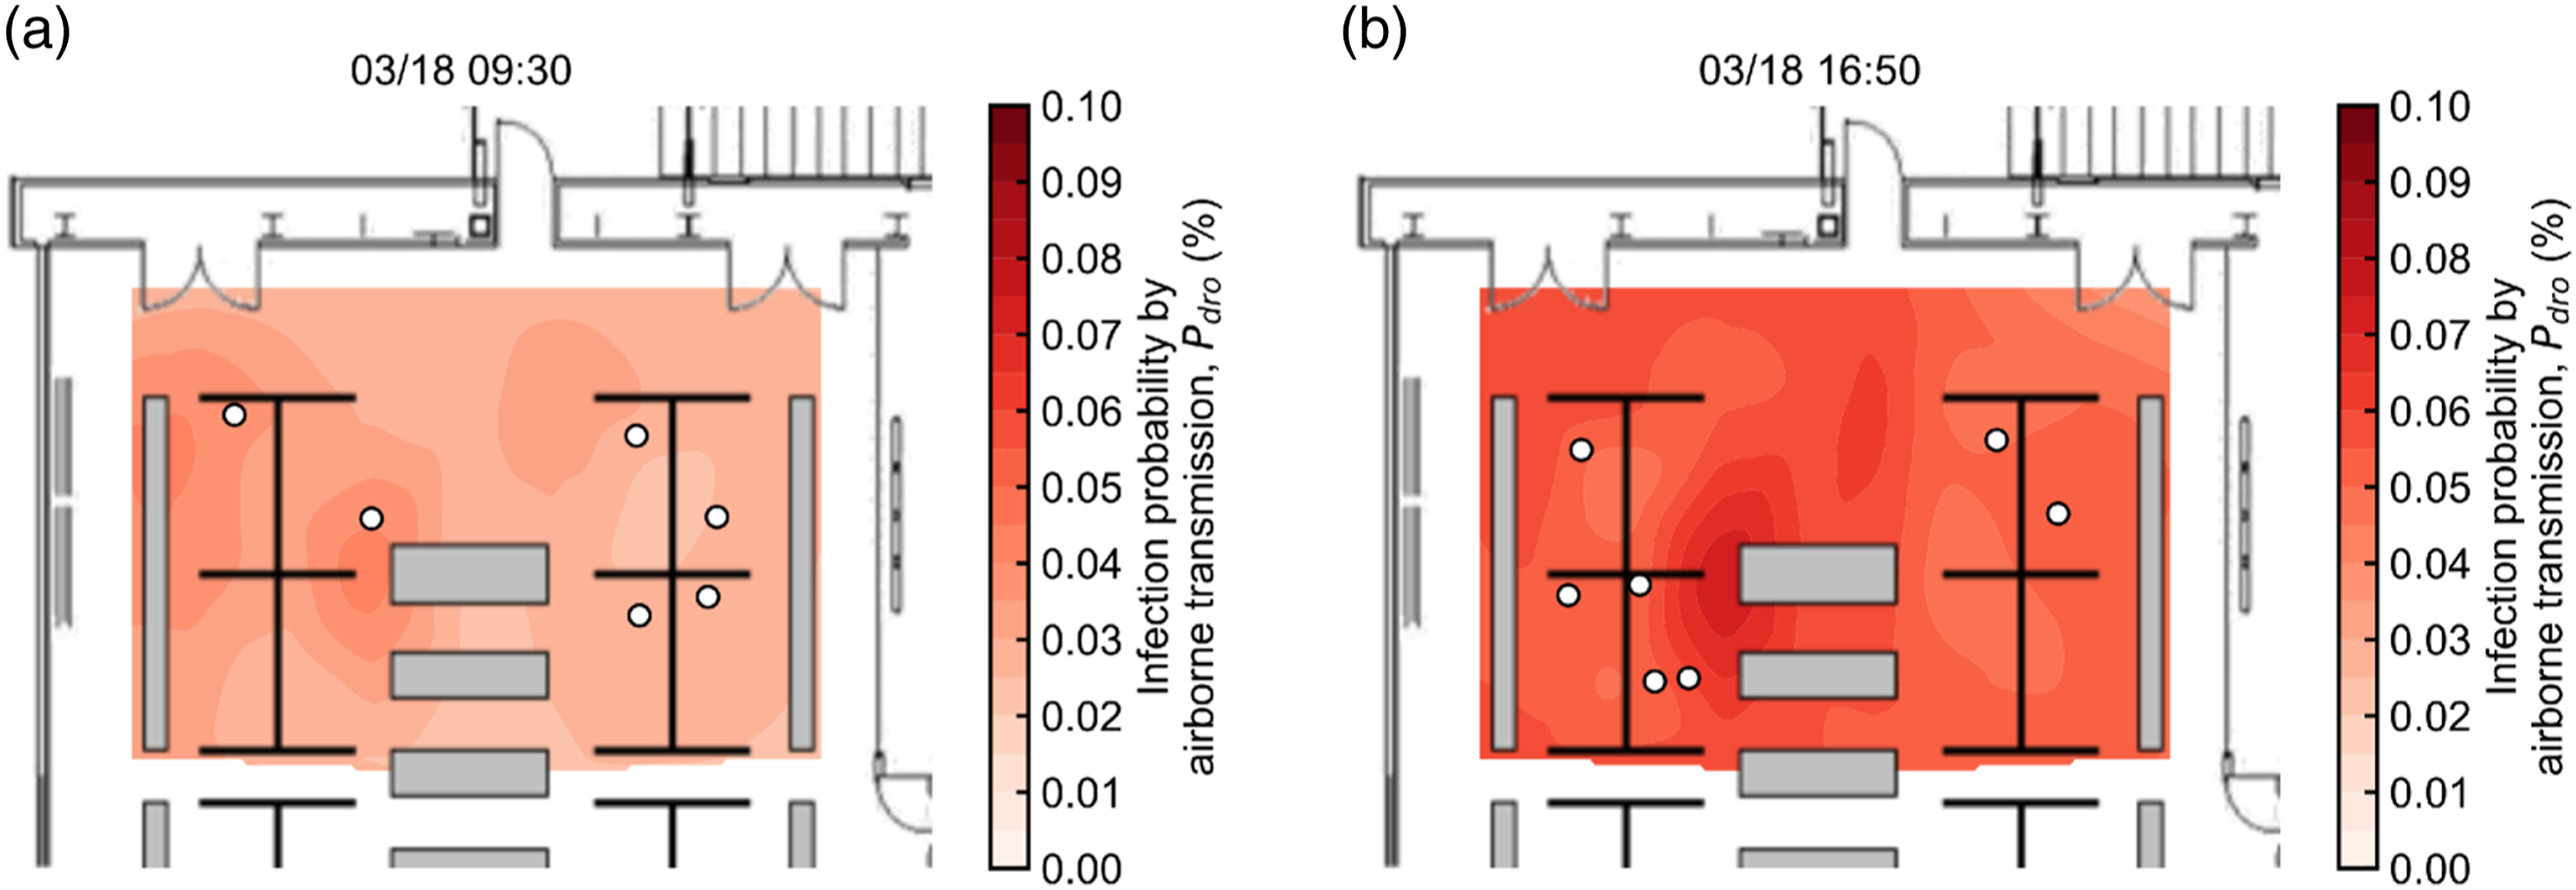
Prediction of the number of disease cases
From equations (12–15), the number of disease cases caused by airborne and droplet transmission Time series of predicted disease cases 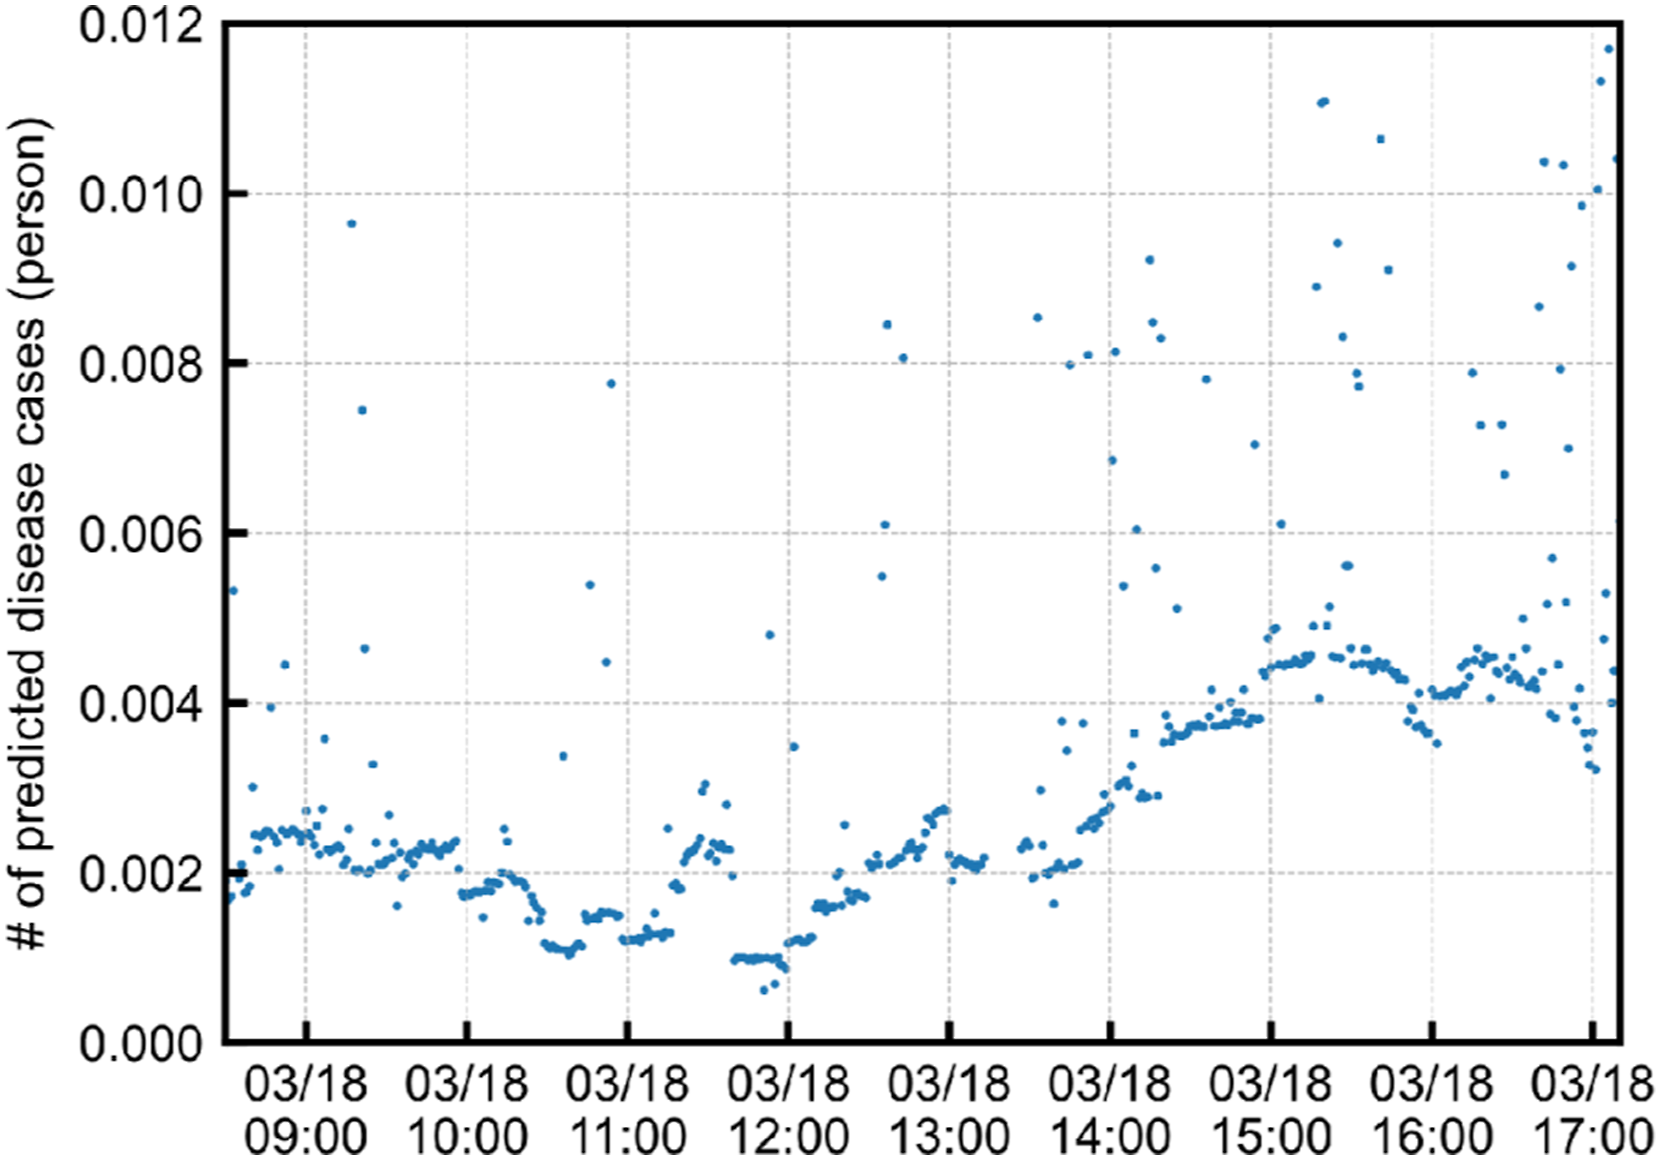
The predicted number of disease cases in the ‘well-ventilated office’ and ‘poorly ventilated office’ is shown in Figure 14. The number of disease cases caused by airborne transmission Predicted disease cases 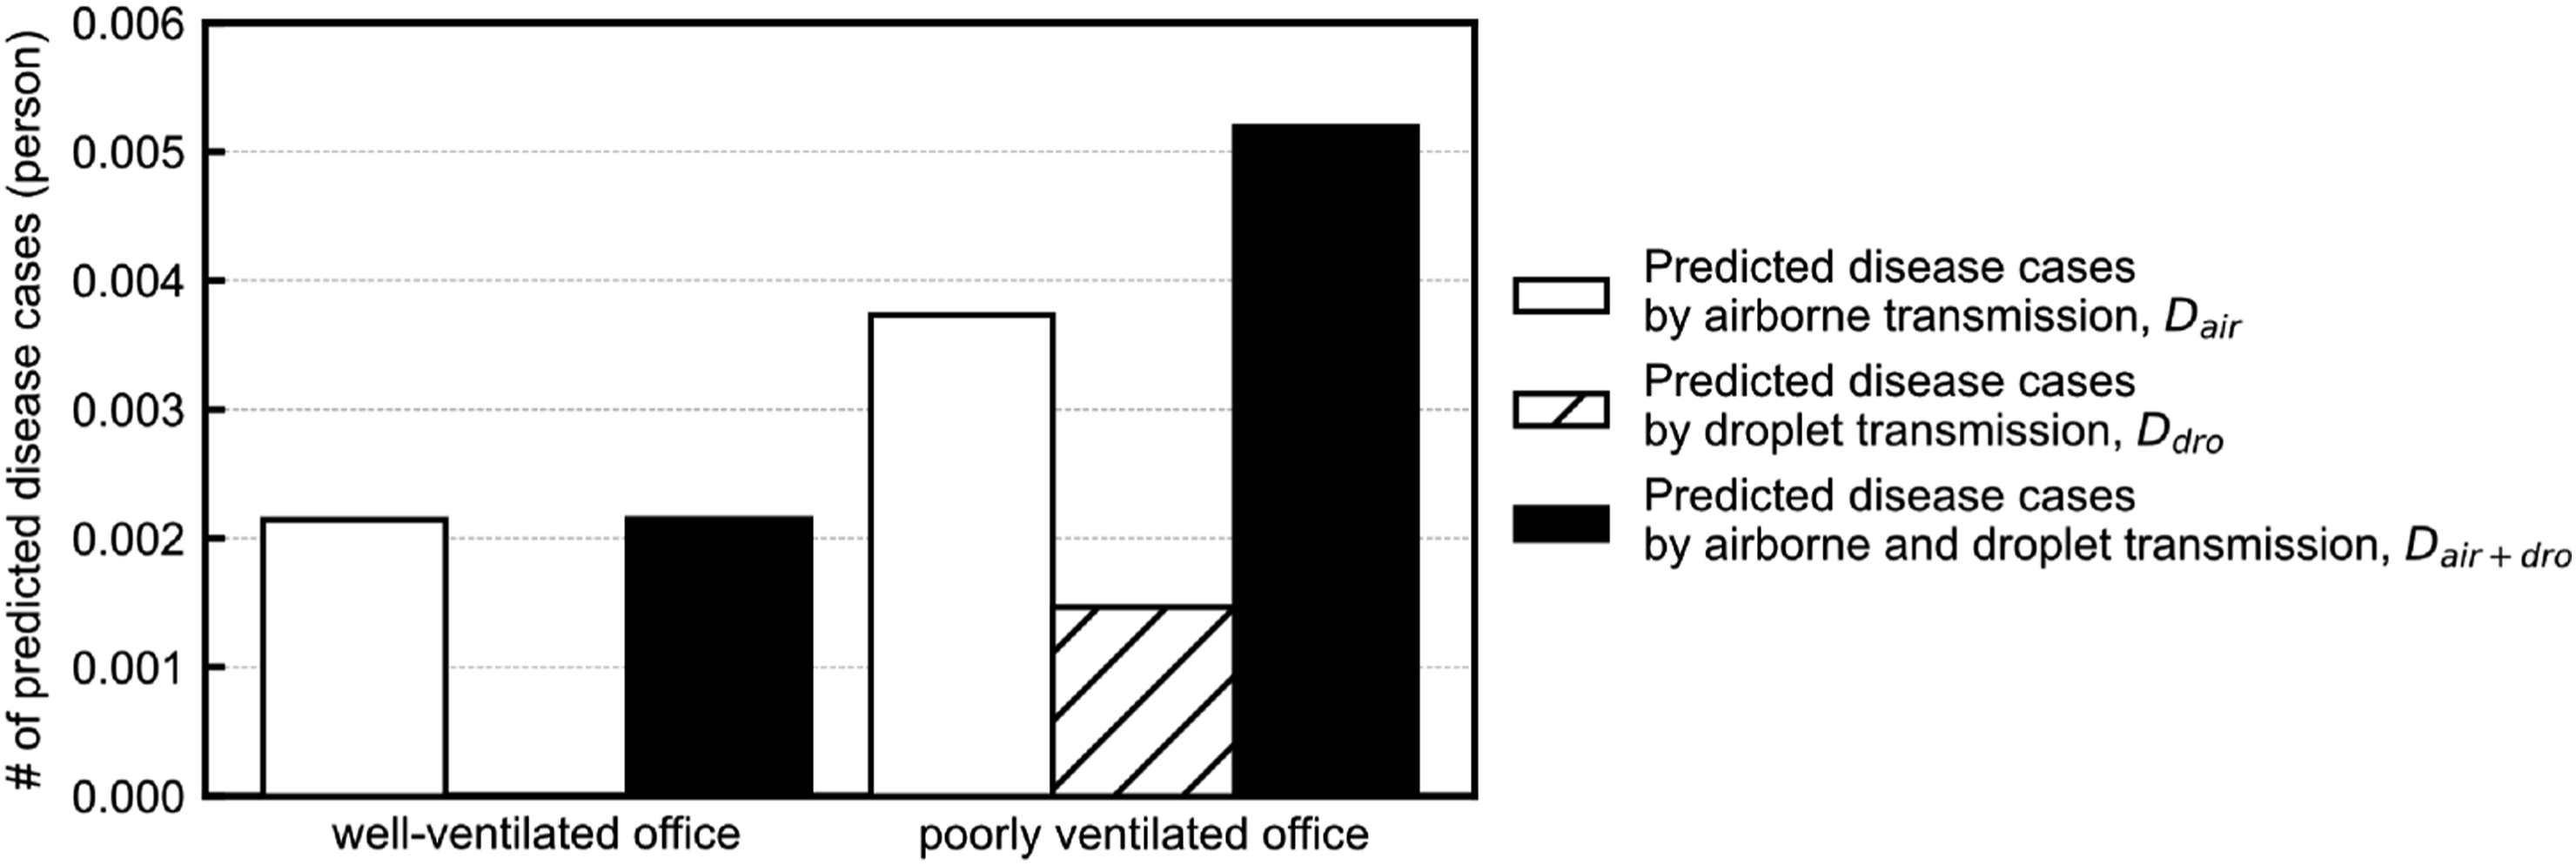
Comparison between cases with measures taken
The probability of infection was predicted for two scenarios, assuming that countermeasures were taken in a ‘poorly ventilated office’, which is called ‘without measure’ in this section. As a countermeasure, the case of ‘increased ventilation’ and a case of ‘wearing a mask’ were assumed. In the ‘increased ventilation’ case, we assumed the difference in CO2 concentration from the outside air to be half of that of 16:50 on 18 March. In the ‘wearing a mask’ case, we altered the quantum generation rate to assume the use of surgical masks. We assumed that wearing a mask would prevent all large droplets from spreading and reduce the spread of airborne particles by 75%.
32
The predicted infection probabilities in the ‘increased ventilation’ and ‘wearing a mask’ are shown in Figure 15. In the ‘increased ventilation’ case (Figure 15 (a)), the probability of infection in ‘areas away from’ people was lower than in the ‘without measures’ case (Figure 12 (b)). Ventilation cannot control the spread of large droplets, resulting in a high probability of infection in the neighbourhood of people. The probability of infection was lower in the ‘wearing a mask’ case (Figure 15 (b)), both away from people and in the neighbourhood of people, compared to the ‘without measures’ case (Figure 12 (b)). Probability of infection by airborne and droplet transmission 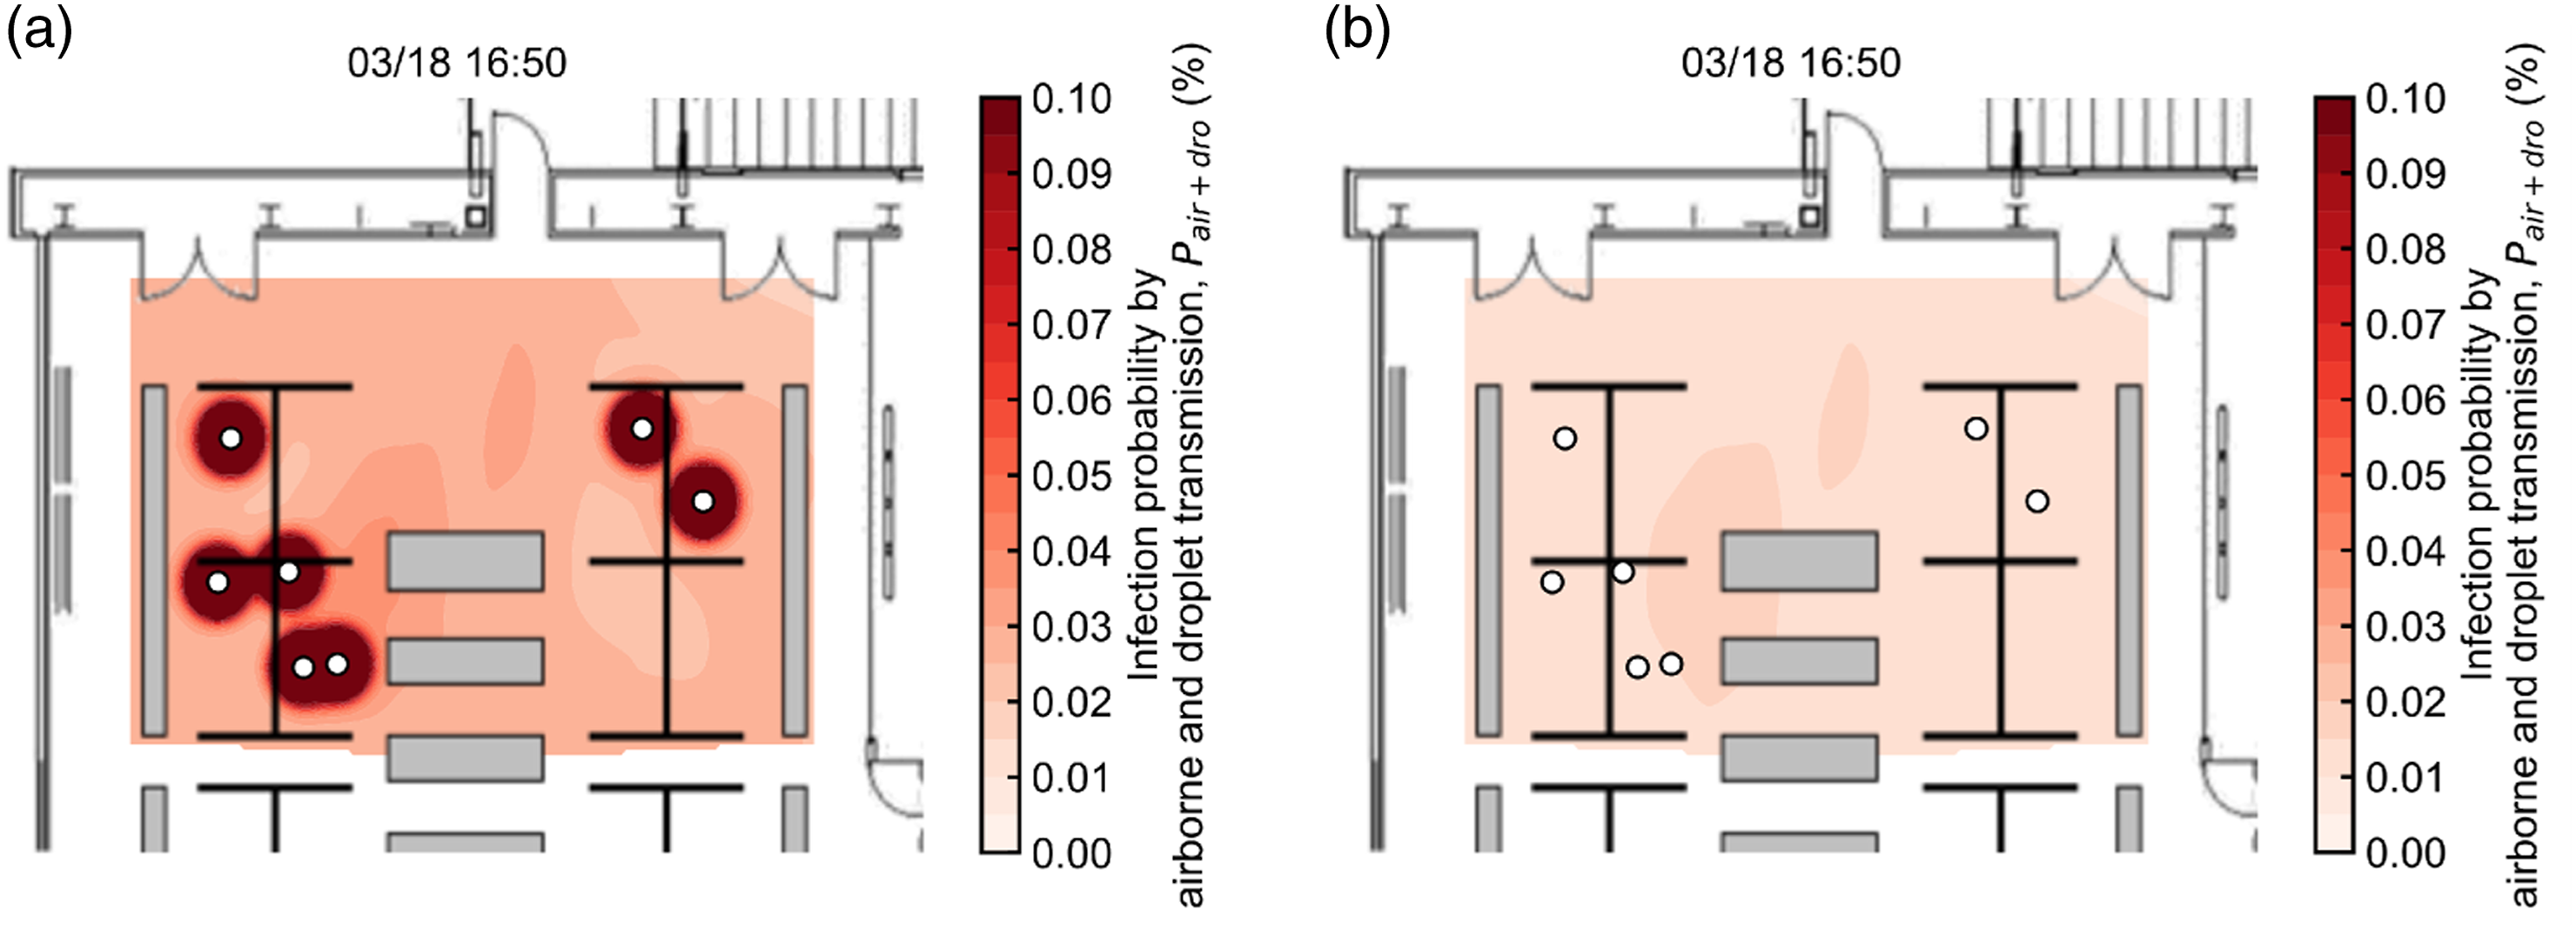
To compare these results quantitatively, the number of disease cases was predicted as shown in Figure 16. In the ‘increased ventilation’ case, the number of disease cases caused by airborne and droplet transmission Predicted disease cases 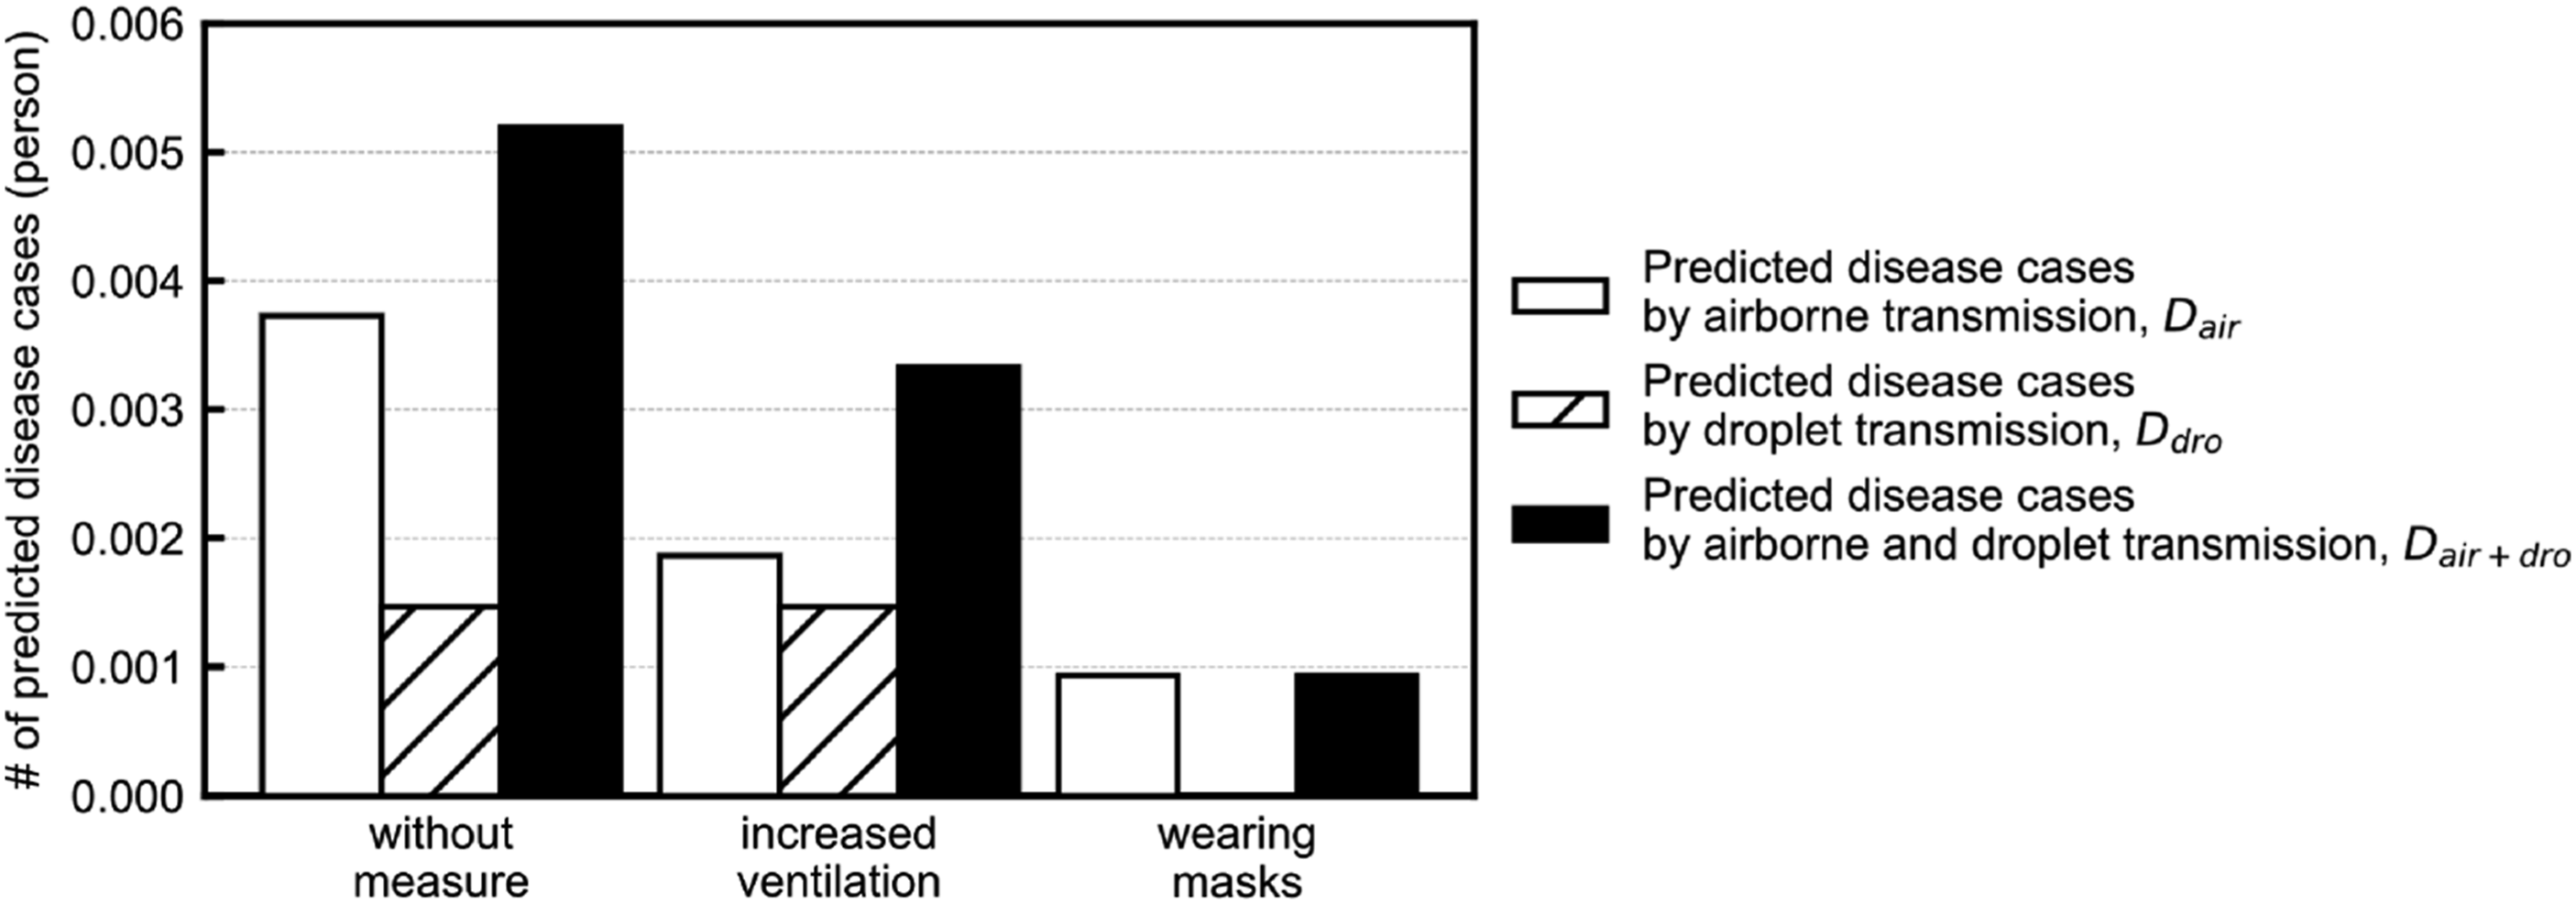
Limitations
(1) The deposition of airborne particles, decrease in viral titres over time, filters for recirculated air in HVAC systems, irradiation with UV-C and individual differences in the quantum generation rate could affect infection.33,34,35 However, the proposed method uses CO2 concentration as a marker for airborne particles; therefore, other factors cannot be considered. If the effects of filters or UV-C can be determined in ways other than CO2 concentration, these effects should be added to the prediction equation. (2) In the proposed method, the fomite transmission was ignored. This is because fomite transmission via surfaces is insignificant compared to that via droplets and airborne particles of SARS-CoV-2.36,37,38 However, the contribution of fomite transmission was not completely absent. Therefore, the proposed method cannot be applied to infectious diseases in which the contribution of fomite transmission is significant. (3) The quanta generation rate varies significantly with individual differences (e.g. super spreader), respiratory activities and activity levels. Additionally, the value varies significantly according to the estimation method. For example, Buonanno et al. (2020)
39
estimated the quanta generation rate due to breathing during light exercise to be 33.9 quanta/h. If this quanta generation rate is adopted to predict the number of disease cases due to airborne transmission in a ‘well-ventilated office’, the number was predicted to be 0.0021, which is 15% of the value obtained in this study (Figure 14). Thus, the prediction of infection probability and number of disease cases involve a significant degree of uncertainty.
Conclusion
In this study, we proposed a method for predicting the distribution of the probability of infection, rather than the room-averaged value. In addition, the probability of infection was predicted by considering both airborne transmission and droplet transmission. The infection probability caused by airborne transmission, which is the transmission by airborne particles suspended in the air for a long time, was predicted based on the CO2 concentration. The infection probability caused by droplet transmission, which is the transmission by droplets that fall to the floor in a short time, was predicted based on the occupant position information. As the prediction accuracy of the method was verified using three patterns of combinations of actual outbreak cases of COVID-19, the difference between the actual infection percentage and predicted infection probability was a maximum of 4 percentage points, which confirms that the prediction accuracy of the method employed in this study is sufficiently high. Notably, only four outbreak cases were used for calibration and validation in this study. Thus, there is a huge uncertainty in the estimation of the parameters. By applying this method to an actual office, the infection probability was confirmed to be relatively high in a zone where the amount of outdoor air supply was relatively small. Therefore, the proposed method can be used to predict the infection probability quantitatively by integrating the ventilation efficiency and the distance between occupants that is unique to each building. Furthermore, disease cases were predicted, and the predicted number of disease cases caused by droplet transmission was not negligible when a pair of occupants were at a close distance. Therefore, it was confirmed that it is possible to analyse the relative effectiveness of countermeasures against airborne transmission and droplet transmission and study infection control strategies that are unique to a given building using the proposed method.
This study is unique in that (1) a method for predicting the distribution of the infection probability, rather than the room-averaged value, was developed and (2) the predicted infection probability considers both airborne transmission and droplet transmission. Using the proposed method and monitoring the infection probability in real-time, the relative effectiveness of countermeasures against airborne transmission and droplet transmission could be analysed, and a facility manager could consider strategies for infection control. Using the proposed method, facility users can check the infection probability distribution in real time to select a seat with a minor risk of infection.
Footnotes
Acknowledgements
The authors would like to express the deepest appreciation to Dr. Hisashi Hasebe, Mr. Nobuhiro Miura, Dr. Takashi Kurihara, Dr. Kengo Tomita and Dr. Keichi Suzuki of Shimizu Corporation for their kind support and beneficial discussion in this research project.
Author contributions
Miguel Yamamoto: conceptualization (equal); formal analysis (lead); visualization (lead); investigation (equal); methodology (equal); project administration (equal); software (lead); validation (equal); writing‐original draft preparation (lead) and writing‐review and editing (equal). Akihiro Kawamura: conceptualization (equal); data curation (lead); investigation (equal); methodology (equal); project administration (equal) and writing‐review and editing (equal). Shin-ichi Tanabe: supervision (equal); investigation (supporting); project administration (equal) and writing‐review and editing (equal). Satoshi Hori: supervision (equal); investigation (supporting); project administration (equal) and writing‐review and editing (equal).
Data availability
The data that support the findings of this study are available from the corresponding author upon reasonable request.
Declaration of conflicting interests
The author(s) declared no potential conflicts of interest with respect to the research, authorship, and/or publication of this article.
Funding
The author(s) received no financial support for the research, authorship, and/or publication of this article.
Correction (September 2023):
The Funding section of the article has been updated since its original publication.