
Abstract
Since the COVID-19 pandemic, the ventilation of school buildings has attracted considerable attention from the general public and researchers. However, guidance to assess the ventilation performance in classrooms, especially during a pandemic, is still lacking. Therefore, aiming to fill this gap, this study conducted a full-scale laboratory study to monitor the CO2 concentrations at 18 locations in a classroom setting under four different ventilation regimes. Additionally, a field study was carried out in two Dutch secondary schools to monitor the CO2 concentrations in the real classrooms with different ventilation regimes. Both the laboratory and field study findings showed that CO2 concentrations varied a lot between different locations in the same room, especially under natural ventilation conditions. The outcome demonstrates the need of monitoring the CO2 concentration at more than one location in a classroom. Moreover, the monitored CO2 concentration patterns for different ventilation regimes were used to determine the most representative location for CO2 monitoring in classrooms. For naturally ventilated classrooms, the location on the wall opposite to windows and the location on the front wall (nearby the teacher) were recommended. For mechanically ventilated classrooms, one measurement location seemed enough because CO2 was well-mixed under this ventilation regime.
Introduction
The ongoing pandemic of the Coronavirus disease 2019 (COVID-19) has created public concern about indoor air quality (IAQ) and room ventilation, especially in public spaces with many people such as school buildings. To determine whether such a space is ventilated properly, the CO2 concentration is monitored and used as a proxy for ventilation performance. 1 The history of CO2 as an indicator of the amount of ventilation can be traced back to 1858.2,3 Later, CO2 monitoring became gradually a convenient way to monitor IAQ.4–6 A CO2 concentration of 1800 mg/m3 (or 1000 ppm) was often taken as the upper limit for a good IAQ, according to the previous version of ASHRAE (American Society of Heating, Refrigerating and Air-Conditioning Engineers) Standard 62-1989, Ventilation for Acceptable Indoor Air Quality. Currently, relevant standards 7 mainly use minimum ventilation rates as the design criteria, while CO2 is the most commonly used tracer gas for calculating ventilation rate.8–10 To date, many studies have been conducted to measure the CO2 concentration in school classrooms around the world to examine whether the ventilation performance in classrooms fulfils the requirements.9,11–13 However, CO2 monitoring protocols used in these studies varied a lot: the selected number and location of sensors mainly depended on researchers’ personal experiences. 14 It seems that no consistent guidance for CO2 monitoring exists, yet.
One of the key standards for CO2 monitoring is the ISO 16000-26, 15 according to which the sampling location is suggested to be at the centre of the room with a height of 1.0–1.5 m above the floor, representing the breathing zone of occupants. However, in ANSI/ASHRAE Standard 62.1, 16 the height of the breathing zone is described as 0.75–1.8 m above the floor and based on that the LEED recommends 0.9–1.8 m above the floor as the sampling height for CO2. 17 In terms of the horizontal location, instead of the centre, ASTM International (former American Society for Testing and Materials) 10 stipulates that the measurement point should be 2.0 m away from occupants to avoid local effects. Apart from the location of the sampling point, little information about the number of measurement points can be found in current standards.
In the Netherlands, the Fresh Schools 2021 program (Programma van Eisen Frisse Scholen 2021) is the most used guidance on the indoor environment quality in school buildings. In this guidance, the ventilation rate is suggested for three different levels: level A, B and C. 18 However, no requirement regarding the monitoring protocol, including the number and location of the measurement point, can be found in this guidance. This lack of clear guidance on CO2 monitoring can lead to inaccurate results since the indoor CO2 concentration might vary per location. 19
Several studies have proposed that a single measurement location could be appropriate for rooms with high ventilation rates and constant occupancy.20–22 Accordingly, many researchers only selected one measurement point, usually at the centre of the room or in the occupied area.23–25 For example, both the study conducted by Hou et al. 24 in four classrooms of two primary schools in Beijing, China, and the study carried out by Schibuola et al. 23 in three classrooms of two secondary schools in Italy, measured the CO2 concentration in the middle of classrooms. Similarly, Bako-Biro et al. 26 also measured the CO2 concentration only at one point near occupants in 16 classrooms of eight primary schools in the UK to investigate the ventilation conditions in these classrooms. However, based on the results found by Cao et al. 27 and Mui et al., 28 the CO2 distribution in a room is not spatially consistent, which means that measurements at a single point cannot be representative of the average concentration in the whole room. Such disadvantage was taken into consideration by several other studies, in which the authors selected multi-points to increase the measurement accuracy.29–31 For example, the study carried out by Franco and Lecces 32 in which four locations were selected in the larger classrooms to minimise the influence of the location of the sensors. The studies performed by Wargocki33,34 in two classrooms in which the CO2 concentrations were measured at three locations: supply, exhaust and occupied areas to achieve an accurate calculation of ventilation rates. The CFD simulation studies conducted by Cao et al. 27 and Ren and Cao 35 in which at least three sensors were recommended to be used to obtain more information.
Apart from the number of measurement points, the height of measurement points selected by previous researchers also varied among different studies, due to a lack of consistent guidance. The most common measurement points were near the seated height in classrooms,26,31,36,37 1.1 m30,38,39 and 1.2 m,24,40,41 while the highest could be 2.2 m33,34 and the lowest could be 0.65 m 42 above the floor. Besides these studies, other researchers did not provide clear information about measurement locations.11,12,43
In addition to measurement locations, researchers’ opinions on the monitoring of outdoor CO2 concentration also do not concur. Some researchers measured the CO2 level at one outdoor location per school together with the indoor ones; 44 others measured outside the windows of each of the target classrooms 45 and some just used the empirical constant such as 350 or 400 ppm as the outdoor CO2 concentration. 46 Since the outdoor CO2 concentration can also vary depending on the location and the time, 47 the different outdoor CO2 monitoring procedures may affect the accuracy of the investigation. Moreover, considering the influence of occupants’ number, age and activities on CO2 generation, the related inspection and recording should be specified as well. 47
Given the fact that the CO2 concentration might vary between different indoor locations, 19 and the CO2 distribution might be different under different ventilation regimes, a detailed CO2 monitoring protocol including different strategies that are applicable for different ventilation regimes is needed to better assess the ventilation conditions in classrooms. To achieve that, full-scale experiments with multiple measurement locations, as suggested by Mahyuddin and Awbi, 14 should be carried out under different ventilation conditions. Therefore, this study aims to (1) conduct a full-scale experiment in the SenseLab 48 to better understand the CO2 distribution in a room under different ventilation regimes; (2) develop consistent CO2 monitoring guidance and (3) to perform a field study to validate and improve this guidance.
Methods
Full-scale experiment
Experimental procedure and ventilation regimes.
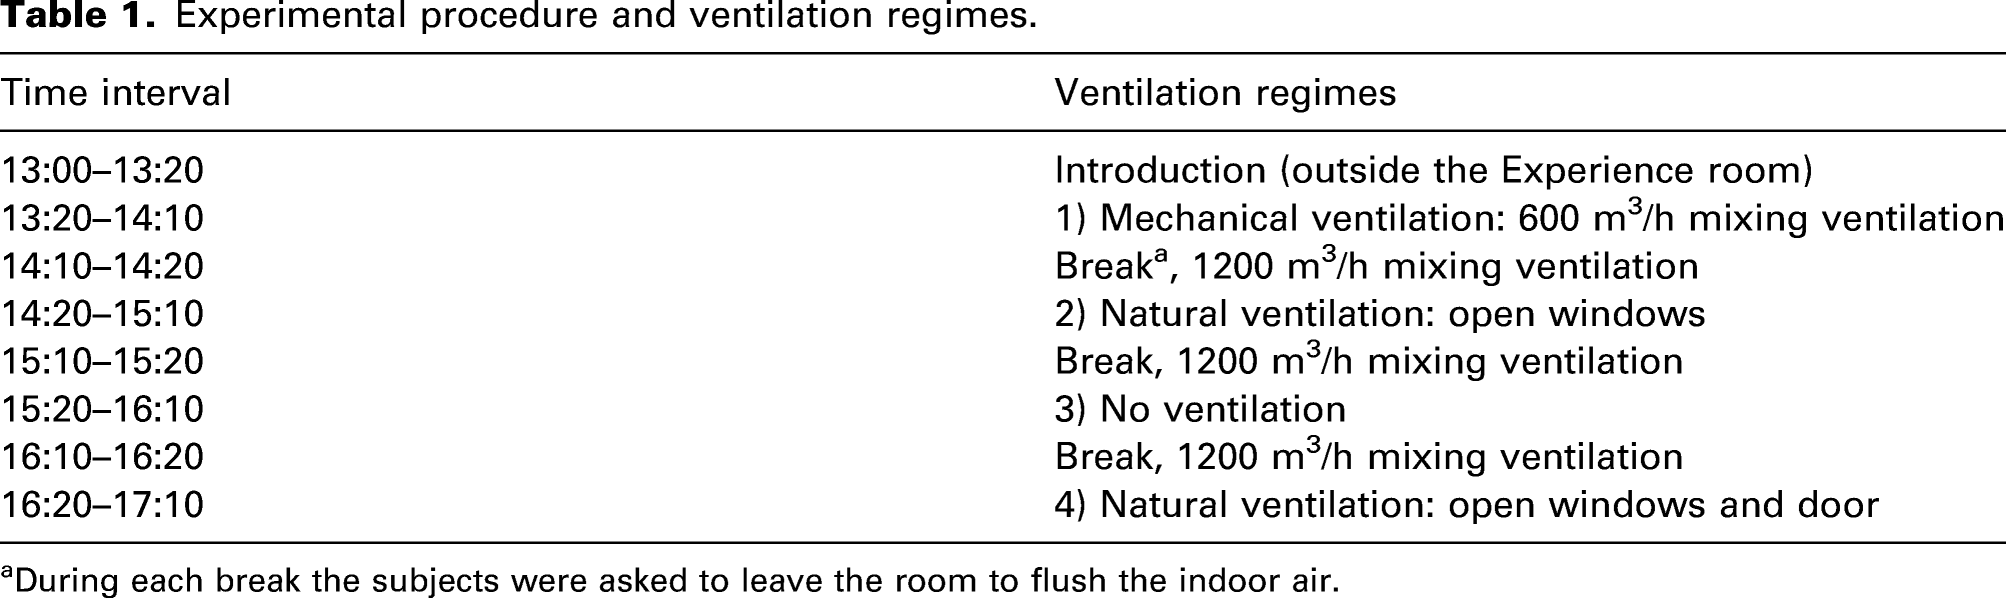
aDuring each break the subjects were asked to leave the room to flush the indoor air.
The CO2 measurements were conducted for four different ventilation regimes: (1) mixing ventilation with a ventilation rate of 600 m3/h (air exchange rate of 8.8 h−1 with air velocity of 0.03 m/s measured at air inlets, which was chosen based on the adjustable range of the ventilation system of the SenseLab and the level suggested by ASHRAE (air exchange rate 4–6 h−1)); 16 (2) natural ventilation with windows open; (3) no ventilation, with the mechanical system turned off and windows and door closed and (4) natural ventilation with windows and door open. Each regime lasted 50 minutes, which is approximately the duration of one normal lesson at Dutch secondary schools (based on the observation in the field study). To reset the CO2 concentration to the default level (outdoor concentration), a ten-minute break between two test conditions was introduced. Considering the ventilation capacity of the system used in the Experience room and the time constraints, the ventilation rate was set to 1200 m3/h during the break. The CO2 concentration was measured and recorded every 30 s by HOBO® CO2 loggers (type: MX1102), with an accuracy of ±50 ppm ±5% of reading in the range of 0–5000 ppm.
To get a comprehensive understanding of the CO2 distribution, 18 indoor and one outdoor measurement points were selected to perform the monitoring simultaneously. As shown in Figure 1, six sensors were placed on desks at a height of 1.1 m above the floor (position ‘D’); two sensors were placed at the centre of the room (position ‘C’) at a height of 1.1 m and 1.6 m above the floor (to represent the height of the head when sitting and standing, respectively); two sensors were placed at the teacher’s location (position ‘T’) at a height of 1.1 m (sitting) and 1.6 m (standing) above the floor; eight sensors were placed on the four walls (position ‘W’) also at a height of 1.1 m and 1.6 m above the floor and one sensor was placed outside one window (position ‘O’) to measure the outdoor CO2 concentration. Distribution of sensors in the Experience room.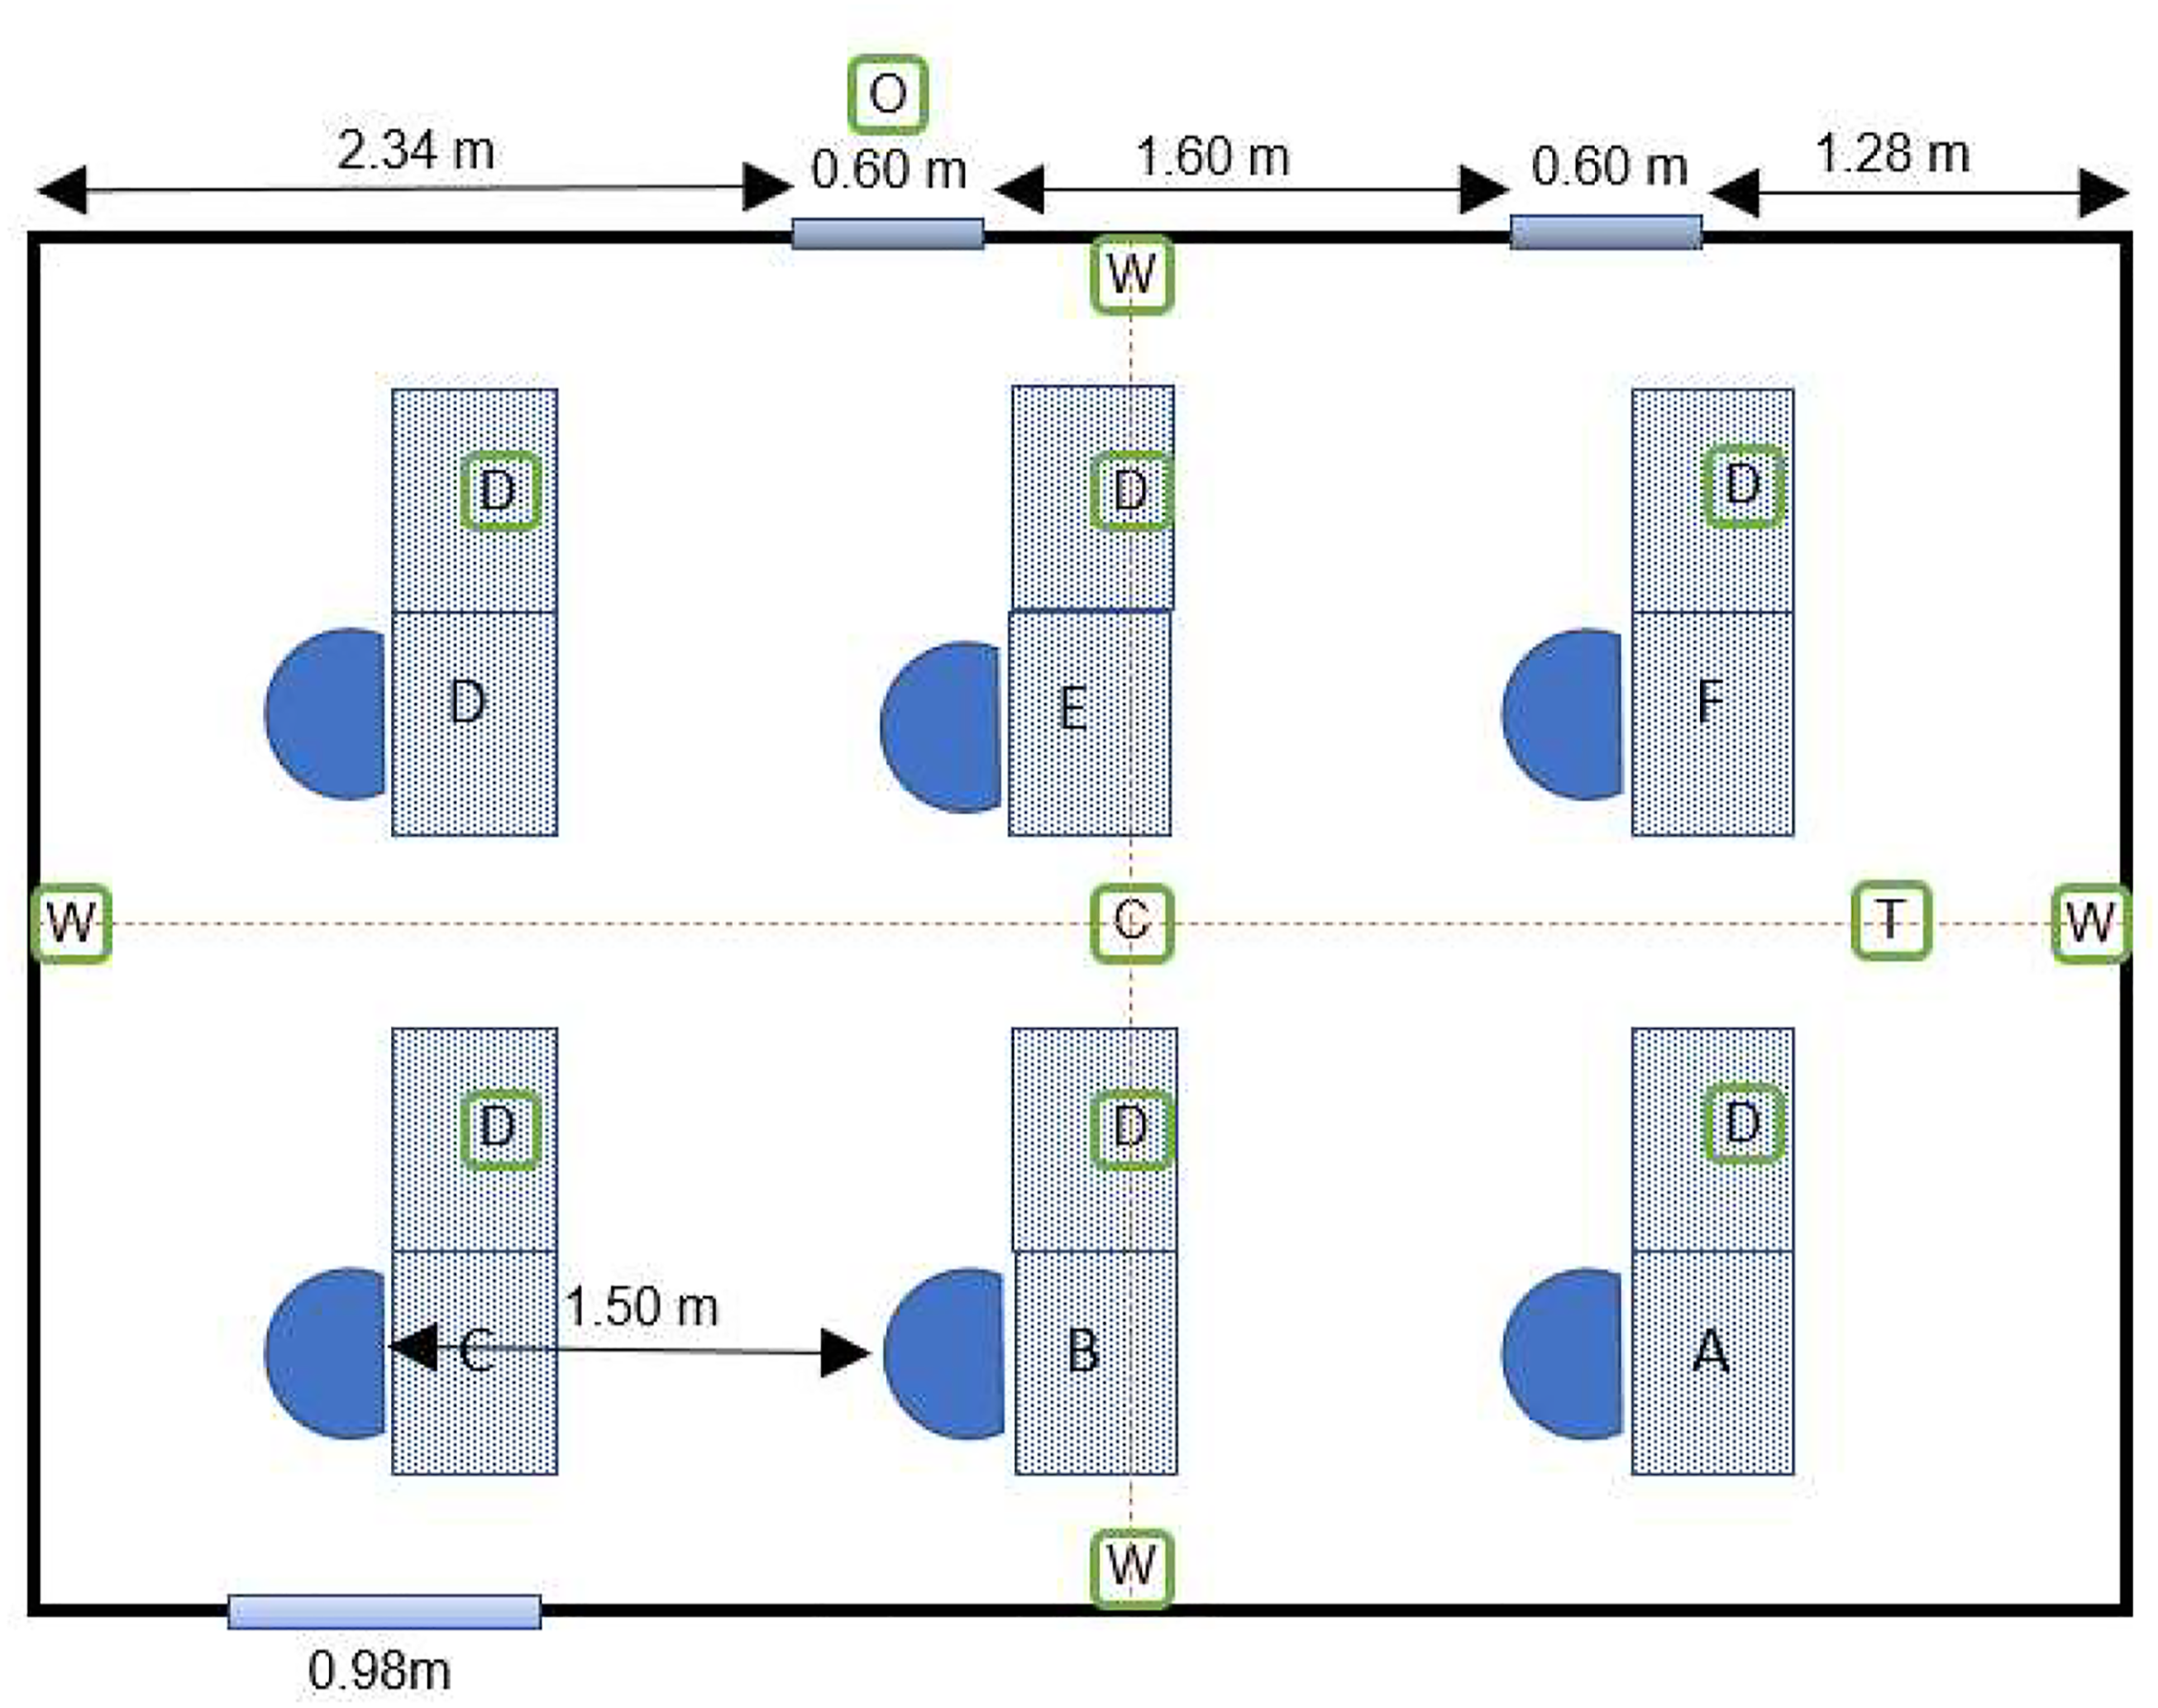
Field study
Characteristics of the investigated classrooms.
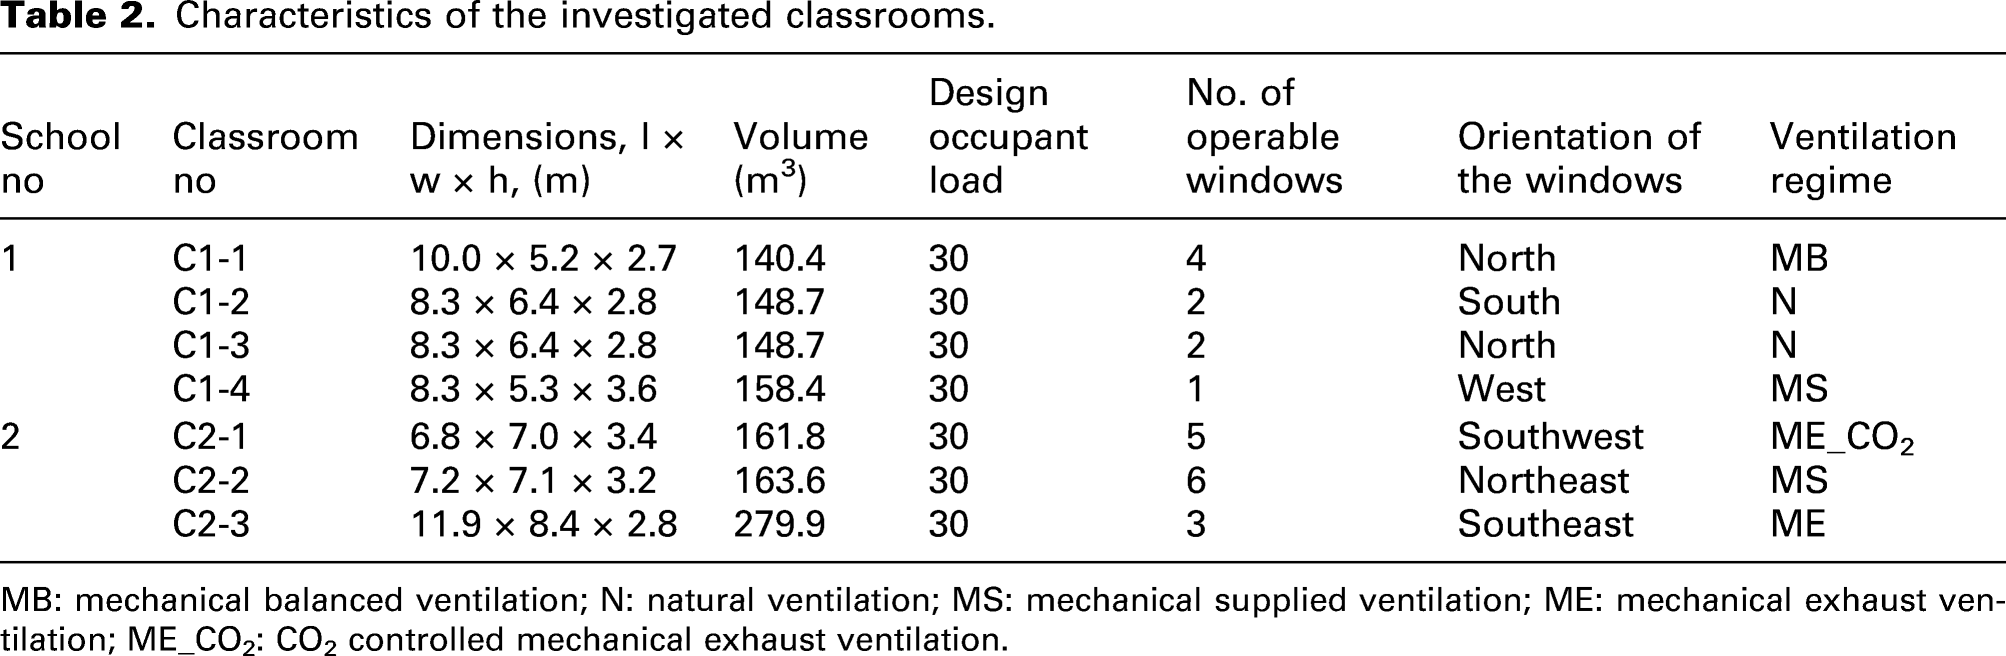
MB: mechanical balanced ventilation; N: natural ventilation; MS: mechanical supplied ventilation; ME: mechanical exhaust ventilation; ME_CO2: CO2 controlled mechanical exhaust ventilation.
Based on the results of the full-scale experiment, three to four indoor locations were selected for CO2 measurements in each classroom. Consistent with the experiment, the HOBO® CO2 loggers were used to monitor CO2 concentrations. To avoid interfering with students’ normal activities and the risk of equipment damage, all indoor measurement points were selected away from the active area. Therefore, as shown in Figure 2, all sensors were installed on the wall using adhesive strips. Apart from indoor measurement points, two outdoor points (one in front of the school building, the other one in the schoolyard) were selected to collect the real-time data of outdoor CO2. Measurements were conducted over 1 day per school, starting from the first lesson until the last lesson on the day. Example of CO2 measurement locations in real classrooms.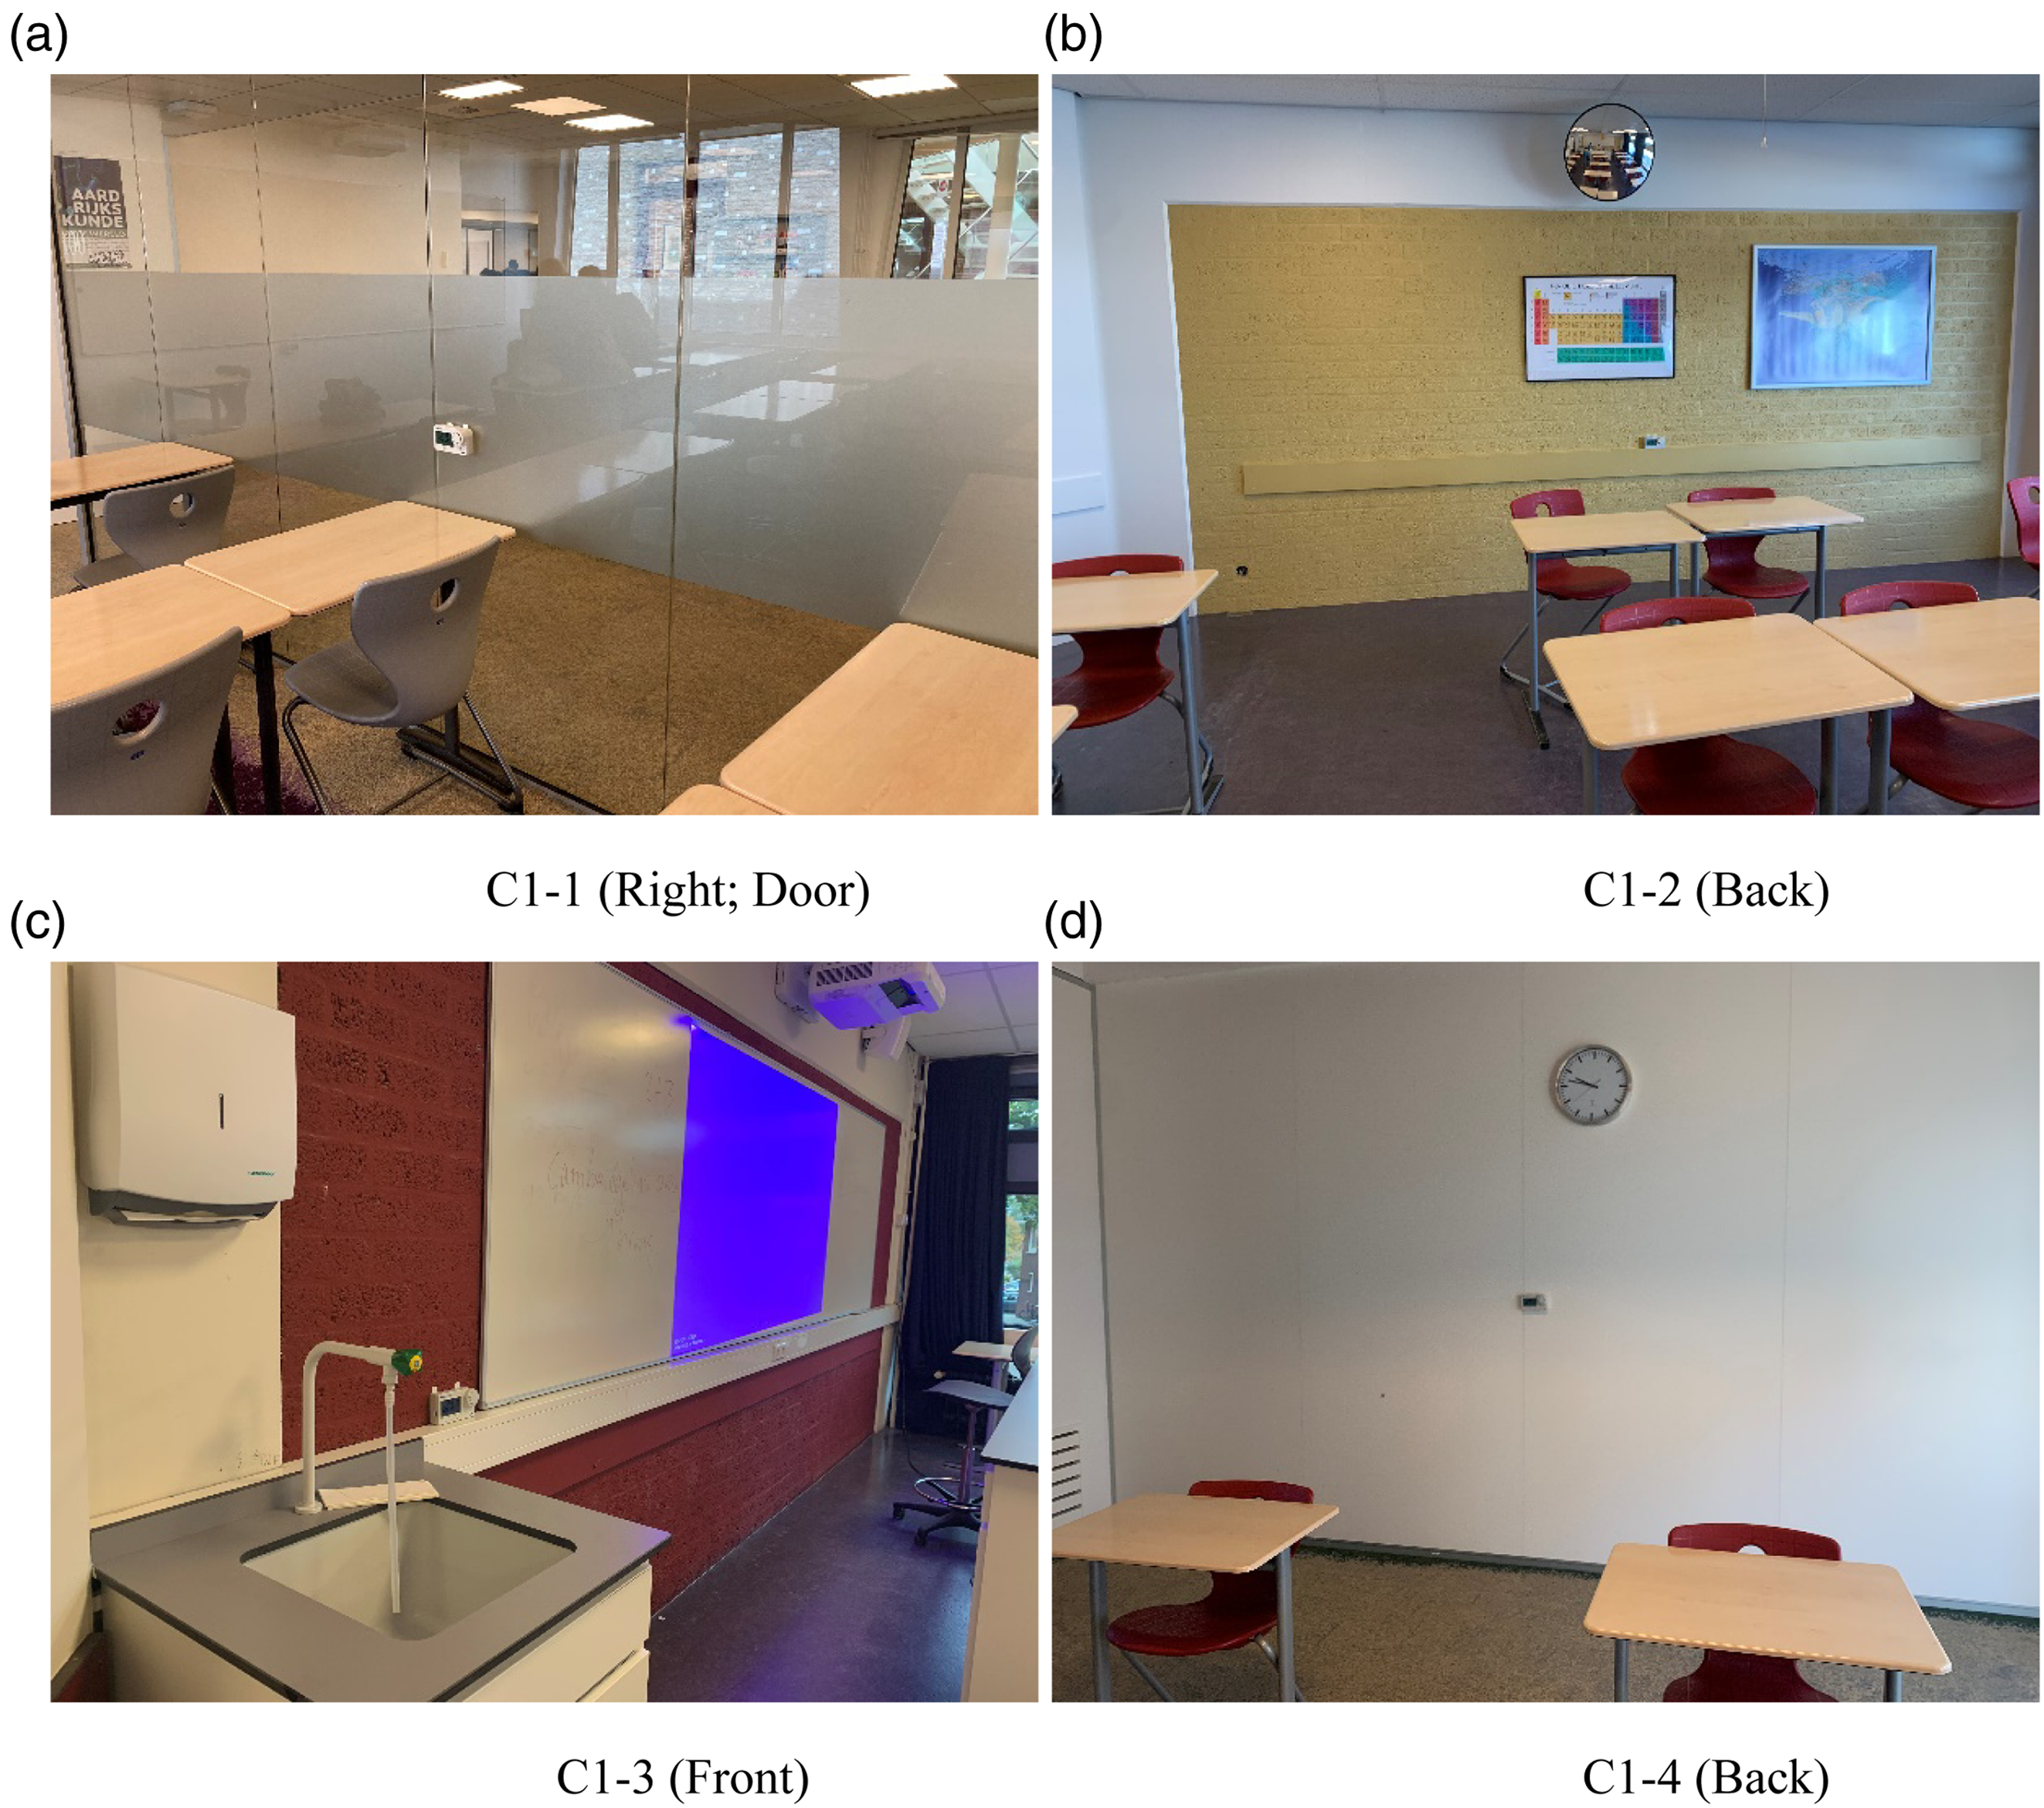
To track the occupancy and the operation of windows and doors in the investigated classrooms, observations were performed by researchers once per hour during the monitoring period. Besides, detailed information of school buildings, especially about ventilation systems used in classrooms, was collected by interviewing the school facility managers and with building inspections. Furthermore, teachers in investigated classrooms were asked to fill out an observational questionnaire which included the number of students and their actions (open/close windows/doors) during each lesson.
Data analysis
For the experiment, all collected data were imported and analysed in five steps using SPSS version 23.0 (SPSS Inc. Chicago, IL, USA). First, the results collected from the last 5 minutes of each condition were compared with each other using one-way ANOVA to check whether they reach a steady state. Second, basic information (e.g., the mean and standard deviation of these parameters) was analysed with descriptive statistics. Third, the difference between CO2 concentrations at two different heights was compared at five locations (four walls and the centre), separately, with paired samples t-test. Then, CO2 concentrations between different horizontal locations at the same height were compared with one-way ANOVA. Finally, CO2 concentrations were compared between different ventilation regimes with one-way ANOVA.
For the field study, the collected data were imported and analysed using SPSS in four different steps. First, as with the lab study, the steady state of CO2 concentrations during the last 5 minutes of each lesson period at each classroom was checked with one-way ANOVA. Second, data screening was performed based on z-scores, where all the data with a z-score (absolute value) higher than 3 were seen as outliers and thus eliminated. 49 Third, a series of descriptive analyses were carried out to get a preliminary understanding of the data. Lastly, the comparisons among different sampling points within the same classrooms were conducted by one-way ANOVA.
Results
Full-scale experiment
The variation of CO2 concentrations in 18 measurement points (17 indoor and 1 outdoor) during different monitoring periods is shown in Figure 3. The results recorded by the device located at the teacher’s location (1.1 m) was excluded because of an operational error. CO2 concentrations at the outdoor point hardly changed during the whole time. For indoor points, generally speaking, the variation trend of CO2 at different points were similar: during the first condition (‘600 m3/h mixing’), CO2 concentrations were relatively steady and low. During the ‘break’ period, CO2 concentrations were reduced by a small margin. Under the second condition with ‘open windows’, CO2 concentrations were increased at the beginning but were kept steady later. Under the third condition with ‘no ventilation’, CO2 concentrations were increased substantially and with a large amplitude. Under the last condition of the experiment with ‘open windows and door’, CO2 concentrations were reduced sharply at the beginning and then became steady at the end. CO2 concentrations monitored at different locations in a classroom setting. Note: The CO2 concentrations were monitored at 17 points in a classroom setting with six occupants under four ventilation regimes: ‘600 m3/h mixing ventilation’, ‘open windows’, ‘no ventilation’ and ‘open door and windows’. The orange boxes represent the breaks (1200 m3/h, without occupants) between each monitored condition. Note: C: centre, two heights (1.1 m and 1.6 m); D: desk, 1.1 m; O: outdoor, 1.1 m; T: teacher, two heights (1.1 m and 1.6 m); and W: wall, two heights (1.1 m and 1.6 m).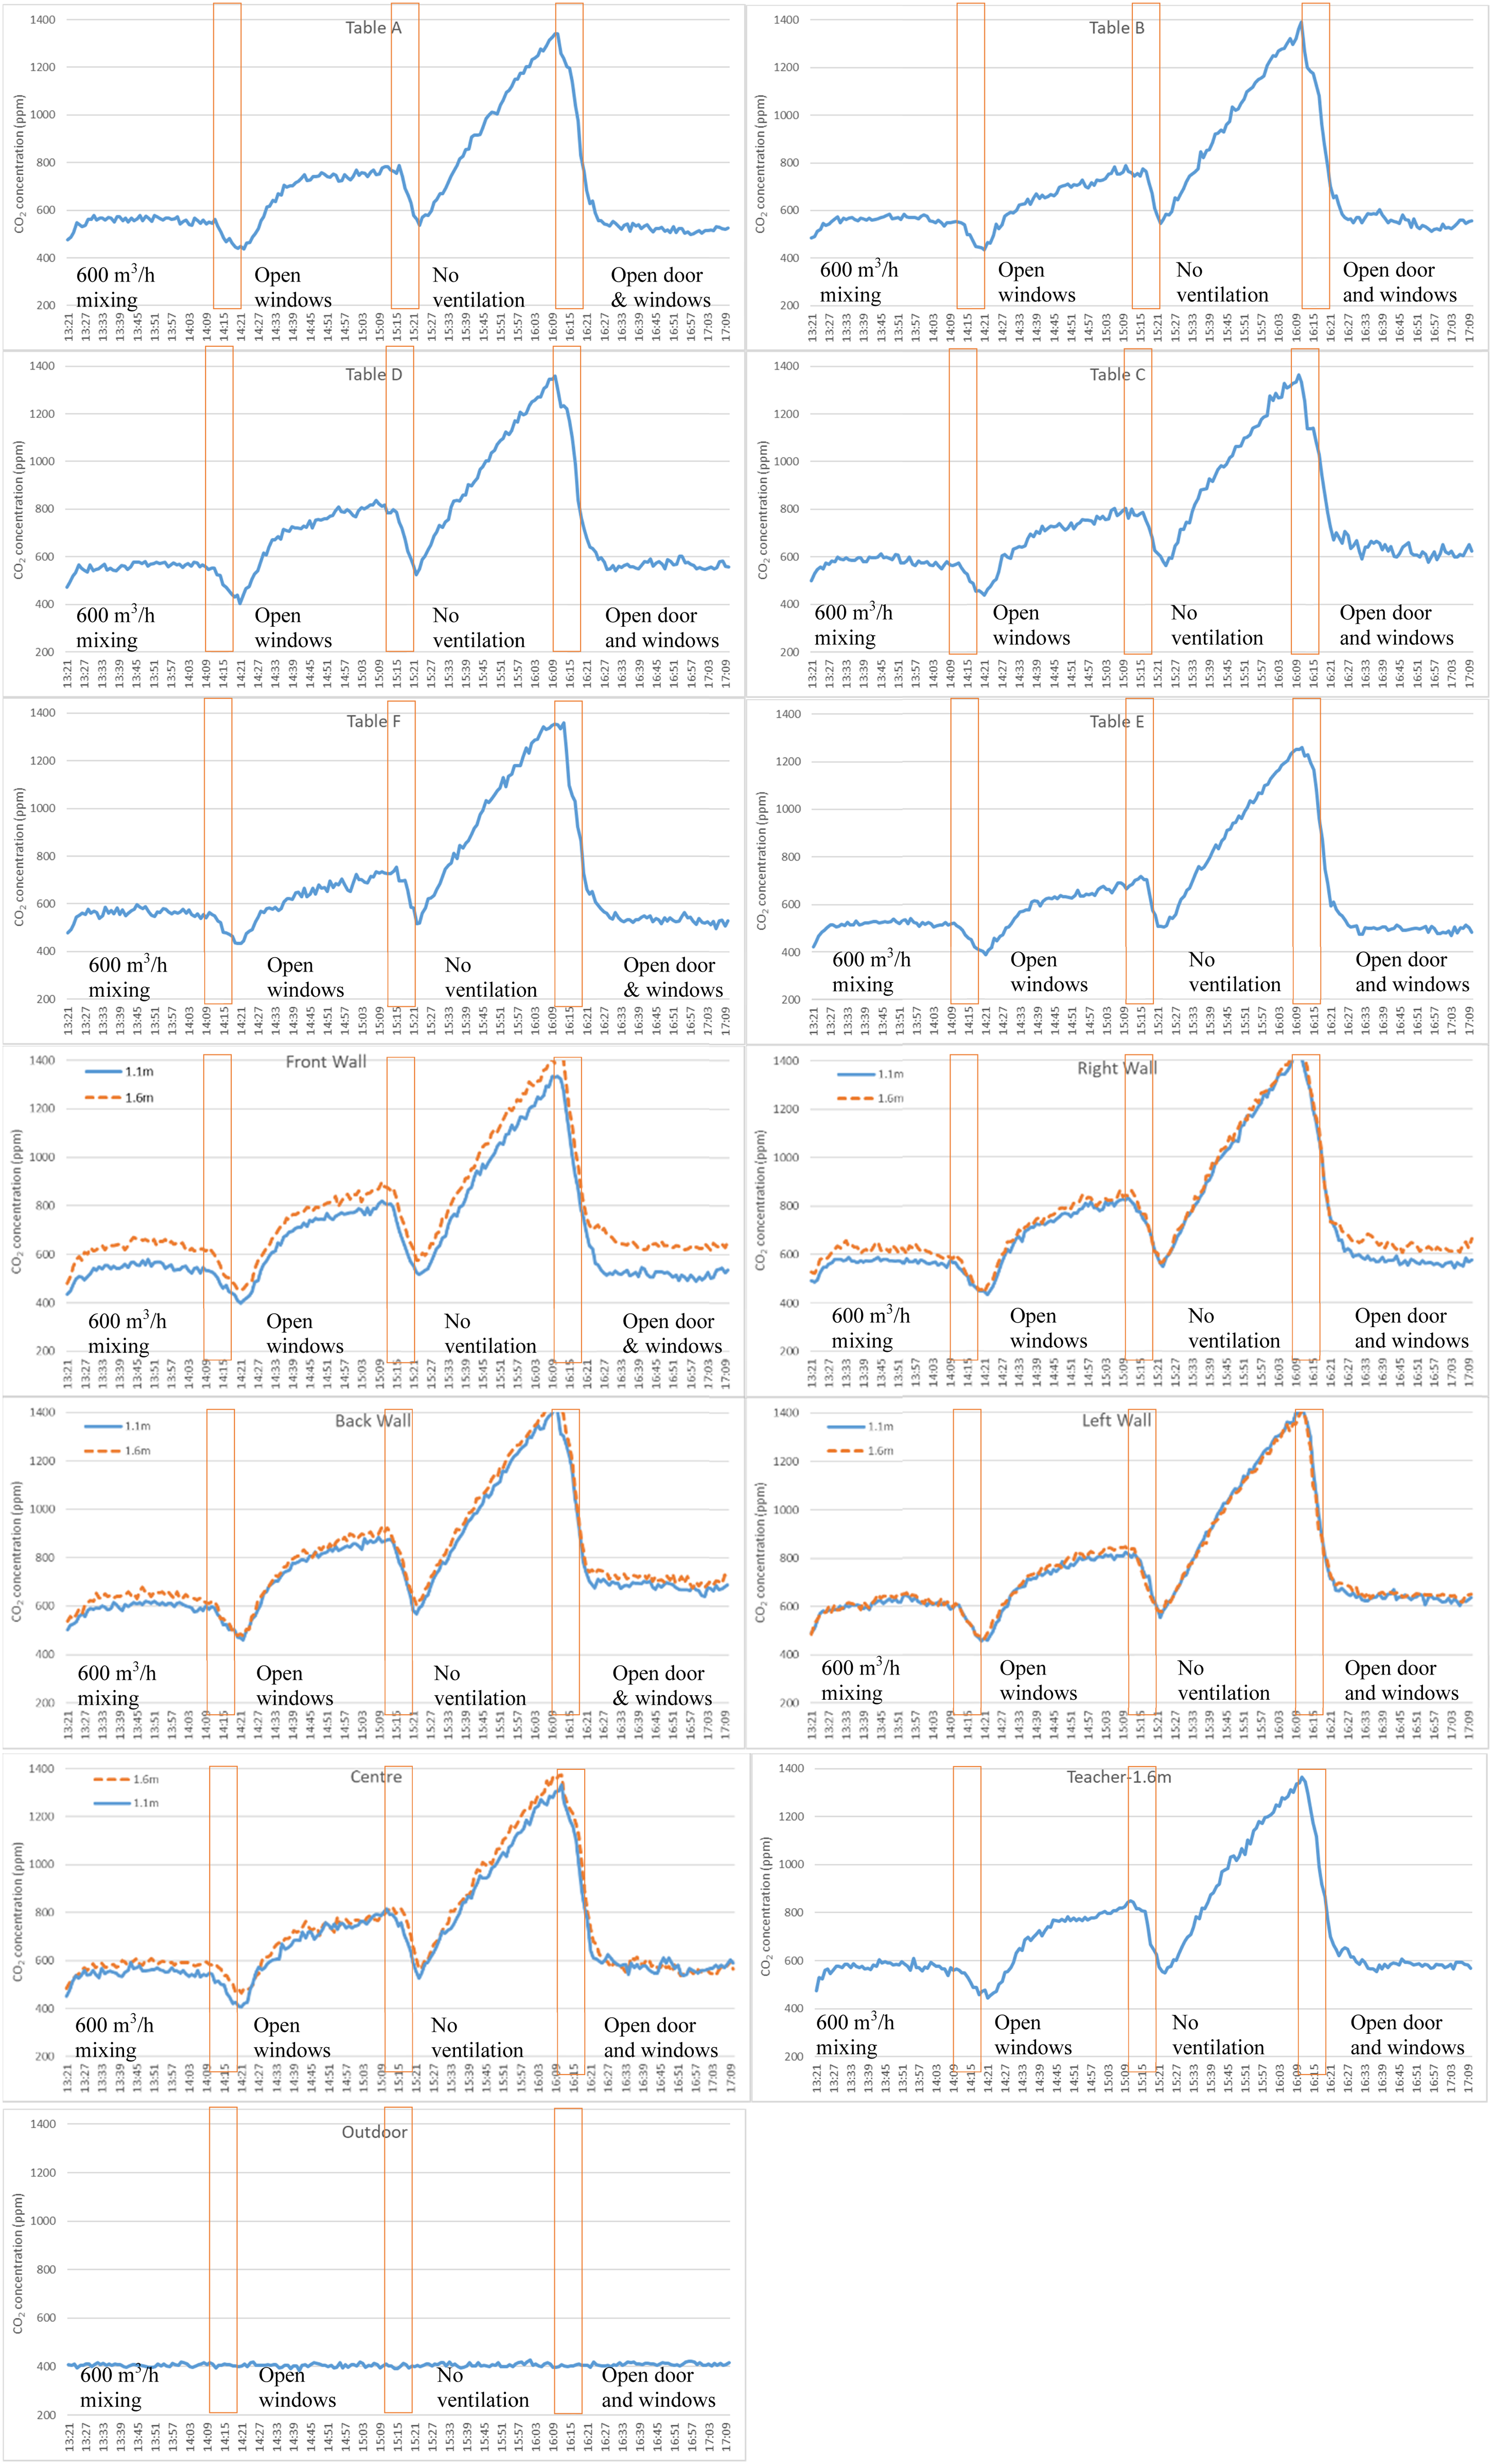
General results
Results of the one-way ANOVA tests showed differences in CO2 concentration between last 10 measurements (i.e., 5 min) of all tested conditions and were not significant. This indicated that the CO2 concentration reached a steady state in the last 5 minutes of measurements in all conditions. Therefore, results obtained during last 5 minutes of measurements under all conditions were the main focus of this study, and the descriptive analysis results of the CO2 concentration monitored during these periods are shown in Figure 3. For all indoor measurement points, conditions under ‘mixing ventilation (600 m3/h)’ and ‘open windows and door’ showed the best performance, in terms of keeping the lowest CO2 concentration, followed by ‘open windows’, while the ‘no ventilation’ condition was the worst. The average CO2 concentrations at 17 indoor points were similar under ‘mixing ventilation’ (570 ppm) and ‘open windows and door’ (593 ppm). However, the variation range among these points was much larger under the condition ‘open windows and door’ (497–711 ppm) than under ‘mixing ventilation’ (515–626 ppm). This demonstrates the uneven distribution of CO2 under natural ventilation.
Among 18 measurement points, the lowest CO2 concentration always appeared at the outdoor point, and the result measured at this point remained stable during the whole monitoring, no matter under which type of ventilation. However, if only indoor points are taken into account, the lowest CO2 concentration always appeared at the point above desk E, while the highest CO2 concentration always appeared at the point on the back wall at 1.6 m (except for the ‘no ventilation’ condition where it was on the right wall at 1.6 m).
Figure 4 illustrates the distribution of CO2 concentrations in the Experment room under different ventilation regimes. The diameters of the bubbles represent the difference between indoor and outdoor CO2 concentrations at each measurement point. The indoor CO2 concentration was much higher than other ventilation regimes under ‘no ventilation’. CO2 distribution in the Experience room with different ventilation regimes.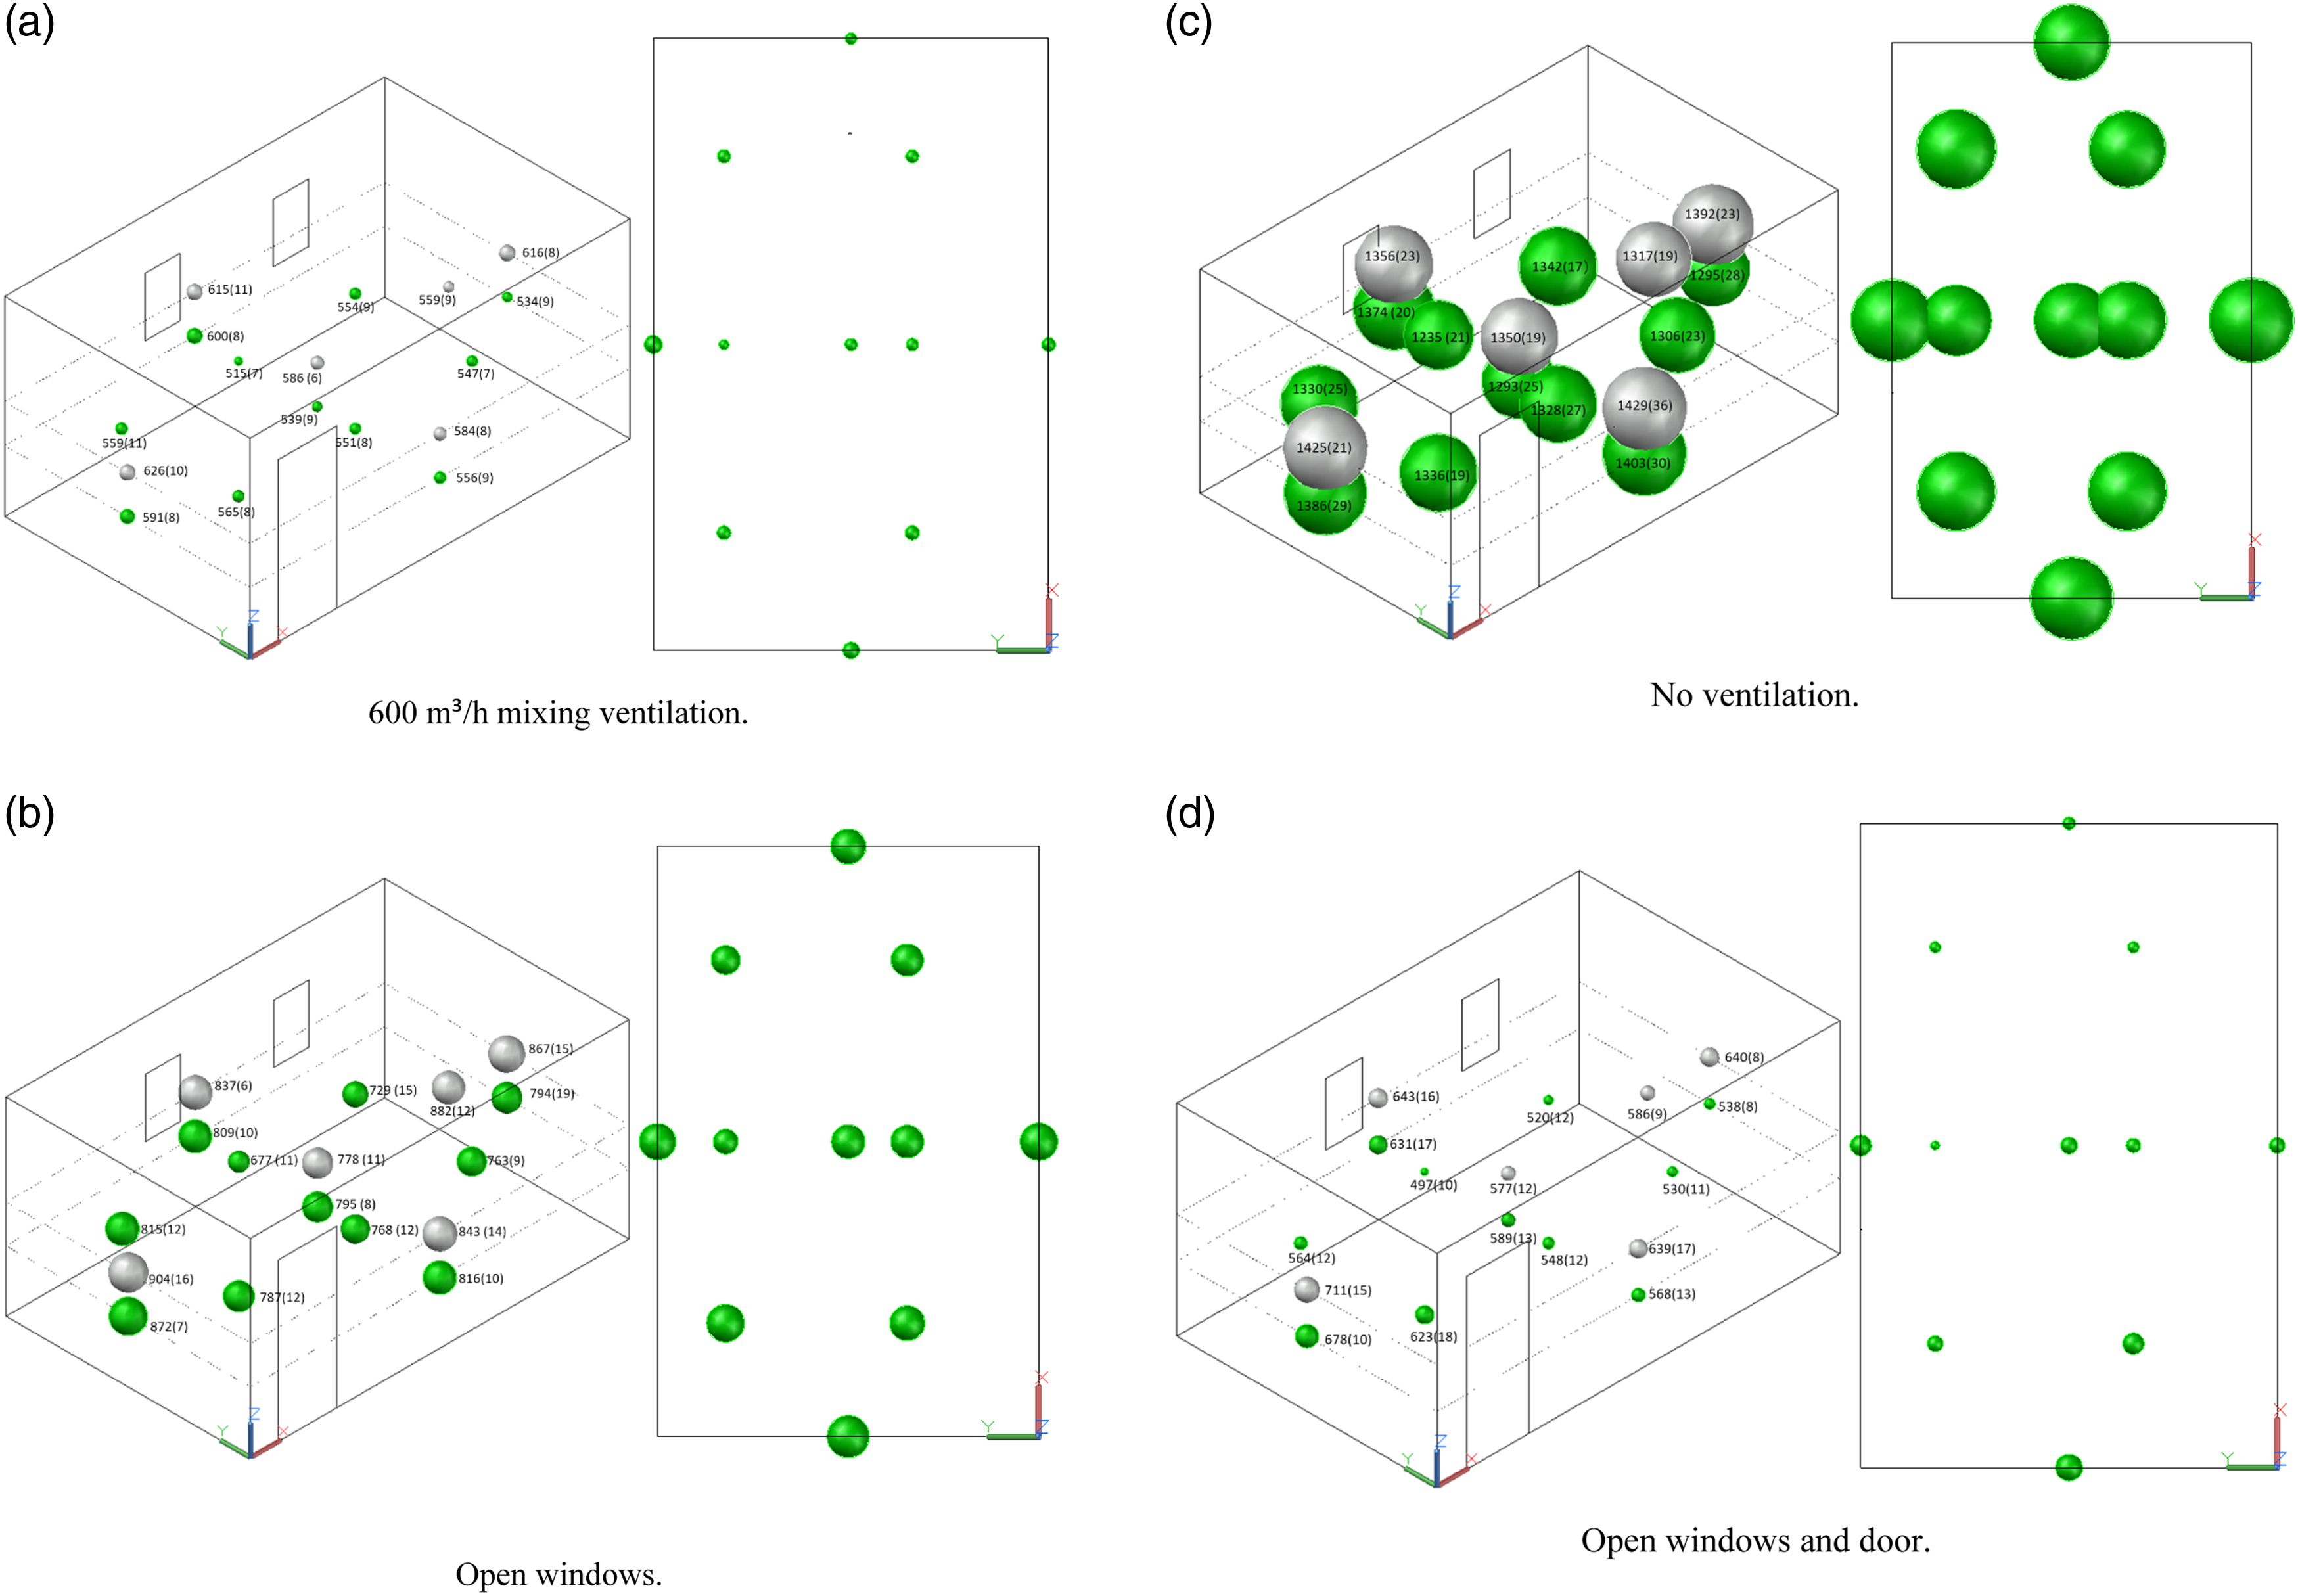
Distribution of CO2 concentration.
Average CO2 concentrations measured at different locations under different ventilation regimes.
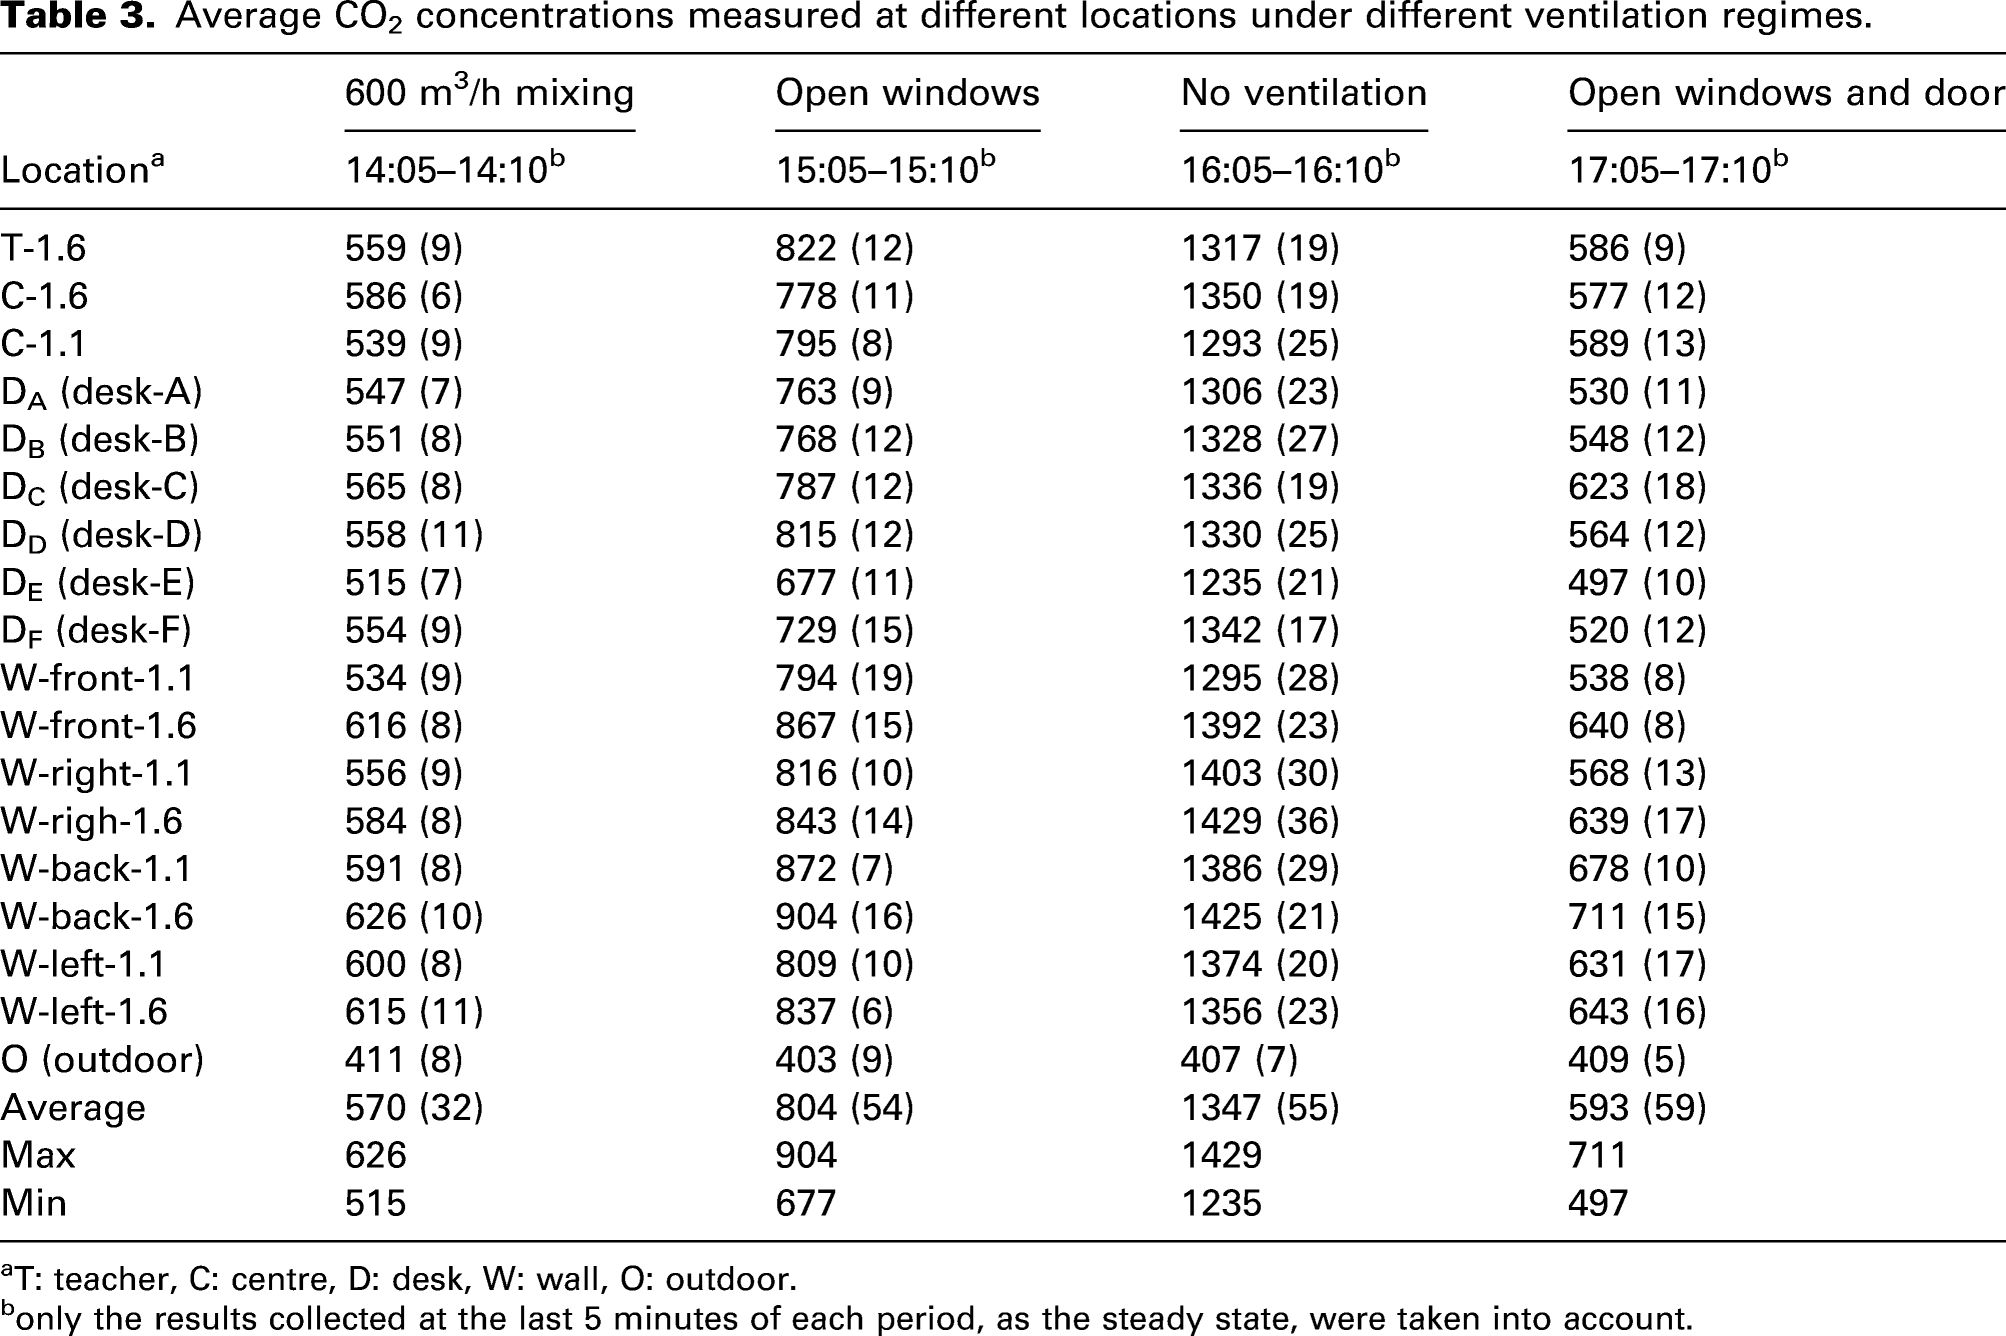
aT: teacher, C: centre, D: desk, W: wall, O: outdoor.
bonly the results collected at the last 5 minutes of each period, as the steady state, were taken into account.
Comparisons of CO2 concentrations between two heights for different ventilation regimes.
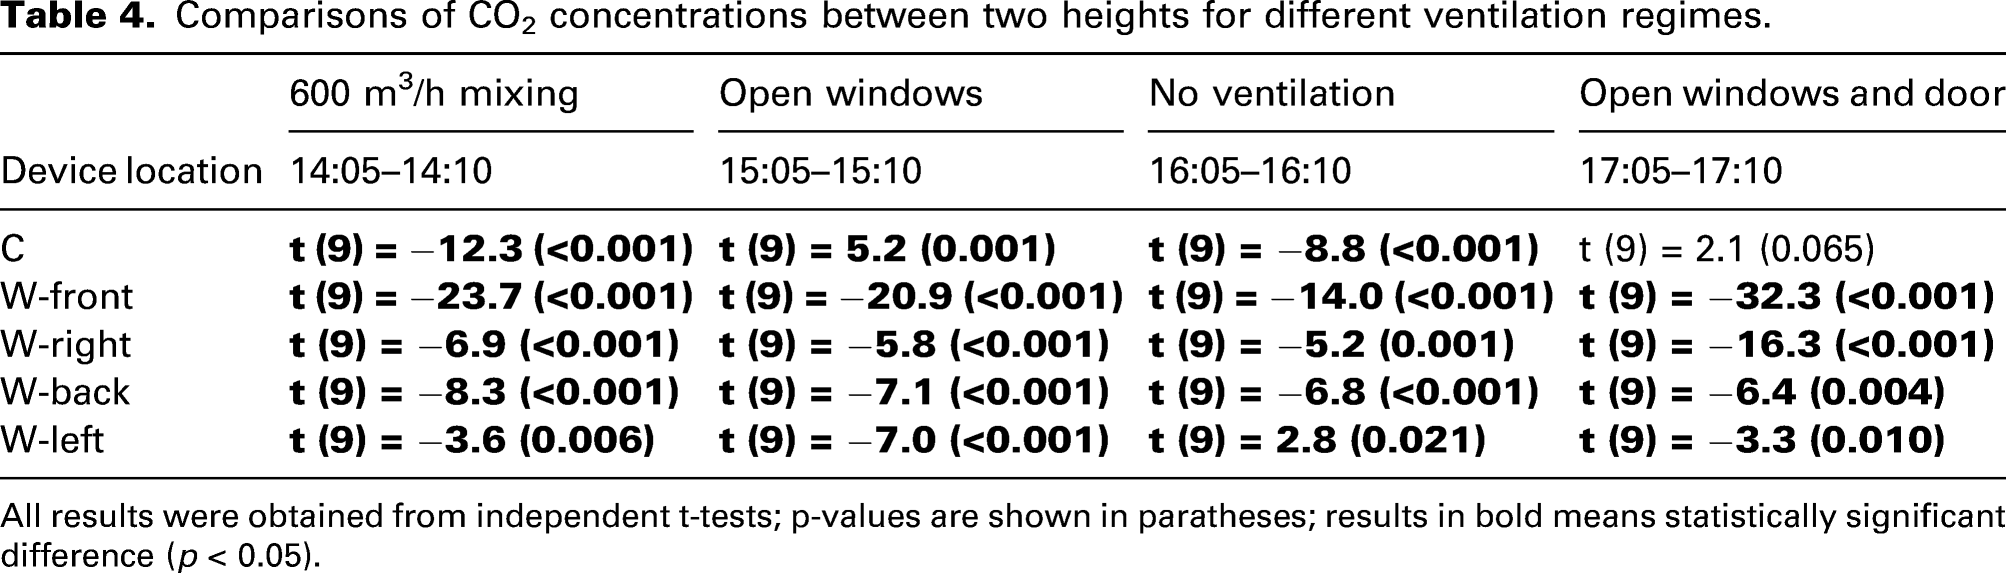
All results were obtained from independent t-tests; p-values are shown in paratheses; results in bold means statistically significant difference (p < 0.05).
In terms of the horizontal distribution, the CO2 concentration was relatively uneven between measurement locations. The number of measured locations at 1.1 m was higher than that at 1.6 m, Therefore, to better compare the horizontal distribution at these two heights, the ANOVA tests were first conducted among all locations at 1.1 m and 1.6 m (see Figures 5(a) and (b)), and then they were also conducted among five commonly chosen locations at these two heights (see Figures 5(c) and (d)). According to results, differences in CO2 concentrations between locations at the same height were statistically significant (p < 0.05) for all ventilation regimes (see Figure 5). Similar to the vertical distribution, for ‘natural ventilation’, the horizontal distribution of CO2 was the most uneven (with higher F-values), while the most even horizontal distribution of CO2 was in the ‘no ventilation’ condition (with lower F-values). Comparison of CO2 concentrations between locations with same heights.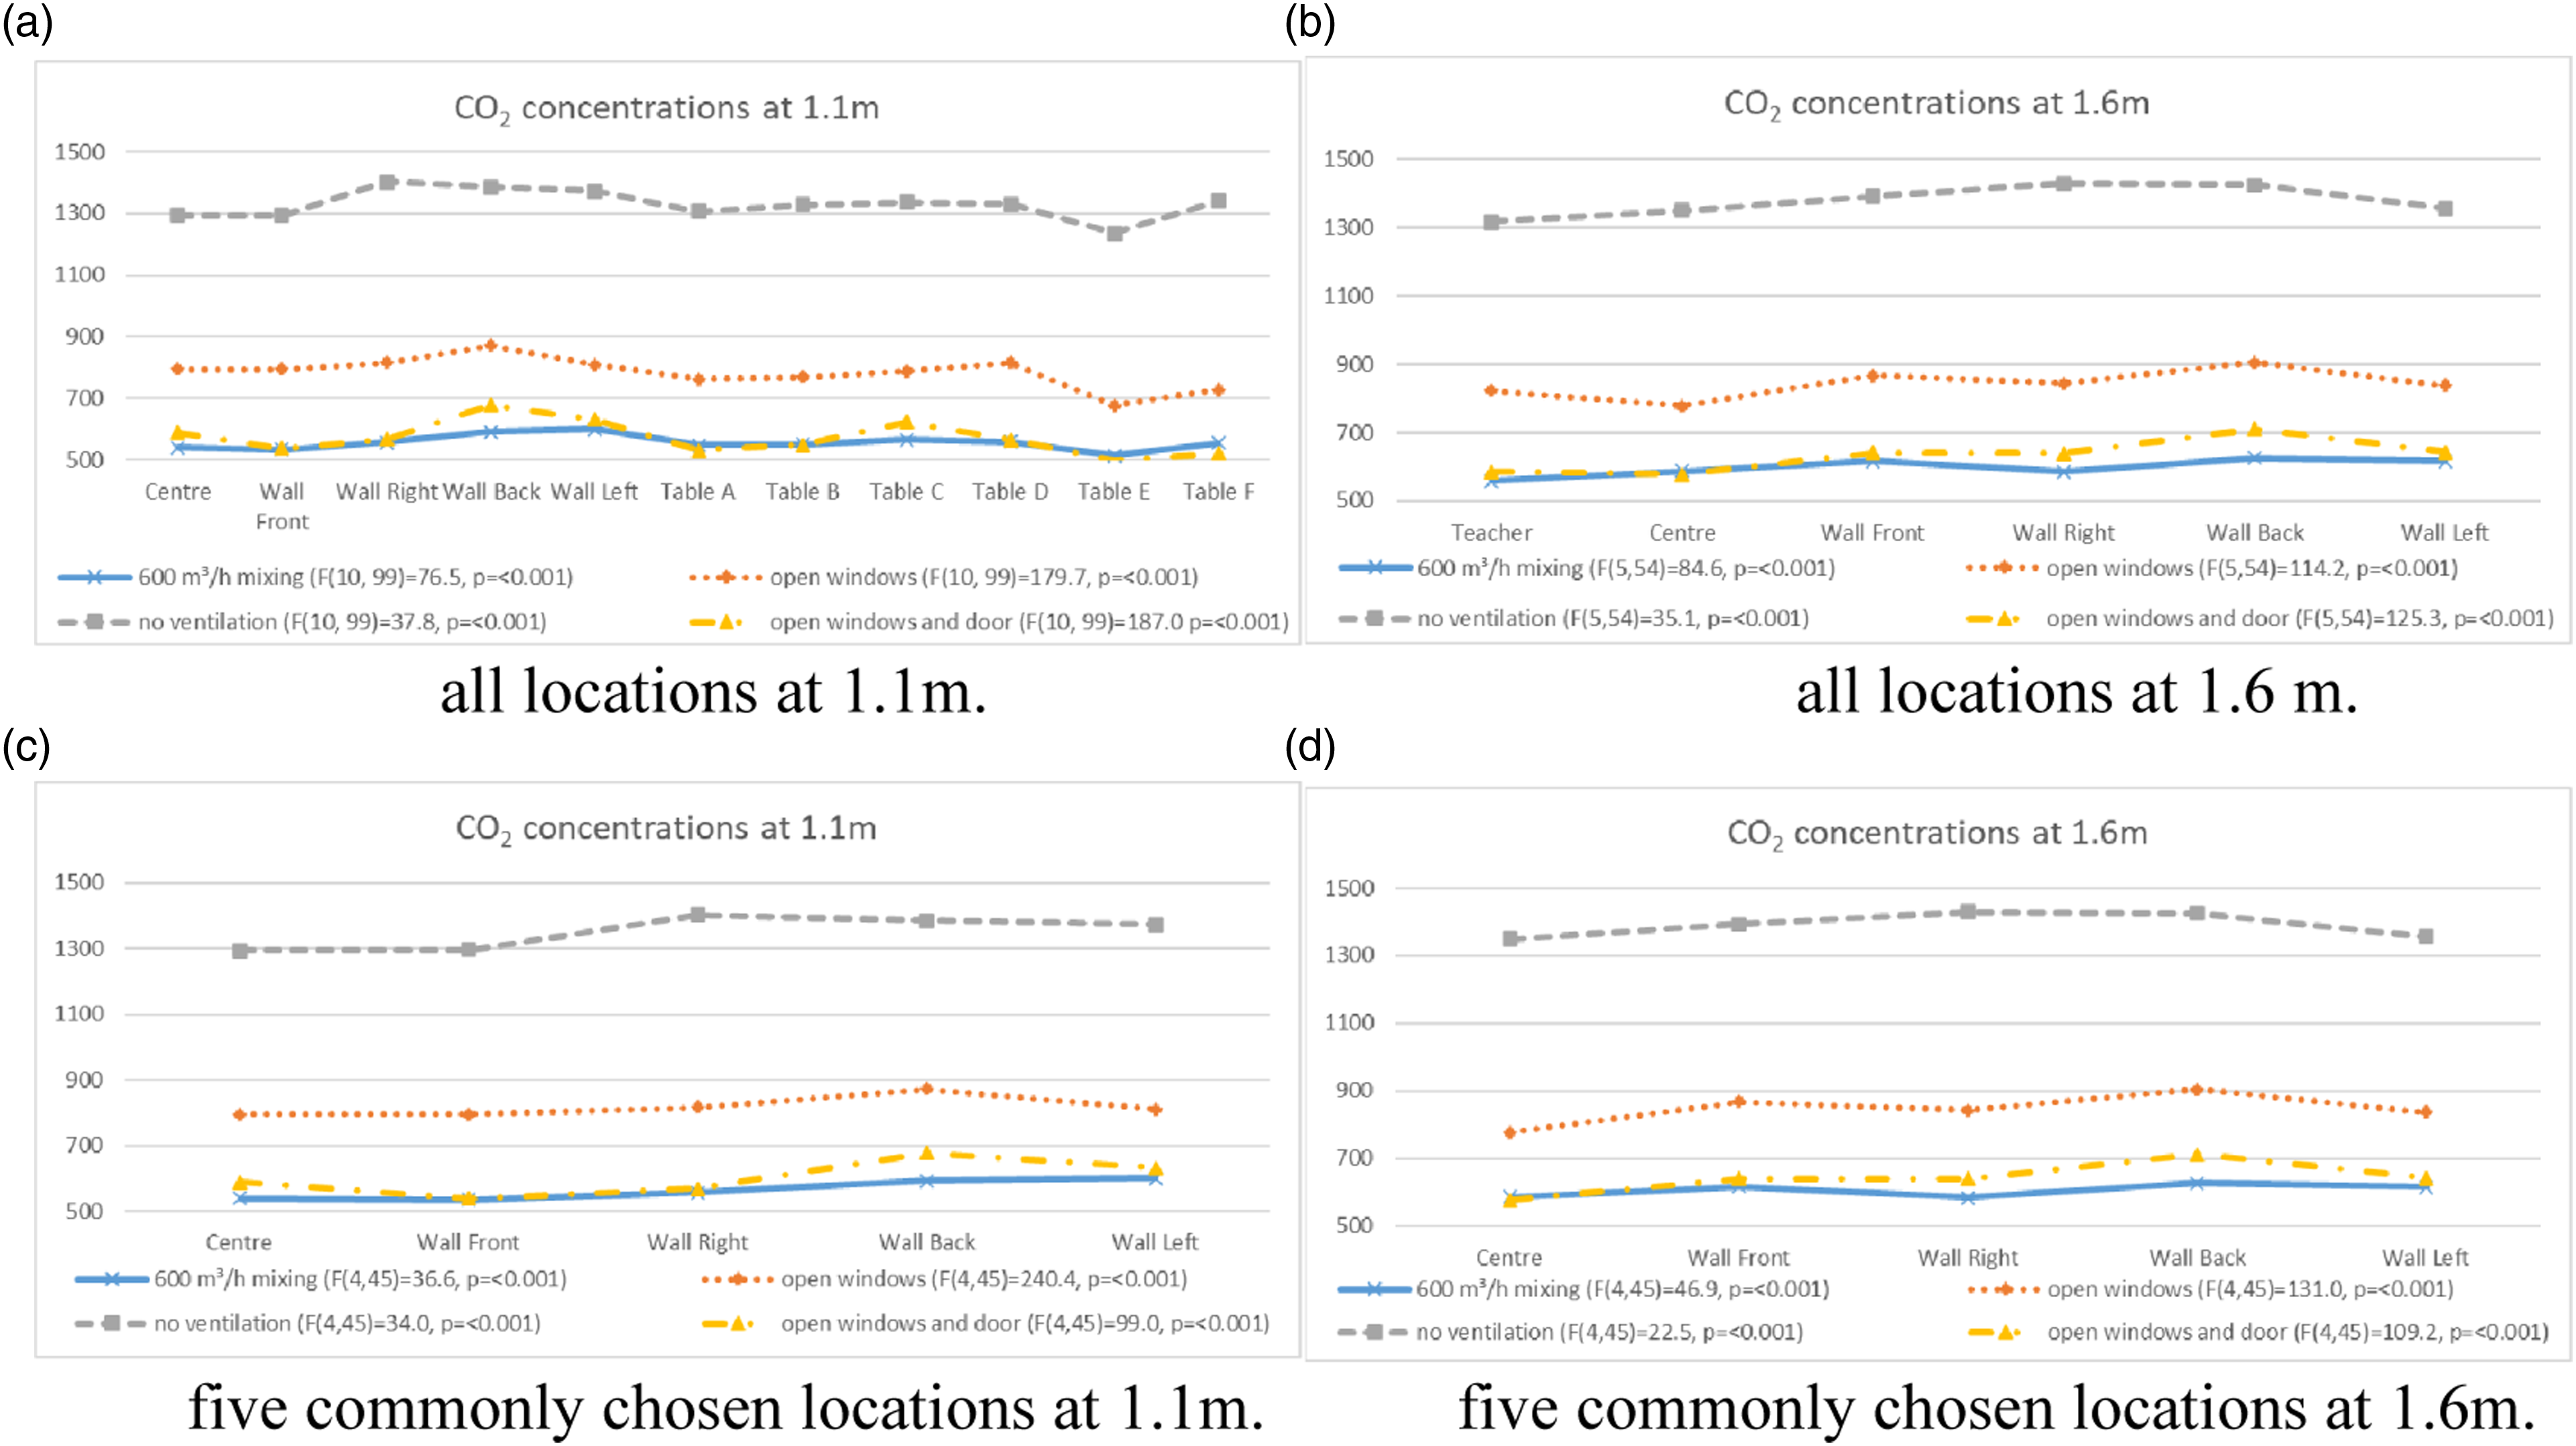
Impact of ventilation regimes on CO2 concentrations
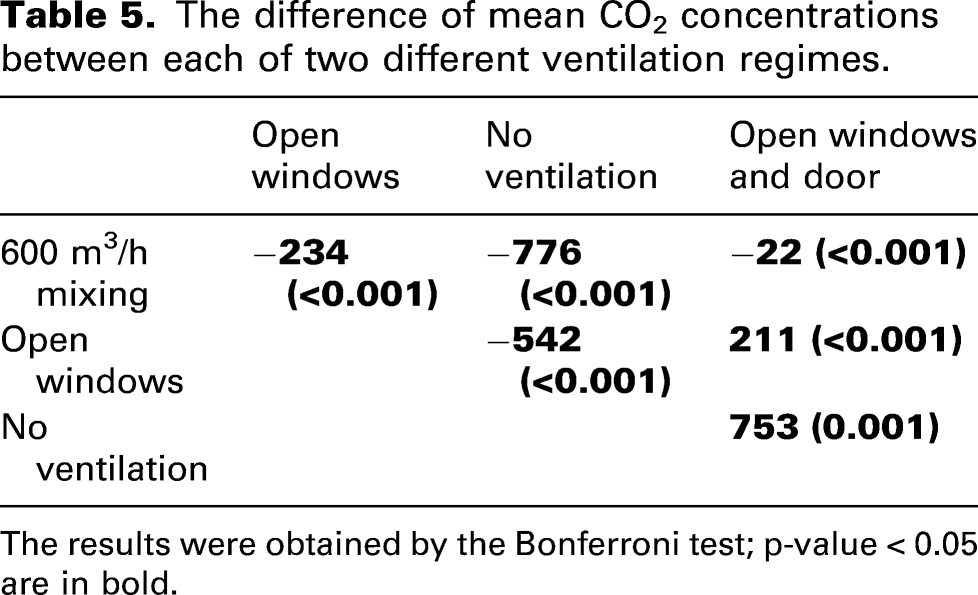
As shown in Figure 6, the result of the one-way ANOVA test indicated that there was a statistically significant difference in CO2 concentrations among ventilation regimes (F (3676) = 8522, p < 0.001). According to the post-hoc tests – Bonferroni test – -under the significant result of ANOVA (see Table 5), a significant difference in CO2 concentrations was found between almost each of two different ventilation regimes, except for between ‘600 m3/h mixing’ and ‘open windows and door’. The difference in CO2 concentration between these two conditions was less than 50 ppm, which is the accuracy of HOBO. The average CO2 concentration measured at 17 indoor locations during last 5 minutes of the ‘600 m3/h mixing’ regime was significantly lower than that of ‘open windows’ and ‘no ventilation’, but similar to that of ‘open windows and door’. Comparisons of CO2 concentrations between different ventilation regimes. The difference of mean CO2 concentrations between each of two different ventilation regimes. The results were obtained by the Bonferroni test; p-value < 0.05 are in bold.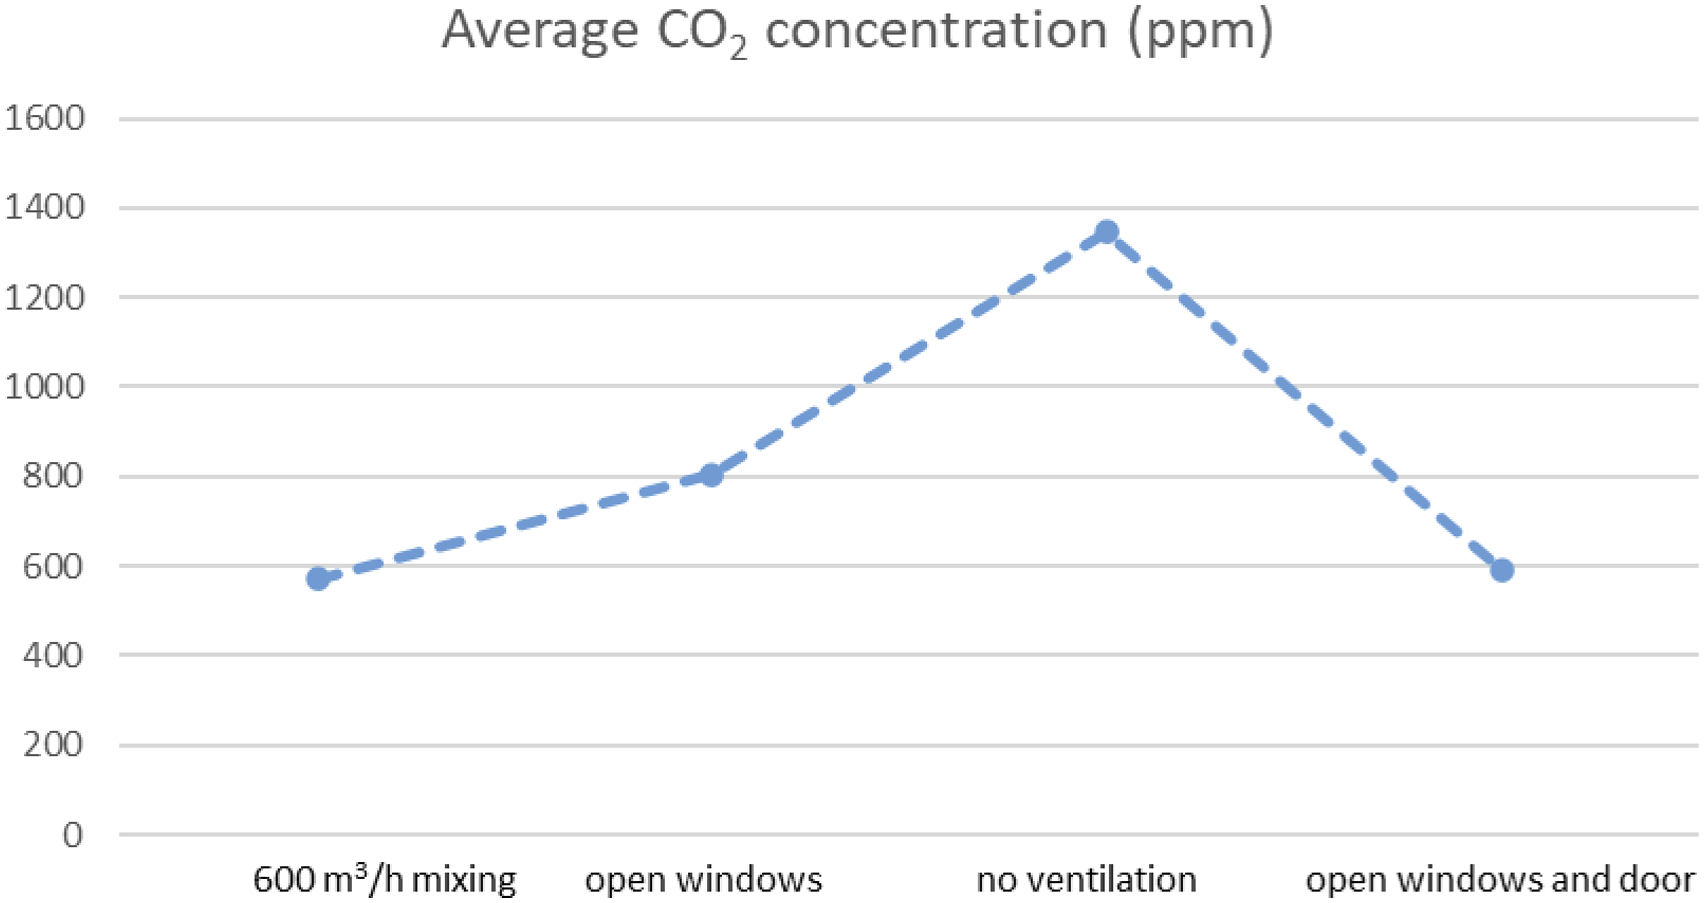
Proposed CO2 monitoring guidance in the field study
In real classrooms, it is not feasible to measure the CO2 concentration at so many locations as it was done in the SenseLab. Therefore, the four wall locations at 1.1 m were recommended because of the following reasons: (1) Since CO2 cannot be fully mixed in the room, there will always be a most unfavourable point where the CO2 concentration is the highest among all indoor locations. The most unfavourable point should be given more attention during the measurement in the field. If the CO2 concentration at this point could fulfil the requirement, then the whole room can be considered safe, which is known as the worst-case design.
50
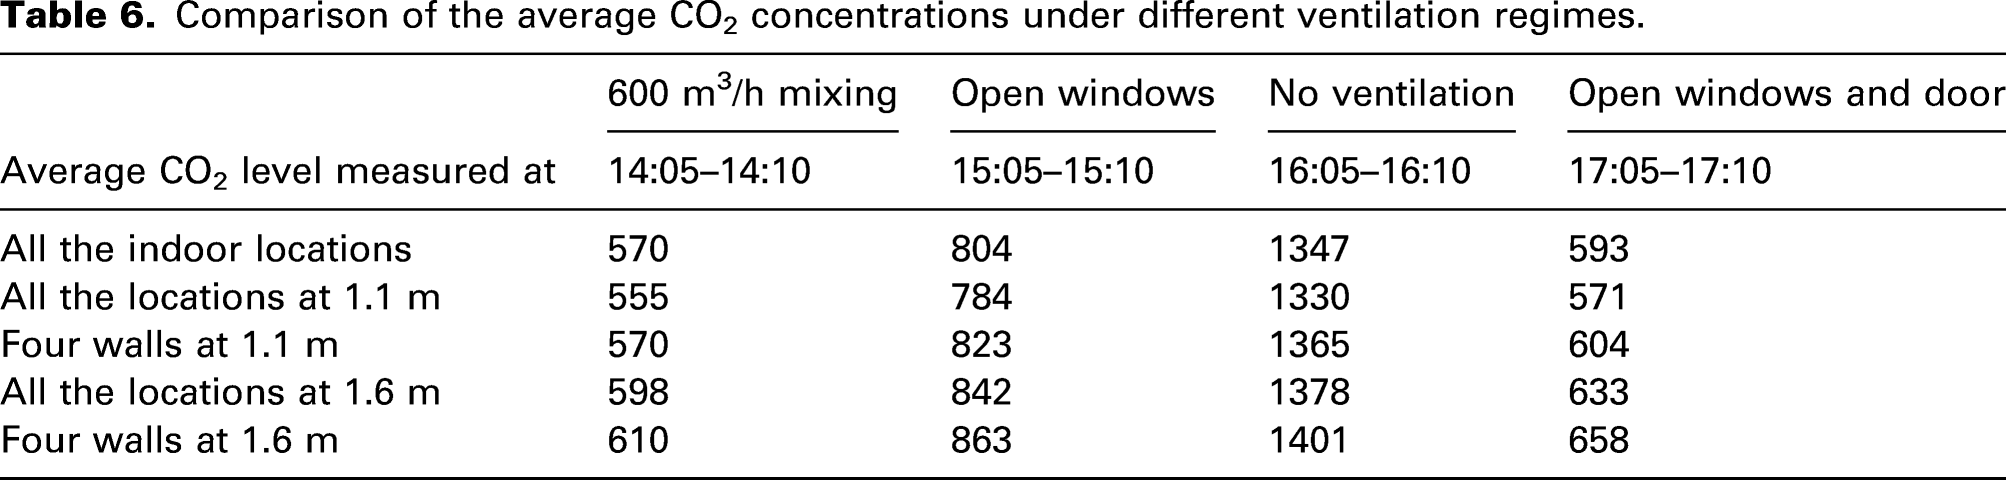
In the current study, locations on walls were considered as unfavourable points because higher CO2 concentrations were always measured on walls, regardless of ventilation regimes (see Table 3). (2) Considering the real situation in school classrooms, locations on walls are less prone to equipment damage by students than locations on top of desks or at the centre of the classroom, especially for long-term measurements. (3) As shown in Table 6, the average CO2 concentration measured on four walls was similar to the average of all locations with the same height, and the average value on four walls at 1.1m was similar to the average of all indoor locations. Comparison of the average CO2 concentrations under different ventilation regimes.
Therefore, if the condition allows, it is better to do the measurement on all walls at 1.1 m. If the number of devices is limited, then it is better to do the measurement at the least favourable location which, however, might be different among classrooms because of different layouts and ventilation regimes.
Field study
To validate the proposed CO2 monitoring guidance, a series of CO2 measurements was conducted in seven real-life classrooms with different ventilation regimes which could cover almost all ventilation regimes used in Dutch schools. Four wall locations were selected in classrooms using natural ventilation while three to four walls were selected in those using hybrid ventilation (only mechanical supplied or only mechanical exhausted) or mechanical balanced ventilation. Figure 7 presents the variation of CO2 concentrations at different measurement locations in classrooms. The lesson blocks are separated with vertical lines, and two boxes in each figure represent the breaks. Generally speaking, variation trends of CO2 concentrations at different locations in the same classroom were similar, and fluctuations in the natural ventilated classrooms (C1-2 and C1-3) were more obvious than those in classrooms with other ventilation regimes. CO2 concentrations measured at different points in the real classrooms. Note: the lesson periods are separated with the vertical lines and the boxes represent the breaks; the occupied hours are marked in bold.
Note: the lesson periods are separated with the vertical lines and the boxes represent the breaks; the occupied hours are marked in bold
General results
According to results of the one-way ANOVA tests, there is no significant difference in CO2 concentration between the last 10 measurements of all the lessons, which indicated the CO2 concentration reached a steady state at last 5 minutes of all lesson periods. Therefore, it was decided to use the average CO2 concentration of last 5 minutes of each lesson to calculate the ventilation rate (l/s) of each classroom based on equation (1)9,10,12
Information about the CO2 monitoring in seven classrooms of two Dutch secondary schools.
aThe numbers of students, open windows and open doors were observed and recorded once per lesson.
bThe results were the average CO2 concentrations monitored during the last 5 minutes of each lesson.
cVentilation rates were calculated based on CO2 concentrations and the number of students.
Comparison of CO2 concentrations between locations within the same classrooms
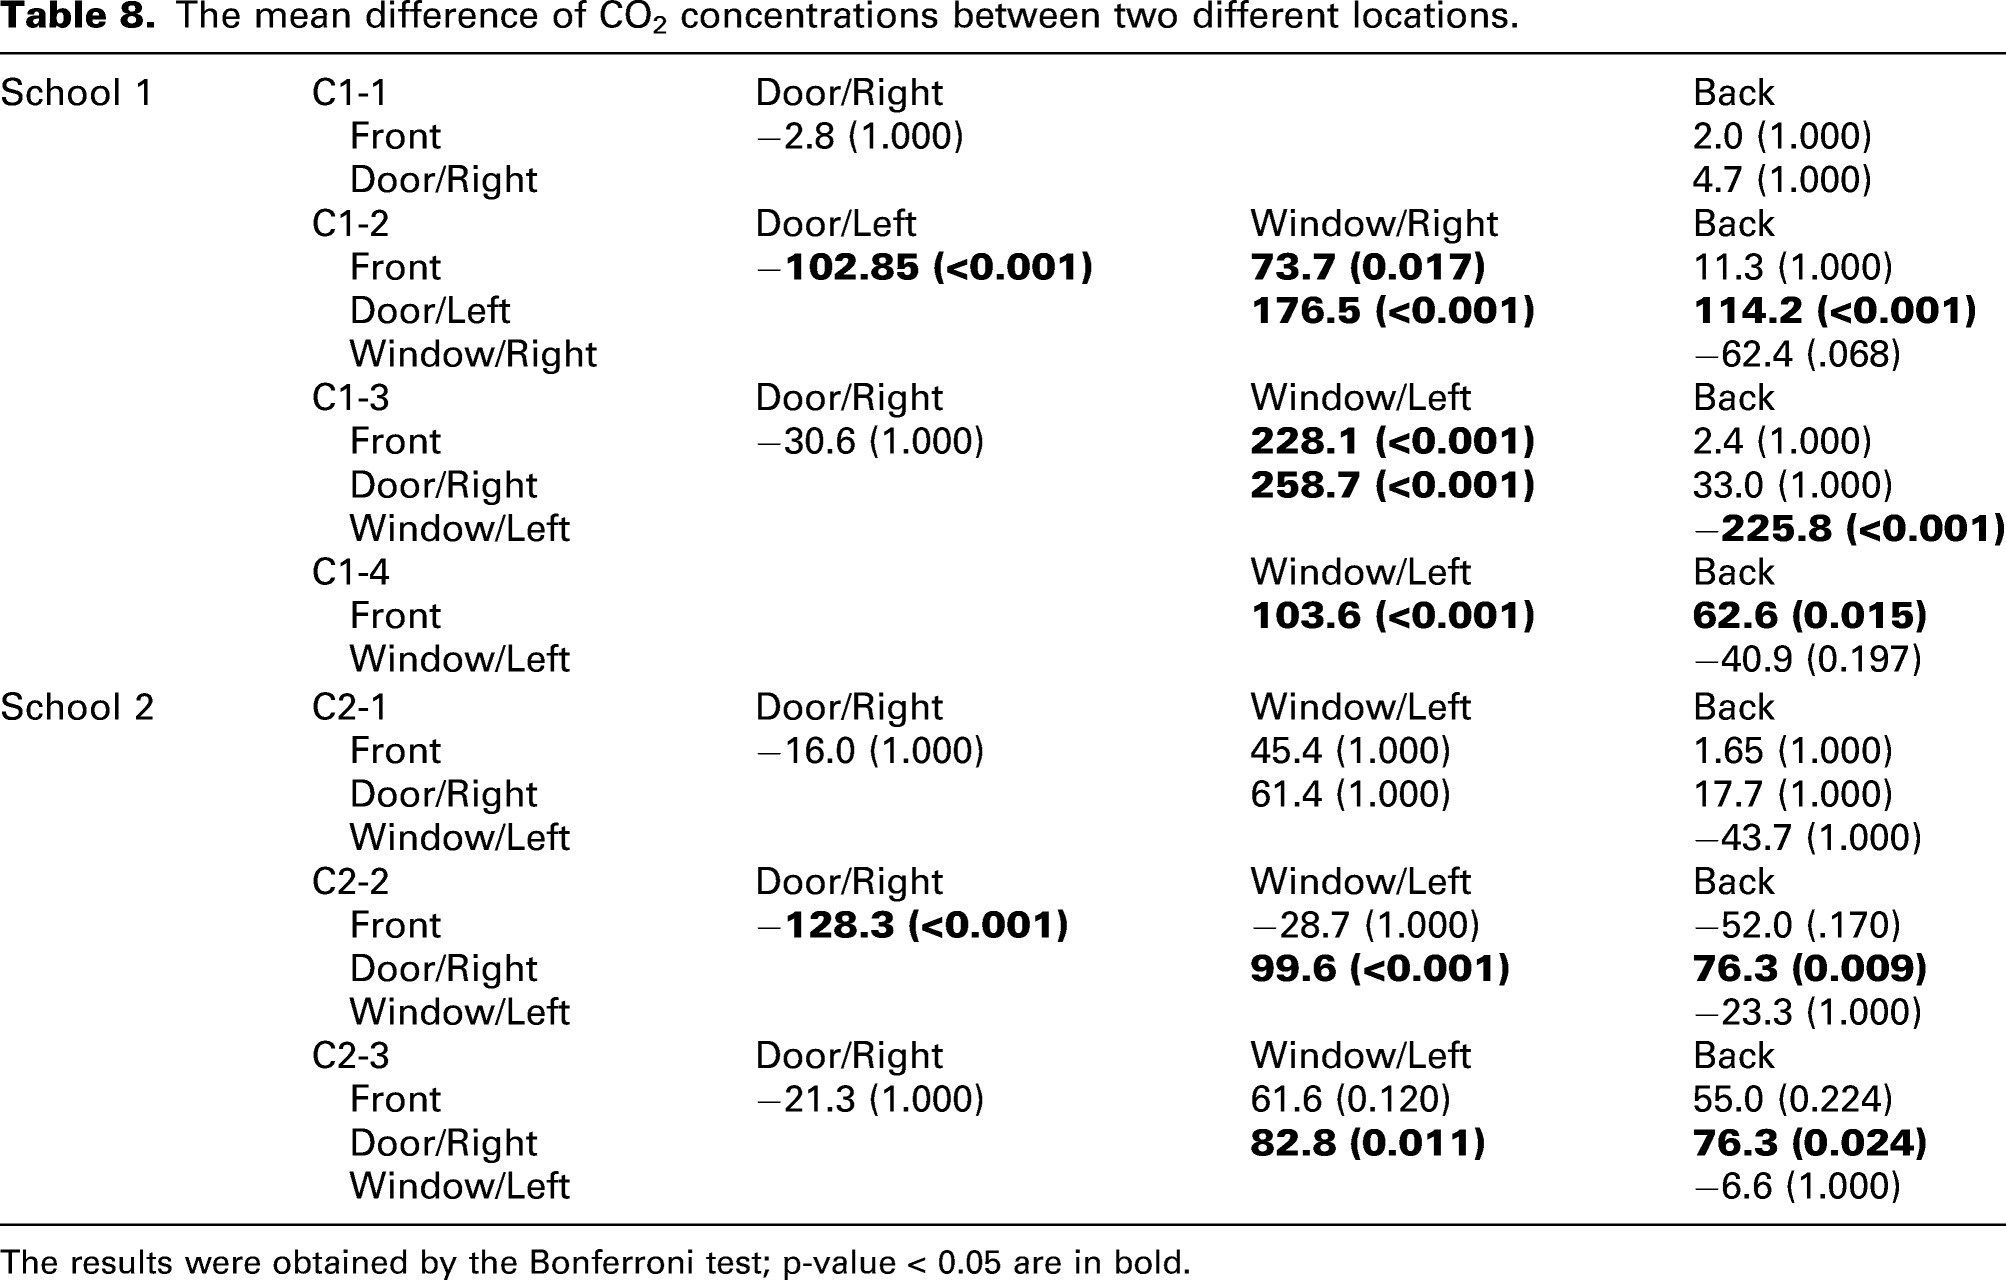
One-way ANOVA resulted in statistically significant differences of CO2 levels among different sampling locations in almost every classroom, except for classroom C1-1 and classroom C2-1 (see Figure 8), which were only classrooms with a mechanical balanced ventilation system and CO2 controlled mechanical exhaust ventilation system, respectively. As illustrated in Figure 8, the CO2 concentration was always the lowest on the wall with windows location (except for classroom C2-2), while it was always the highest on the wall opposite windows. The following post-hoc multiple comparison test results indicate that the CO2 concentration is well-mixed in the classrooms C1-1 and C2-1, as no significant difference was found between sampling locations in these classrooms. In other classrooms, statistically significant differences in CO2 concentrations were always found between the left and right walls (see Table 8). However, almost no significant difference was found between the front and the back in almost all classrooms, except for classroom C1-4. In this classroom, the CO2 concentration measured on the front wall was significantly higher than that on the back wall, which might be because there is a ventilation grill close to the back wall. Comparison of CO2 concentrations between different locations in the same classrooms. The mean difference of CO2 concentrations between two different locations. The results were obtained by the Bonferroni test; p-value < 0.05 are in bold.
Besides comparisons between indoor locations, the difference in the CO2 concentration between two outdoor locations was also examined by paired samples t-tests. The results showed statistically significant differences between two outdoor locations in both schools (school 1: t (543) = 3.0, p = 0.003; school 2: t (591) = 22.4, p < 0.001). However, differences in CO2 concentrations between two locations were smaller than the accuracy value of the device – 50 ppm (see Table 7), which means that these differences might be an instrumental error.
Revised CO2 monitoring guidance based on the field study
According to the real situation in the field and the results obtained from the field study, the proposed CO2 monitoring guidance was revised as follows: (1) The locations on four walls were still the better choices considering the abovementioned practical and safety reasons. However, if the number of measurement devices cannot meet the requirement of four devices in one classroom, then the most unfavourable point should be chosen first. According to the results of the field study, CO2 concentrations on the wall opposite windows were always the highest, no matter which type of ventilation regime. (2) The outdoor CO2 concentration should be included, and one location should be enough because only a small difference (less than 50 ppm) was found between the two outdoor locations in the field study. (3) The occupancy and the number of open windows and doors should be recorded per lesson since all this information could cause a remarkable difference in CO2 concentrations/ventilation rates in classrooms.
Therefore, as mentioned, if the condition permits, it is better to measure the CO2 on all four walls. If the number of devices is limited, then the most unfavourable location should be considered first. Outside CO2 concentration should be measured at one location. Besides, information of indoor occupancy and opening windows and doors should be recorded corresponding to the classroom schedule.
Discussion
Impact of ventilation regimes on CO2 concentrations
In this study, CO2 concentrations were measured at 18 indoor points and one outdoor point in a semi-laboratory classroom where different ventilation regimes could be applied. To identify the impact of the ventilation regimes on CO2 concentrations, four different ventilation regimes were monitored in the same room with same participants. Based on the results collected during the last 5 minutes of each regime, there were statistically significant differences between each of two different ventilation regimes, except for between ‘600 m3/h mixing’ and ‘open windows and door’. For these two regimes, significantly lower CO2 concentrations were observed, not only at the average levels but also at almost all sampling locations in the monitored room, than for the other ventilation regimes. This demonstrated that natural ventilation, under certain conditions, can provide the same ventilation as mechanical ventilation. However, this is not always the case. Many factors (such as the size of windows and doors, the airflow of the mechanical ventilation, the layout of the room, etc.) can affect this result. For example, as shown in the experiment, when only windows were open, CO2 concentrations measured in the Experience room of the SenseLab were much higher than the results measured during mechanical ventilation. Also, in the field study, CO2 concentrations measured in natural ventilated classrooms were much higher than in mechanical ventilated classrooms, consistent with the conclusion of a field study conducted by Toftum et al. 26 For the ‘no ventilation’ regime, the measured CO2 concentration was the highest of all regimes tested, it kept increasing and did not reach a steady state at the end of the monitoring period. For schools without mechanical balanced ventilation, we recommend all their windows and doors should be kept wide open.
Apart from average concentrations, the temporal change of CO2 concentrations was also illustrated ((see Figures 3 and 7), respectively for the lab and field studies) and compared between different ventilation regimes in both the lab and field studies. The results showed that the variation of CO2 concentration in the naturally ventilated classrooms (either ‘open windows and door’ or ‘open windows’) was more obvious than the variation in the mechanically ventilated classrooms, which is consistent with results reported by Wohlgemuth and Christensen. 27 This demonstrated two characteristics of CO2 concentration: (1) its sensitive response to changes of ventilation regimes and (2) its consistent trend at different measurement points in the same room. These characteristics have confirmed CO2 concentration as a qualified indicator for assessing ventilation performance in classrooms.
The distribution of CO2 under different ventilation regimes
For the vertical distribution of CO2, significant differences in the CO2 concentrations were found between two different heights (1.1 m and 1.6 m) at most locations under all ventilation regimes, except for the centre locations under ‘open windows and door’. In most cases, the CO2 concentration was significantly higher at 1.6 m, especially under the mechanical ventilation regime ‘600 m3/h mixing’. This was not in agreement with the conclusion drawn by Mahyuddin et al., 53 who claimed that in the mechanically ventilated classroom (with 3–4 air changes per hour), the effect of the height on CO2 concentration was not significant. The different findings might be related to the fact that in the study conducted by Mahyuddin et al., 53 there was an extra fan operating in the classroom which increased the mixing of air and contributed to the uniformity of CO2 distribution. The air velocity measured in their study was two to three times of that measured in the current study.
Additionally, significant differences were also found among different locations with same heights, namely, the uneven distribution of CO2 was also identified in the horizontal direction, no matter under which ventilation regime. Based on the analysis results, the most uneven horizontal distribution of CO2 was found for natural ventilation (either ‘open windows’ or ‘open both windows and door’), while the relatively less uneven distribution was found for ‘no ventilation’. The same is seen for the vertical distribution of CO2. In general, CO2 concentrations were higher at locations that were relatively far from windows (see Figure 4). Similar results were also found in the field study.
The most unfavourable location in real classrooms
According to the CO2 concentration measured in the field study, the wall opposite to the windows was found to be the most unfavourable location with always the highest CO2 concentration in the classroom studied, no matter under which ventilation regime. This result differed from the result obtained in the lab study. In the Experience room, the maximum CO2 concentration always appeared on the back wall instead of the right wall (the wall opposite the windows), which might be caused by the different size and layout of the Experience room as compared to a real classroom. Specifically, the distance between windows and the opposite wall is much further away in a real classroom, which might reduce the chance for the fresh air coming from windows to reach the opposite wall. The wall opposite to windows becomes then the most unfavourable location in the classroom. However, the choice is not always fixed, which can be changed based on the layout of each individual classroom.
Guidance for CO2 monitoring in the field
Although trends in the variation of CO2 concentration over time were similar at all indoor measurement points (see Figure 2), differences in CO2 concentrations between different points cannot be ignored, especially under natural ventilation regimes. Differences between two measurement points, in some cases, exceeded 300 ppm (or 40%) in the natural ventilated classrooms. These findings confirmed the conclusion drawn by Seppänen et al. 47 and Mahyuddin et al. 53 that CO2 was spatially nonuniform distributed, which indicates the importance of choosing the ‘right’ number of measurement points and the ‘right’ measurement locations.
To avoid interfering with students’ classroom activities, this study recommends measurement locations on walls for monitoring in real classrooms. Additionally, to increase the credibility of results, more than one measurement point is recommended in the field study, especially under natural ventilation or no ventilation regimes. For classrooms with natural ventilation, at least two points are recommended: (1) the point on the wall opposite to windows because CO2 concentrations measured at this point were the highest in the classroom and (2) the point on the front wall of the classroom because the results measured at this point were relatively close to the average level. For classrooms with hybrid ventilation systems (only mechanical supply or only exhaust), the same points are recommended. For classrooms with mechanical balanced ventilation systems, one measurement point seems enough because CO2 is relatively well-mixed under this ventilation regime. This is consistent with the conclusion made by Racks et al. 22 that CO2 concentrations were homogenous in mechanically ventilated areas because the standard deviation of CO2 concentrations between different locations could be covered by sensor error. ‘No ventilation’, given the fact that this ventilation regime is hardly seen in real classrooms according to observations in the field study, is not further discussed in this study.
Furthermore, concerning other aspects of CO2 measurements referred to in previous studies,14,47 future studies are recommended to (1) use continuous instead of instantaneous measurements, with as long as possible measurement intervals, especially in naturally ventilated classrooms; (2) measure the outdoor CO2 concentration and (3) record occupants’ information (e.g., numbers and age group, etc.) and behaviour (e.g., opening windows and door) during the measurement period.
Conclusions
A full-scale experiment was conducted in the Experience room of SenseLab to investigate the distribution of CO2 concentration under different ventilation regimes. Based on the experimental results, four measurement points on the four walls with a height of 1.1 m (the height of the head of a sitting person) were recommended to be selected in future studies on CO2 concentrations to obtain results that are closer to the average level and to understand the worst situation.
To test the feasibility of that recommendation, a field study was thereafter carried out in seven classrooms of two Dutch secondary schools. Both the lab and the field study confirmed the uneven distribution of CO2 in classrooms, especially under natural ventilation. Therefore, it is recommended to select multiple points in future studies.
For classrooms with natural or hybrid ventilation, at least two measurement points (one on the wall opposite to windows, as the most unfavourable point, and the other one on the front wall, as the average point) are recommended. For classrooms with mechanically balanced ventilation, one measurement point on the wall opposite to the windows is acceptable since CO2 is relatively evenly distributed under this ventilation regime.
Next to the selection of indoor measurement points, this study suggests future investigations to also measure the outdoor CO2 concentration and record the number and behaviour of occupants during the measurement.
Footnotes
Acknowledgements
This study is a part of the ZonMw funded project “SARS-CoV-2 transmission in secondary schools and the influence of indoor environmental conditions” (no. 50-56300-98-689) coordinated by University Medical Centre Utrecht in the Netherlands. Participants are Erasmus Medical Centre in Rotterdam, the Netherlands; University of Utrecht, the Netherlands and Delft University of Technology.
Authors’ contribution
Dadi Zhang contributes in conceptualization, methodology, investigation, data analysis, writing-original draft preparation, writing-review and editing. Er Ding contributes in investigation, writing-review and editing. Philomena Bluyssen contributes in conceptualization, methodology, supervision, writing-original draft preparation, writing-review and editing.
Declaration of conflicting interests
The author(s) declared no potential conflicts of interest with respect to the research, authorship, and/or publication of this article.
Funding
The author(s) disclosed receipt of the following financial support for the research, authorship, and/or publication of this article: This research was supported by ZonMw (50-56300-98-689).