
Abstract
Most thermal comfort research has traditionally focused on office and commercial buildings as opposed to educational facilities. Due to the high population density in schools and the undesirable impact an unsuitable thermal setting can have on performance, teaching and learning, providing thermal comfort in school facilities is crucial. Considering the above information, this study aims to collect empirical data from secondary schools in Abuja’s hot and dry climate to evaluate thermal comfort settings for students in naturally ventilated classrooms and the applicability of ASHRAE Standard-55 in the area. To achieve this, field investigations were conducted in free-running classrooms from four secondary schools. The study involved 1448 students drawn from 41 classrooms. Data collection involved measuring classroom thermal comfort variables and respondent survey, simultaneously performed while students were learning in the classroom. Findings revealed none of the studied classrooms’ thermal conditions met the ASHRAE Standard-55 comfort range. However, 44% of students felt comfortable. The study indicated a regression-neutral temperature of 28.8°C and a ‘comfort temperature’ range of 26 to 31°C. The findings of this research could form the foundation data for a local thermal comfort standard. However, the prior thermal experiences of respondents were not investigated in this study.
Introduction
In recent years, the indoor environment has caught the attention of scientists and the public. It is an environmental component that significantly impacts health and well-being.1,2,3 The indoor climate warrants special attention because, in modern society, people spend a more substantial part of their life indoors.1,4,5,6 The top indoor environmental quality element that generates the most concern amongst building occupants is thermal comfort.6,7 According to the American National Standards Institute (ANSI) and American Society of Heating, Refrigeration and Air Conditioning (ANSI/ASHRAE Standard-55-2020), 8 ‘Thermal Comfort’ (TC) reflects the state of mind, which is assessed based on a subjective judgement of satisfaction with the thermal environment. From this definition, ‘state of mind’ or ‘satisfaction’ is not precise. The essential fact is that comfort is a ‘cognitive process’ shaped by psychological, physical, physiological and other factors.9,10 The broader research community accepts this definition of TC. It is the foundation for TC standards such as International Standard Organization (ISO 7730:2005) 11 and ASHRAE Standard-55-2020. 8
Several indices exist for measuring TC, but the ones most often used are ‘Fanger’s rational’ and the ‘adaptive models’. 12 The first model works better in air-conditioned (artificially ventilated) facilities where inhabitants are in steady-state conditions with little ability to adjust.7,13 However, these situations do not usually exist in educational buildings, and they are frequently incompatible with climates in both temperate and tropical regions. 14 To overcome these issues, scholars have made changes to the Predictive Mean Vote (PMV) index and proposed the Extension of Predicted Mean Vote (ePMV) 15 and Adaptive Predicted Mean Vote (aPMV) 16 to analyze the thermal climate in educational facilities. The second model is better in free-running buildings and is consistent with the adaptable model’s premise, emphasizing that people can alter their surroundings to feel comfortable. 7
Researchers are primarily interested in the indoor thermal environment as most people spend more time inside than outside.7,17 Previous research indicates that the eventual success or failure of a building, in terms of energy use, long-term viability and occupant satisfaction, depends heavily upon its indoor thermal comfort. 7 Since the end of the 20th century, researchers have paid much attention to the study of indoor thermal comfort in buildings. 18
Educational buildings are of great interest when considering the potential associations between building performance, TC and energy consumption. 19 Since students spend the majority of their time in schools,14,19 creating a pleasant and productive thermal environment is essential. Such an environment maximizes focused attention and learning. The thermal performance of a classroom impacts not only the students’ health and comfort but also their learning efficiency and productivity. 13 Schoolchildren spend much time at school. It is, therefore, essential to study the links between classroom features and comfort, especially for children who are more likely to be exposed to unfavourable indoor thermal conditions.7,17 Since educational facilities aim to give teachers and students the best environment for learning, 20 classrooms should be built with climate responsiveness in mind. 21
One of the cardinal responsibilities in the design of a building is to implement building codes and standards to provide a physical environment that is safe, healthy and appropriate for TC. 22 To achieve TC and reduce energy costs in a building, standards such as ‘Thermal Environmental Conditions for Human Occupancy’ set by the ANSI/ASHRAE 55-2020 8 and ‘Specifications of Conditions for Thermal Comfort’ have been detailed by the International Standard, ISO 7730:2005. 11 These standards stipulate precise physical conditions to achieve a thermally conducive environment acceptable to a minimum of 80% of occupants. 8
The majority of the data underlying these international standards was obtained in part through climate chamber experiments in laboratories located in America’s and Europe’s mid-latitude climate zones. 23 The practicability of these standards has been questioned in different climatic zones. There has been increasing discontent with the climate chamber grounded heat balance model method for predicting the conditions people will find thermally comfortable in buildings. 24 The adaptive comfort standards in the international thermal comfort standard are now considered an optional choice for naturally ventilated buildings. This is because it is the only approach that allows the calculation and design of desired indoor temperatures with occupants-controlled natural ventilation. However, this model is also inappropriate for evaluating thermal adaptation levels and developing thermal comfort models in different climates. 25 As some adaptive comfort research also revealed, building occupants find indoor thermal conditions acceptable while thermal sensation votes (TSVs) exceed the value specified by ASHRAE Standard-55.25,26 Hence, validating the model globally to improve thermal comfort for all building occupants is necessary.
Several field studies have already been undertaken on TC in classrooms.6,19,26,27,28,29 The picture is complicated, but some common themes show that more research is needed to determine which criteria are correct and which need improvement. For instance, in Madina, Accra, Ghana, a field study was conducted at St. Andrews Junior High School. 30 The study investigated students’ perceptions of comfort and the prevailing thermal environments in the classrooms. The results revealed that, though many students approved of the overall thermal conditions, they fell short of the ASHRAE-specified 80% TC threshold. The investigation concluded that students in Ghana might have a higher tolerance for temperatures exceeding the expected standards of between 26°C and 28°C (summer comfort range) by 1°C to 5°C. This is in accord with the suggestion of Nicol, 31 and Ogbonna and Harris. 32
A 2019 study by Ali and Al-Hashlamun 33 evaluated the internal thermal climate in various Jordanian prototype school buildings. The research assessed and contrasted the effects of envelopes in un-insulated and thermally insulated school blocks using field monitoring and simulation. The result indicated that both schools surpassed the range of comfort values at peak periods. Recently, most of the research on thermal comfort in classrooms was compiled and categorized in three extensive studies by Singh et al., 20 Mohamad, Ismail and Md Ajis, 34 and Zomorodian, Tahsildoost and Hafezi. 14 Most of these studies found that the temperature ranges students liked were outside what is usually considered acceptable by ASHRAE Standard-55.
Despite the significance of studying thermal perceptions in classroom settings, early data on thermal comfort in Nigeria was collected in hostels, houses and office buildings. 7 Secondly, most of the study participants were adults, even though the country’s population is predominantly comprised of people between the ages of 0 and 19. 35 Researchers conclude that children may perceive comfort differently from adults because of the significant differences in age, activity and metabolic rates between the two groups.14,20,34 Additionally, a comfort temperature assessment performed in one region geographically cannot be generalized due to variations in culture, building types and climates.7,20
Considering the above information, the objective of this study is to evaluate students’ thermal comfort in naturally ventilated classrooms in the tropical savanna climate and to certify compliance with ASHRAE Standard-55. Findings from this research may lead to the establishment of foundation data for classroom thermal comfort and related studies in the climatic zone. It may also inform the design of new classrooms and the evaluation of TC conditions in existing ones.
Methods
Location of the case study and climate
Abuja is in Nigeria’s Northcentral region, and its area is approximately 1994 km2. It lies between latitude 9o 03′ and 9o 07′N and longitude 7o 26′ and 7o 39′E 36 and at an altitude of 840 m above sea level. 37 In the 2006 census, the city had a population of 776,298, making it one of Nigeria’s eight most populated cities.
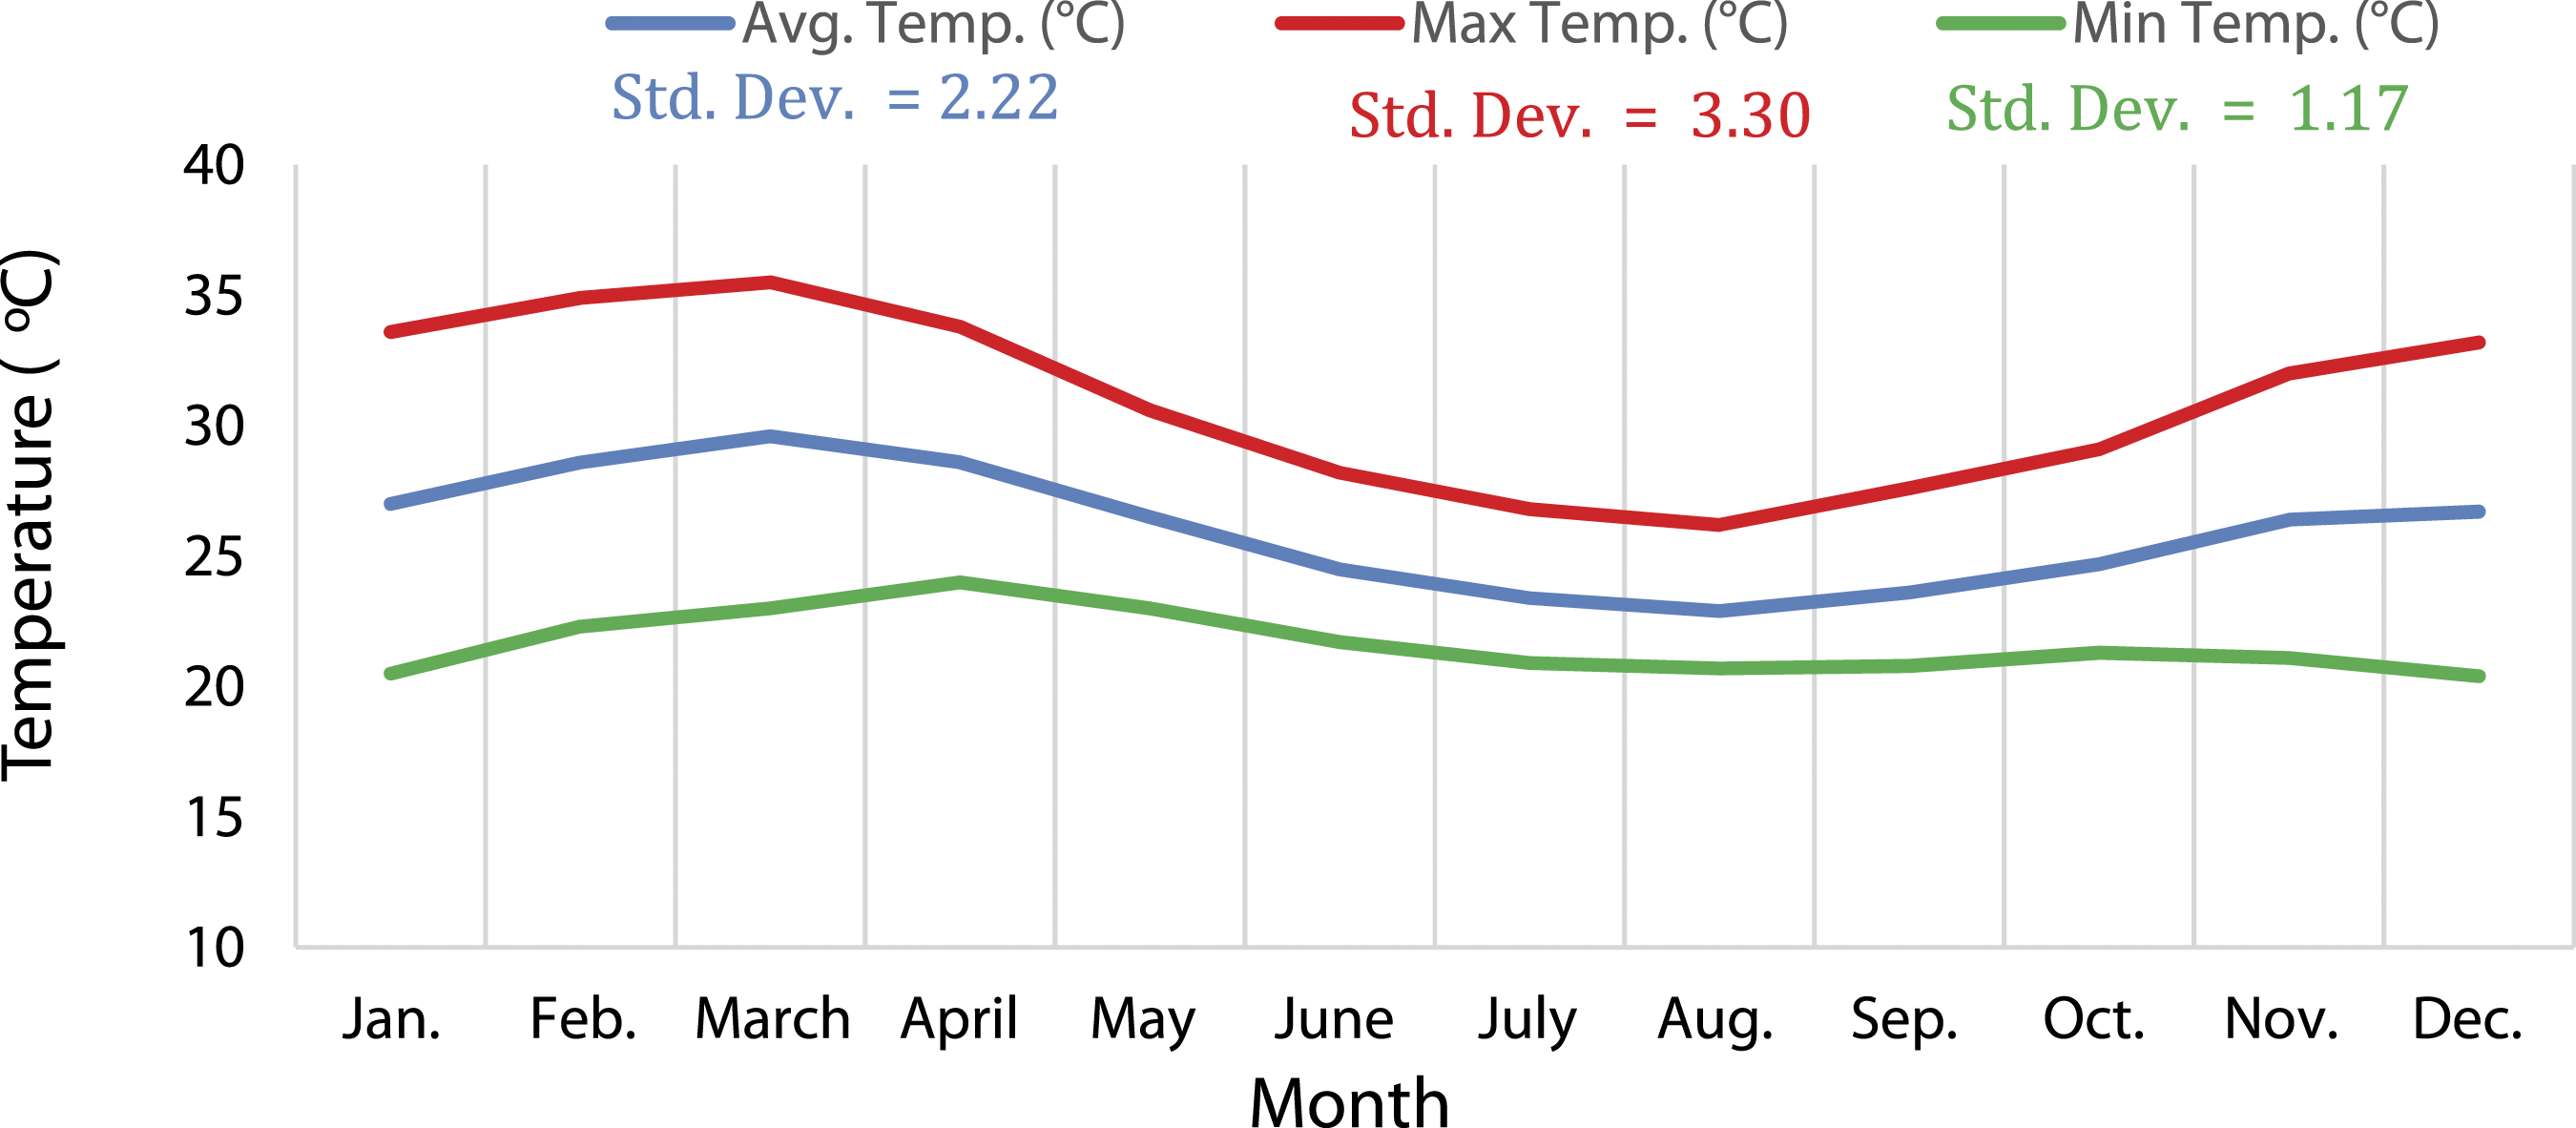
The tropical savanna climate (AW) is the Köppen Climate Classification subtype for Abuja. Abuja has two weather seasons annually: warm and humid (wet season) and hot and dry (dry season). A brief harmattan period exists between the seasons, usually from early December and lasting through February. The weather is chilly, dry, foggy and dusty during the harmattan season. Except for the harmattan period, the region’s temperature is usually high for the more significant part of the year. The maximum air temperature during the day is between 28 and 36 degrees Celsius, with a low night-time temperature of 18 to 23 degrees Celsius.
37
Figure 1 shows that March has the highest average temperature (35.5°C), while August has the lowest average high temperature (26.2°C). The hot season lasts from the end of January to the middle of April, with an average daily high temperature exceeding 32°C. A graph of monthly temperature data for Abuja. Source: Adapted from Climate-Data (2021).
39
Between November and April (dry season), the average number of sunshine hours is around 250–275 hours per month. However, it decreases to 125 hours per month during the wet season. There is also a seasonal change in relative humidity in the research area. The humid season lasts nine months, from the end of March to November, and it is low from December to mid-March. The rain begins from the middle of March to early April, while the end of the rainy season is around the middle of October to early November. 38 The intensity of rainfall is high from July to September, which accounts for around 60% of the region’s total precipitation.
Data collection
Based on the climate profile of Abuja, physical measurements and respondent surveys were simultaneously conducted between 5th and 13th March 2020 (except for weekends, 8th and 9th) and 2nd and 4th March 2021, in secondary school classrooms. In Abuja, March signifies the period of highest thermal discomfort when the average daily high temperature surpasses 32°C. 40 Respondents are senior secondary school students and class teachers. The choice for this study is the cross-sectional sampling method. This is in line with previous similar thermal comfort research in classrooms.41,42
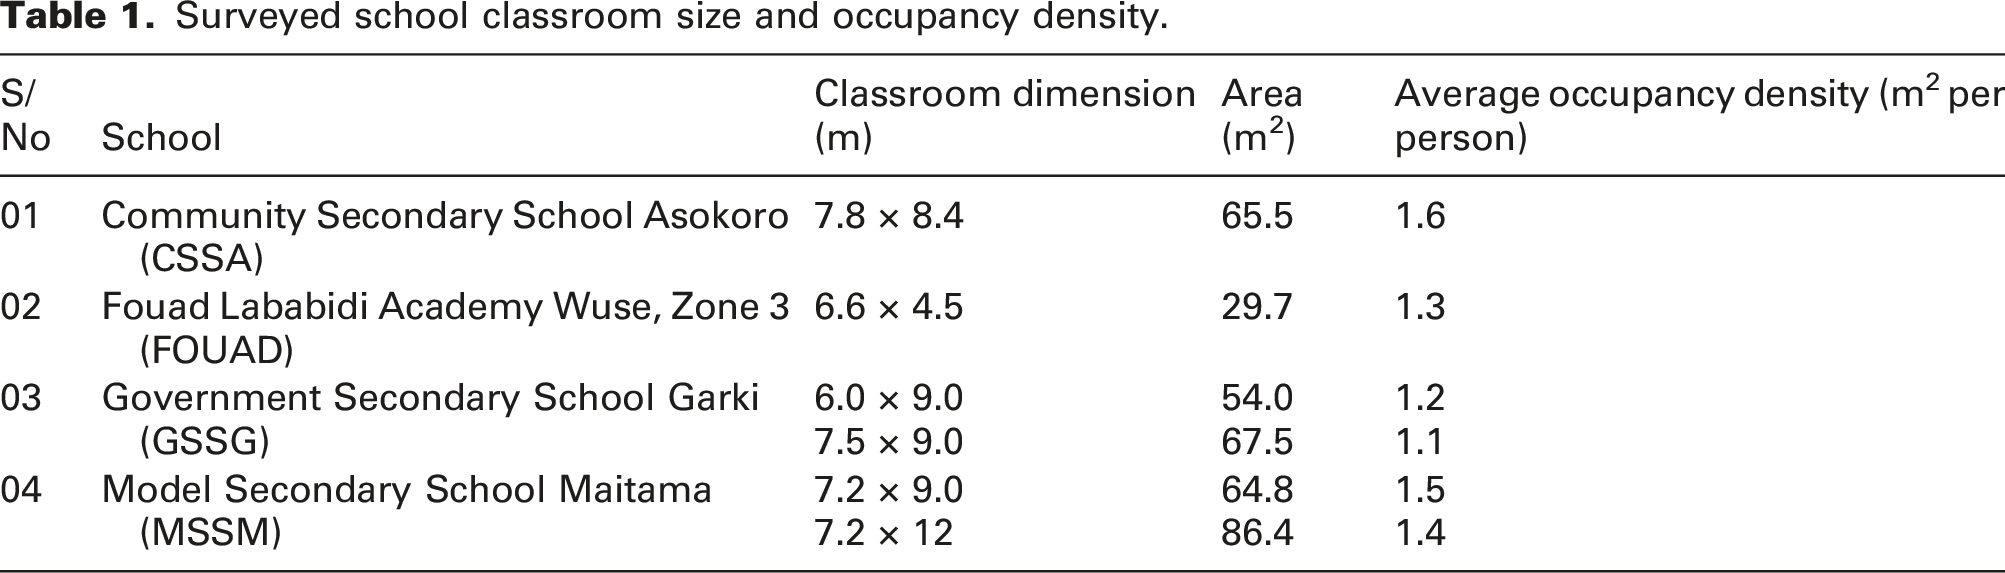
Cluster sampling techniques were used to select school buildings from 67 secondary schools. This survey identified 29 schools clustered into four groups based on school group, ownership status, ventilation mode, the purpose for which the building was erected and building typology. A school was then selected from each group based on its ability to meet the following criteria: i. Accessibility and the granting of permission to undertake fieldwork in the school by school administrators. ii. The number of classrooms that have a north-south orientation. iii. Classroom size and occupancy density (Table 1). Surveyed school classroom size and occupancy density.
The survey comprised multiple classes in each school, and respondents in 41 classes participated in the study from four schools. The survey was carried out while students were participating in learning activities in the classroom. Before data collection, students were adequately briefed on the survey’s purpose and participation. The respondents voluntarily participated, and the fieldwork was conducted during the regular classes.
Physical measurement. This study’s indoor climate measurement system was chosen to least interrupt normal class activities while still retrieving data accurately during a classroom visit.
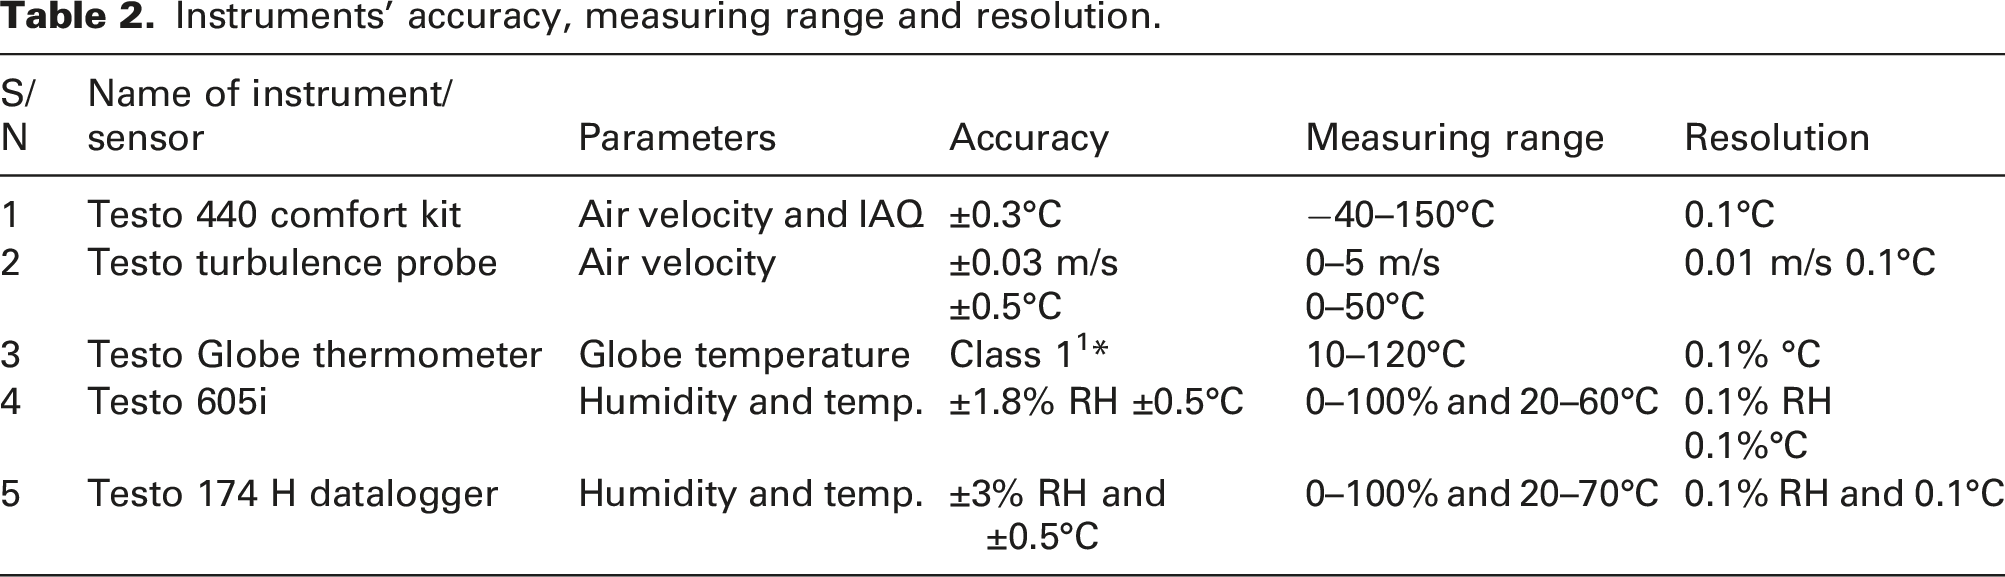
Instruments’ accuracy, measuring range and resolution.
Physical measurements were taken at three points in each classroom. The thermal environments’ homogeneity was evaluated using the measured data to determine whether it was required to divide the space into various thermal zones. The thermal environment is homogenous if the environmental factors are uniform all around the subjects. This condition is validated when the variations between measured quantities (at locations) and average values do not exceed thresholds based on measurement class type.
17
Depending on how the occupants were spread out, the Testo 440 comfort kit (Testo 440 measuring instrument, Testo 605i, Testo Turbulence probe and Testo Globe thermometer) was placed at a mid-location in the classroom. In contrast, two additional Testo 605i (probes for measuring indoor temperature and humidity) were placed at two (2) stations in the room (Figure 2). Environmental variables were measured at the height of 1.1 m above the ground level, representing the height of the students at the seated level, following UNI EN ISO 7726
43
guidelines, for 40 minutes.10,17 The measurements were taken every 10 s and averaged at intervals of 3 minutes. The devices remained stationary in the classroom for each class survey. Outdoor sensors were placed at 1.2 m following the recommendations of Burt.
44
At the end of each day’s classroom visit, the sensors’ data were uploaded to the computer, and averages for each class were documented. Instrument positioning in the classroom.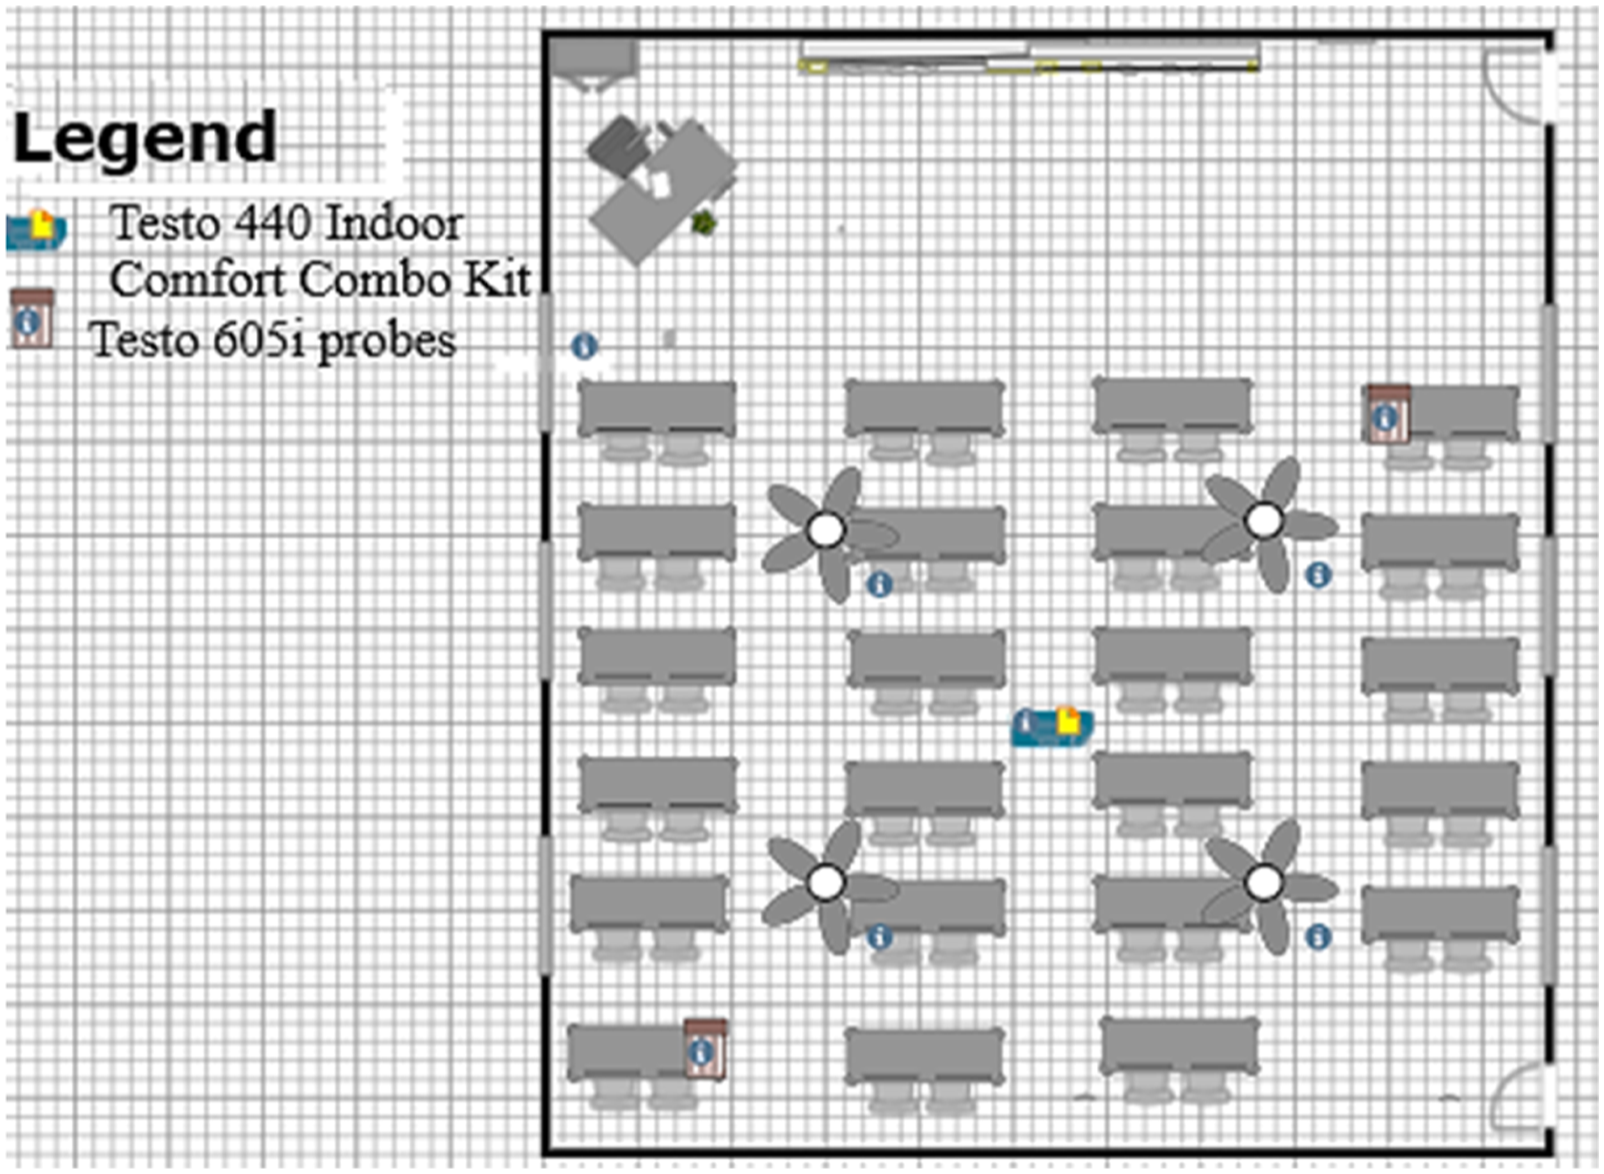
The CBE thermal comfort tool
45
was used to calculate the mean radiant temperature. The operative temperature (Top) was measured by two indices as presented by ASHRAE Standard-55.
8
The first index of operative temperature is the weighted average of air temperature and the mean radiant temperature as shown in equation (1):
‘A’ as a function of the average airspeed Va.
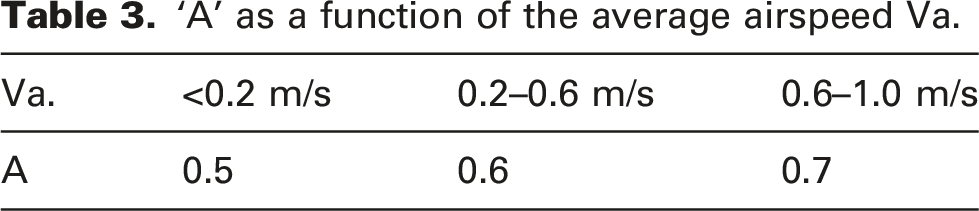
This equation’s limitation is that the metabolic range must be within 1.0 to 1.3 MET and devoid of solar radiation.
The second index of operative temperature is for moderate thermal environments, where Tmr − Ta <4°C.
46
The operative temperature stands for the simple average between air temperature and the mean radiant temperature as defined by equation (2)
10
:
(Provided that the air velocity (Var) is less than 0.2 m/s and the absolute value of the disparity between the radiant and air temperature is not more than 4°C.)
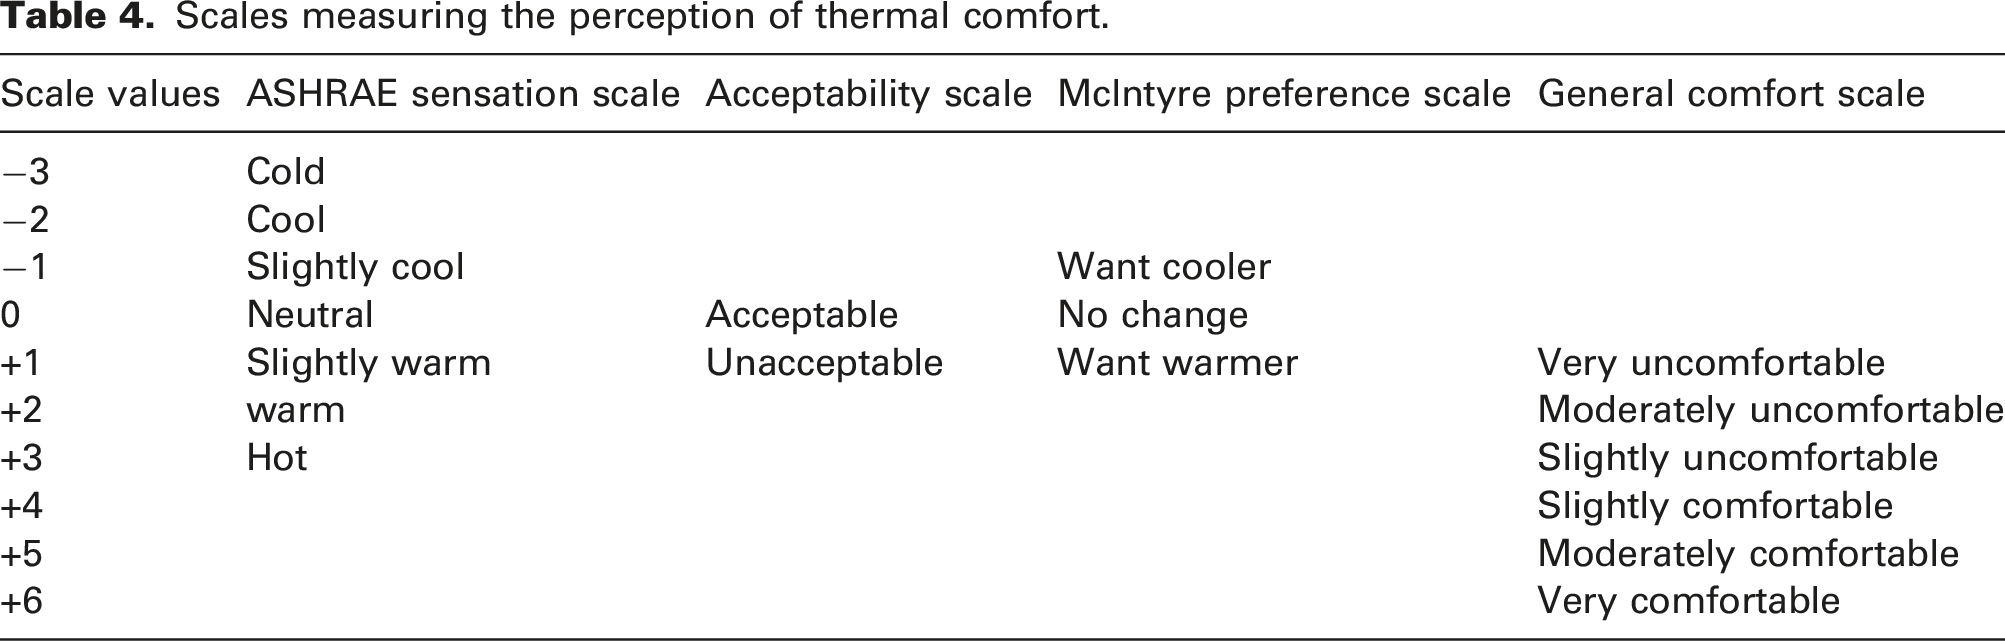
Scales measuring the perception of thermal comfort.
The metabolic rate, which is the activity level of students in the classrooms, was assumed to be 1.0 MET (representing the value of sedentary activities such as reading, writing and sitting). This corresponds to the activity level for such activities in the ASHRAE Handbook of Fundamentals.
10
The procedure for conducting the survey is summarized in Figure 3. Measurement protocol for the field survey.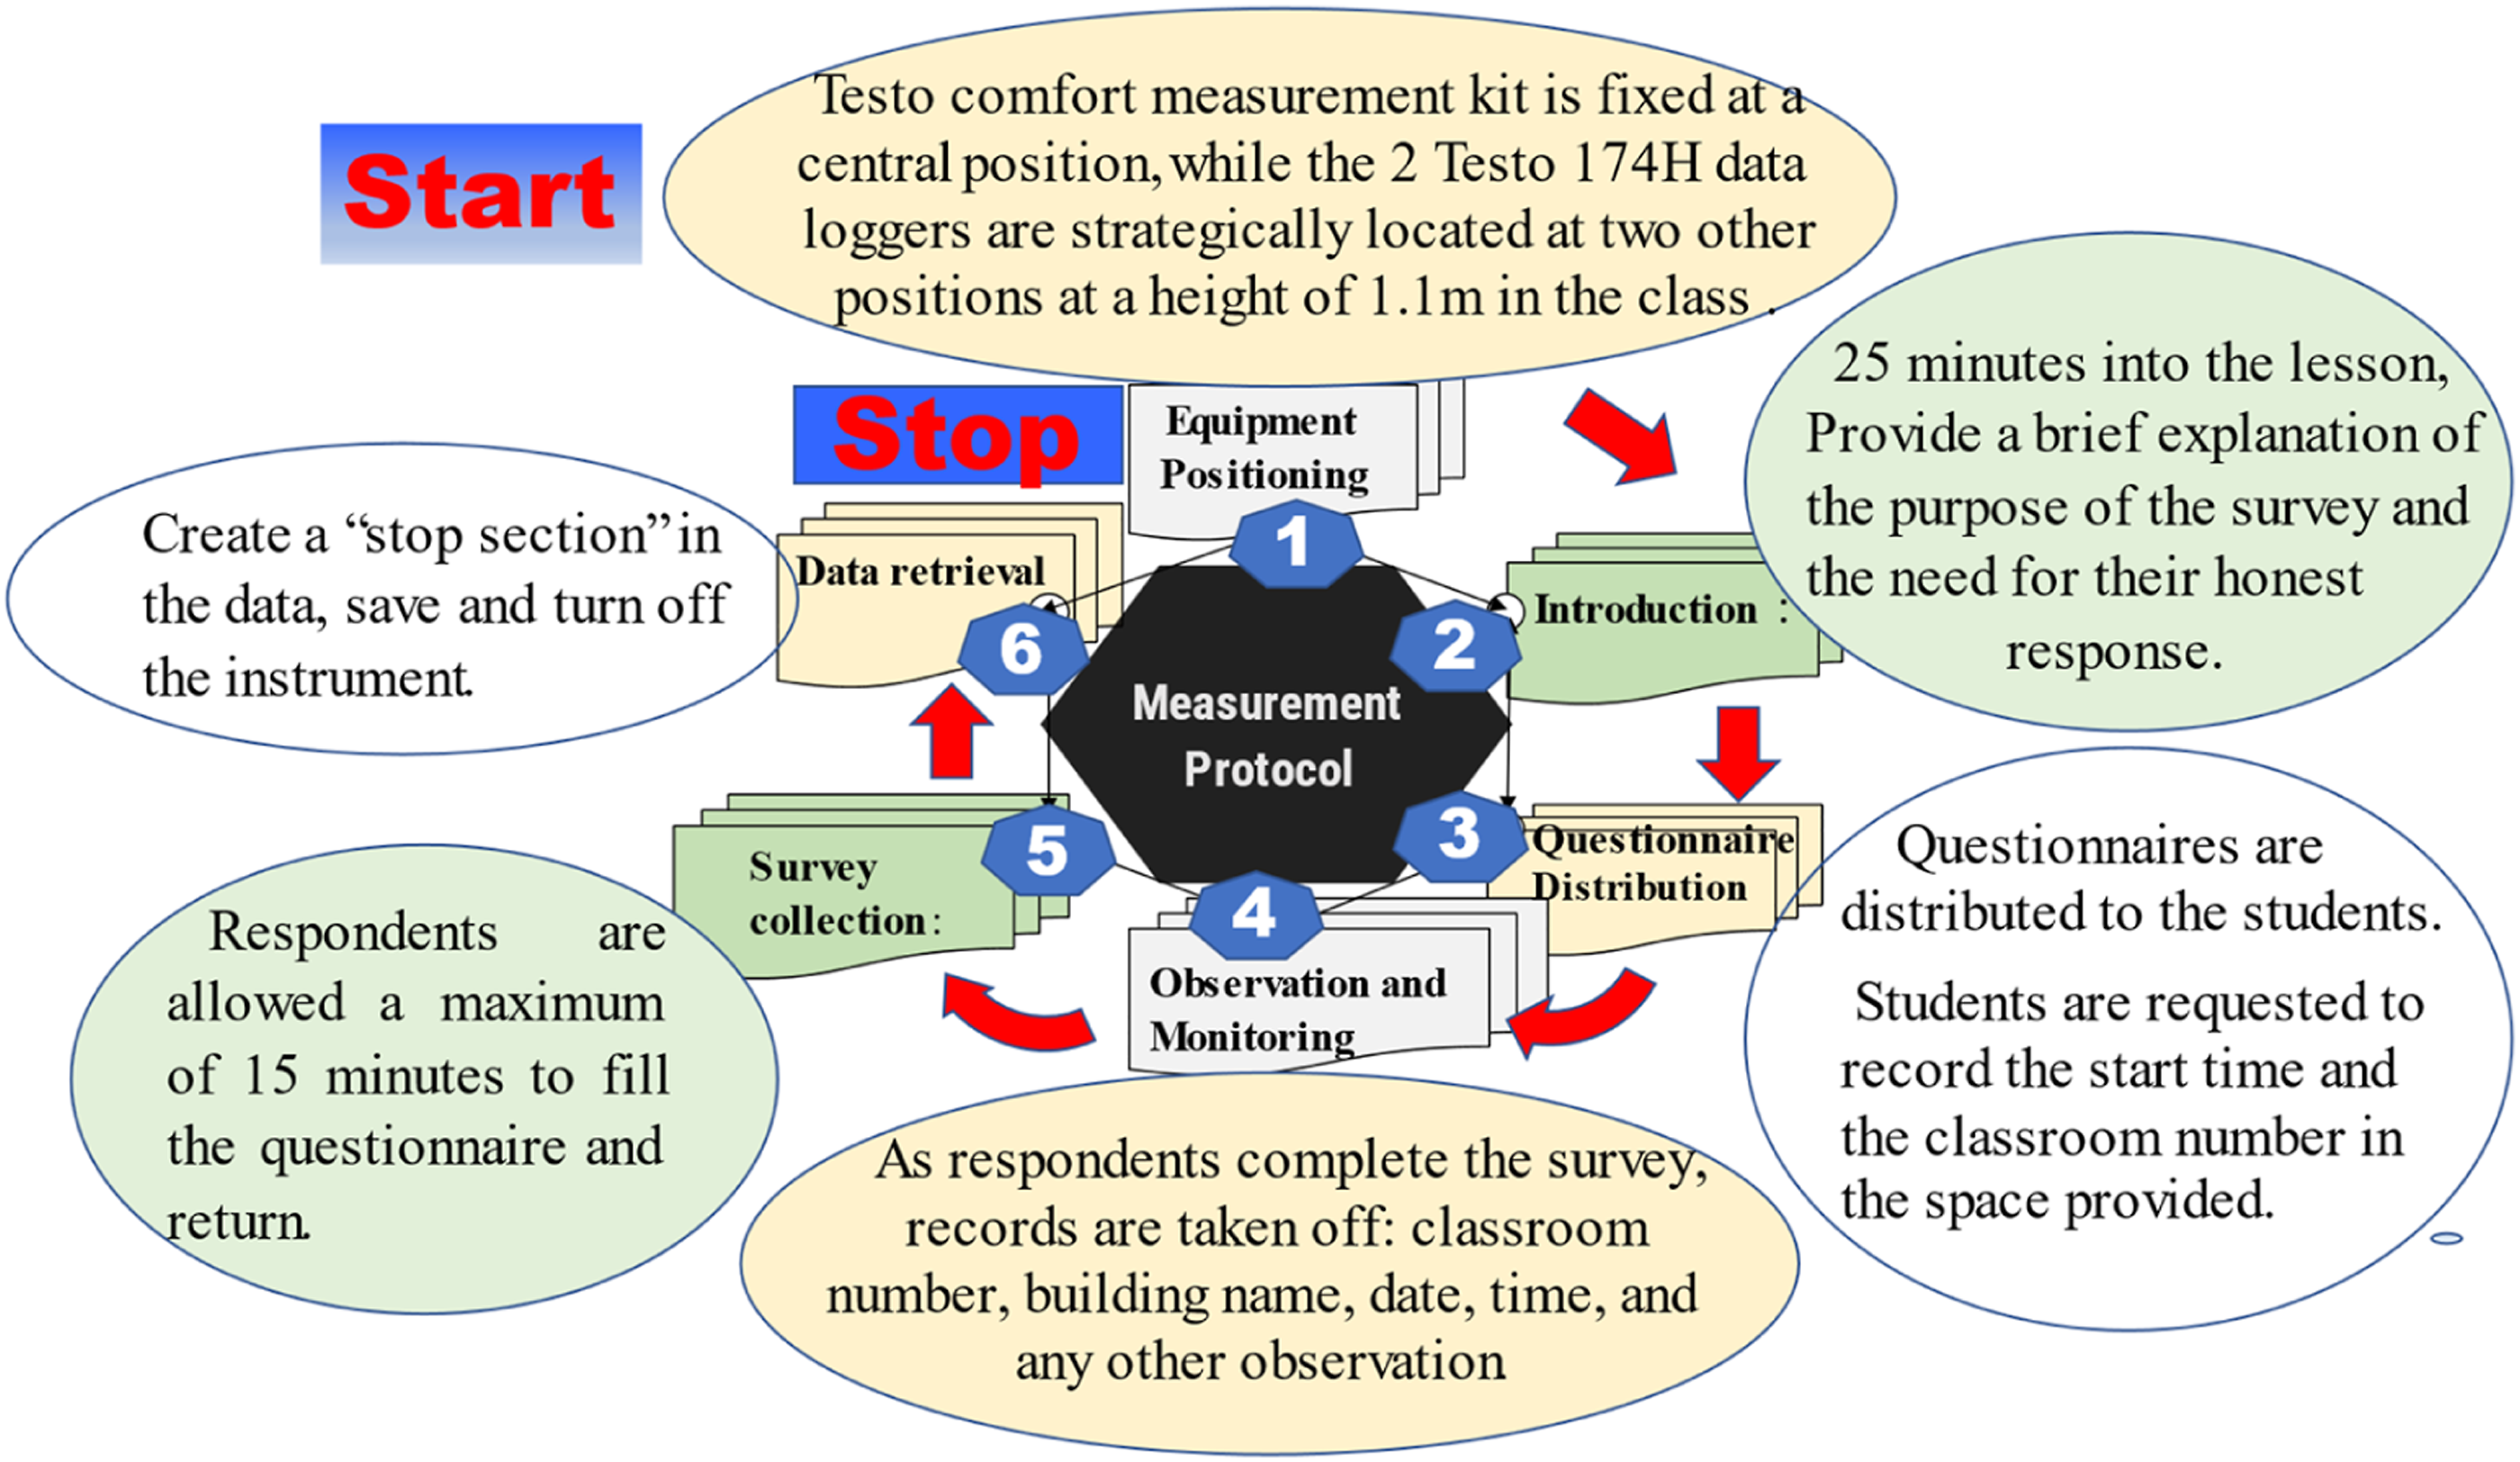
Data analysis
Raw data from indoor and outdoor climate, subjective thermal perception, clothing insulation value and metabolic rate were compiled and coded into an Excel spreadsheet. Calculated thermal indices (using CBE thermal comfort tool software) were added to the spreadsheet. Data from the spreadsheet was loaded into the SPSS 23 file. Excel and SPSS analysis software was used to summarize, tabulate, make charts and determine neutral temperatures. The descriptive statistical method employed for this study included finding percentages, frequencies, means, minimum and maximum values and standard deviation. The standard deviation was employed to describe the variability of measured units for the objective and subjective measurements. Regression and Pearson’s product-moment correlation were used as inferential statistical approaches in this investigation. Regression modelling was used to quantify how thermal indices correlate with occupants’ thermal perception.
Results
Sample characteristics
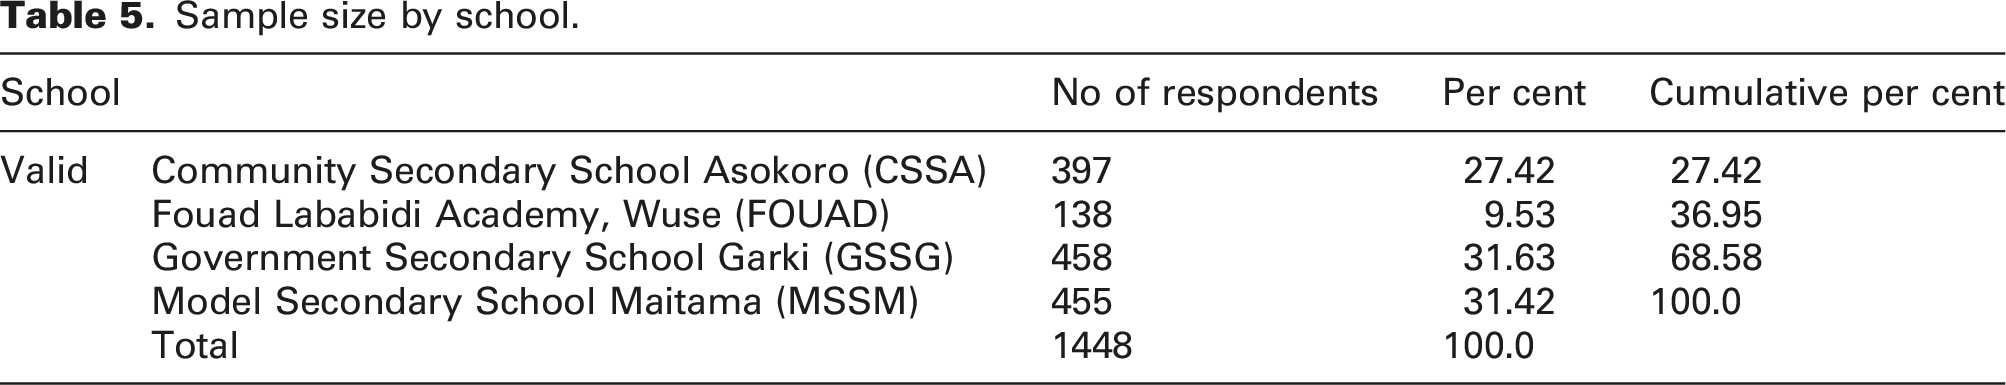
Sample size by school.
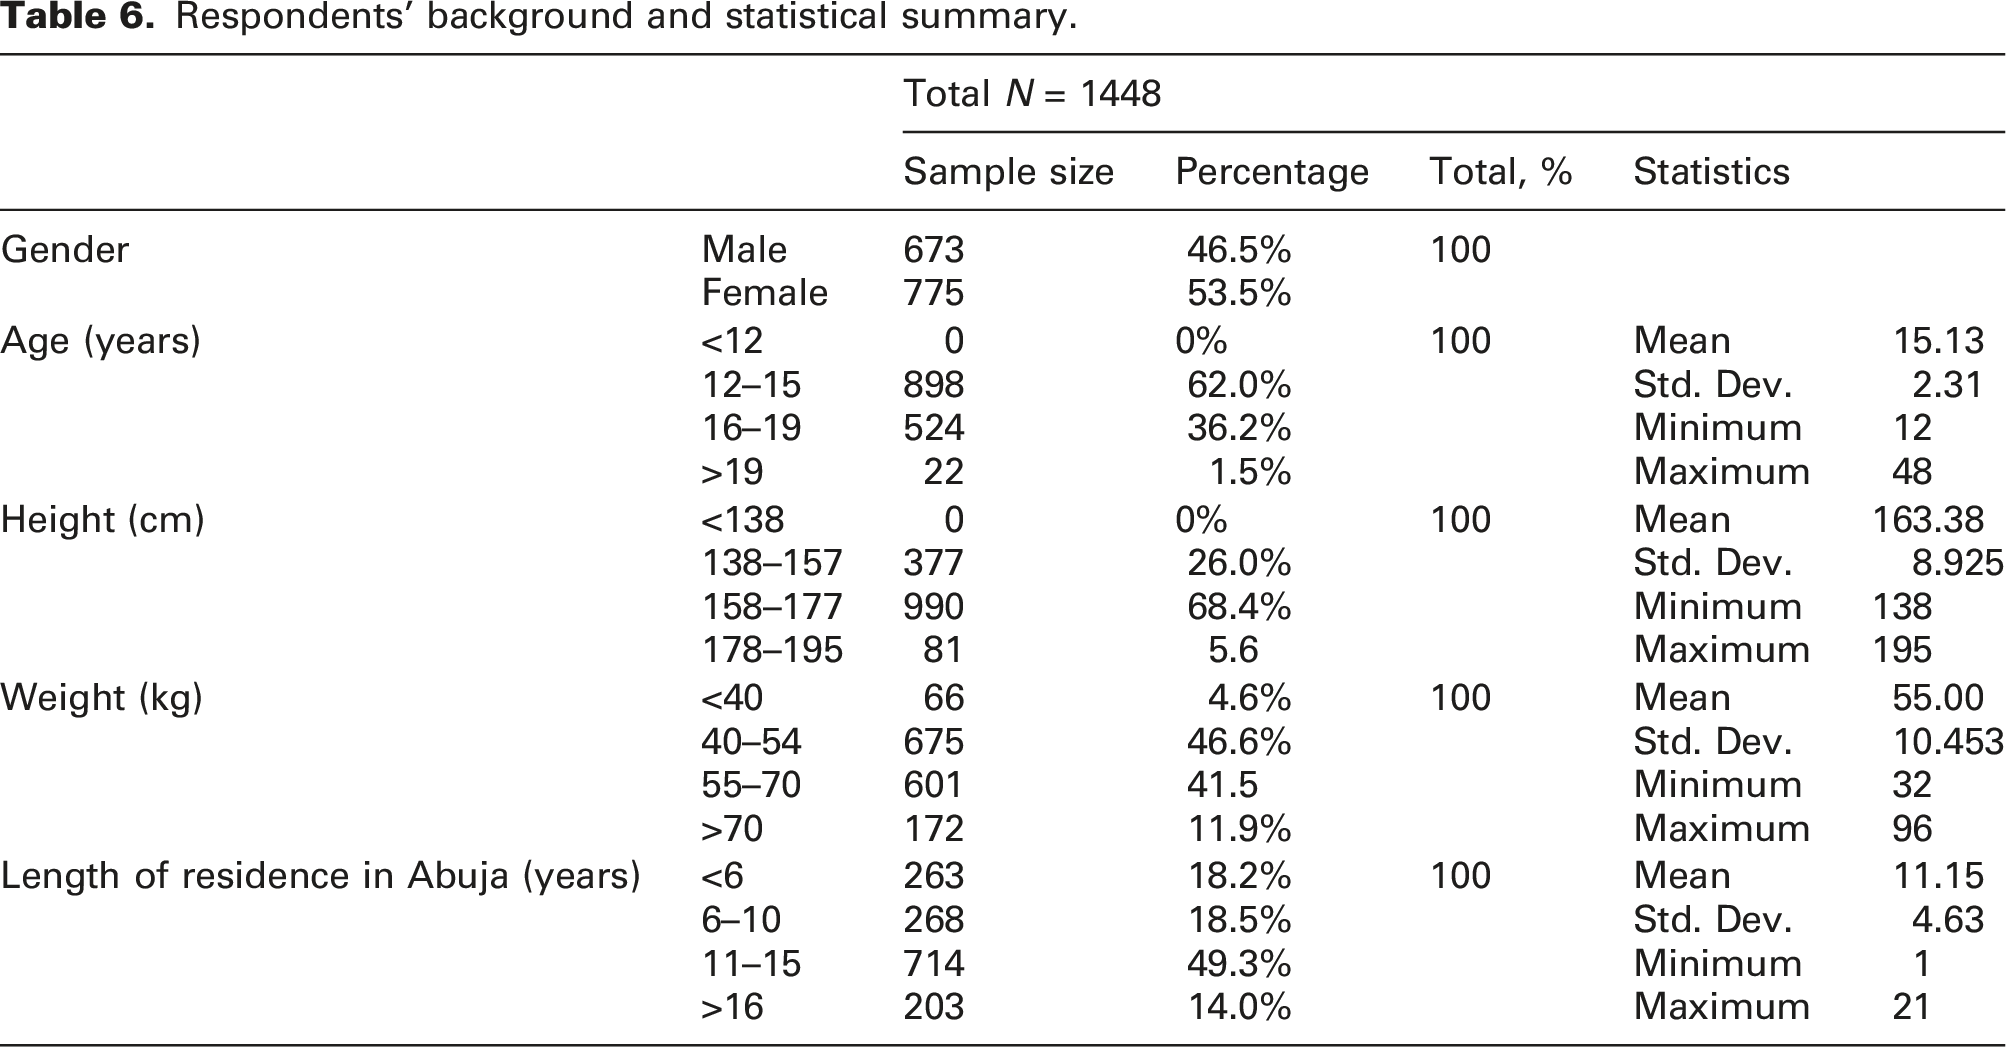
Respondents’ background and statistical summary.
Clothing insulation factors
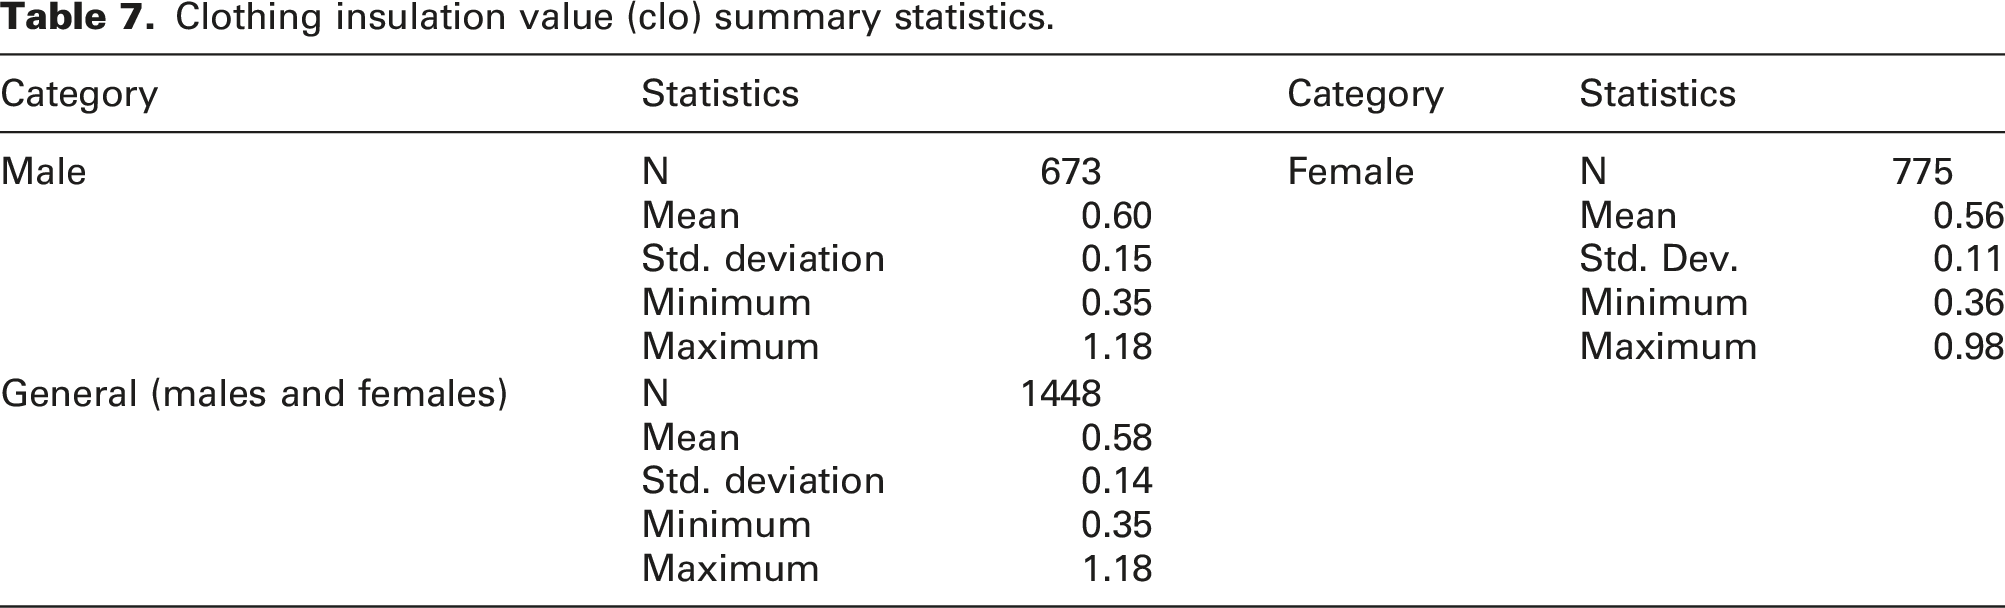
Clothing insulation value (clo) summary statistics.
On warm days, students enjoy taking off their sweaters, vests or suits as the day progresses and the temperature rises. They occasionally undid one or two buttons from their shirts. On such days, students who wore full sleeves often rolled up their sleeves. This behaviour may be related to progressive adaptation to high ambient temperatures. Typically, adaptive changes are things people consciously choose to do, such as changing their clothing, posture, activity levels, work pace, ventilation, air flow, food or the surrounding temperature. 10 Other thermal comfort surveys have noted similar occupant behaviour.47,48,49
Thermal comfort variables
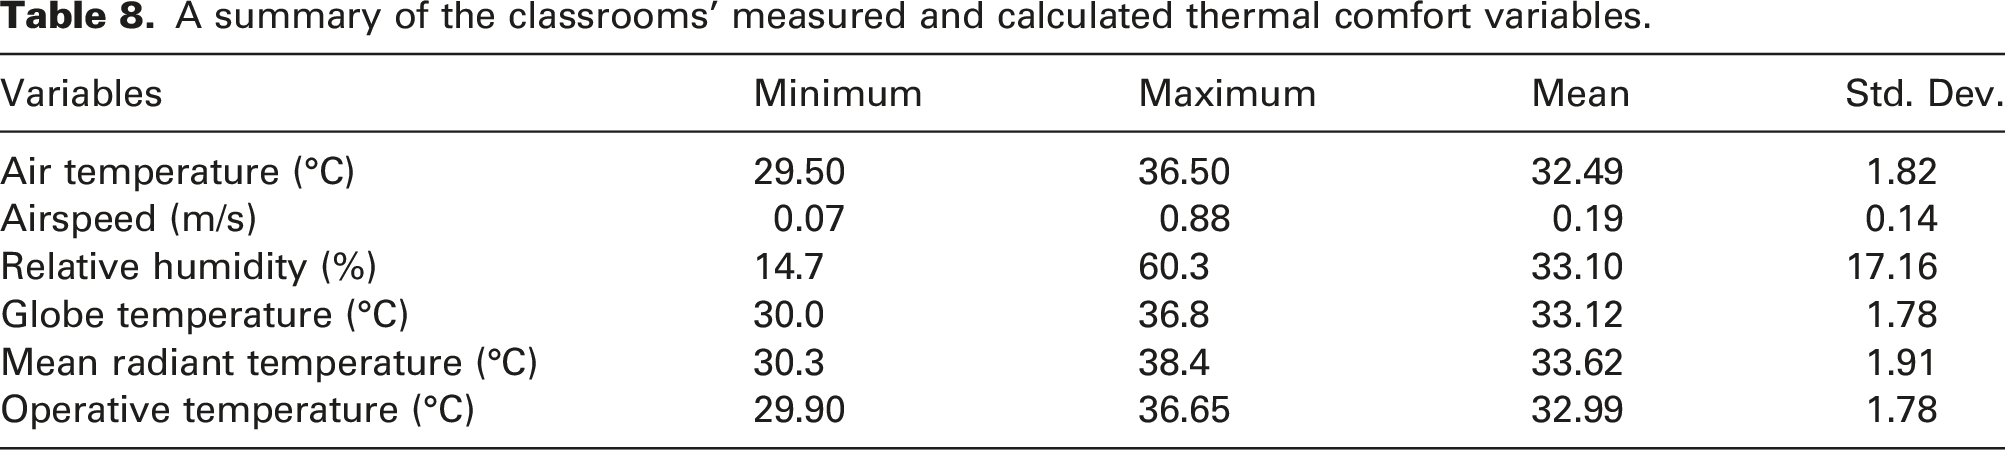
A summary of the classrooms’ measured and calculated thermal comfort variables.
The outcomes of these findings did not show a wide divergence from the findings of Adaji et al., 50 on residential structures in the same locality. From March to April, the amount of humidity in the air changed significantly in the study area, which explains the disparity in humidity values in the two studies.
ASHRAE Standard-55 8 provides guidelines intended to satisfy most building occupants. The guidelines recommend temperatures between 19 and 28 degrees Celsius. There are no established lower humidity limits for thermal comfort. However, the acceptability of very low humidity conditions may be constrained by non-thermal comfort variables. 8 Based on this recommendation, all the studied classrooms (temperature range 29.5 to 36.5°C) were outside the ASHRAE Standard-55 upper limits of the comfort range. The classrooms are, therefore, not thermally comfortable as they failed to satisfy ASHRAE Standard-55 comfort criteria.
Relationship between indoor and outdoor climate variables
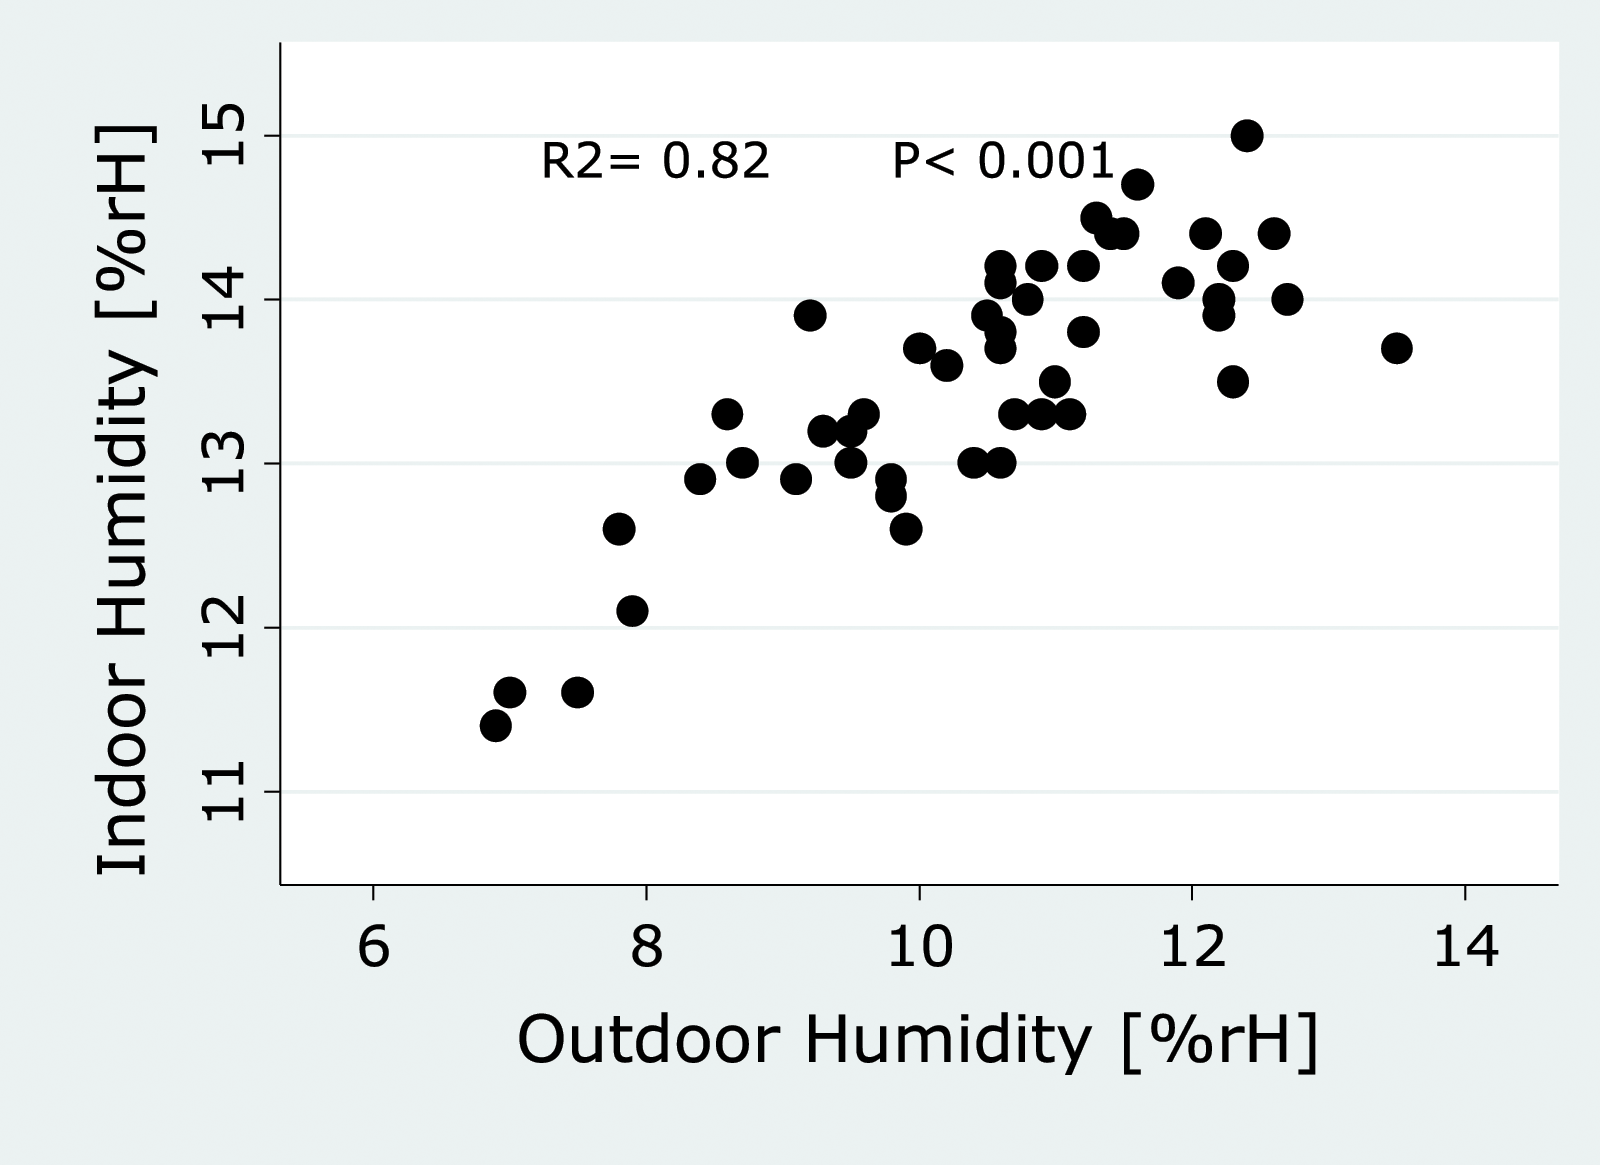
The classrooms are free running, and there are no restrictions regarding opening doors and windows. Classroom windows and doors were left open throughout the survey period. The opening-to-wall percentage for the classrooms varied from 11 to 14%. Accordingly, in Figure 4, the correlation between indoor and outdoor air temperatures is robust. Pearson’s correlation coefficients for indoor and outdoor air temperature were 0.95 (p <0.001), while those for indoor and outdoor humidity (illustrated in Figure 5) were 0.82 (p < 0.001). This shows that the outdoor temperature and humidity had an influence on the indoor temperature and humidity. The relationship between indoor and outdoor temperature. The relationship between indoor and outdoor humidity.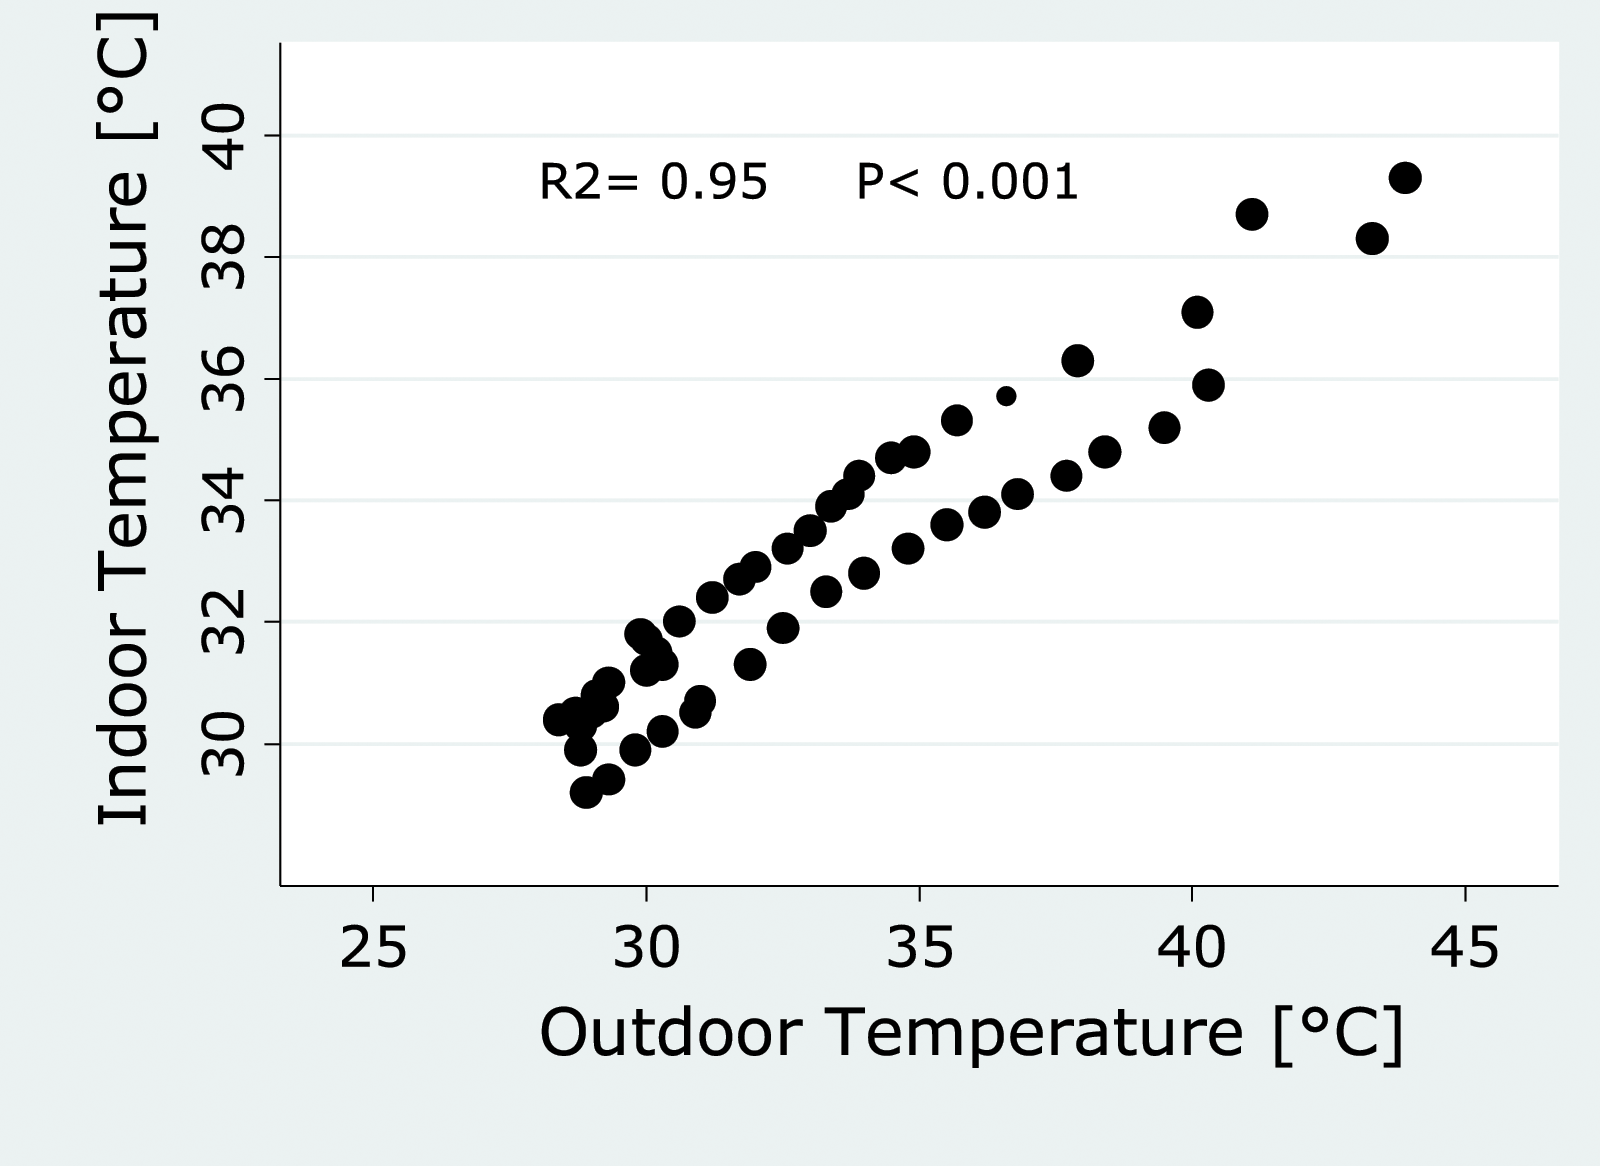
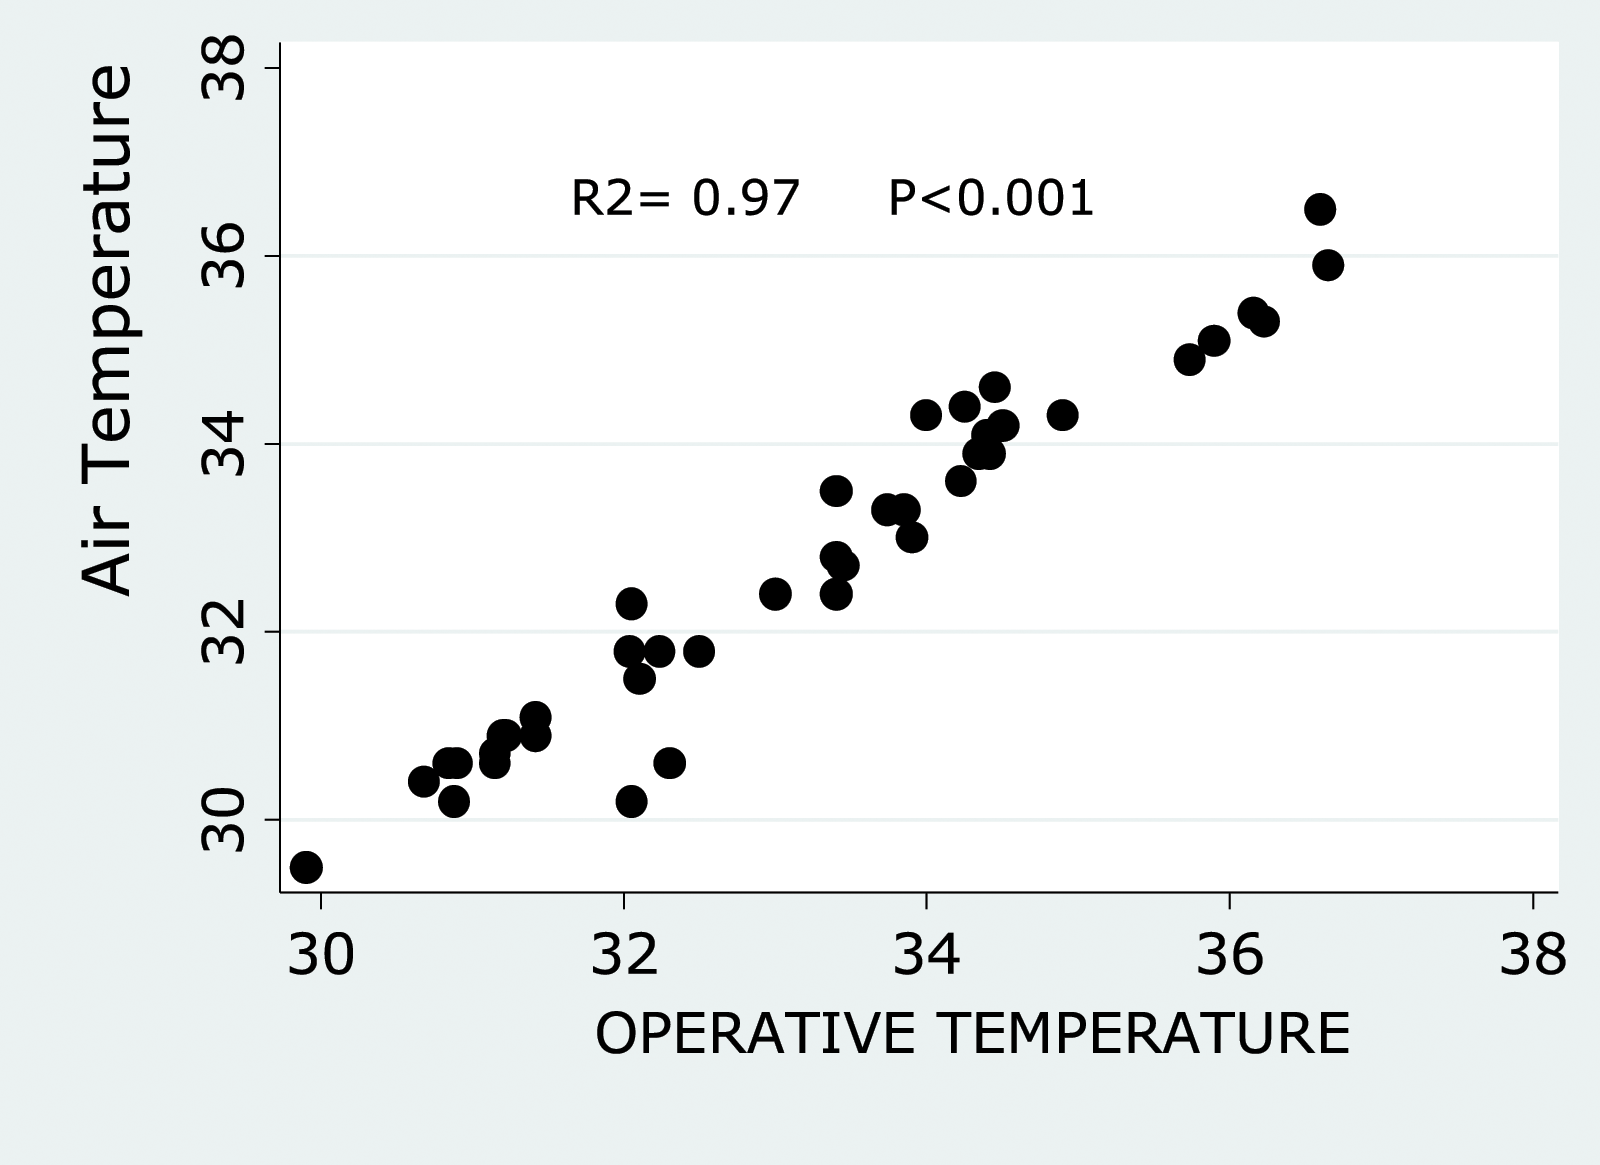
The correlation coefficients between indoor air and globe temperatures and between ambient air and operative temperatures were 0.95 and 0.97 (p <0.001), respectively (Figures 6 and 7). This strong correlation shows that there are no radiation sources.
51
This made creating a simple regression model that relates temperatures to thermal votes possible.
23
The correlation between the globe and air temperatures. The association between operative and air temperatures.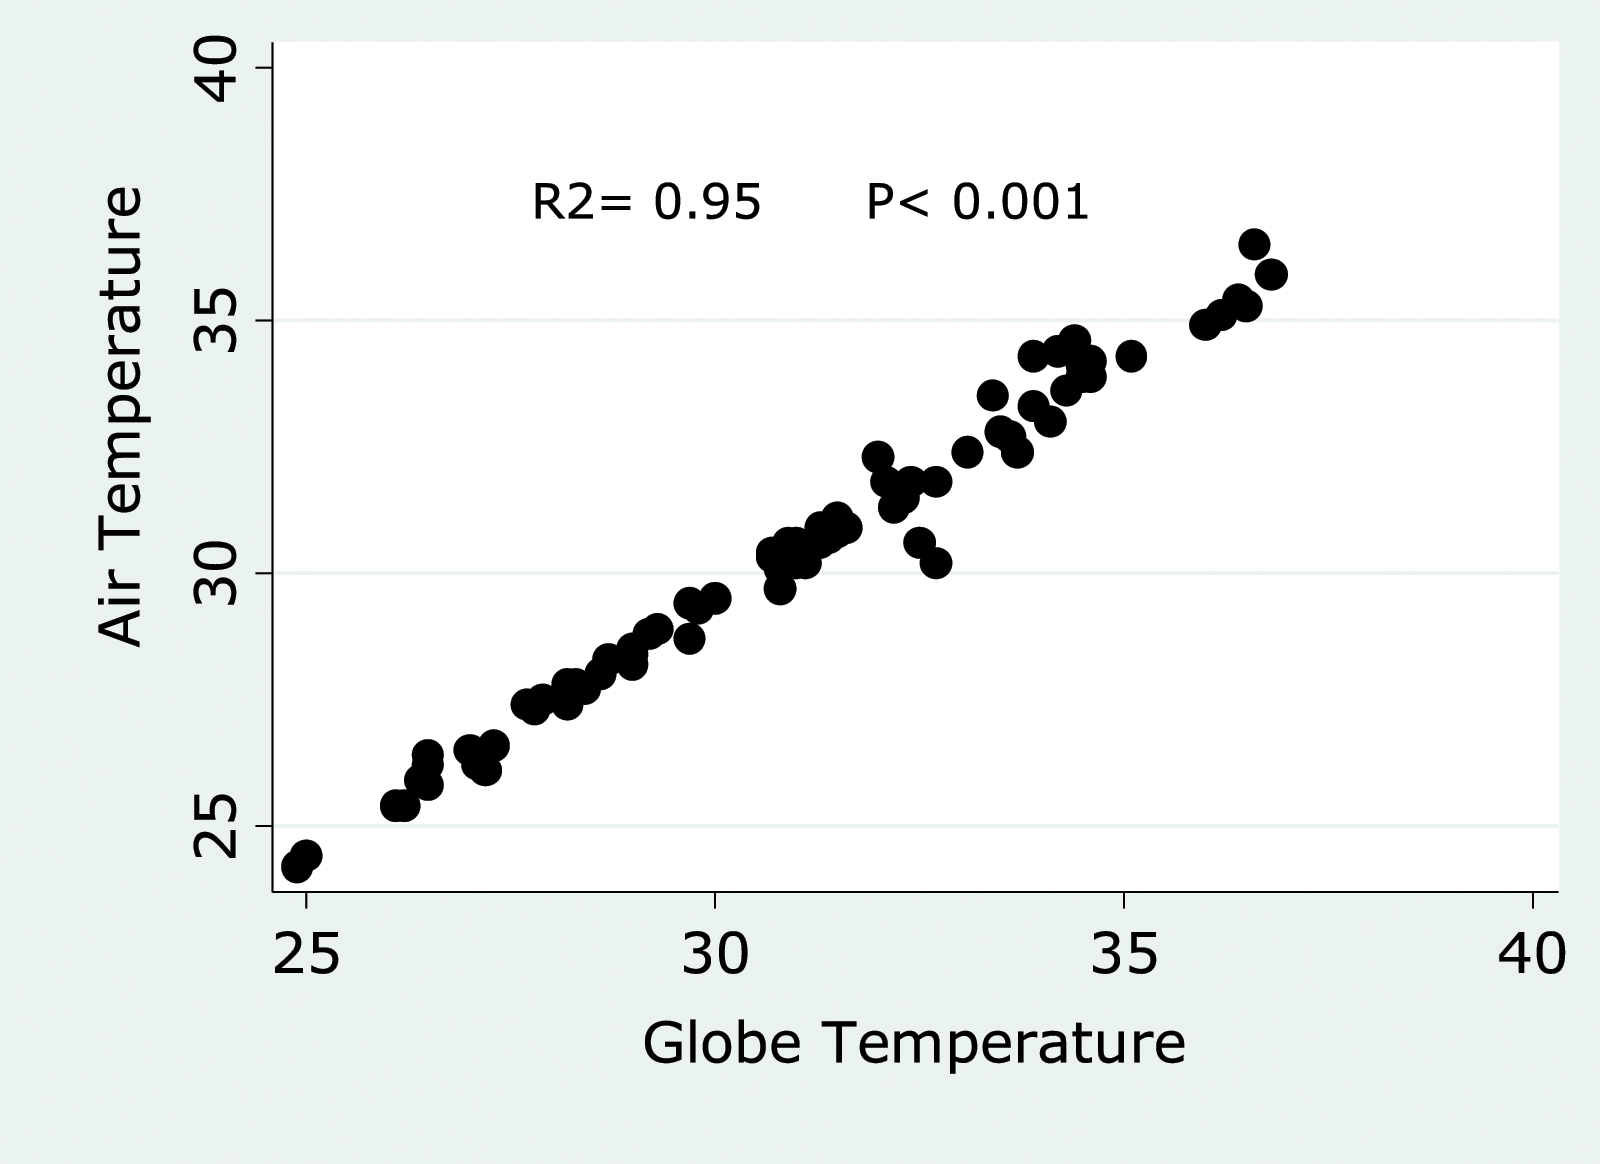
Students’ thermal perceptions
Thermal sensation. The ASHRAE thermal sensation scale is the conventional scale used to indicate the subject total thermal condition. Although it cannot tell how satisfied the subjects are with that state, the relationship is implicitly inferred. The traditional assumptions have been i. that ‘neutral’ thermal sensation denotes the ideal circumstances and ii. comfort or acceptability represents the three main categories of the thermal sensation scale (slightly cool, neutral and slightly warm). This presumption implies that thermal sensations outside these three primary categories represent a state of dissatisfaction.
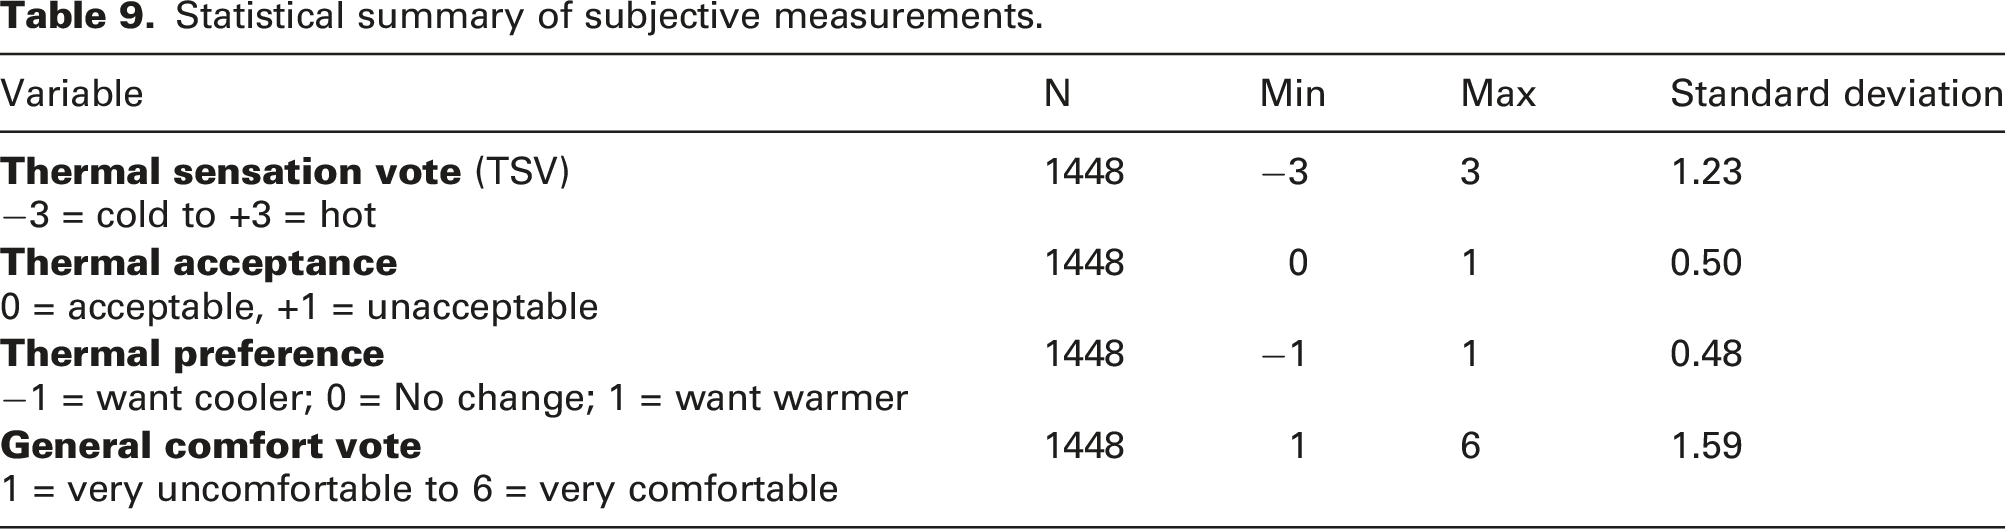
Statistical summary of subjective measurements.
Thermal sensation vote.
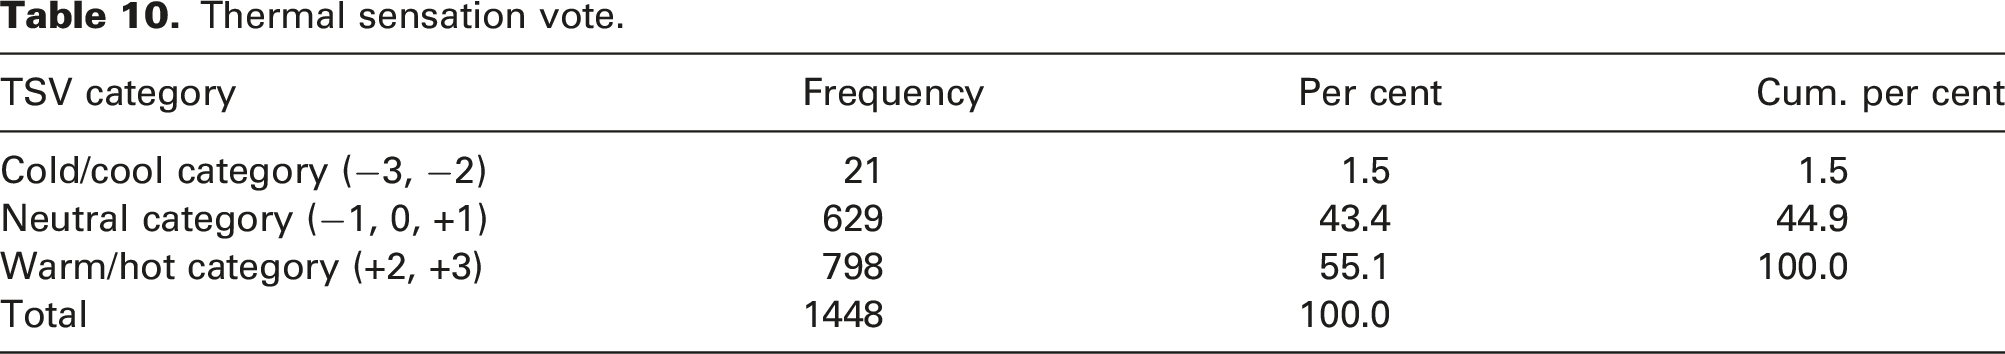
This result is similar to Adaji, Watkins and Adler 52 in their study on post-occupancy assessment of residential buildings in Abuja, where they found that less than 50% of residents voted within the central three categories on the thermal sensation scale. Although the building type differs from the present study, the geographical location is the same.
Thermal acceptability. There are several methods of determining if the thermal value of a setting complies with the 80% thermal acceptability benchmark of ASHRAE Standard-55. Kwok
53
suggests the following approaches to assess compliance with the 80% satisfaction criterion of ASHRAE Standard-55: i. The scale complies if at least 80% of the votes fall into one of the ‘three central categories on the thermal sensation scale (slightly cool, neutral or slightly warm)’. ii. Ask directly when surveying the building’s occupants: ‘Do you find this environment thermally acceptable?’ Evaluate whether at least 80% of respondents answered ‘yes’. iii. Use other scales as indirect measures (e.g. preference and general comfort). Identify whether at least 80% of votes meet the criteria for each definition of acceptance.
The conventional approach is an indirect measure that equates satisfaction (or acceptability) with the ‘three central categories of the seven-point thermal sensation scale’, indicated by the neutral category (−1, 0, +1) (Table 9). With this method, only 43.4% of respondents are comfortable with their thermal environment.
The second method asks the direct question: ‘Is the thermal condition in the classroom acceptable to you right now?’ Using this method, 44.0% of respondents (Figure 8) found conditions satisfactory, falling short of the 80% acceptance requirement stipulated by ASHRAE Standard-55. Students’ thermal acceptance votes.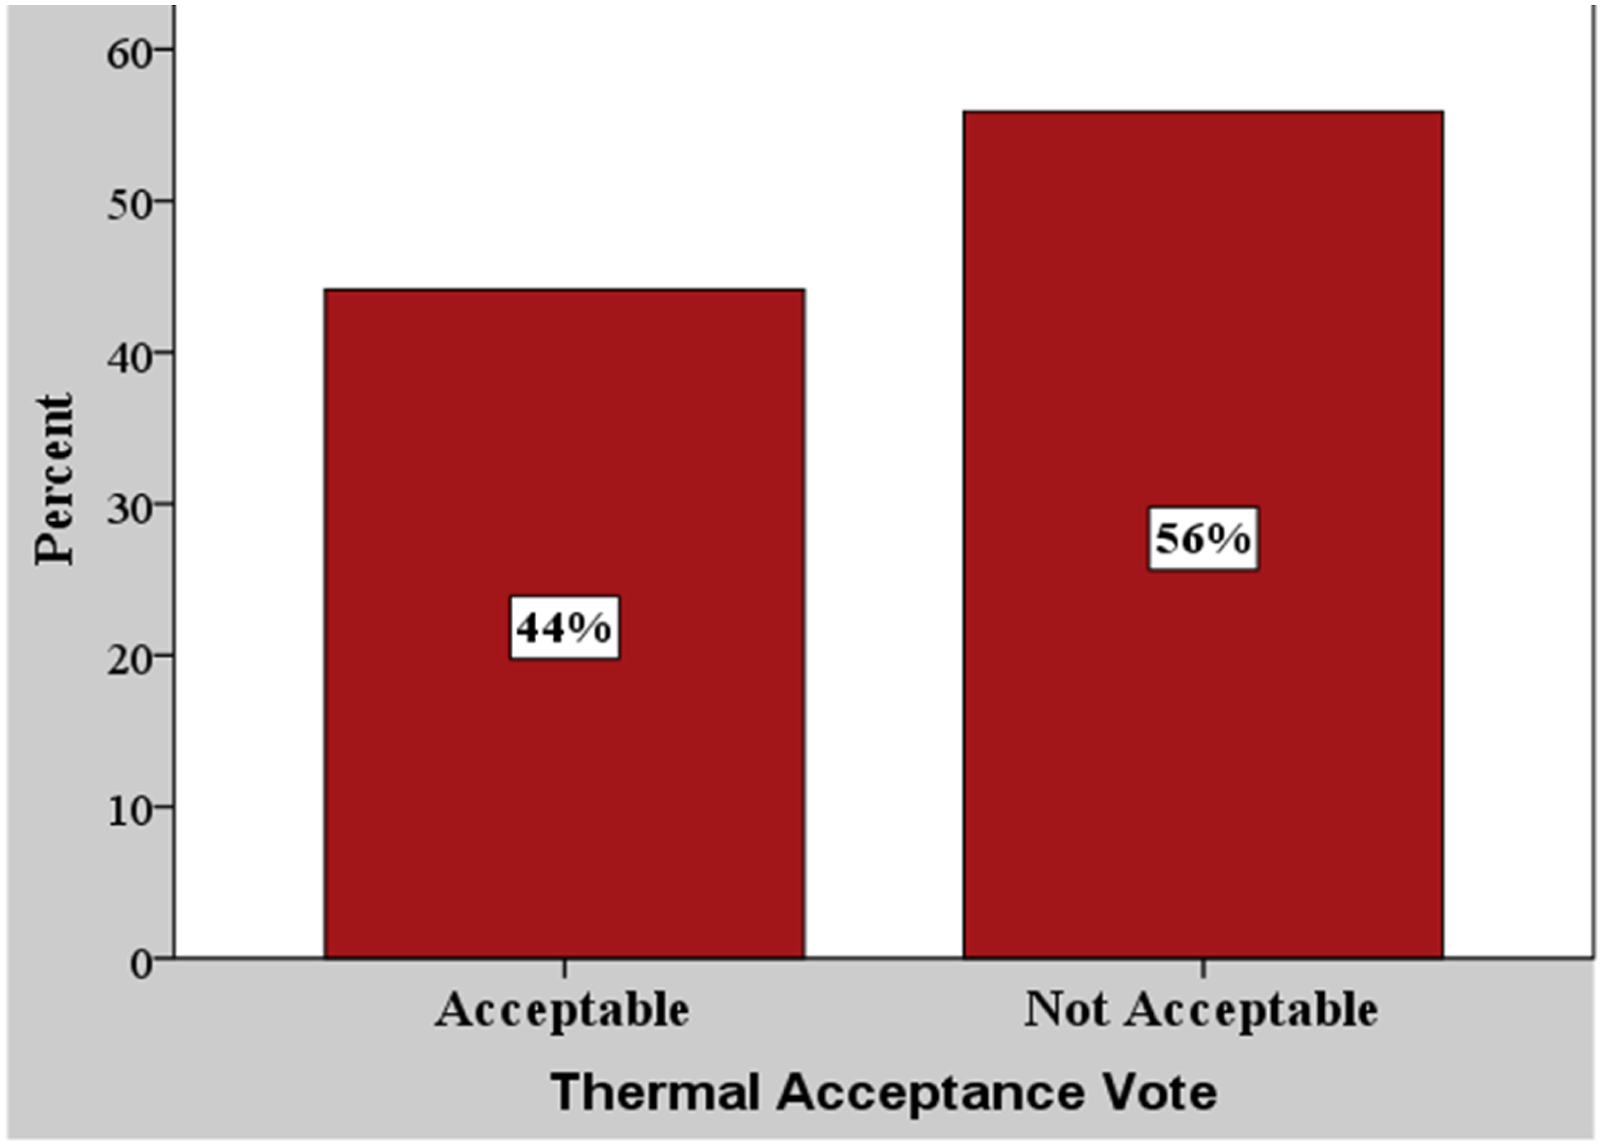
In the third approach, votes of ‘no change’ on the preference scale (12%) in Figure 9 represent an assumption of acceptability. This method is, however, farther away from the ASHRAE Standard-55’s 80% acceptability benchmark. It should be noted that the question pushes the response into a specific category and highlights the distinction between a stricter measure of ideal (preferred) settings and a more comprehensive acceptable range. For example, most people wanted to feel cooler but did not mind that it was warm around them. Students’ thermal preference votes.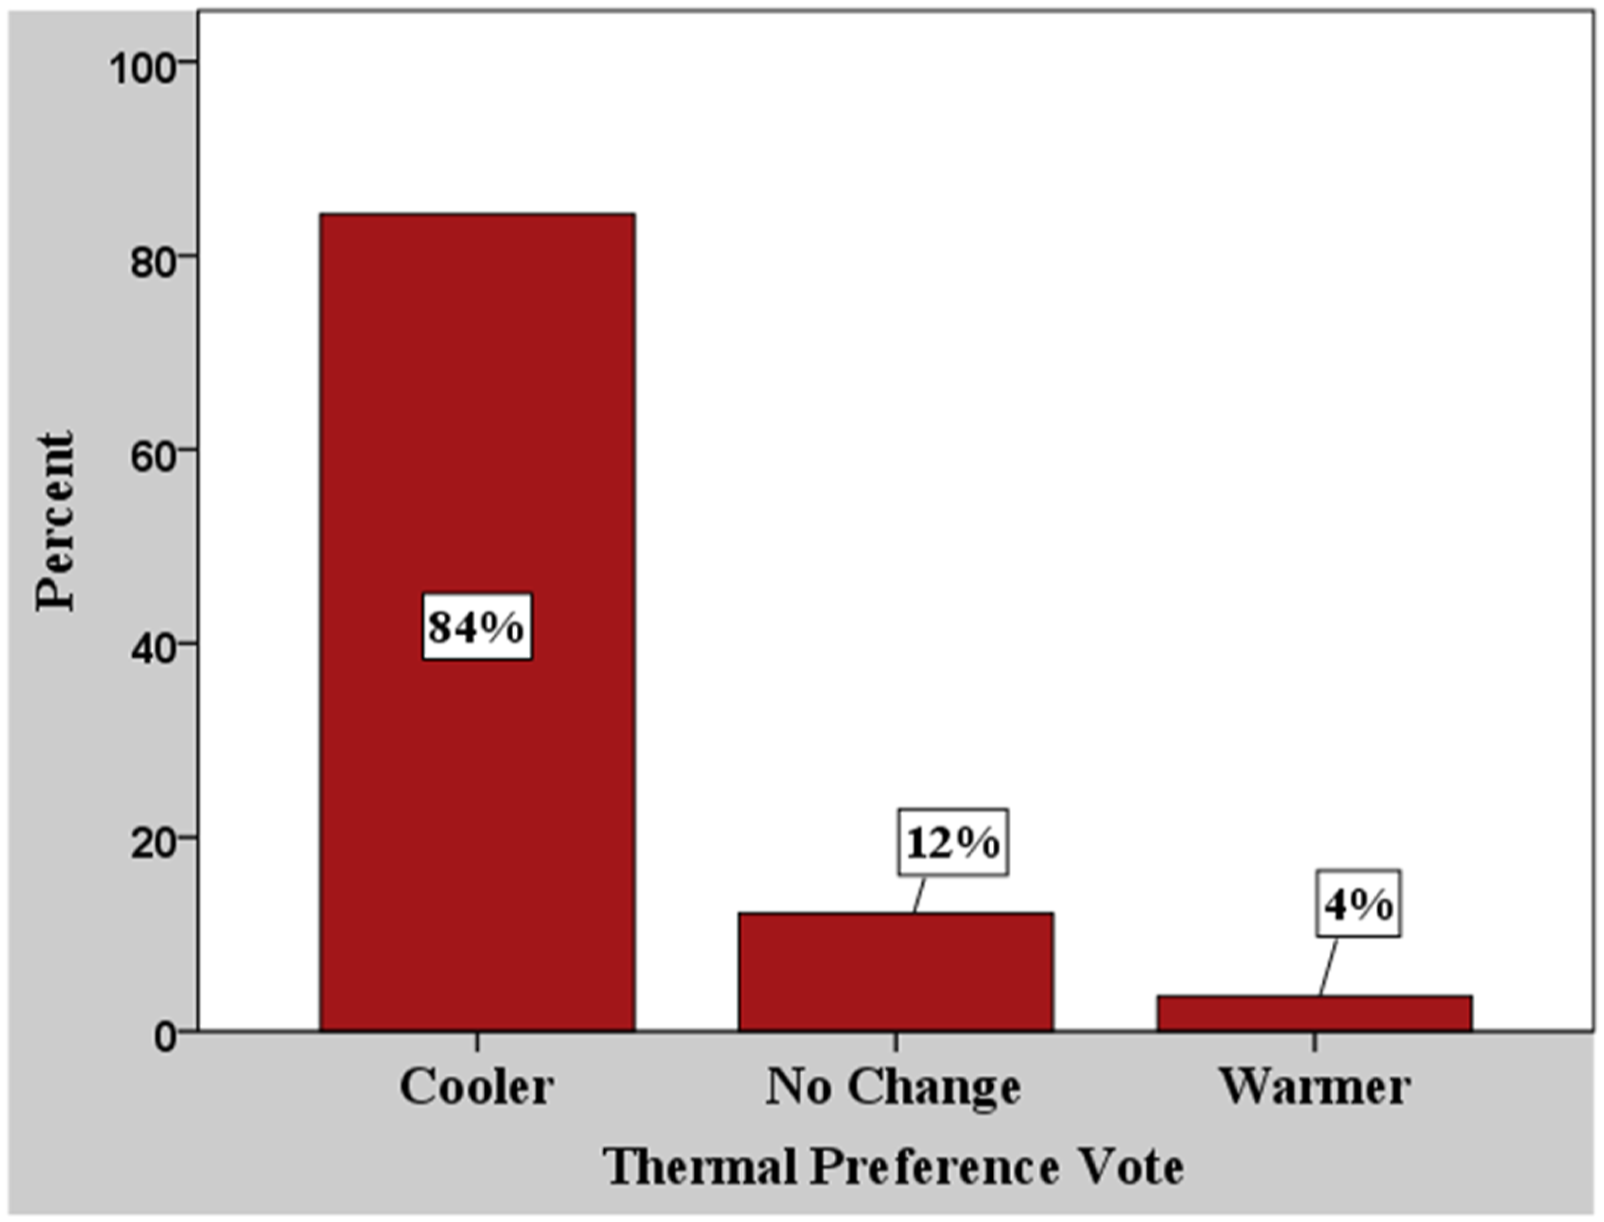
The three methods of the thermal acceptance measurement procedure (Direct, Indirect and preference) yielded different acceptability values. The Direct and Indirect approaches yielded similar results, 44.0% and 43.4%, respectively, while the third method (preference) produced a very low level of acceptability of 12%. All methods, however, do not meet the 80% acceptability criterion of ASHRAE Standard-55. Thermal comfort is, therefore, not attained in the classrooms.
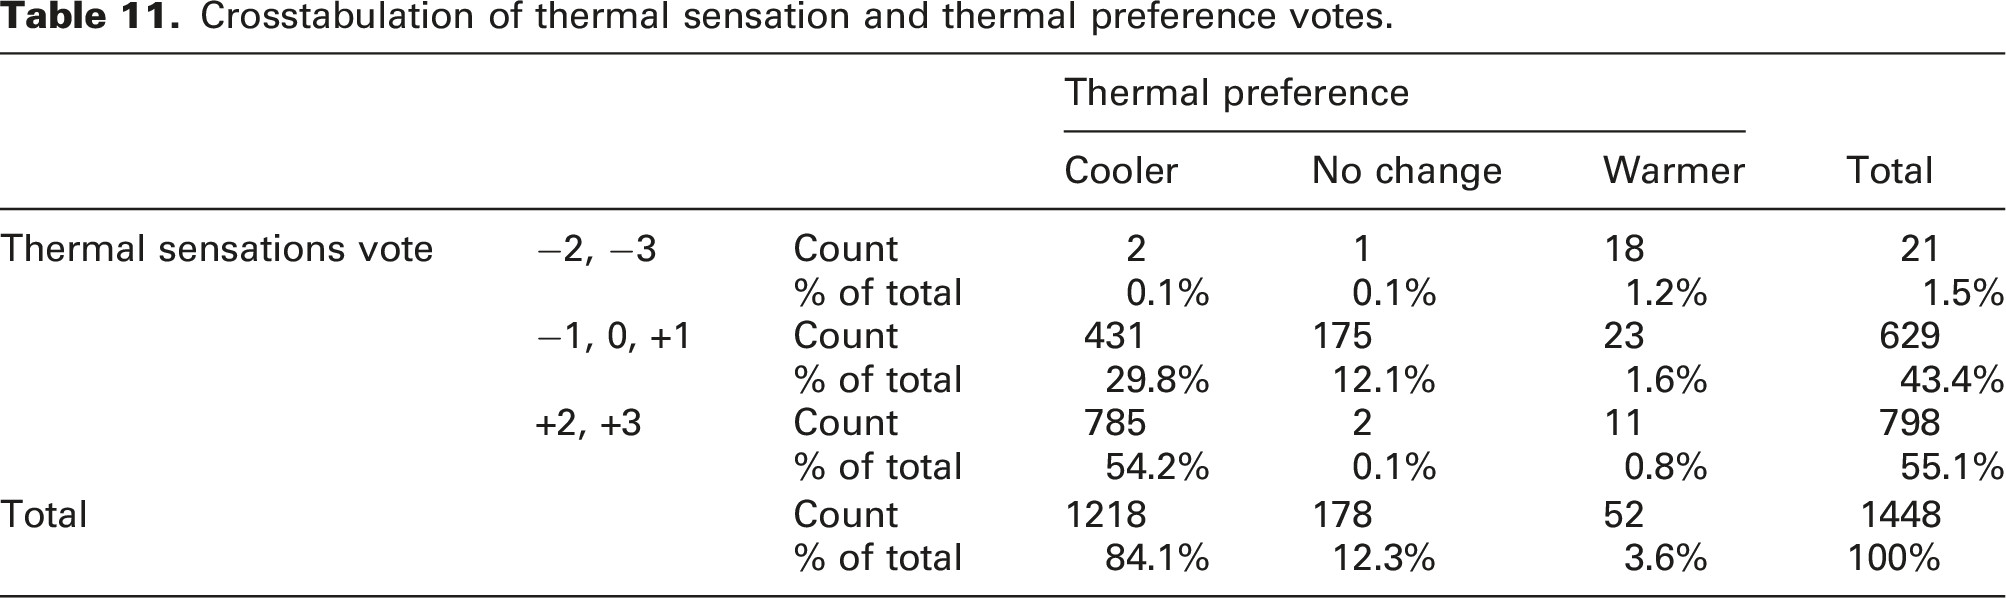
Crosstabulation of thermal sensation and thermal preference votes.
Vote on general comfort. The general comfort assessment was conducted using a 6-point subjective comfort scale to differentiate it from the ASHRAE thermal sensation scale: ‘1 (very uncomfortable), 2 (moderately uncomfortable), 3 (slightly uncomfortable), 4 (slightly comfortable), 5 (moderately comfortable) and 6 (very comfortable)’. With the traditional method of associating thermal acceptability with thermal sensation, it is acceptable to be ‘slightly warm’ or ‘slightly cool’. Slightly uncomfortable is, by this ruling, included in the acceptable zone. On this premise, the vote in the comfort categories includes ‘3 (slightly uncomfortable), 4 (slightly comfortable), 5 (moderately comfortable) and 6 (very comfortable)’. According to the results of the thermal comfort votes in Figure 10, 68.1% of the students chose the comfort options. The vote on general comfort (68.1%) was better than the results of the three main categories of the ASHRAE scale (43.4%), but it still did not meet the ASHRAE Standard-55’s 80% requirements. Students’ general comfort votes.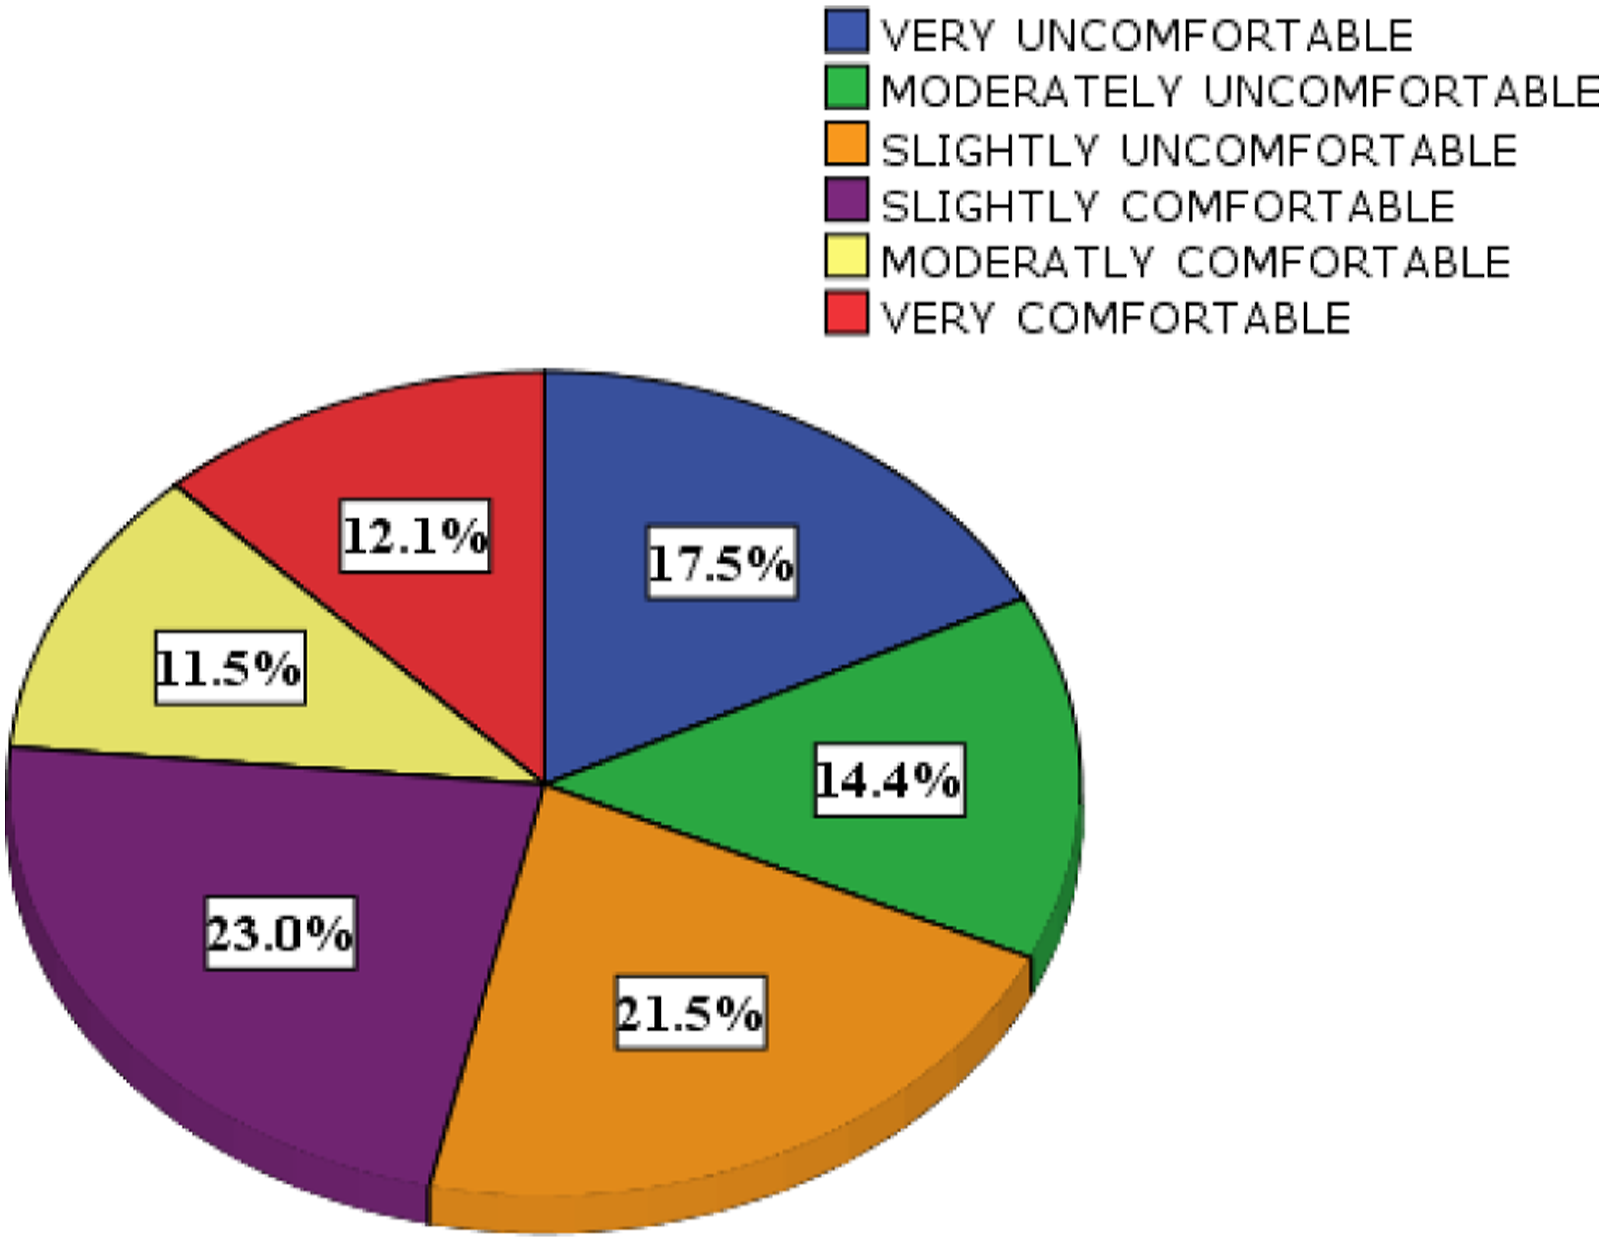
Thermal comfort temperature
Neutral temperature. The temperature people selected as ‘neutral’ on the scale of ASHRAE is known as neutral temperature (Tn). The widely used technique for determining the respondents’ neutral or comfort temperature is linear regression analysis.
11
Regressing the operating temperature against the thermal sensation vote, as shown in Figure 11, yields the regression of equation (3): The regression of the mean thermal sensation vote (mTSV) and the operative temperature (°C).
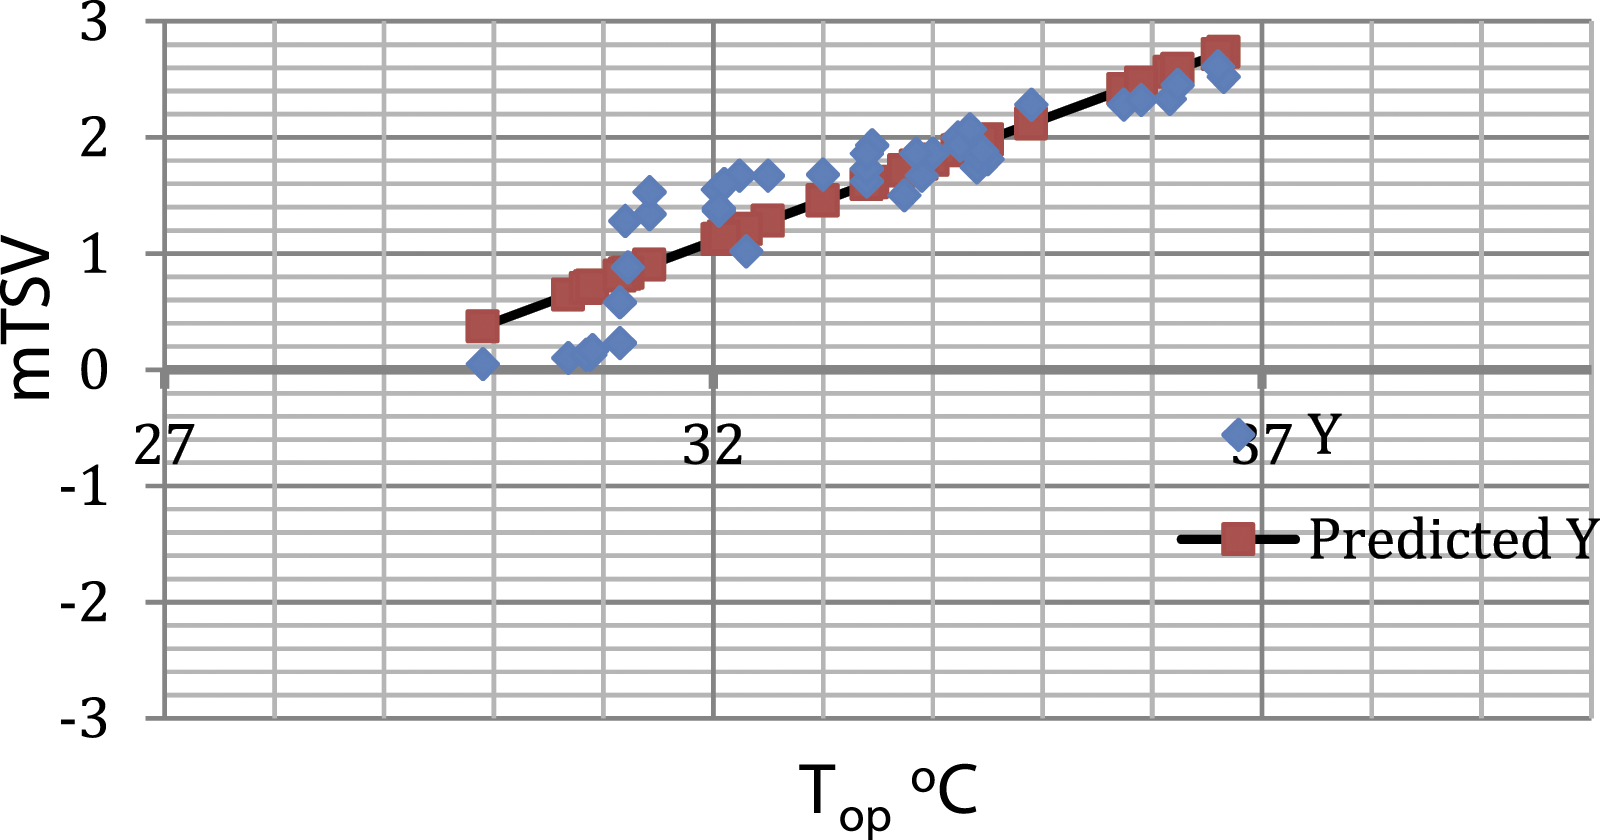
Based on the equation, substituting the value of zero with mTSV results in 28.8°C as the neutral temperature for the study.
Comfort temperature range. The range of indoor temperatures acceptable for a particular percentage of people from a given sample is known as the thermal acceptability limits of the sample. The linear regression model can be used to find these boundaries centred around the neutral temperature. The ASHRAE model was used to establish the thermal comfort range in this study. This model establishes an 80% comfortable zone, or
Discussion
For this study, the neutral temperature is not ideal, as 68.5% of subjects who felt near neutral (Table 11) preferred it to be cooler. The findings suggest that most students in Abuja wish to feel cooler than neutral; thus, neutrality-based standards may not be adequate. This discovery implied that votes on the thermal sensation and preference scales were inconsistent. This result is not surprising as previous research has also shown a similar trend.55,56,57,58,59 Humphreys and Hancock 60 best expressed this trend: ‘People prefer sensations on the warm side of neutral if it is cool outdoors and warm indoors, while they prefer sensations cooler than neutral if it is warm outdoors and cool indoors’.
The neutral temperature was recorded as 28.8°C, and the comfort temperature ranged from 26.5°C to 31.1°C in the analyzed classes. With a variation of 2.86°C (0.35 slope) in the operative temperature within classrooms, the thermal states of students would change by one unit. This is a sign of effective classroom adaptation and reflects the potential for energy savings. Suppose more passive thermal comfort elements can be incorporated into the design of classrooms in the study area. In that case, the use of air conditioning may be avoided.
The neutral temperature of the current study (28.8°C) is the same as that of Wong and Khoo 55 and Munonye and Ji 7 for tropical classrooms in Singapore and Nigeria, respectively. It is also similar to the 29.0°C found by Hamzah et al. 26 and Mishra and Ramgopal 47 for classrooms in Makassar-Indonesia and India, respectively. On the other hand, Nematchoua, Tchinda and Orosa 54 found a lower neutral temperature for naturally ventilated classrooms and buildings in the wet tropical zones of Cameroon, with 25.0°C in Douala and 24.7°C in Yaoundé. The reason might be related to the two cities’ low average temperatures compared to this study.
Embracing the ASHRAE comfort range from ±0.80, this research’s allowable indoor temperature range of 26.5 to 31.1°C was within the limits of 22.1°C and 31.5°C suggested by Mishra and Ramgopal 47 for classroom TC in tropical regions. It is also similar to 26.8–31.0°C found for naturally ventilated classrooms in the tropical savanna climate of Abuja, Nigeria. 61 The comfort range for the classrooms is also comparable to Hussein, Rahman and Maria 62 studies in Malaysia, where the permitted comfort temperature range for Malaysian naturally ventilated classrooms was 26°C to 30.7°C. It also confirms the acceptable indoor temperature for ‘combined-enclosed plan’ classrooms, which Munonye and Ji 7 found to be between 25.8°C and 30.5°C for naturally ventilated primary schools in Nigeria’s warm and humid Imo state. However, it differs from the neutral temperature range of 24.5–28.9°C suggested by Zomorodian, Tahsildoost and Hafezi 14 as achievable in tropical/mega thermal climates. Although the upper limit of the comfort range in the study classes was 2.2 K higher, the lower limit is still within the range.
Furthermore, clothing modifications, one of the few adaptive strategies available to students, took place accordingly in the season but, more crucially, during the day’s progression.
Conclusion
This study aimed to examine how students perceive their level of thermal comfort and the applicability of ASHRAE Standard-55 in naturally ventilated secondary schools in hot and dry tropical climates. A questionnaire survey and an experimental study were conducted to achieve this goal. Results confirmed that the subjective feelings of human TC in an indoor environment could be evaluated significantly by utilizing the appropriate experimental equipment.
The study’s findings revealed that the thermal setting inside Abuja classrooms did not align with the ASHRAE Standard-55 requirements. However, 44% of students felt comfortable in settings that did not meet ASHRAE Standard-55’s requirements. Based on students’ responses, the upper acceptable temperature of 31.1°C (which equals the mean thermal sensations +0.80) is 3.1 K higher than the ASHRAE 80% acceptability limit. As the ASHRAE Adaptive model predicted, this suggests that sampled students feel comfortable at higher temperatures. Given the time and effort invested in establishing comfort zone conditions in our buildings, the fact that residents were satisfied with conditions beyond those specified by ASHRAE Standard-55 is not trivial. This gives schools a remarkable chance to reduce long-term energy expenditures if they are well-designed, free-running spaces.
The findings of this study broaden the literature on thermal comfort in classrooms to the tropical savannah environment of West Africa, which received little attention in the past. The findings would form the base for defining a comfort standard that would aid in developing comfortable and energy-efficient naturally ventilated classrooms in the climatic zone. Further studies on human thermal comfort are required in both conditioned and naturally ventilated classrooms to analyze the indoor environment of classrooms from an energy-saving and human-health perspective. Future research should also address the following study limitations: i. This study did not examine the respondents’ prior thermal experiences (especially contact with air conditioning) before they were interviewed. Future research should evaluate how these might affect subjective thermal assessments. ii. This investigation was conducted in March, the hottest month of the year. In the future, thermal comfort surveys should be conducted all year round with more participants to determine annual thermal comfort perceptions and comfort temperature ranges for the region.
Supplemental Material
Supplemental Material - Examining thermal comfort levels and ASHRAE Standard-55 applicability: A case study of free-running classrooms in Abuja, Nigeria
Supplemental Material for Examining thermal comfort levels and ASHRAE Standard-55 applicability: A case study of free-running classrooms in Abuja, Nigeria, by Tajudeen Dele Mustapha, Ahmad Sanusi Hassan, Fatemeh Khozaei, and Hilary Omatule Onubi in Indoor and Built Environment
Footnotes
Authors’ contribution
Tajudeen Dele Mustapha and Ahmad Sanusi Hassan contributed 45% and 30% to this manuscript’s preparation. The remaining 25% was contributed by Fatemeh Khozaei (15%) and Hilary Omatule Onubi (10%).
Declaration of conflicting interests
The author(s) declared no potential conflicts of interest with respect to the research, authorship, and/or publication of this article.
Funding
The author(s) received no financial support for the research, authorship, and/or publication of this article.
Supplemental Material
Supplemental material for this article is available online.
Note
References
Supplementary Material
Please find the following supplemental material available below.
For Open Access articles published under a Creative Commons License, all supplemental material carries the same license as the article it is associated with.
For non-Open Access articles published, all supplemental material carries a non-exclusive license, and permission requests for re-use of supplemental material or any part of supplemental material shall be sent directly to the copyright owner as specified in the copyright notice associated with the article.